

Abstract
Background
The complex network connections, information transmission and organization play key roles in brain cognition on sensory stimulation. Previous studies showed that several brain regions of somatosensory, motor, emotional, cognitive, etc. are linked to fabric‐evoked prickle. But the functional connectivity characteristics of the brain network involved in prickle perception is still unclear.
Materials and Methods
In the present study, resting state fMRI (functional magnetic resonance imaging) with functional connectivity analysis was adopted to build the initial brain functional network, and task fMRI with psychophysiological interaction analysis was employed to investigate modulation features of prickling task to functional connections in the brain network.
Results
The results showed that, in resting state, six groups or sub‐networks can be identified in the prickle network, and when the subjects performed the prickling task, functional connectivity strength between some seed regions (e.g., somatosensory regions and precuneus, emotional regions and the prefrontal cortex, etc.) in the network increased.
Conclusion
Combining resting‐state fMRI with task fMRI is a feasible and promising method to study functional connectivity characteristics of the brain network involved in prickle perception. It is inferred that the “itch” ingredient of prickle sensation was transmitted from somatosensory cortices to precuneus, and emotional attribute (e.g., pain) from somatosensory cortices to the prefrontal cortex and at last to emotional regions.
Keywords: brain networks, functional connectivity, hairy skin, prickling stimulation, psychophysiological interaction, single fiber
1. INTRODUCTION
Fabric‐evoked prickle is a kind of complex sensation which is caused by the mechanical stimulation of fiber ends from fabric surface against to human skin. 1 Many researchers studied the causes, 2 evaluation methods, 3 and elimination methods 4 of it. In recent years, in order to figure out the neural mechanism of prickle perception, advanced technologies of neurosciences were used to study brain responses to cutaneous prickling stimulation. 5 For example, EEG (electroencephalogram) and ERPs (event‐related potentials) techniques, because of high temporal resolution, were often used by researchers to study the contact comfort of fabric. 6 An EEG study 7 showed that the percentages of θ, α, and β rhythm can be used as indexes to evaluate prickle sensation of fabric. But it is regrettable that the spatial resolution of EEG technology is not high enough, 8 which leads to its limited application in the accurate localization of brain functional areas and brain network analysis.
The technology of MRI (magnetic resonance imaging) has been adopted by more and more researchers depending on its high spatial resolution and radiation‐free performance. Structural MRI is usually employed to examine the tissue structure of human body for lesions, such as dermopathy. 9 , 10 In 1992, Ogawa et al. 11 developed BOLD (blood oxygen level dependent) imaging method based on MRI, called functional MRI (fMRI), using which brain functional responses to sensory stimulation can be observed in various brain regions. Now fMRI has become one of the most widely used neuroimaging technology. 12 Previously, task fMRI was used to detect brain responses when subjects received prickling stimulation to their skin, 13 showing that brain regions involved in prickle perception are mainly the primary somatosensory cortex (S1), secondary somatosensory cortex (S2), motor cortex, precuneus, insular cortex (IC), anterior cingulate cortex (ACC), prefrontal cortex, and so on. However, studies have shown that the brain is a complex system with various networks, in which neural activities between various functional regions are not independent of each other, but there are specific connections, and the complex network connections, information transmission and organization play key roles in brain cognition on sensory stimulation. 14 , 15
Now in the present study, an experiment combining task fMRI and resting state fMRI was conducted to further investigate functional connections in the brain network involved in prickle perception of single fiber stimulation.
2. MATERIALS AND METHODS
2.1. Subjects
Ten healthy right‐handed male subjects, with the age range of 22–34 years (average age of 27.4 years), took part in the fMRI experiment. Before the experiment, all the subjects were trained simply about the scanning procedure and gave written informed. The study was conducted in accordance with the Declaration of Helsinki, and the ethics committee of Shanghai Ruijin Hospital approved this study.
2.2. Experimental procedures
The fMRI experiment was performed at Shanghai Ruijin Hospital on a GE 3.0T clinical whole body MRI scanner with a standard head coil. The experiment mainly includes three stages, namely 3D T1, Run 1, and Run 2, as shown in Figure 1. The subjects were asked to keep their bodies (especially their heads) still throughout all the three stages. At the stage of 3D T1, the three‐dimensional (3D) anatomical images (T1‐weighted images) of their brains were collected using the scanning sequence of dimension‐spoiled gradient recalled echo (T1WI). Then, at the stages of Run 1 and Run 2, BOLD (Blood Oxygen Level‐Dependent) signals of their brains were gathered using the single‐shot EPI (echo planar imaging) sequence to acquire the functional images.
FIGURE 1.

Procedures of the fMRI experiment.
In particular, Run 1 is a resting‐state fMRI stage lasting 180 s, in which, the subjects were asked to just close their eyes and keep awake, and Run 2 is a block‐design task fMRI stage (120 s) same as the previous study 13 , including three blocks, and every block contains two conditions, Control (20 s) and Prickle task (20 s). In the condition of control, the subjects were also asked to just close their eyes and keep awake, same as Run 1 stage. While in the condition of Prickle task, as shown in Figure 1, the specified skin sites of the subjects’ right volar forearm (hairy skin) were pricked by a single‐fiber stimulus, with the frequency of two times per second, and the subjects were required to concentrate on perceiving the stimulation.
2.3. Neuroimaging data processing
The acquired functional and anatomical data were processed using CONN 16 , 17 and SPM. 18 The data were firstly preprocessed including realignment, 19 , 20 slice timing correction, 21 outlier detection, direct segmentation and MNI‐space normalization, 22 , 23 , 24 and smoothing, of which, functional data were smoothed using spatial convolution with a Gaussian kernel of 4 mm full width half maximum (FWHM). Then, the functional data were denoised 25 , 26 including the regression of potential confounding effects characterized by white matter timeseries, CSF (Cerebrospinal Fluid) timeseries, motion parameters and their first order derivatives, 27 outlier scans, 28 session and task effects and their first order derivatives, and linear trends, followed by bandpass frequency filtering of the BOLD timeseries 29 between 0.008 and 0.09 Hz.
After that, 30 seed regions or ROIs (regions of interest) involved in prickle perception of single fiber stimulation 30 were selected from the Harvard‐Oxford cortical structural Atlas (http://fsl.fmrib.ox.ac.uk/fsl/fslwiki/Atlases). For the resting‐state condition (Run 1), ROI‐to‐ROI connectivity matrix was estimated characterizing the patterns of functional connectivity between the 30 ROIs, to form a brain functional network of prickle perception which could be called the prickle network. At last, for the prickle‐task condition (Run 2), generalized psychophysiological interaction (gPPI) analysis 31 , 32 was used to study the changes of functional connectivity among the 30 ROIs in the prickle network when the subjects performing the prickle perceiving task.
3. RESULTS AND DISCUSSION
3.1. Functional connectivity within the prickle network in resting state
Results were reported after group‐level analysis, which is based on Functional Network Connectivity (FNC) multivariate parametric statistics. 33 The group‐averaged ROI‐to‐ROI functional connectivity matrix (unthresholded) of the prickle network in resting state (Run 1) is shown in Figure 2, containing the selected 30 ROIs involved in prickle perception of single fiber stimulation. As shown in Figure 2, functional connectivity strength is represented by Fisher‐transformed bivariate correlation coefficients (Fisher Z scores) estimated separately for each pair of ROIs, characterizing the association between their BOLD signal timeseries.
FIGURE 2.
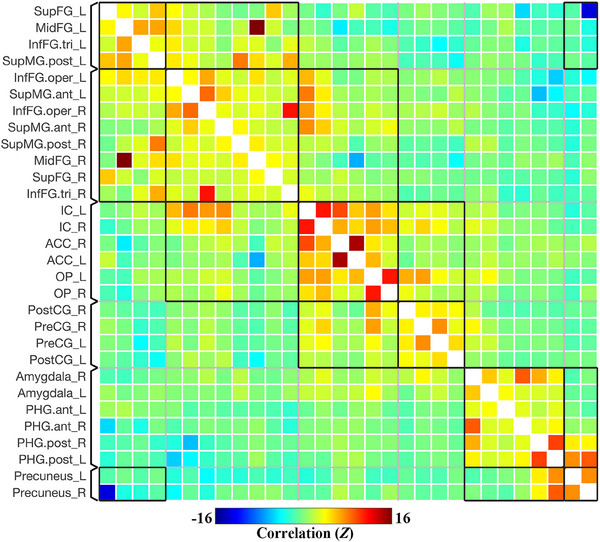
Group‐averaged functional connectivity matrix in resting state (unthresholded). SupFG_L: Superior Frontal Gyrus of the Left hemisphere; MidFG_R: Middle Frontal Gyrus of the Right hemisphere; InfFG.tri: Inferior Frontal Gyrus, pars triangularis; InfFG.oper: Inferior Frontal Gyrus, pars opercularis; SupMG.ant: Supramarginal Gyrus, anterior division; SupMG.post: Supramarginal Gyrus, posterior division; IC: Insular Cortex; ACC: Anterior Cingulate Cortex; OP: Parietal Operculum Cortex; PreCG: Precentral Gyrus; PostCG: Postcentral Gyrus; PHG.ant: Parahippocampal Gyrus, anterior division; PHG.post: Parahippocampal Gyrus, posterior division.
The results were thresholded using a combination of a p < 0.05 connection‐level threshold, and a familywise corrected p‐FDR < 0.05 cluster‐level threshold (MVPA omnibus test). 34 The connections (thresholded results of functional connectivity) among all 30 ROIs of the brain network in resting state is shown in Figure 3.
FIGURE 3.

Functional connectivity between the 30 ROIs of the brain network in resting state (connection‐level p < 0.05 threshold, and cluster‐level corrected p‐FDR < 0.05 threshold).
Overall, as shown in Figures 2 and 3, six groups or sub‐networks were identified in the prickle network, and there are more connections and higher connectivity strength within than between each pair of sub‐networks. Obviously, it can be explained by the process of FNC statistics in which the groups or sub‐networks were identified using a complete‐linkage hierarchical clustering procedure 35 based on ROI‐to‐ROI anatomical proximity and functional similarity metrics.
Specifically, ROIs in Group 3 are mainly distributed near the insula, including the bilateral insular cortex (IC), parietal operculum cortex (OP), and anterior cingulate cortex (ACC), mainly involved in high‐level somatic sensation 36 and modulation of emotional responses. 37 , 38 Group 4 is made up of the bilateral precentral gyrus (PreCG) and postcentral gyrus (PostCG), the primary regions of the motor system and somatosensory system. Group 5 contains the bilateral amygdala and parahippocampal gyrus (PHG), which are parts of the limbic and paralimbic system and play important roles in emotion processing. 39 , 40 Group 6 only contains the bilateral precuneus, a particular brain region which plays a role in itch sensations and their brain processing, 41 and is uniquely activated with itch and not pain. 42
In addition, the difference between Group 1 and Group 2 seems hard to discern, because, in one hand, both contains brain regions of the prefrontal cortex and supramarginal gyrus (SupMG), and in the other hand, there are more connections between them than any other pairs of groups. Therefore, the two groups can be combined in this study, named Group 1&2, mainly involved in cognitive functions. 43 , 44 , 45
3.2. Modulation of prickle task to connections within the prickle network
After group‐level analysis in which cluster‐level inferences were based on parametric statistics from Gaussian Random Field theory, 46 the gPPI results of Seed‐Based Connectivity (SBC) modulation during prickling task were thresholded using a combination of a cluster‐forming p < 0.001 voxel‐level threshold, and a familywise corrected p‐FDR < 0.05 cluster‐size threshold. 47 Distribution of the SBC modulated clusters is shown in Table 1 and displayed in MNI brain template in Figure 4. If one SBC modulated cluster is discovered through gPPI analysis, it means that functional connectivity between the selected seed ROI and the cluster is modulated by the prickling task.
TABLE 1.
Distribution of the seed‐based connectivity (SBC) modulated clusters.
| Seed ROIs | SBC modulated brain regions | MNI coordinates (x, y, z) | Cluster size |
|---|---|---|---|
| S1 (PostCG) | L, SupOC, Precuneus | −18, −76, 38 | 31 |
| R, PreFC, SupFG | 20, 20, 46 | 17 | |
| R, SupMG | 54, −46, 34 | 16 | |
| S2 (OP) | R, PreFC, FP | 26, 44, 18 | 15 |
| R, Precuneus | 12, −40, 46 | 13 | |
| R, MedOC, Cuneal | 16, −86, 18 | 13 | |
| R, InfOC | 50, −68, −16 | 13 | |
| IC | R, PreFC, SupFG | 0, 10, 68 | 22 |
| L, SupOC | −12, −70, 58 | 19 | |
| R, PreFC, MidFG | 34, 14, 32 | 14 | |
| R, PreFC, FP | 28, 38, 38 | 13 | |
| L, PreFC, SupFG | −28, 0, 62 | 12 | |
| ACC | R, PreFC, InfFG | 44, 16, 20 | 12 |
Abbreviations: FP, Frontal Pole; InfOC, Inferior Occipital Cortex; S1, Primary Somatosensory Cortex; S2, Secondary Somatosensory Cortex; PreFC, Prefrontal Cortex; SupOC, Superior Occipital Cortex; MedOL, Medial Occipital Lobe.
FIGURE 4.
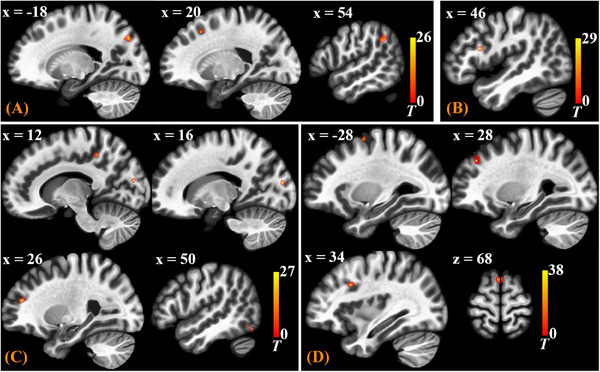
The SBC modulated clusters displayed in MNI brain template for the seed ROIs of (A) S1, (B) ACC, (C) S2, and (D) IC.
As shown in Table 1 and Figure 4, for the seed ROI of S1 (Primary Somatosensory Cortex, PostCG), there are three clusters discovered, mainly located in brain regions of the precuneus, prefrontal cortex (PreFC), and supramarginal gyrus (SupMG), meaning that when the subjects performed the task of perceiving the prickling stimulation from the single fiber against to their forearm skin, the functional connectivity strength between S1 and these brain regions increased. Notably, cluster with the largest size is in the precuneus. It is interesting that for the seed ROI of S2 (Secondary Somatosensory Cortex, OP), clusters were also discovered in the two regions, PreFC and precuneus, with the largest cluster in PreFC.
Prickle sensation evoked by mechanical irritation of fiber ends against to human skin is a combination of pain and itch, and is dominated by itch. 30 , 48 According to the previous analysis, as shown in Figure 3, at the resting state (Run 1), there was no connection survived after corrected between S1 (PostCG in Group 4) and precuneus (Group 6), and between S2 (OP in Group 3) and precuneus. It indicates that the precuneus plays an important role in perceiving prickle stimulation. Considering the special role of the precuneus in itch sensation, it can be boldly inferred that when the subjects performed the task of perceiving the prickling stimulation, the “itch” ingredient of prickle sensation was transmitted from S1 and S2 to precuneus.
Then for the situation of IC (Insular Cortex) and ACC (Anterior Cingulate Cortex) as seed ROIs, SBC modulated clusters were both mainly discovered in PreFC (Prefrontal Cortex), as shown in Table 1 and Figure 4. There were some connections between Group 3 and Group 1&2 at the resting state (Figure 3). Now the prickle task made the connections even stronger. Therefore, it can also be inferred that emotional attribute (e.g. pain) of the prickle sensation is transmitted from S1 and S2 to PreFC and at last to IC and ACC.
4. CONCLUSION
It is a feasible and promising method to study functional connectivity characteristics of the brain network involved in prickle perception by combining resting‐state fMRI with task fMRI. In resting state, six groups or sub‐networks can be identified in the prickle network. When the subjects performed the task of perceiving the prickling stimulation from the single fiber against to their forearm skin, functional connections between some seed regions (e.g., somatosensory regions and precuneus, emotional regions and the prefrontal cortex) in the network were modulated by the prickling task. It is inferred that the “itch” ingredient of prickle sensation was transmitted from somatosensory cortices to precuneus, and emotional attribute (e.g., pain) from somatosensory cortices to the prefrontal cortex and at last to emotional regions (e.g., insular cortex and anterior cingulate cortex). However, further studies and targeted experiments are needed to support the inference.
CONFLICT OF INTEREST STATEMENT
None of the authors have any potential financial conflict of interest related to this manuscript.
ETHICS STATEMENT
The study was conducted in accordance with the Declaration of Helsinki, and the ethics committee of Shanghai Ruijin Hospital approved this study. Before the experiment, all the subjects were trained simply about the scanning procedure and gave written informed.
ACKNOWLEDGMENTS
This research was funded by the Shandong Provincial Natural Science Foundation (grant number ZR2020QF115), Scientific Research Fund of Zhejiang Provincial Education Department (grant number Y202354012, 113129A4F21075, 22200112‐F), and Research Foundation of Zhejiang Sci‐Tech University (grant number 21202299‐Y).
Wang Q, Mei Y, Tao Y, et al. Functional connectivity characteristics of the brain network involved in prickle perception of single fiber stimulation. Skin Res Technol. 2024;30:e13626. 10.1111/srt.13626
Contributor Information
Qicai Wang, Email: qcwang@zstu.edu.cn.
Zhongwei Zhang, Email: zzw10610@163.com.
DATA AVAILABILITY STATEMENT
Research data are not shared.
REFFERENCES
- 1. Menguc GS, Ozdil N, Hes L. Prickle and handle properties of fabrics produced from specialty animal fibers. Text Res J. 2015;85(20):2155‐2167. [Google Scholar]
- 2. Garnsworthy RK, Gully RL, Kandiah RP, et al. Understanding the causes of prickle and itch from the skin contact of fabrics. Australas Text. 1988;8(4):26‐29. [Google Scholar]
- 3. Asad RAM, Yu W, Zheng Y‐H, He Y. Fabric‐evoked prickle of fabrics made from single fibres using axial fibre‐compression‐bending analyzer. Indian J Fibre Text Res. 2016;41(4):385‐393. [Google Scholar]
- 4. Zhang X, Yang J, Wang Y, et al. Study on the Ramie Fabric Treated with Copper Ammonia to Slenderize Fiber for Eliminating Prickle. J Nat Fibers. 2023;20(1):2120150. [Google Scholar]
- 5. Yuan J, Lou L, Wang Q. Research progress of brain perception technology for fabric tactile comfort. J Text Res. 2022;43(9):211‐217. [Google Scholar]
- 6. Yuan J, Zhai S, Lou L, et al. Research progress in fabric comfort based on event‐related potential technique. J Text Res. 2023;44(6):225‐231. [Google Scholar]
- 7. Zhao W. Study on Pilling Resistance and Prickle of Ultra‐fine Wool Knitted Scarves [Master Dissertation], Beijing Institute of Fashion Technology; 2018: 35–41. [Google Scholar]
- 8. Goldman RI, Stern JM, Engel J, Cohen MS. Acquiring simultaneous EEG and functional MRI. Clin Neurophysiol. 2000;111(11):1974‐1980. [DOI] [PubMed] [Google Scholar]
- 9. Zemtsov A, Dixon L. Magnetic resonance in dermatology. Arch Dermatol. 1993;129(2):215‐218. [PubMed] [Google Scholar]
- 10. Zemtsov A, Lorig R, Bergfield WF, et al. Magnetic resonance imaging of cutaneous melanocytic lesions. J Dermatol Surg Oncol. 1989;15(8):854‐858. [DOI] [PubMed] [Google Scholar]
- 11. Ogawa S, Tank DW, Menon R, et al. Intrinsic signal changes accompanying sensory stimulation: Functional brain mapping with magnetic resonance imaging. Proc Natl Acad Sci U S A. 1992;89(13):5951‐5955. [DOI] [PMC free article] [PubMed] [Google Scholar]
- 12. Hall PA, Burhan AM, MacKillop JC, Duarte D. Next‐generation cognitive assessment: combining functional brain imaging, system perturbations and novel equipment interfaces. Brain Res Bull. 2023;204:110797. [DOI] [PubMed] [Google Scholar]
- 13. Wang Q, Tao Y, Sun T, et al. Analysis of brain functional response to cutaneous prickling stimulation by single fiber. Skin Res Technol. 2021;27(4):494‐500. [DOI] [PubMed] [Google Scholar]
- 14. Luppi AI, Craig MM, Pappas I, et al. Consciousness‐specific dynamic interactions of brain integration and functional diversity. Nat Commun. 2019;10:4616. [DOI] [PMC free article] [PubMed] [Google Scholar]
- 15. Wang ZY, Xin JC, Wang ZQ, et al. Brain functional network modeling and analysis based on fMRI: a systematic review. Cogn Neurodyn. 2021;15(3):389‐403. [DOI] [PMC free article] [PubMed] [Google Scholar]
- 16. Whitfield‐Gabrieli S, Nieto‐Castanon A. Conn: a functional connectivity toolbox for correlated and anticorrelated brain networks. Brain Connect. 2012;2(3):125‐141. [DOI] [PubMed] [Google Scholar]
- 17. Nieto‐Castanon A. Handbook of Functional Connectivity Magnetic Resonance Imaging Methods in CONN. Hilbert Press; 2020: 26–40. [Google Scholar]
- 18. Friston KJ, Ashburner J, Kiebel SJ, et al., eds. Statistical Parametric Mapping: The Analysis of Functional Brain Images. Academic Press; 2007: 49–80. [Google Scholar]
- 19. Andersson JLR, Hutton C, Ashburner J, et al. Modeling geometric deformations in EPI time series. Neuroimage. 2001;13(5):903‐919. [DOI] [PubMed] [Google Scholar]
- 20. Friston KJ, Ashburner J, Frith CD, et al. Spatial registration and normalization of images. Hum Brain Mapp. 1995;3(3):165‐189. [Google Scholar]
- 21. Sladky R, Friston KJ, Tröstl J, et al. Slice‐timing effects and their correction in functional MRI. Neuroimage. 2011;58(2):588‐594. [DOI] [PMC free article] [PubMed] [Google Scholar]
- 22. Calhoun VD, Wager TD, Krishnan A, et al. The impact of T1 versus EPI spatial normalization templates for fMRI data analyses. Hum Brain Mapp. 2017;38(11):5331‐5342. [DOI] [PMC free article] [PubMed] [Google Scholar]
- 23. Ashburner J, Friston KJ. Unified segmentation. Neuroimage. 2005;26(3):839‐851. [DOI] [PubMed] [Google Scholar]
- 24. Ashburner J. A fast diffeomorphic image registration algorithm. Neuroimage. 2007;38(1):95‐113. [DOI] [PubMed] [Google Scholar]
- 25. Behzadi Y, Restom K, Liau J, Liu TT. A component based noise correction method (CompCor) for BOLD and perfusion based fMRI. Neuroimage. 2007;37(1):90‐101. [DOI] [PMC free article] [PubMed] [Google Scholar]
- 26. Chai XJ, Castañón AN, Öngür D, Whitfield‐Gabrieli S. Anticorrelations in resting state networks without global signal regression. Neuroimage. 2012;59(2):1420‐1428. [DOI] [PMC free article] [PubMed] [Google Scholar]
- 27. Friston KJ, Williams S, Howard R, et al. Movement‐Related effects in fMRI time‐series. Magn Reson Med. 1996;35(3):346‐355. [DOI] [PubMed] [Google Scholar]
- 28. Power JD, Mitra A, Laumann TO, et al. Methods to detect, characterize, and remove motion artifact in resting state fMRI. Neuroimage. 2014;84:320‐341. [DOI] [PMC free article] [PubMed] [Google Scholar]
- 29. Hallquist MN, Hwang K, Luna B. The nuisance of nuisance regression: Spectral misspecification in a common approach to resting‐state fMRI preprocessing reintroduces noise and obscures functional connectivity. Neuroimage. 2013;82:208‐225. [DOI] [PMC free article] [PubMed] [Google Scholar]
- 30. Wang Q, Tao Y, Sun T, et al. Comparison of brain functional response to mechanical prickling stimuli to the glabrous and hairy skin. Skin Res Technol. 2023;29(9):e13446. [DOI] [PMC free article] [PubMed] [Google Scholar]
- 31. Friston KJ, Buechel C, Fink GR, et al. Psychophysiological and modulatory interactions in neuroimaging. Neuroimage. 1997;6(3):218‐229. [DOI] [PubMed] [Google Scholar]
- 32. McLaren DG, Ries ML, Xu G, Johnson SC. A generalized form of context‐dependent psychophysiological interactions (gPPI): a comparison to standard approaches. Neuroimage. 2012;61(4):1277‐1286. [DOI] [PMC free article] [PubMed] [Google Scholar]
- 33. Jafri MJ, Pearlson GD, Stevens M, Calhoun VD. A method for functional network connectivity among spatially independent resting‐state components in schizophrenia. Neuroimage. 2008;39(4):1666‐1681. [DOI] [PMC free article] [PubMed] [Google Scholar]
- 34. Benjamini Y, Hochberg Y. Controlling the false discovery rate: a practical and powerful approach to multiple testing. J R Stat Soc Ser B Stat Methodol. 1995;57(1):289‐300. [Google Scholar]
- 35. Sørensen T. A method of establishing group of equal amplitude in plant sociobiology based on similarity of species content and its application to analyses of the vegetation on Danish commons. Biol Skr. 1948;5:1‐34. [Google Scholar]
- 36. Lamp G, Goodin P, Palmer S, et al. Activation of bilateral secondary somatosensory cortex with right hand touch stimulation: a meta‐analysis of functional neuroimaging studies. Front Neurol. 2019;9:1129. [DOI] [PMC free article] [PubMed] [Google Scholar]
- 37. Davidovic M, Starck G, Olausson H. Processing of affective and emotionally neutral tactile stimuli in the insular cortex. Dev Cogn Neurosci. 2019;35:94‐103. [DOI] [PMC free article] [PubMed] [Google Scholar]
- 38. Bush G, Luu P, Posner MI. Cognitive and emotional influences in anterior cingulate cortex. Trends Cogn Sci. 2000;4(6):215‐222. [DOI] [PubMed] [Google Scholar]
- 39. Almeida JRC, Mechelli A, Hassel S, et al. Abnormally increased effective connectivity between parahippocampal gyrus and ventromedial prefrontal regions during emotion labeling in bipolar disorder. Psychiatry Res Neuroimaging. 2009;174(3):195‐201. [DOI] [PMC free article] [PubMed] [Google Scholar]
- 40. Koelsch S, Fritz T, v Cramon DY, et al. Investigating emotion with music: an fMRI study. Hum Brain Mapp. 2006;27(3):239‐250. [DOI] [PMC free article] [PubMed] [Google Scholar]
- 41. Mochizuki H, Kakigi R. Itch and brain. J Dermatol. 2015;42(8):761‐767. [DOI] [PubMed] [Google Scholar]
- 42. Sutherland S. ITCH when pain feels good. New Sci. 2016;232(3101):37‐38. [Google Scholar]
- 43. Duffau H. Chapter 6 – cortical and subcortical brain mapping. In: Quiñones‐Hinojosa A, ed. Schmidek and Sweet Operative Neurosurgical Techniques (Sixth Edition). W.B. Saunders; 2012:80‐93. [Google Scholar]
- 44. Hoshi H, Kobayashi M, Hirata Y, et al. Decreased beta‐band activity in left supramarginal gyrus reflects cognitive decline: evidence from a large clinical dataset in patients with dementia. Hum Brain Mapp. 2023;44(17):6214‐6226. [DOI] [PMC free article] [PubMed] [Google Scholar]
- 45. Miller EK. The prefrontal cortex and cognitive control. Nat Rev Neurosci. 2000;1(1):59‐65. [DOI] [PubMed] [Google Scholar]
- 46. Worsley KJ, Marrett S, Neelin P, et al. A unified statistical approach for determining significant signals in images of cerebral activation. Hum Brain Mapp. 1996;4(1):58‐73. [DOI] [PubMed] [Google Scholar]
- 47. Chumbley J, Worsley K, Flandin G, Friston K. Topological FDR for neuroimaging. Neuroimage. 2010;49(4):3057‐3064. [DOI] [PMC free article] [PubMed] [Google Scholar]
- 48. Yu W, ed Textile Materials. 2nd ed. China Textile & Apparel Press; 2018: 358–361. [Google Scholar]
Associated Data
This section collects any data citations, data availability statements, or supplementary materials included in this article.
Data Availability Statement
Research data are not shared.