

Abstract
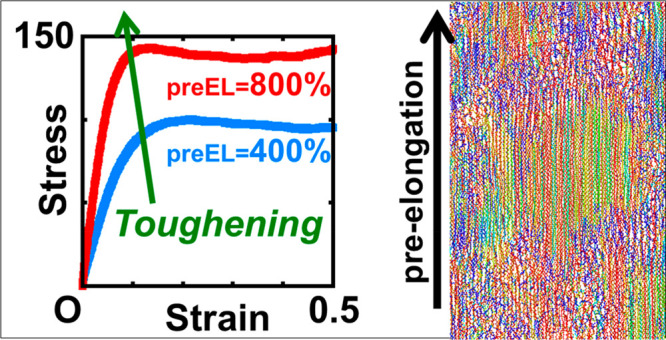
Herein, we propose a large-scale simulation approach to perform the stretch-induced crystallization of entangled polyethylene (PE) melts. Sufficiently long (1000 ns) united-atom molecular dynamics (UAMD) simulations for 16000 chains of 1000 consecutive CH2 united-atom particles under periodic boundary conditions were performed to achieve the crystallinity observed in experiments. Before the isothermal crystallization process, we applied uniaxial stretching as pre-elongation to the embedded strain memory on the entangled PE melts. We confirmed significant differences in the morphologies of crystal domains and scattering patterns for pre-elongation ratios of 400% and 800%. The obtained scattering patterns were consistent with the experimental results. Uniaxial stretching MD simulations revealed that the elastic modulus at 800% pre-elongation was stronger than that at 400% pre-elongation. From this observation, we can derive the structure–property relationship, wherein the magnitude of the pre-elongation governs the crystal domain structures and mechanical properties.
Understanding the molecular mechanisms of toughening, particularly the chain-level scenarios, in polymeric materials has been a long-standing challenge. Elucidating the principle of mechanical toughening will contribute toward addressing chemical recycling and precision synthesis. The process of crystallization has a significant effect on nanomechanics, which necessitates extensive investigations on the toughening of soft materials via stretch-induced crystallization (SIC) and flow-induced crystallization (FIC).1−6 Molecular mechanisms of these phenomena should be understood by using molecular dynamics (MD) simulations for future molecular design and synthesis. Recent advances in computational power have facilitated large-scale MD simulations of crystal formation in semicrystalline polymers.7−12 The insights13−17 gained from small-scale MD simulations are incorporated to reproduce plausible systems in large-scale MD simulations. Initially, the molecular modeling of polymer crystallization was considered a potential model for understanding protein folding. The application of large-scale MD simulations to reproduce systems at the 100 nm scale from the Ångstrom scale shares similarities with various fields of materials, including biomaterials.
Control of SIC and FIC has long been an important objective in polymer processing because of the general principle that processing conditions govern morphologies, consequently affecting physical properties.18−24 As reviewed by Keller–Kolnaar,1 the FIC of polymer melts is characterized by fibrillar crystals with alignment of fully stretched chains under strong flow and lamellar crystals under weak flow. It is expected that polyethylene (PE) melts containing ultra-high-molecular-weight PE (UHMWPE) chains form the well-known shish-kebab structure6 with a long central fiber core (shish) with a lamellar crystalline structure (kebab) along the shish. Regarding the crystallization mechanism, the fibrillar crystal is formed by the chain alignment, whereas the formation of the lamellar crystal via spontaneous chain folding and packing is more complicated. A theoretical understanding of spontaneous lamellar-crystal formation at the atomic level requires MD simulations involving a wide range of spatiotemporal scales. The latest cutting-edge computing resources allow large-scale simulations to proceed from unoriented melts to intentionally oriented melts, as in earlier works with small sizes.25,26
Gee et al.7 performed a model-free large-scale MD simulation of PE crystallization from melts using five million particles. The formation of unoriented crystal regions in the PE melt was attributed to nucleation via spinodal phase separation. Jabbari-Farouji et al.8 performed a coarse-grained MD simulation of unoriented crystals and analyzed the chain length dependence of the tensile response. They revealed the importance of tie chains and entanglements in long chains to reproduce experimental results. For investigating the toughness of semicrystalline PE materials, including the ones with the shish-kebab structure, even larger systems with longer chains (Mw > 100k) and longer simulation times are required in model-free large-scale MD simulations. Nevertheless, these simulations represent a promising and powerful tool that can help reproduce the shish-kebab structure with UHMWPE. MD simulations must resolve the following phenomena that are expected to occur within the melt of entangled PE chains with a uniform molecular weight:
-
(i)
Effect of pre-elongation (strain memory) of PE chains on crystallization morphology.
-
(ii)
Structure–property relationship in which stretch-influenced morphology correlates with the physical properties of the polymer.
-
(iii)
The contribution of atomic stress to macroscopic stress, which can be evaluated through atomic-level analysis.
Prior to the MD simulations, our experiments18 confirmed the crystalline morphological changes and that the elastic moduli of crystalline solids changed systematically by crystallization of uniaxially pre-elongated PE melts with different pre-elongation ratios. When the pre-elongation ratio exceeded a few hundred percent, the elastic modulus increased with an increase in the pre-elongation ratio. To reproduce these qualitative results with reasonable computing costs, we investigated the crystallization behaviors of PE melts with pre-elongation ratios of 400% and 800%, which were larger than those in our experiments.18
This study demonstrates the pre-elongation effect of PE chains on crystallization based on large-scale MD simulations at the 100 nm scale that can be compared to experimentally observed scattering patterns for crystalline domain structures grown after the pre-elongation. United-atom (UA) MD simulations were conducted on PE melts of 16000 chains with uniform molecular weight (1000 CH2 UA particles per chain) such that the system size after pre-elongation was 600 Å × 600 Å × 1200 Å under the periodic boundary conditions. Notably, Sefiddashti et al.27 recently performed UAMD simulations of approximately 1000 chains of the same chain size under a strong flow at 450 K to confirm a slowdown of melting of chain alignment when the end-to-end distance of a stretched chain exceeds 90% of that of the fully stretched chain (1290 Å). The TraPPE-UA force field28 was employed using the MD simulation packages LAMMPS29,30 and GROMACS.31,32 To achieve crystallinity 0.4, which is close to the experimental results, an isothermal crystallization process was simulated with a crystallization time tIC = 1000 ns at TIC = 340 K for the polymers with pre-elongation ratios preEL = 400% and 800%. Time (tIC) dependences of the crystallinity are shown in Figure S1. Figure 1a reveals that the crystallinity increased with increasing preEL. For comparison, simulations with tIC = 2000 ns were performed. The crystallinity increased with increasing tIC. Because of the slow growth from 1000 to 2000 ns, we considered that the primary crystallization was essentially complete. Here, a single simulation run for 1000 ns was completed in a week using GROMACS with parallel computing using 64 GPUs (NVIDIA A100).
Figure 1.
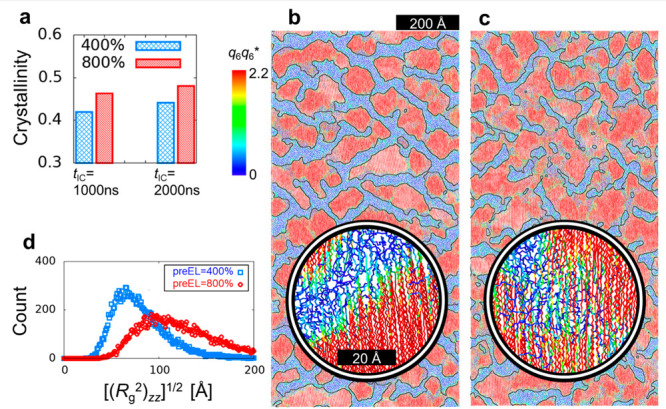
Sliced snapshots and crystallinity of the crystallized PE chains. (a) Crystallinities for preEL = 400% and 800% and tIC = 1000 and 2000 ns. (b) Snapshot for preEL = 400% and tIC = 1000 ns. (c) Snapshot for preEL = 800% and tIC = 1000 ns. (d) Count of square root of the zz-component of the radius of gyration (Rg2) of each PE chain for preEL = 400% and 800% and tIC = 1000 ns. In (b) and (c), the ith particle is color-coded according to the value of q6q6*(i), which is the local order parameter introduced by Zhang and Larson14 based on the local bond order analysis in hard-sphere colloids by Auer and Frenkel.33 The thin black lines are a guide to the eye for the boundaries (q6q6* = 2.2) generated by image processing. The box dimensions are approximately 600 × 1200 Å. The thickness of the sliced snapshot is 30 Å. The snapshots were created using the OVITO software.34
Figure 1b,c shows snapshots at tIC = 1000 ns for PE chains with preEL = 400% and 800%. Each UA particle is colored according to the corresponding local order parameter (q6q6*).14,33 The snapshot also exhibited a difference in crystal domain structures (size and morphology) between 400% and 800%. The insets of Figure 1b,c illustrate the presence of bundled chains that were partially crystallized and connected different domain layers with preEL = 800%. Figure 1d shows the count of the square root of the zz-component of the radius of gyration (Rg2) of each PE chain for preEL = 400% and 800%. We found that the chain was stretched more at 800% than at 400%.
For comparison, snapshots at tIC = 2000 ns are shown in Figure S2. No significant differences were found between the structures at 1000 and 2000 ns. This was confirmed by the probability distribution of q6q6*, as shown in Figure S3. Hereafter, we mainly considered the cases with tIC = 1000 ns.
To characterize the difference in crystal domain structures between preEL = 400% and 800% at tIC = 1000 ns, we computed the two-dimensional patterns35 corresponding to wide- and small-angle X-ray scattering (WAXS and SAXS, respectively) experiments, as shown in Figure 2. The higher orientation order of chains for larger preEL was confirmed by the fact that the peak height and fwhm of the spot in the WAXS pattern for preEL = 800% were larger and smaller than those for preEL = 400%, respectively. Significant differences were observed in the SAXS patterns. The difference in the pattern shapes indicates that the order of the layer-like structure for preEL = 400% is slightly stronger than that for preEL = 800%. This is also supported by the spatial correlation maps in Figure S7. Furthermore, topological data analysis based on Betti numbers36,37 (Table S1) supports finer mesh (more fragmented structure) for preEL = 800% than for preEL = 400%. Notably, a wide range of confirmations, including the preseeding of crystal nuclei, should be essentially conducted in the future. At least within the time range that can be tracked by MD simulations, we considered crystallization from the melt to proceed depending on the strengths of pre-elongation under the competition between the formation of layered structures and the growth of crystalline domains. Thus, the order of the layered structure, such as the domain width perpendicular to the pre-elongation direction, is expected to increase with weaker pre-elongation. This confirmation will be the subject of future research.
Figure 2.

Two-dimensional scattering patterns of WAXS and SAXS for the PE chains with (a) preEL = 400% and (b) 800% at TIC = 340 K. Pre-elongation is in the z-direction. Results for tIC = 2000 ns are shown in Figure S4. For WAXS spots, the peak height and fwhm in the qr- and qz-direction were (55, 0.074, 0.33) and (87, 0.074, 0.19) for preEL = 400% and 800%, respectively. The contour maps around the peak spots are given in Figures S5 and S6.
To demonstrate the structure–property relationship, we evaluated the corresponding stress–strain curves using LAMMPS29,30 on the Fugaku supercomputer. Figure 3 shows the stress–strain curves of the PE crystals under uniaxial stretching. Uniaxial stretching simulations were performed at T = 300 K and a stretching rate (dε/dt) of 0.01/ns. We found that preEL was a major factor in the difference in the elastic modulus and was more significant than that in crystallinity (tIC), although it is known that the crystallinity under the same crystallization process affects the stress–strain curve. Thus, we conclude that strain memory embedded by the pre-elongation can control the stress–strain behavior.
Figure 3.

Stress–strain curves of the PE crystals under uniaxial stretching for preEL = 400% and 800%. The stretching rate was dε/dt = 0.01/ns.
To investigate the local mechanical properties of the obtained PE crystals, the stress presentation of the force-transmitting chains was obtained by the time averaging of the virial stress tensors to eliminate their thermal fluctuations. The methodological verification of time averaging is provided in section E of the Supporting Information. Figure 4 shows snapshots that are colored according to the average of the stress (σzz) in the stretching (z) direction, principal stress (σ1), and von Mises stress (σvM) for preEL = 800% at ε = 10%, which is close to the yielding point. Notably, σvM was used as an indicator of yield under complicated mechanical deformations; σvM was defined using the principal stresses (σ1, σ2, and σ3): 2 σvM2 = (σ1 – σ2)2 + (σ2 – σ3)2 + (σ3 – σ1)2.
Figure 4.

Average of stress σzz in the z-direction, principal stress σ1, and von Mises stress σvM for the PE chains with preEL = 800% at ε = 10%. (a) σzz; (b) σ1; (c) σvM. To remove the thermal fluctuations, averaged values were obtained from 100000 snapshots every 50 fs (10 frames). The box dimensions are approximately 600 Å × 1200 Å. The thickness of the sliced snapshot is 30 Å. The snapshots were created using the OVITO software.34
The presentation of σzz at ε = 10% in Figure 4a confirms the existence of stress chains (red colored) that transmit force in the z-direction. We discovered that these stress chains are mainly located in the crystal domains. Clearly, the stress within the crystalline domains is not uniform and varies from chain to chain. Corresponding figures for ε = 0% are provided in Figure S11, which shows that the atomic stress was much smaller than that for ε = 10%. As shown in Figure S13, although no correlation was observed between atomic stresses at ε = 0% and 10%, a weak correlation was observed for ε = 5% and 10%. Thus, we conclude that the observed stress chain is not a transient phenomenon.
The presentation of σ1 in Figure 4b reveals that the amorphous subchains exhibit large fluctuations, which were confirmed by the σvM values, as shown in Figure 4c.
Figure S10 shows the dependence of σzz on the time window: more stress chains (red) were observed for a larger time window. It can be concluded that chain-induced stress propagation is not a short-term phenomenon, but one observed over a long period of time.
The comparison between the large-scale UAMD simulations of PE chains with preEL = 400% and 800% revealed that the strength of pre-elongation governs the crystal domain structures (size and morphology) and the mechanical properties (stress–strain relationship). Chain-level analysis reveals that the chain extension in the z-direction became larger for higher preEL values. The snapshots, spatial correlation maps, and topological data analysis indicated that the crystal domain structure at preEL = 400% was a layer-like structure, whereas that at preEL = 800% was a mesh-like structure in which the domains were connected by tense chains. When the crystallinity was close to the experimental value (ex. 0.5), increasing the crystallization time and/or crystallinity had no significant effect on the structure or stress–strain behavior. From the MD simulation standpoint, where the possible simulation time is limited by computational costs, fortunately, many conditions can be investigated with reasonable computing costs without an infinitely long simulation time.
The observed snapshots and SAXS patterns indicated that forming a layer-like structure was easier at smaller preEL values. This observation is consistent with the findings of our experiment,18 which investigated the PE chains with preEL = 100%, 200%, and 400%. Simulations of PE chains with preEL < 400% are urgently required. For a smaller preEL value, a longer time is required for the crystallinity to reach a value (ex. 0.5) that is closer to the experimental value. We are currently conducting large-scale UAMD simulations.
Through atomic stress analysis, we clarified that thermal fluctuations can be removed by an appropriate time averaging. From observations in various time windows for averaging, we observed more stress chains over a wider time window. Even with an average time window of 5 ns, we observed chainlike stress propagation. In addition, the stress chain for preEL = 800% was clearly observed; however, that for preEL = 400% was not very clear, owing to the smaller stress value. Averaging over a wider time window is expected to provide greater clarity. Time averaging of stress tensors for a duration longer than the current duration of 5 ns will be performed in future research.
To clarify the crucial role played by crystal domain morphologies on mechanical property, pre-elongation was applied through large-scale simulations at the 100 nm scale. Pre-elongation is a key factor governing crystal domain structures and strengthening the elastic modulus. This hypothesis is common not only for polymers but also for metals. Similar to metallic materials, a verification method that combines electron microscopy and accurate MD simulations is considered to be feasible for polymeric materials. Large-scale UAMD simulations with data assimilation using material experiments and the direct observation of crystalline nanodomains in real space by using electron microscopy are ongoing tasks.
Acknowledgments
The authors thank Prof. T. Kikutani, Prof. T. Nishino, and Dr. T. Murashima for their valuable discussions. This study used the computational resources of the High-Performance Computing Infrastructure (HPCI) in Japan, project Nos. hp210133, hp210134, hp220113, hp220114, hp220215, and hp230148. The authors were partially supported by JSPS KAKENHI, Japan (Grant Numbers JP18H04494, JP20H04649, and JP21H00111) and JST CREST, Japan (Grant Numbers JPMJCR1993 and JPMJCR19T4).
Supporting Information Available
The Supporting Information is available free of charge at https://pubs.acs.org/doi/10.1021/acsmacrolett.3c00554.
Methods; Sliced snapshots and distribution of the local order parameter; Two-dimensional scattering patterns; Spatial-correlation map and Betti number analysis; Reduction in thermal fluctuations with time-averaged atomic stress (PDF)
Author Contributions
The manuscript was written with contributions from all authors. The conceptualizations, computations, analyses, and visualizations were mainly performed by K.H. All authors approved the final version of the manuscript. CRediT: Katsumi Hagita conceptualization, data curation, formal analysis, funding acquisition, investigation, methodology, project administration, resources, software, validation, visualization, writing-original draft, writing-review & editing; Takashi Yamamoto investigation, validation, writing-original draft, writing-review & editing; Hiromu Saito writing-original draft, writing-review & editing; Eiji Abe writing-original draft, writing-review & editing.
The authors declare no competing financial interest.
Supplementary Material
References
- Keller A.; Kolnaar H. W. H.. Flow-induced orientation and structure formation. In Processing of Polymers; Meijer H. E. H., Ed.; VCH: New York, 1997; Vol. 18, pp 189–268. [Google Scholar]
- Eder G.; Janeschitz-Kriegl H.. Structure development during processing: crystallization. In Processing of Polymers; Meijer H. E. H., Ed.; VCH: New York, 1997; Vol. 18, pp 269–342. [Google Scholar]
- Wunderlich B.Macromolecular Physics; Academic Press: New York, 1973; Vol. 2. [Google Scholar]
- Liu C.; Morimoto N.; Jiang L.; Kawahara S.; Noritomi T.; Yokoyama H.; Mayumi K.; Ito K. Tough hydrogels with rapid self-reinforcement. Science 2021, 372, 1078–1081. 10.1126/science.aaz6694. [DOI] [PubMed] [Google Scholar]
- Galeski A. Strength and toughness of crystalline polymer systems. Prog. Polym. Sci. 2003, 28, 1643–1699. 10.1016/j.progpolymsci.2003.09.003. [DOI] [Google Scholar]
- Somani R. H.; Yang L.; Zhu L.; Hsiao B. S. Flow-induced shish-kebab precursor structures in entangled polymer melts. Polymer 2005, 46, 8587–8623. 10.1016/j.polymer.2005.06.034. [DOI] [Google Scholar]
- Gee R. H.; Lacevic N.; Fried L. E. Atomistic simulations of spinodal phase separation preceding polymer crystallization. Nat. Mater. 2006, 5, 39–43. 10.1038/nmat1543. [DOI] [PubMed] [Google Scholar]
- Jabbari-Farouji S.; Lame O.; Perez M.; Rottler J.; Barrat J. L. Role of the intercrystalline tie chains network in the mechanical response of semicrystalline polymers. Phys. Rev. Lett. 2017, 118, 217802 10.1103/PhysRevLett.118.217802. [DOI] [PubMed] [Google Scholar]
- Fall W. S.; Baschnagel J.; Benzerara O.; Lhost O.; Meyer H. Molecular simulations of controlled polymer crystallization in polyethylene. ACS Macro Lett. 2023, 12, 808–813. 10.1021/acsmacrolett.3c00146. [DOI] [PubMed] [Google Scholar]
- Verho T.; Paajanen A.; Vaari J.; Laukkanen A. Crystal growth in polyethylene by molecular dynamics: The crystal edge and lamellar thickness. Macromolecules 2018, 51, 4865–4873. 10.1021/acs.macromol.8b00857. [DOI] [PMC free article] [PubMed] [Google Scholar]
- Sliozberg Y. R.; Yeh I.-C.; Kröger M.; Masser K. A.; Lenhart J. L.; Andzelm J. W. Ordering and crystallization of entangled polyethylene melts under uniaxial tension: A molecular dynamics study. Macromolecules 2018, 51, 9635–9648. 10.1021/acs.macromol.8b01538. [DOI] [Google Scholar]
- Nie C.; Peng F.; Xu T.; Ding Y.; Sheng J.; Chen W.; Li L. Biaxial stretch-induced crystallization of polymers: A molecular dynamics simulation study. Macromolecules 2021, 54, 9794–9803. 10.1021/acs.macromol.1c01606. [DOI] [Google Scholar]
- Yamamoto T. Molecular dynamics simulation of stretch-induced crystallization in polyethylene: Emergence of fiber structure and molecular network. Macromolecules 2019, 52, 1695–1706. 10.1021/acs.macromol.8b02569. [DOI] [Google Scholar]
- Zhang W.; Larson R. G. Direct all-atom molecular dynamics simulations of the effects of short chain branching on polyethylene oligomer crystal nucleation. Macromolecules 2018, 51, 4762–4769. 10.1021/acs.macromol.8b00958. [DOI] [Google Scholar]
- Ranganathan R.; Kumar V.; Brayton A. L.; Kröger M.; Rutledge G. C. Atomistic modeling of plastic deformation in semicrystalline polyethylene: Role of interphase topology, entanglements, and chain dynamics. Macromolecules 2020, 53, 4605–4617. 10.1021/acs.macromol.9b02308. [DOI] [Google Scholar]
- Hall K. W.; Sirk T. W.; Percec S.; Klein M. L.; Shinoda W. Divining the shape of nascent polymer crystal nuclei. J. Chem. Phys. 2019, 151, 144901 10.1063/1.5123983. [DOI] [PubMed] [Google Scholar]
- Yeh I.-C.; Andzelm J. W.; Rutledge G. C. Mechanical and structural characterization of semicrystalline polyethylene under tensile deformation by molecular dynamics simulations. Macromolecules 2015, 48, 4228–4239. 10.1021/acs.macromol.5b00697. [DOI] [Google Scholar]
- Murayama T.; Abe E.; Saito H. Strengthening of mille-feuille structured high-density polyethylene by heat elongation. Polymer 2021, 236, 124343 10.1016/j.polymer.2021.124343. [DOI] [Google Scholar]
- Tang X.; Chen W.; Li L. The tough journey of polymer crystallization: Battling with chain flexibility and connectivity. Macromolecules 2019, 52, 3575–3591. 10.1021/acs.macromol.8b02725. [DOI] [Google Scholar]
- Feng S.; Lin Y.; Yu W.; Iqbal O.; Habumugisha J. C.; Chen W.; Meng L.; Lu A.; Li L. Stretch-induced structural transition of linear low-density polyethylene during uniaxial stretching under different strain rates. Polymer 2021, 226, 123795 10.1016/j.polymer.2021.123795. [DOI] [Google Scholar]
- Okada K.; Watanabe K.; Wataoka I.; Toda A.; Sasaki S.; Inoue K.; Hikosaka M. Size distribution and shape of nano-nucleus of polyethylene simultaneously determined by SAXS. Polymer 2007, 48, 382–392. 10.1016/j.polymer.2006.10.042. [DOI] [Google Scholar]
- Kanik M.; Orguc S.; Varnavides G.; Kim J.; Benavides T.; Gonzalez D.; Akintilo T.; Tasan C. C.; Chandrakasan A. P.; Fink Y.; Anikeeva P. Strain-programmable fiber-based artificial muscle. Science 2019, 365, 145–150. 10.1126/science.aaw2502. [DOI] [PMC free article] [PubMed] [Google Scholar]
- Yuan J.; Neri W.; Zakri C.; Merzeau P.; Kratz K.; Lendlein A.; Poulin P. Shape memory nanocomposite fibers for untethered high-energy microengines. Science 2019, 365, 155–158. 10.1126/science.aaw3722. [DOI] [PubMed] [Google Scholar]
- Koyama A.; Yamamoto T.; Fukao K.; Miyamoto Y. Molecular dynamics studies on polymer crystallization from a stretched amorphous state. J. Macromol. Sci. B 2003, 42, 821–831. 10.1081/MB-120021608. [DOI] [Google Scholar]
- Ko M. J.; Waheed N.; Lavine M. S.; Rutledge G. C. Characterization of polyethylene crystallization from an oriented melt by molecular dynamics simulation. J. Chem. Phys. 2004, 121, 2823. 10.1063/1.1768515. [DOI] [PubMed] [Google Scholar]
- Sefiddashti M. H. N.; Edwards B. J.; Khomami B. Atomistic simulation of flow-induced microphase separation and crystallization of an entangled polyethylene melt undergoing uniaxial elongational flow and the role of Kuhn segment extension. Polymers 2023, 15, 1831. 10.3390/polym15081831. [DOI] [PMC free article] [PubMed] [Google Scholar]
- Martin M. G.; Siepmann J. I. Transferable potentials for phase equilibria. 1. United-atom description of n-alkanes. J. Phys. Chem. B 1998, 102, 2569–2577. 10.1021/jp972543+. [DOI] [Google Scholar]
- Plimpton S. Fast parallel algorithms for short-range molecular dynamics. J. Comput. Phys. 1995, 117, 1–19. 10.1006/jcph.1995.1039. [DOI] [Google Scholar]
- Thompson A. P.; Aktulga H. M.; Berger R.; Bolintineanu D. S.; Brown W. M.; Crozier P. S.; in ’t Veld P. J.; Kohlmeyer A.; Moore S. G.; Nguyen T. D.; Shan R.; Stevens M. J.; Tranchida J.; Trott C.; Plimpton S. J. LAMMPS – a flexible simulation tool for particle-based materials modeling at the atomic, meso, and continuum scales. Comput. Phys. Commun. 2022, 271, 108171. 10.1016/j.cpc.2021.108171. [DOI] [Google Scholar]
- Hess B.; Kutzner C.; van der Spoel D.; Lindahl E. GROMACS 4: Algorithms for highly efficient, load-balanced, and scalable molecular simulation. J. Chem. Theory Comput. 2008, 4, 435–447. 10.1021/ct700301q. [DOI] [PubMed] [Google Scholar]
- Abraham M. J.; Murtola T.; Schulz R.; Páll S.; Smith J. C.; Hess B.; Lindahl E. GROMACS: High performance molecular simulations through multi-level parallelism from laptops to supercomputers. SoftwareX 2015, 1–2, 19–25. 10.1016/j.softx.2015.06.001. [DOI] [Google Scholar]
- Auer S.; Frenkel D. Numerical prediction of absolute crystallization rates in hard-sphere colloids. J. Chem. Phys. 2004, 120, 3015–3029. 10.1063/1.1638740. [DOI] [PubMed] [Google Scholar]
- Stukowski A. Visualization and analysis of atomistic simulation data with OVITO – the Open Visualization Tool. Modelling Simul. Mater. Sci. Eng. 2010, 18, 015012 10.1088/0965-0393/18/1/015012. [DOI] [Google Scholar]
- Hagita K.; Morita H.; Doi M.; Takano H. Coarse-grained molecular dynamics simulation of filled polymer nanocomposites under uniaxial elongation. Macromolecules 2016, 49, 1972–1983. 10.1021/acs.macromol.5b02799. [DOI] [Google Scholar]
- Kalies W.; Pilarczyk P.. Computational Homology Project, http://chomp.rutgers.edu.
- Hagita K.; Teramoto T. Topological validation of morphology modeling by extended reverse Monte Carlo analysis. Phys. Rev. E 2008, 77, 056704 10.1103/PhysRevE.77.056704. [DOI] [PubMed] [Google Scholar]
Associated Data
This section collects any data citations, data availability statements, or supplementary materials included in this article.