


Key Words: caspase-8, Homer1a, interleukin-18, interleukin-1β, intraocular pressure, ischemia/reperfusion injury, JSH-23, Müller cells, NLRP3, nuclear factor-kB p65, retina
Abstract
Elevated intraocular pressure (IOP) is one of the causes of retinal ischemia/reperfusion injury, which results in NLRP3 inflammasome activation and leads to visual damage. Homer1a is reported to play a protective role in neuroinflammation in the cerebrum. However, the effects of Homer1a on NLRP3 inflammasomes in retinal ischemia/reperfusion injury caused by elevated IOP remain unknown. In our study, animal models were constructed using C57BL/6J and Homer1flox/–/Homer1a+/–/Nestin-Cre+/– mice with elevated IOP-induced retinal ischemia/reperfusion injury. For in vitro experiments, the oxygen-glucose deprivation/reperfusion injury model was constructed with Müller cells. We found that Homer1a overexpression ameliorated the decreases in retinal thickness and Müller cell viability after ischemia/reperfusion injury. Furthermore, Homer1a knockdown promoted NF-κB P65Ser536 activation via caspase-8, NF-κB P65 nuclear translocation, NLRP3 inflammasome formation, and the production and processing of interleukin-1β and interleukin-18. The opposite results were observed with Homer1a overexpression. Finally, the combined administration of Homer1a protein and JSH-23 significantly inhibited the reduction in retinal thickness in Homer1flox/–/Homer1a+/–/Nestin-Cre+/– mice and apoptosis in Müller cells after ischemia/reperfusion injury. Taken together, these studies demonstrate that Homer1a exerts protective effects on retinal tissue and Müller cells via the caspase-8/NF-κB P65/NLRP3 pathway after I/R injury.
Introduction
Retinal ischemia/reperfusion (I/R) injury is the pathological basis of many retinal diseases (Flammer et al., 2002), including retinal vascular occlusion, diabetic retinopathy (Rivera et al., 2017), and ocular injuries (Kim et al., 2013). These ocular diseases, which lead to severe visual morbidity, have significant socioeconomic impacts worldwide (Hamzeh et al., 2021). Vision in mice can be adversely affected by acute retinal vascular occlusion within 30–60 minutes (González Fleitas et al., 2015; Bermudez and Gonzalez, 2020; Matei et al., 2021). Numerous therapeutic measures, including antioxidants, calcium antagonists, antiapoptotic agents and neurotrophic factors, have been applied to retinal I/R injury. However, these therapies usually have poor clinical efficacy (Mathew et al., 2019).
Studies have shown that the main cause of retinal I/R injury is initiation of the inflammatory cascade (Duh et al., 2017; Rivera et al., 2017; Roche et al., 2018), in which NACHT-LRR-PYD domain protein 3 (NLRP3) plays an important role. NLRP3 is directly involved in the activation of nuclear factor κB (NF-κB) through pathogen-related or damage-related molecular patterns. Additionally, NLRP3 activation results in the release of interleukin (IL)-1β and IL-18 through the oligomerization of apoptosis-associated speck-like protein containing a caspase recruitment domain (ASC), which recruits and activates the protease caspase-1 (Sharif et al., 2019; Swanson et al., 2019). Homer scaffold protein 1 (Homer1), a neuronal postsynaptic scaffold protein, is closely associated with cell signal transduction and neuronal activity (Zimmerman et al., 2020; Yoon et al., 2021). Homer1 proteins consist of two major groups: long-form and short-form Homer1 proteins (Brakeman et al., 1997). The short Homer1 protein is also called Homer1a (Vesl‐1S), which contains only a conservative domain and lacks the coiled-coil domain (Xiao et al., 1998). A previous study showed that Homer1a was upregulated by oxygen and glucose deprivation (OGD) and that Homer1a overexpression alleviated OGD-induced lactate dehydrogenase release and cell death in cultured cortical neurons (Wei et al., 2019). These findings may indicate a promising target to protect neurons from cerebral I/R injury. However, very little is known about the association between Homer1a and NLRP3-induced inflammation after retinal I/R injury.
Retinal Müller cells account for approximately 90% of retinal glial cells, and these cells maintain normal retinal structure and function, regulate retinal neuronal activity, and take part in a variety of pathological processes (Bringmann et al., 2006; Bay and Butt, 2012; Li et al., 2021a). Therefore, these cells are typically used to study retinal disease mechanisms (Goldman, 2014; Hoang et al., 2020; Campbell et al., 2022; Song et al., 2023; Xu et al., 2023). We used Müller cells to construct a retinal I/R injury model in vitro to investigate the relationship between Homer1a, NLRP3 and inflammation. The present study investigated whether Homer1a affects the inflammatory response and retinal damage through the NLRP3 inflammasome after I/R injury. Our findings may provide a theoretical and practical foundation for future treatment.
Methods
Animals
All animal procedures were performed in accordance with the Association for Research in Vision and Ophthalmology Statement for the Use of Animals in Ophthalmic and Vision Research. All experimental procedures were approved by the Institutional Animal Care and Use Committee of Air Force Military Medical University (approval No. IACUC-20220630) in 2022. All animal experiments were designed based on the 3R principle. A total of 105 male 8-week-old C57BL/6J mice, weighing 25 ± 2 g, were purchased from Shanghai Model Organisms Center (Shanghai, China; license No. SYXK (Hu) 2018-0002). All animals were maintained in a temperature-controlled facility with a 12-hour light/dark cycle at 23 ± 3°C and 30–70% humidity.
Generation of Homer1flox/−/Homer1a+/−/Nestin-Cre+/– mice
The Homer1 gene can be transcribed and translated into various proteins, including Homer1a (1–186 aa) and Homer 1b/c (1–366 aa), which are two proteins with completely different functions. The first 186 amino acid sequences of Homer1a and Homer1b/c proteins are the same, and both share a portion of the genetic information of the Homer1 gene. Knocking out any exon of Homer1a affects Homer1b/c, and thus Homer1a is difficult to knock out using a conventional gene knockout strategy without affecting Homer1b/c function. We used the following method as published in a previous study for constructing transgenic mice (Hu et al., 2010; Chokshi et al., 2019). The transgenic mice were constructed with the assistance of Shanghai Model Organisms Center (Shanghai, China). Exon 5 and intron 5 of Homer1–203 transcript were selected as editing regions. The exon 5–9 complementary DNA sequence of rat Homer1–204 transcript was knocked into the 3′ end of exon 5 using embryonic stem cell targeting to selectively knock out Homer1a. This genome editing technique knocks out Homer1a without affecting Homer1b/c. In addition, Nestin-Cre transgene mice have previously been shown to be effective for gene deletion in retinal ganglion cells (MacPherson et al., 2004; Honjo et al., 2007; Martins et al., 2008). The genotype of the conditional knockout Homer1a transgenic mice is written as Homer1flox/−/Homer1a+/−/Nestin-Cre+/− mice.
Experimental groups
To investigate the protective effect of Homer1a against retinal I/R injury, C57BL/6J mice were used to prepare Homer1a overexpression (OE) and Homer1a knockdown (KD) mice. Three weeks before establishing the retinal I/R model, intravitreal injections of Homer1a OE and Homer1a KD adeno-associated virus (AAV) were given. The mice were initially weighed and then anesthetized by intraperitoneal injection of 0.3% sodium pentobarbital (50 mg/kg, Inresa, Bartenheim, France, CAS57-33-0). Next, chloramphenicol eye drops were administered to prevent dryness and infection of the eyes. Then, 2 μL AAVs were injected into the vitreous cavity along the edge of the cornea using a 30-G needle over 2 minutes. After injection, the mice were fed normally for 3 weeks to ensure stable AAV expression. To explore the regulatory relationship between NF-κB and caspase-8, C57BL/6J mice were used to construct I/R + NF-κB inhibitor (inh) and I/R + caspase-8 (Casp-8) inh mice. Intravitreal injections of the NF-κB-P65 inhibitor C16H20N2 (JSH-23; 20 μM/2 μL/25 g/mouse; dissolved in normal saline; MCE, Shanghai, China) and caspase-8 inhibitor C30H43FN4O11 (Z-IETD-fmk; 20 μM/2 μL/25 g/mouse; dissolved in normal saline; MCE) were given 6 hours before I/R modeling.
In 90 C57BL/6J mice, 70 mice were randomly divided into seven groups: sham, 4, 12, 24 hours, and 7, 14, and 21 days groups (n = 10/group). One eye of each mouse was used to establish the retinal I/R injury model (I/R group), and the contralateral eye served as a normal control. With the remaining 20 mice, a Homer1a OE group (n = 10) and Homer1a KD group (n = 10) were constructed by intravitreal injection of Homer1a OE and Homer1a KD AAVs, respectively.
Fifteen C57BL/6J mice were allocated into three groups: sham, I/R + NF-κB inh, and I/R + Casp-8 inh groups (n = 5/group). One eye of each mouse was injected with 2 μL normal saline, NF-κB-P65 inhibitor, and caspase-8 inhibitor for the sham, I/R + NF-κB inh, and I/R + Casp-8 inh groups, respectively.
Twenty-five Homer1flox/−/Homer1a+/−/Nestin-Cre+/– mice were randomly divided into five groups (n = 5/group): sham group (ShamH group), Homer1flox/–/Homer1a+/–/Nestin-Cre+/– I/R group (I/RH group), Homer1flox/–/Homer1a+/–/Nestin-Cre+/– I/R plus NF-κB inh group (I/RH + NF-κB inh group), Homer1flox/–/Homer1a+/–/Nestin-Cre+/– I/R plus Homer1a protein group (I/RH + Homer1a protein group), and Homer1flox/–/Homer1a+/–/Nestin-Cre+/– I/R plus NF-κB inh and Homer1a (both) group (I/RH + both group). Intravitreal injection of normal saline (2 μL), JSH-23 (20 μM/2 μL/25 g/mouse) and Homer1a protein (MCE; 1 μg/2 μL/25 g/mouse; dissolved in normal saline) were given 6 hours before I/R injury (Figure 1).
Figure 1.

Diagram of the in vivo experimental groups.
AAV: Adeno-associated virus; Homer1: homer scaffold protein 1; I/R: ischemia/reperfusion; inh: inhibitor; KD: knock-down; NF-κB: nuclear factor κB; OE: overexpression.
With the exception of mice in the I/R group, which were anesthetized and euthanized at the designated reperfusion time points, mice in the other groups were anesthetized with 0.3% sodium pentobarbital (50 mg/kg, intraperitoneal injection) and euthanized at 24 hours after reperfusion. Retinal tissue was used for molecular evaluation (n = 5/group), including western blotting, real-time polymerase chain reaction (RT-PCR), mouse cytokine arrays, coimmunoprecipitation, enzyme-linked immunosorbent assay (ELISA), and pathological analyses (n = 5/group), including terminal deoxynucleotidyl transferase dUTP nick end labeling (TUNEL) assays and hematoxylin-eosin staining.
In vitro, Müller cells were divided into control and I/R groups. In the I/R group, Müller cells were randomly divided into six groups: 4, 8, 12, 24, 36 and 48 hours after oxygen reperfusion. In addition, Müller cells infected with Homer1a OE or KD lentiviruses (Hanbio Biotechnology Co., Ltd., Shanghai, China) were divided into I/R + Homer1a OE and I/R + Homer1a KD groups, respectively, after I/R injury. Müller cells that were pretreated with NF-κB inh, Casp-8 inh and Homer1a protein (10 μM for 12 hours) were divided into the I/R + NF-κB inh group, I/R + Casp-8 inh group and I/R + Homer1a protein group, respectively, after I/R injury.
Retinal I/R injury
In close correspondence with the pathological basis of many clinical retinal diseases such as retinal vascular occlusion, diabetic retinopathy and ocular injuries, retinal I/R injury by IOP elevation presents a valuable tool to study the mechanisms and treatment. In the present study, the retinal IR model was conducted as that in a study by Abcouwer et al. (2021). The mice were weighed and anesthetized after an intraperitoneal injection of 0.3% sodium pentobarbital (50 mg/kg). A 33-G needle was inserted into the cornea in the anterior chamber. To induce ischemia, IOP was elevated to 85 mmHg by raising the normal saline storage bag to 160 cm for 90 minutes. During the experiments, chloramphenicol eye drops (Bausch & Lomb, Rochester, NY, USA) were intermittently administered to keep the cornea moist and prevent infection. Levofloxacin eye drops (Bausch & Lomb) were also administered to prevent postoperative infection after the completion of the surgery. During surgery and recovery, the body temperatures of the mice were maintained at 37.5°C using a digitally controlled heating pad. In the sham group, the needle was inserted into the anterior chamber but IOP was not elevated.
Müller cell I/R injury
Mice Müller cells (Yuchi Biological, Shanghai, China, Cat# SD0001), identified by glutamine synthetase immunofluorescence analysis, had a purity of more than 90% (Additional Figure 1 (2.9MB, tif) ). The cells were cultured in glial cell complete medium (PriMed-iCell-007, iCell Bioscience Inc, Shanghai, China) at 37°C in the presence of 5% CO2. As reported in previous studies (Li et al., 2021b; Nasoni et al., 2021), an in vitro I/R injury model was established when the cells reached 70% confluence. The culture medium was replaced with sugar- and serum-free medium (Gibco, Grand Island, NY, USA, Cat# 11966025), and the cells were cultured in an anaerobic incubator (Thermo, Waltham, MA, USA) with 1% O2, 94% N2, and 5% CO2 for 60 minutes. Cells in the I/R group were transferred to the normal incubator for further culture to imitate reperfusion in vivo. Cells in the control group were cultured in a normal aerobic environment and in the logarithmic growth stage.
Lentiviruses and AAVs
Lentiviruses and AAVs were designed by Hanbio Biotechnology Co., Ltd. We used the following AAVs: Homer1a-OE: AAV2/DJ-pHBAAV-CMV-Homer1a-3flag-T2A-ZsGreen; Homer 1-KD: AAV2/DJ-pHBAAV-U6-Homer1ashRNA-CMV-EGFP; and small interfering RNA (siRNA) sequence: 5′-GCA TTG CCA TTT CCA CAT A-3′, and the following lentiviruses: Homer1a-OE (NM_011982): GV358/Ubi-MCS-3FLAG-SV40-EGFP-IRES-puromycin; Homer1a-KD: GV248/hU6-MCS-Ubiquitin-EGFP-IRES-puromycin; and siRNA target sequence: 5′-CAG CAC TCG AGC TCA TGT CTT-3′. RT-PCR, western blotting and fluorescence analysis were used to verify the viral infection (Additional Figure 2 (6MB, tif) ).
PCR
Genetic identification of Homer1flox/−/Homer1a+/−/Nestin-Cre+/− mice (male, 25 ± 2 g, 8 weeks old) was performed using the One Step Mouse Genotyping Kit (Vazyme, Nanjing, China). DNA was extracted from the tail, and PCR (Bio-Rad, Hercules, CA, USA) was performed in accordance with the manufacturer's instructions. The parameters of PCR were as follows: pre-denaturation at 94°C for 5 minutes; circular reaction: 94°C for 30 seconds, 55°C for 30 seconds and 72°C for 30 seconds/kb with a total 35 cycles; and melting: 72°C for 7 minutes. The PCR products were examined using 2% agarose gel electrophoresis with 110 V for 60 minutes. The primer information required for gene identification is provided in Additional Table 1.
Additional Table 1.
Sequence information of primers used for polymerase chain reaction
| Gene | Primers (5'→3') |
|---|---|
| Homeria(Mus) | FoReversewaReversed: ACCAGTACCCCTTCACAGGA |
| Reverse: TGATTGCTGAATTGAATGTGTACCT | |
| GAPDH(Mus) | Forward: AGAGGCCCTATCCCAACTCG |
| Reverse: GTGGGTGCAGCGAACTTTATT | |
| IL-18(Mus) | Forward: TGGCCCAGGAACAATGGCTGC |
| Reverse: TGCGGTTGTACAGTGAAGTCGGC | |
| IL-1β(Mus) | Forward: AGGAGAACCAAGCAACGACA |
| Reverse: CTCTGCTTGTGAGGTGCTGA | |
| NF-κB p65(Mus) | Forward: CTGAACAAAATGCCCCACGG |
| Reverse: TTCCTCCTTTGGGACGATGC | |
| NF-kB p65 (phospho S536)(Mus) | Forward: CTGCCGAGTAAACCGGAACT |
| Reverse: GCCTGGTCCCGTGAAATACA | |
| Homeri flox(Mus) | Forward: TGAGCTGGACACCCCCTGCC |
| Reverse: TGTTAAAACAATTACACCCGATTCTT | |
| Homeria-KO1(Mus) | Wild type: CGTGCTTGGTACCCTGTCTT |
| Common: GACGATGAGAGAACACCCGA | |
| Mutant: CACCGCGTTTGCTTGACTAC | |
| Nestin-cre(Mus) | Wild type: TTGCTAAAGCGCTACATAGGA |
| Common: GCCTTATTGTGGAAGGACTG | |
| Mutant: CCTTCCTGAAGCAGTAGAGCA |
Mouse cytokine array
Inflammatory factors and cytokines in the retina were detected by the mouse cytokine array Q4000 (RayBiotech, Norcross, GA, USA). The experimental procedures were performed in strict accordance with the manufacturer's instructions (Fei et al., 2022a, b).
Hematoxylin-eosin staining
The mice were anesthetized with 0.3% sodium pentobarbital (50 mg/kg) and perfused with saline (0.9% NaCl) followed by 4% paraformaldehyde (Solarbio, Beijing, China). The eyes were immediately enucleated, and the retinal tissues were harvested and fixed with 4% paraformaldehyde for 48 hours. The tissues were dehydrated by an automatic dehydrator (Thermo), then embedded in paraffin and sectioned (thickness: 4 μm). Paraffin sections were first dewaxed in xylene and then dehydrated in 95%, 90%, and 80% anhydrous ethanol. The sections were washed with phosphate buffered saline (PBS). After the nuclei were stained with hematoxylin solution (Solarbio) for 5 minutes, the sections were washed with PBS, placed in a 1% hydrochloric acid-ethanol solution for 15 seconds and then washed with PBS. The sections were then soaked in 0.2% ammonia for 2 minutes and washed again with PBS. The sections were stained with eosin solution (Solarbio) for 1 minute and washed again with PBS. The sections were dehydrated by decreasing concentrations of alcohol and cleared with xylene. Finally, the sections were sealed with neutral resin. Total retinal thickness (from inner to outer limiting membrane) was measured in four adjacent areas within 1 mm of the optic disc using Axiovision software (Carl Zeiss MicroImaging Inc., Thornwood, NY, USA), then calculated as total retinal thickness (%) = retinal thickness in experiment group/retinal thickness in control group × 100.
Coimmunoprecipitation
Retinal tissues and Müller cells were collected in 1.5 mL centrifuge tubes, and 1 mL of radioimmunoprecipitation assay (Sigma-Aldrich, St. Louis, MO, USA) buffer was added. Retinal tissues and Müller cells were incubated on ice for 1 hour. Next, 1 μL (2 μg) of the primary antibody was added to the cell lysate supernatant after centrifugation (1000 × g, 5 minutes, 4°C), and the supernatant was incubated at 4°C for 1 hour. Afterward, 20 mL resuspended protein A/GPLUS-agarose (Santa Cruz, Deerfield Beach, FL, USA) was added to the cell lysate supernatant and incubated overnight at 4°C with shaking. The supernatant was discarded after centrifugation (1000 × g, 5 minutes, 4°C), and the agarose was washed three times with PBS for 5 minutes each and then boiled with 1× loading buffer (40 μL) for 10 minutes at 100°C. Finally, protein expression was assessed by western blotting. Isotype IgG was used as a negative control. The antibodies used are listed in Additional Table 2.
| Antibodies | Species | Concentration of use | Company | Location | Catalog number |
|---|---|---|---|---|---|
| Homeria Antibody | Rabbit | WB: 1:1000 | Abcam | Cambridge, UK | ab184955 |
| Anti-Caspase-8 | Rabbit | WB: 1:1000; IP: 1:100 | Abcam | Cambridge, UK | ab138485 |
| ASC/TMS1 (D2W8U) Rabbit mAb | Rabbit | WB: 1:1000; IP: 1:100 | CST | Boston, MA, USA | 67824 |
| Caspase-1 (E2Z1C) Rabbit mAb | Rabbit | WB: 1:1000 | CST | Boston, MA, USA | 24232 |
| Cleaved Caspase-1 (Asp296) (E2G2I) Rabbit mAb | Rabbit | WB: 1:1000 | CST | Boston, MA, USA | 89332 |
| NLRP3 (D4D8T) Rabbit mAb | Rabbit | WB: 1:1000; IP: 2:100 | CST | Boston, MA, USA | 15101 |
| Anti-IL-1β | Rabbit | WB: 1:1000 | Abcam | Cambridge, UK | ab254360 |
| Cleaved-IL-1β (Asp117) (E7V2A) Rabbit mAb | Rabbit | WB: 1:1000 | CST | Boston, MA, USA | 63124 |
| IL-18 (E8P5O) Rabbit mAb | Rabbit | WB: 1:1000 | CST | Boston, MA, USA | 57058 |
| Anti-NF-kB p65 | Rabbit | WB: 1:1000 | Abcam | Cambridge, UK | ab32536 |
| Anti-NF-kB p65 (phospho S536) | Rabbit | WB: 1:1000 | Abcam | Cambridge, UK | ab76302 |
| GAPDH (D16H11) XP® Rabbit mAb | Rabbit | WB: 1:1000 | CST | Boston, MA, USA | 5174 |
RT-PCR
Retinal tissue and Müller cell samples were subjected to total RNA extraction using TRIzol reagent (Thermo). Reverse transcription was performed according to the protocol of the HiScript II Q Select RT SuperMix for qPCR (+ gDNA wiper) kit (Vazyme). RT-PCR was conducted according to the protocol of the ChamQ SYBR Color qPCR Master Mix (Low ROX Premixed) kit (Vazyme). mRNA expression was calculated using the 2–ΔΔct method (Fei et al., 2022c), and glyceraldehyde-3-phosphate dehydrogenase (GAPDH) was used as a control. Briefly, the parameters of reverse transcription were 50°C for 15 minutes and 85°C for 5 seconds. The parameters of PCR were as follows: predenaturation at 94°C for 30 seconds; circular reaction: 95°C for 10 seconds and 60°C for 30 seconds with a total of 40 cycles; melting curve: 95°C for 15 seconds, 60°C for 60 seconds and 95°C for 15 seconds. The primers for mRNA amplification are listed in Additional Table 1.
Fluorescent TUNEL assay
Retinal tissue was fixed with 4% paraformaldehyde (Solarbio) for 48 hours after perfusion, and dehydrated with 30% sucrose until the tissue sunk to the bottom of the test tube. The tissue was embedded with optimal cutting temperature compound embedding agent (SAKURA, Shanghai, China) and then sliced (thickness: 4 μm) using a frozen slicer (Thermo). Retinal cryosections and Müller cells were stained with a TUNEL kit (Beyotime, Shanghai, China) in strict accordance with the manufacturer's instructions (Zheng et al., 2017). Images were obtained with a fluorescence microscope (Olympus, Tokyo, Japan). The apoptotic rate was represented by the number of TUNEL+ cells divided by the total number of cells in which nuclei were labeled in each field. In the in vivo experiment, five visual fields were randomly selected in each section and the number of TUNEL+ cells was counted. In the in vitro experiment, three biological replicates were performed in each group. One field of vision was randomly selected in each experiment, and the number of apoptotic cells was calculated using ImageJ (V1.8.0.112, National Institutes of Health, Bethesda, MD, USA) (Schneider et al., 2012).
Western blotting
Total protein was extracted from retinal tissue and Müller cells using radioimmunoprecipitation assay buffer (Sigma-Aldrich). A bicinchoninic acid protein concentration determination kit (Solarbio) was used for protein quantification. Equal amounts of protein (30 µg) per sample were separated using a 12% SurePAGETM separation gel from the sodium dodecyl sulfate polyacrylamide gel electrophoresis gel preparation kit (Solarbio) and transferred to polyvinylidene fluoride membranes (Sigma-Aldrich). The membrane was blocked using 5% bovine serum albumin for 1 hour at room temperature (25 ± 2°C) and incubated with specific primary antibodies overnight at 4°C. The membrane was then incubated overnight with the corresponding secondary antibody at room temperature for 1 hour. Protein expression was analyzed with ECL plus reagent (Millipore, Boston, MA, USA) and imaged with an Amersham imager 600 (General Electric, Boston, MA, USA). Target protein expression was quantified using ImageJ software and normalized to GAPDH. Detailed antibody information is provided in Additional Table 2.
For the isolation and extraction of cytoplasmic and nuclear proteins in retinal tissue and Müller cells, a nuclear and cytoplasmic protein extraction kit (Beyotime) was used according to the manufacturer's instructions (Tang et al., 2012). Immunoblot analysis of the cytoplasmic and nuclear protein extracts was performed as described above.
Cell Counting Kit-8 assay
The Cell Counting Kit-8 (CCK-8; Dojindo, Kyushu Island, Japan) was used to analyze the viability of the Müller cells in each group, and the assay was performed according to the manufacturer's instructions. Briefly, active growth Müller cells with homogeneous and transparent cytoplasm were counted, and a single-cell suspension was prepared. Müller cells were seeded in 96-well plates at a density of 2000 cells/100 μL per well. After I/R injury, glial cell complete medium was replaced with medium containing 10% CCK-8 solution and the cells were incubated at 37°C for 2 hours. Absorbance was measured at a wavelength of 450 nm with a spectrometer (Bio-Rad). Cell viability was calculated as cell viability (%) = absorbance in experimental group/absorbance in control group × 100.
ELISA
The Mouse IL-1β/IL-1F2 Quantikine ELISA Kit and Mouse IL-18 DuoSet ELISA Kit (R&D Systems, Minneapolis, MN, USA) were used to analyze the expression of IL-1β and IL-18, respectively, in retinal tissue and Müller cell supernatants after I/R injury.
Statistical analysis
All experiments were conducted blinded to the grouping. For in vivo experiments, PASS 15.0 software was used for power analysis. One-way was selected to calculate the appropriate sample size with statistical parameters of which power value is 0.9 and alpha value is 0.05. All in vitro experiments were independently repeated three times, and in each of these three biological replicates, three technical replicates were performed. Statistical analyses were performed using GraphPad Prism (version 8.0.0 for Windows, GraphPad Software, San Diego, CA, USA, www.graphpad.com). The Shapiro-Wilk test was used to determine whether the data had a normal distribution. Multiple sample comparisons were performed using one-way analysis of variance followed by Tukey's multiple comparisons test. The data are presented as the mean ± standard deviation. P < 0.05 was considered statistically significant. Statistical values for intergroup comparisons are shown in Additional Table 3.
Additional Table 3.
The list of statistical data in the figures
| F-value | A vs. B | Data | P-value | Notes | |
|---|---|---|---|---|---|
| Figure 2B | F (6, 28) =128.30 | I/R 24 h group vs. sham group | 60.40±7.44 vs. 104.40±5.94 | <0.0001 | |
| Figure 2C | F (6, 14) =46.75 | I/R 24 h group vs. Control group | 45.67±5.51 vs. 100.70±8.02 | <0.0001 | |
| Figure 2F | F (6, 28) =45.2 | I/R 24 h group vs. sham group | 2.72±0.77 vs. 1.08±0.04 | <0.0001 | |
| Figure 2H | F (6, 14) =77.5 | I/R 24 h group vs. Control group | 4.32±0.37 vs. 0.94±0.07 | <0.0001 | |
| Figure 2I | F (6, 28) =193.60 | I/R 24 h group vs. sham group | 7.11±0.31 vs. 1.15±0.24 | <0.0001 | |
| Figure 2J | F (6, 14) =89.36 | I/R 24 h group vs. Control group | 7.78±0.51 vs. 1.05±0.02 | <0.0001 | |
| Figure 3B | F (3, 16) =85.47 | I/R+Homer1a OE group vs. I/R group | 78.40±3.98 vs. 56.20±6.02 | 0.0004 | |
| I/R+Homer1a KD group vs. I/R group | 34.40±3.21 vs. 56.20±6.02 | 0.0005 | |||
| Figure 3D | F (3, 16) =194.90 | I/R+Homer1a OE group vs. I/R group | 0.23±0.04 vs. 0.56±0.08 | <0.0001 | |
| I/R+Homer1a KD group vs. I/R group | 0.88±0.07 vs. 0.56±0.08 | <0.0001 | |||
| Figure 3F | F (3, 8) =48.85 | I/R+Homer1a OE group vs. I/R group | 0.22±0.05 vs. 0.61±0.12 | 0.003 | |
| I/R+Homer1a KD group vs. I/R group | 0.89±0.12 vs. 0.61±0.12 | 0.02 | |||
| Figure 3G | F (3, 8) =45.20 | I/R+Homer1a OE group vs. I/R group | 75±6.56 vs. 49.67±6.43 | 0.0128 | |
| I/R+Homer1a KD group vs. I/R group | 25.67±9.07 vs. 49.67±6.43 | 0.0172 | |||
| Figure 4C | F (3, 16) =1365 | I/R+Homer1a OE group vs. I/R group | 975.80±56.58 vs. 46752±2999 | <0.0001 | |
| I/R+Homer1a KD group vs. I/R group | 194737±10708 vs. 46752±2999 | <0.0001 | |||
| Figure 4D | F (3, 16) =1010 | I/R+Homer1a OE group vs. I/R group | 1296±212.80 vs. 24593±1739 | <0.0001 | |
| I/R+Homer1a KD group vs. I/R group | 80556±4969 vs. 24593±1739 | <0.0001 | |||
| Figure 4E | F (3, 16) =242.40 | I/R+Homer1a OE group vs. I/R group | 1400±241.40 vs. 3862±535.50 | <0.0001 | |
| I/R+Homer1a KD group vs. I/R group | 5667±157.10 vs. 3862±535.50 | <0.0001 | |||
| Figure 4F | F (3, 16) =687.30 | I/R+Homer1a OE group vs. I/R group | 749.40±68.86 vs. 4301±197.60 | 0.0006 | |
| I/R+Homer1a KD group vs. I/R group | 27629±2209 vs. 4301±197.60 | <0.0001 | |||
| Figure 4G | F (3, 16) =275 | I/R+Homer1a OE group vs. I/R group | 1020±89.91 vs. 10734±892.20 | <0.0001 | |
| I/R+Homer1a KD group vs. I/R group | 13420±1551 vs. 10734±892.20 | 0.0012 | |||
| Figure 5B | F (3, 16) =165.3 | I/R+Homer1a OE group vs. I/R group | 1.31±0.13 vs. 1.96±0.13 | <0.0001 | Caspase-8 |
| I/R+Homer1a KD group vs. I/R group | 2.81±0.18 vs. 1.96±0.13 | <0.0001 | |||
| Figure 5C | F (3, 16) =102.8 | I/R+Homer1a OE group vs. I/R group | 1.38±0.14 vs. 1.91±0.31 | 0.0186 | NLRP3 |
| I/R+Homer1a KD group vs. I/R group | 3.52±0.32 vs. 1.91±0.31 | <0.0001 | |||
| Figure 5D | F (3, 16) =47.98 | I/R+Homer1a OE group vs. I/R group | 1.32±0.10 vs. 1.74±0.15 | 0.0261 | ASC |
| I/R+Homer1a KD group vs. I/R group | 2.40±0.36vs. 1.74±0.15 | 0.0006 | |||
| Figure 5E | F (3, 16) =284.5 | I/R+Homer1a OE group vs. I/R group | 1.50±0.12 vs. 2.27±0.15 | <0.0001 | Cleaved Caspase-1/Caspase-1 |
| I/R+Homer1a KD group vs. I/R group | 3.87±0.24 vs. 2.27±0.15 | <0.0001 | |||
| Figure 5G | F (3, 8) =49.44 | I/R+Homer1a OE group vs. I/R group | 1.43±0.08 vs. 1.84±0.09 | 0.0391 | Caspase-8 |
| I/R+Homer1a KD group vs. I/R group | 2.43±0.27 vs. 1.84±0.09 | 0.0055 | |||
| Figure 5H | F (3, 8) =80.67 | I/R+Homer1a OE group vs. I/R group | 1.68±0.25 vs. 2.34±0.12 | 0.0053 | NLRP3 |
| I/R+Homer1a KD group vs. I/R group | 2.89±0.14 vs. 2.34±0.12 | 0.0136 | |||
| Figure 5I | F (3, 8) =49.91 | I/R+Homer1a OE group vs. I/R group | 1.35±0.12 vs. 1.73±0.05 | 0.0233 | ASC |
| I/R+Homer1a KD group vs. I/R group | 2.14±0.20 vs. 1.73±0.05 | 0.0166 | |||
| Figure 5J | F (3, 8) =51.39 | I/R+Homer1a OE group vs. I/R group | 1.61±0.15 vs. 2.24±0.27 | 0.0128 | Cleaved Caspase-1/Caspase-1 |
| I/R+Homer1a KD group vs. I/R group | 2.77±0.11 vs. 2.24±0.27 | 0.0341 | |||
| Figure 7A | F (3, 16) =111.30 | I/R+Homer1a OE group vs. I/R group | 821.80±53.12 vs. 1123±178 | 0.0017 | |
| I/R+Homer1a KD group vs. I/R group | 1756±93.16 vs. 1123±178 | <0.0001 | |||
| Figure 7B | F (3, 16) =324.10 | I/R+Homer1a OE group vs. I/R group | 1081±51.21 vs. 1674±148.50 | <0.0001 | |
| I/R+Homer1a KD group vs. I/R group | 2776±139.70 vs. 1674±148.50 | <0.0001 | |||
| Figure 7C | F (3, 8) =434.50 | I/R+Homer1a OE group vs. I/R group | 951.70±22.48 vs. 1538±135.80 | 0.0002 | |
| I/R+Homer1a KD group vs. I/R group | 3110±95.63 vs. 1538±135.80 | <0.0001 | |||
| Figure 7D | F (3, 8) =508.50 | I/R+Homer1a OE group vs. I/R group | 972.30±62.00 vs. 1582±26.16 | 0.0001 | |
| I/R+Homer1a KD group vs. I/R group | 3108±106.30 vs. 1582±26.16 | <0.0001 | |||
| Figure 7F | F (3, 16) =149.7 | I/R+Homer1a OE group vs. I/R group | 1.68±0.13 vs. 2.10±0.21 | 0.0118 | Cleaved-IL-1β/IL-1β |
| I/R+Homer1a KD group vs. I/R group | 3.40±0.23 vs. 2.10±0.21 | <0.0001 | |||
| Figure 7G | F (3, 16) =61.75 | I/R+Homer1a OE group vs. I/R group | 1.34±0.11 vs. 1.67±0.21 | 0.0231 | Cleaved-IL-18/IL-18 |
| I/R+Homer1a KD group vs. I/R group | 2.32±0.14 vs. 1.67±0.21 | <0.0001 | |||
| Figure 7I | F (3, 8) =69.76 | I/R+Homer1a OE group vs. I/R group | 1.50±0.15 vs. 2.38±0.19 | 0.0014 | Cleaved-IL-1β/IL-1β |
| I/R+Homer1a KD group vs. I/R group | 2.89±0.23 vs. 2.38±0.19 | 0.0305 | |||
| Figure 7J | F (3, 8) =246.7 | I/R+Homer1a OE group vs. I/R group | 1.35±0.06 vs. 1.80±0.06 | 0.0016 | Cleaved-IL-18/IL-18 |
| I/R+Homer1a KD group vs. I/R group | 2.91±0.15 vs. 1.80±0.06 | <0.0001 | |||
| Figure 7K | F (3, 16) =1389 | I/R+Homer1a OE group vs. I/R group | 2.02±0.14 vs. 3.97±0.09 | <0.0001 | |
| I/R+Homer1a KD group vs. I/R group | 6.07±0.18 vs. 3.97±0.09 | <0.0001 | |||
| Figure 7L | F (3, 16) =164.2 | I/R+Homer1a OE group vs. I/R group | 1.95±0.60 vs. 3.76±0.33 | <0.0001 | |
| I/R+Homer1a KD group vs. I/R group | 5.83±0.27 vs. 3.76±0.33 | <0.0001 | |||
| Figure 7M | F (3, 8) =1188 | I/R+Homer1a OE group vs. I/R group | 1.97±0.10 vs. 4.01±0.15 | <0.0001 | |
| I/R+Homer1a KD group vs. I/R group | 5.98±0.08 vs. 4.01±0.15 | <0.0001 | |||
| Figure 7N | F (3, 8) =55.43 | I/R+Homer1a OE group vs. I/R group | 2.04±0.24 vs. 4.16±0.32 | 0.0041 | |
| I/R+Homer1a KD group vs. I/R group | 5.89±0.93 vs. 4.16±0.32 | 0.0132 | |||
| Figure 8B | F (6, 28) =63.83 | I/R 24 h group vs. sham group | 2.35±0.11 vs. 1.04±0.08 | <0.0001 | |
| Figure 8E | F (6, 28) =472.50 | I/R 24 h group vs. sham group | 7.11±0.24 vs. 1.22±0.22 | <0.0001 | |
| Figure 8D | F (6, 14) =249.1 | I/R 24 h group vs. Control group | 3.46±0.11 vs. 1.00±0.03 | <0.0001 | |
| Figure 8F | F (6, 14) =139.60 | I/R 24 h group vs. Control group | 8.35±0.33 vs. 0.97±0.09 | <0.0001 | |
| Figure 8H | F (3, 16) =35.23 | I/R+Homer1a OE group vs. I/R group | 1.42±0.17 vs. 1.73±0.14 | 0.0452 | |
| I/R+Homer1a KD group vs. I/R group | 2.06±0.16 vs. 1.73±0.14 | 0.0337 | |||
| Figure 8J | F (3, 8) =97.66 | I/R+Homer1a OE group vs. I/R group | 1.27±0.04 vs. 1.47±0.07 | 0.0151 | |
| I/R+Homer1a KD group vs. I/R group | 1.83±0.08 vs. 1.47±0.07 | 0.0004 | |||
| Figure 8L | F (3, 16) =78.07 | I/R+Homer1a OE group vs. I/R group | 1.47±0.07 vs. 1.76±0.12 | 0.0482 | Cytoplasm |
| I/R+Homer1a KD group vs. I/R group | 2.51±0.25 vs. 1.76±0.12 | <0.0001 | |||
| Figure 8N | F (3, 16) =278 | I/R+Homer1a OE group vs. I/R group | 1.39±0.24vs. 2.98±0.15 | <0.0001 | Nucleus |
| I/R+Homer1a KD group vs. I/R group | 4.93±0.26 vs. 2.98±0.15 | <0.0001 | |||
| Figure 8P | F (3, 8) =79.06 | I/R+Homer1a OE group vs. I/R group | 1.25±0.05 vs. 1.52±0.09 | 0.0084 | Cytoplasm |
| I/R+Homer1a KD group vs. I/R group | 1.87±0.10 vs. 1.52±0.09 | 0.0017 | |||
| Figure 8R | F (3, 8) =55.28 | I/R+Homer1a OE group vs. I/R group | 1.28±0.09 vs. 1.65±0.07 | 0.0254 | Nucleus |
| I/R+Homer1a KD group vs. I/R group | 2.21±10.21 vs. 1.65±0.07 | 0.0022 | |||
| Figure 9B | F (2, 12) =48.47 | I/R+NF-κB inh group vs. I/R group | 1.41±0.10 vs. 1.81±0.12 | 0.0005 | NLRP3 |
| Figure 9C | F (2, 12) = 11.00 | I/R+NF-κB inh group vs. I/R group | 1.16±0.16 vs. 1.49±0.15 | 0.0195 | Cleaved-IL-1β/IL-1β |
| Figure 9D | F (2, 12) = 7.098 | I/R+NF-κB inh group vs. I/R group | 1.46±0.28 vs. 1.48±0.19 | 0.9878 | Caspase-8 |
| Figure 9E | F (2, 12) = 62.64 | I/R+NF-κB inh group vs. I/R group | 1.24±0.12 vs. 2.12±0.19 | <0.0001 | Cleaved-IL-18/IL-18 |
| Figure 9G | F (2, 6) =94.97 | I/R+NF-κB inh group vs. I/R group | 1.42±0.11 vs. 1.88±0.08 | 0.0014 | NLRP3 |
| Figure 9H | F (2, 6) = 304.1 | I/R+NF-κB inh group vs. I/R group | 1.43±0.05 vs. 2.38±0.10 | <0.0001 | Cleaved-IL-1β/IL-1β |
| Figure 9I | F (2, 6) = 29.62 | I/R+NF-κB inh group vs. I/R group | 1.74±0.13 vs. 1.54±0.12 | 0.1608 | Caspase-8 |
| Figure 9J | F (2, 6) = 40.26 | I/R+NF-κB inh group vs. I/R group | 1.26±0.45 vs. 2.89±0.09 | 0.0009 | Cleaved-IL-18/IL-18 |
| Figure 9L | F (2, 12) = 26.44 | I/R+Caspase-8 inh group vs. I/R group | 1.43±0.09 vs. 1.74±0.22 | 0.0189 | |
| Figure 9N | F (2, 6) = 61.86 | I/R+Caspase-8 inh group vs. I/R group | 1.34±0.06 vs. 1.91±0.03 | 0.0007 | |
| Figure 10E | F (4, 20) =135.90 | I/R+ NF-κB inh group vs. I/R group | 0.28±0.02 vs. 0.61±0.05 | <0.0001 | |
| I/R+Homer1a protein group vs. I/R group | 0.304±0.019 vs. 0.612±0.051 | <0.0001 | |||
| I/R+both group vs. I/R group | 0.15±0.04 vs. 0.61±0.05 | <0.0001 | |||
| I/R+ NF-κB inh group vs. I/R+both group | 0.28±0.02 vs. 0.15±0.04 | 0.0001 | |||
| I/R+Homer1a protein group vs. I/R+both group | 0.30±0.02 vs. 0.15±0.04 | <0.0001 | |||
| Figure 10F | F (4, 10) =83.73 | I/R+ NF-κB inh group vs. I/R group | 0.29±0.05 vs. 0.61±0.06 | <0.0001 | |
| I/R+Homer1a protein group vs. I/R group | 0.31±0.03 vs. 0.61±0.06 | <0.0001 | |||
| I/R+both group vs. I/R group | 0.11±0.01 vs. 0.61±0.06 | <0.0001 | |||
| Figure 10G | F (4, 20) =43.52 | I/R+ NF-κB inh group vs. I/R group | 70.40±6.66 vs. 46.40±4.04 | 0.0003 | |
| I/R+Homer1a protein group vs. I/R group | 70.60±7.34 vs. 46.40±4.04 | 0.0003 | |||
| I/R+both group vs. I/R group | 90.60±4.93 vs. 46.40±4.04 | <0.0001 | |||
| I/R+ NF-κB inh group vs. I/R+both group | 70.40±6.66 vs. 90.60±4.93 | 0.0022 | |||
| I/R+Homer1a protein group vs. I/R+both group | 70.60±7.34 vs. 90.60±4.93 | 0.0025 | |||
| Additional Figure 2A (6MB, tif) | F (5, 24) = 1783 | AAV2/DJ-Homer1a group vs. NC1 group | 5.50±0.21 vs. 0.95±0.03 | <0.0001 | |
| AAV2/DJ-Homer1a-RNAi-1 vs. NC2 group | 0.38±0.10 vs. 0.99±0.06 | <0.0001 | |||
| AAV2/DJ-Homer1a-RNAi-2 vs. NC2 group | 0.80±0.06 vs. 0.99±0.06 | 0.0589 | |||
| AAV2/DJ-Homer1a-RNAi-3 vs. NC2 group | 0.76±0.06 vs. 0.99±0.06 | 0.0129 | |||
| Additional Figure 2F (6MB, tif) | F (5, 12) = 236.40 | LV-Homer1a group vs. NC1group | 6.09±0.57 vs. 1.05±0.05 | <0.0001 | |
| LV-Homer1a-RNAi-1 vs. NC2 group | 0.20±0.08 vs. 0.96±0.13 | 0.03 | |||
| LV-Homer1a-RNAi-2 vs. NC2 group | 0.77±0.08 vs. 0.96±0.13 | 0.93 | |||
| LV-Homer1a-RNAi-3 vs. NC2 group | 0.72±0.11 vs. 0.96±0.13 | 0.84 | |||
| Additional Figure 3A (5.6MB, tif) | F (3, 16) =83.23 | I/R group vs. Sham group | 0.46±0.06 vs. 0.01±0.00 | <0.0001 | |
| I/R+Homer1a OE group vs. I/R group | 0.09±0.00 vs. 0.46±0.06 | <0.0001 | |||
| I/R+Homer1a KD group vs. I/R group | 0.65±0.14 vs. 0.46±0.06 | 0.0041 | |||
| Additional Figure 3B (5.6MB, tif) | F (3, 16) =206.40 | I/R group vs. Sham group | 0.37±0.05 vs. 0.01±0.00 | <0.0001 | |
| I/R+Homer1a OE group vs. I/R group | 0.11±0.01 vs. 0.37±0.05 | <0.0001 | |||
| I/R+Homer1a KD group vs. I/R group | 0.78±0.09 vs. 0.37±0.05 | <0.0001 | |||
| Additional Figure 3C (5.6MB, tif) | F (3, 16) =1052 | I/R group vs. Sham group | 0.45±0.04 vs. 0.01±0.00 | <0.0001 | |
| I/R+Homer1a OE group vs. I/R group | 0.12±0.00 vs. 0.45±0.04 | <0.0001 | |||
| I/R+Homer1a KD group vs. I/R group | 0.86±0.03 vs. 0.45±0.04 | <0.0001 | |||
| Additional Figure 3D (5.6MB, tif) | F (3, 16) =400.60 | I/R group vs. Sham group | 0.56±0.07 vs. 0.01±0.00 | <0.0001 | |
| I/R+Homer1a OE group vs. I/R group | 0.09±0.01 vs. 0.56±0.07 | <0.0001 | |||
| I/R+Homer1a KD group vs. I/R group | 0.87±0.06 vs. 0.56±0.07 | <0.0001 | |||
| Additional Figure 3E (5.6MB, tif) | F (3, 8) =100.70 | I/R group vs. Control group | 0.71±0.08 vs. 0.01±0.00 | <0.0001 | |
| I/R+Homer1a OE group vs. I/R group | 0.52±0.09 vs. 0.71±0.08 | 0.04 | |||
| I/R+Homer1a KD group vs. I/R group | 0.99±0.08 vs. 0.71±0.08 | 0.01 | |||
| Additional Figure 3F (5.6MB, tif) | F (3, 8) =644.80 | I/R group vs. Control group | 0.87±0.02 vs. 0.01±0.00 | <0.0001 | |
| I/R+Homer1a OE group vs. I/R group | 0.50±0.05 vs. 0.87±0.02 | <0.0001 | |||
| I/R+Homer1a KD group vs. I/R group | 1.00±0.04 vs. 0.87±0.02 | 0.02 | |||
| Additional Figure 3G (5.6MB, tif) | F (3, 8) =338.60 | I/R group vs. Control group | 0.87±0.04 vs. 0.01±0.00 | <0.0001 | |
| I/R+Homer1a OE group vs. I/R group | 0.50±0.04 vs. 0.87±0.04 | <0.0001 | |||
| I/R+Homer1a KD group vs. I/R group | 1.00±0.07 vs. 0.87±0.04 | 0.01 | |||
| Additional Figure 3H (5.6MB, tif) | F (3, 8) =353.00 | I/R group vs. Control group | 0.56±0.03 vs. 0.01±0.00 | <0.0001 | |
| I/R+Homer1a OE group vs. I/R group | 0.37±0.06 vs. 0.56±0.03 | 0.0005 | |||
| I/R+Homer1a KD group vs. I/R group | 0.86±0.01 vs. 0.56±0.03 | <0.0001 | |||
| Additional Figure 4B (4.1MB, tif) | F (3, 16) =1.438 | NF-B inh group vs. Sham group | 96.20±3.56 vs. 100.00±2.35 | 0.3096 | |
| Homer1a protein group vs. Sham group | 95.20±4.09 vs. 100.00±2.35 | 0.1595 | |||
| both group vs. Sham group | 97.40±4.98 vs. 100.00±2.35 | 0.5923 | |||
| Additional Figure 4C (4.1MB, tif) | F (3, 8) =1.455 | NF-B inh group vs. Control group | 96.00±1.73 vs. 98.67±1.53 | 0.254 | |
| Homer1a protein group vs. Control group | 96.33±1.16 vs. 98.67±1.53 | 0.3418 | |||
| both group vs. Control group | 96.00±2.65 vs. 98.67±1.53 | 0.254 |
Results
Retinal tissue and Müller cells are damaged, and the transcription and translation levels of Homer1a peaked at 24 hours after I/R injury
To investigate the effect of I/R injury on the retina and Müller cells at different time points, retinal thickness and Müller cell viability were examined after I/R injury. Hematoxylin-eosin staining showed that compared with that in the sham group, retinal thickness began to decrease at 4 hours and had decreased by half at 24 hours after reperfusion (Figure 2A and B). In vitro experiments showed that Müller cell viability was decreased by half compared with that in the control group (Figure 2C) and Müller cell body size shrank and became round (Figure 2D) at 24 hours after I/R injury.
Figure 2.

Homer1a may be associated with damage to the retina after retinal I/R injury.
(A) Representative image showing hematoxylin-eosin staining of ischemic retinal tissue after reperfusion. As the reperfusion time increased, retinal thickness gradually decreased. Arrows indicate the measured thickness. Scale bars: 100 μm. (B) Quantification of the mean thickness in A. (C) CCK-8 assays showing the viability of Müller cells after reperfusion. (D) Representative light microscopy images of the control and I/R 24 hours (24 h) groups. Arrows in the control group indicate normal Müller cells and arrows in the I/R 24 h group indicate injured Müller cells. Müller cells shrank and became round after I/R. Scale bars: 20 μm. (E) Representative blots showing retinal Homer1a expression after reperfusion. (F) Quantification of E. (G) Representative blots showing Müller cell Homer1a expression after reperfusion. (H) Quantification of G. (I, J) Real-time polymerase chain reaction was used to measure Homer1a mRNA levels in retinal tissue (I) and Müller cells (J) at each time point after reperfusion. The data were normalized to sham group or control group, respectively. GAPDH was used as an internal control. The data are expressed as the mean ± SD. There were five mice per group in the in vivo study and each in vitro experiment was repeated three times. *P < 0.05, **P < 0.01, ***P < 0.001, ****P < 0.0001 (one-way analysis of variance followed by Tukey's multiple comparisons test). CCK-8: Cell Counting Kit-8; ELM: external limiting membrane; GAPDH: glyceraldehyde-3-phosphate dehydrogenase; GCL: ganglion cell layer; Homer1: homer scaffold protein 1; I/R: ischemia/reperfusion; INL: inner nuclear layer; IPL: inner plexiform layer; NFL: nerve fiber layer; ns: no significant difference; ONL: outer nuclear layer; OPL: outer plexiform layer; RPE: retinal pigment epithelium.
To investigate the changes in Homer1a expression, the transcriptional and translational levels of Homer1a were detected at different time points after reperfusion. Western blotting showed that the expression of Homer1a was increased at 4 hours and peaked at 24 hours after reperfusion in vivo (Figure 2E and F) and in vitro (Figure 2G and H). The changes in Homer1a mRNA expression were consistent with the changes in protein levels, peaking at 24 hours after reperfusion both in vivo (Figure 2I) and in vitro (Figure 2J). Therefore, reperfusion for 24 hours was used in subsequent in vivo and in vitro experiments. These results suggest that changes in Homer1a expression may be associated with retinal damage after I/R injury.
Homer1a protects against damage to retinal tissue and Müller cells after I/R injury
To examine the role of Homer1a, Homer1a OE and Homer1a KD mice were successfully constructed by infecting the mice retina with AAVs, and the efficiency of the virus was verified by RT-PCR, western blotting and fluorescence analysis (Additional Figure 2A–E (6MB, tif) ). In addition, Homer1a OE and Homer1a KD Müller cells were successfully constructed using lentiviral vectors, and the efficiency of the virus was verified (Additional Figure 2F–J (2.9MB, tif) ). Hematoxylin-eosin staining of retinal paraffin sections showed that retinal thickness was significantly increased in the I/R + Homer1a OE group but was decreased in the I/R + Homer1a KD group compared with that in the I/R group at 24 hours after reperfusion (Figure 3A and B). TUNEL analysis showed that the number of apoptotic retinal cells in Homer1a OE mice after I/R injury was significantly less than that in Homer1a KD mice (Figure 3C and D). In vitro, the TUNEL assay showed that compared with that in the I/R group, the number of apoptotic cells was decreased in the Homer1a OE group and increased in the Homer1a KD group after I/R injury (Figure 3E and F). The CCK-8 results also confirmed that Homer1a OE alleviated the decrease in cell viability after I/R injury, whereas Homer1a KD worsened viability (Figure 3G). These results preliminarily showed that the decrease in retinal tissue thickness and the increase in Müller cell apoptosis after I/R injury were alleviated by Homer1a.
Figure 3.

Homer1a protects against damage to retinal tissue and Müller cells after retinal I/R injury.
(A) Representative image of hematoxylin-eosin staining in ischemic retinal tissue. Homer1a overexpression reversed the decrease in retinal thickness caused by I/R in mice. Arrows indicate the measured thickness. Scale bars: 100 μm. (B) Quantification of retinal thickness in A. (C) Representative TUNEL staining image of apoptosis in retinal tissue. Homer1a overexpression reversed the apoptosis rate of mouse retinal cells induced by I/R. Arrows indicate apoptotic cells. Scale bars: 50 μm. (D) Quantification of apoptosis rate in C. (E) Representative TUNEL staining image of apoptosis in Müller cells. Homer 1a overexpression reversed the apoptosis rate of Müller cells induced by I/R. Arrows indicate apoptotic cells. Scale bars: 100 μm. (F) Quantification of apoptosis rate in E. (G) CCK-8 assays showing the viability of Müller cells. The data are expressed as the mean ± SD. There were five mice per group in the in vivo study and each in vitro experiment was repeated three times. *P < 0.05, **P < 0.01, ***P < 0.001, ****P < 0.0001 (one-way analysis of variance followed by Tukey's multiple comparisons test). CCK-8: Cell Counting Kit-8; DAPI: 4′,6-diamidino-2-phenylindole; ELM: external limiting membrane; GCL: ganglion cell layer; Homer1: homer scaffold protein 1; I/R: ischemia/reperfusion; INL: inner nuclear layer; IPL: inner plexiform layer; KD: knock-down; NFL: nerve fiber layer; OE: overexpression; ONL: outer nuclear layer; OPL: outer plexiform layer; RPE: retinal pigment epithelium; TUNEL: terminal deoxynucleotidyl transferase dUTP nick end labeling.
Homer1a overexpression reduces expression of inflammatory factors after retinal I/R injury
The inflammatory response is induced by retinal I/R injury and is one of the main causes of poor disease prognosis (Lin et al., 2019). It has been shown that Homer1a is a promising therapeutic target in the treatment of chronic inflammatory pain (Tappe et al., 2006). To investigate whether Homer1a plays a protective role by regulating inflammatory factors after retinal I/R injury, an unbiased inflammatory gene array containing 200 test indicators was used to determine the expression levels of inflammatory factors in mice retinal tissue. The results showed that basic fibroblast growth factor (bFGF), chemokine (C-X-C motif) ligand 1 (KC/CXCL1), macrophage colony stimulating factor (M-CSF), tumor necrosis factor receptor 1 (TNFR1/TNFRSF1A) and tumor necrosis factor receptor 2 (TNFR11/TNFRSF1B) had the largest changes between the four groups (Figure 4A and B). Compared with those in the I/R group, the expression of these five inflammatory factors was higher in the I/R + Homer1a KD group and lower in the I/R + Homer1a OE group (Figure 4C–G). This finding suggested that Homer1a may play a protective role by decreasing the expression of bFGF, KC/CXCL1, M-CSF, TNFR1/TNFRSF1A, and TNFR11/TNFRSF1B after retinal I/R injury.
Figure 4.
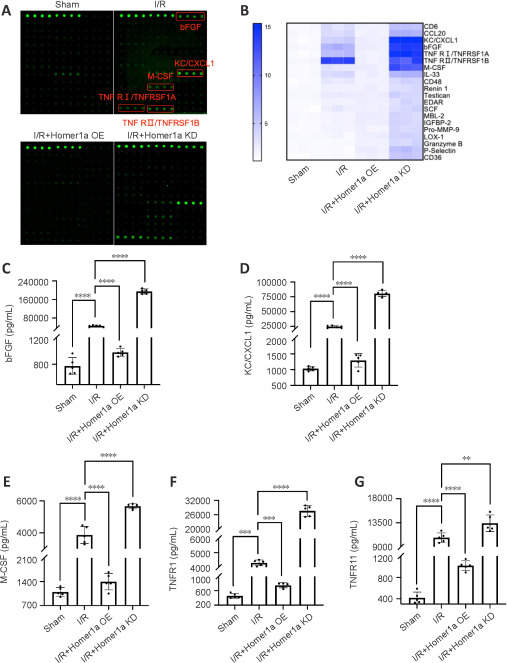
Expression of inflammatory factors after retinal I/R injury is regulated by Homer1a.
(A) Cytokine array analysis of retinal tissue obtained from the different groups. Green dots represent four duplicate detections of one indicator per sample. (B) Heatmap showing the expression of inflammatory factors. (C–G) Quantification of the expression of inflammatory factors in B. The data are expressed as the mean ± SD. n = 5 mice per group. **P < 0.01, ***P < 0.001, ****P < 0.0001 (one-way analysis of variance followed by Tukey's multiple comparisons test). bFGF: Basic fibroblast growth factor; Homer1: homer scaffold protein 1; I/R: ischemia/reperfusion; KC/CXCL1: chemokine (C-X-C motif) ligand 1; KD: knock-down; M-CSF: macrophagecolony stimulating factor; OE: overexpression; TNFR1/TNFRSF1A: tumor necrosis factor receptor 1; TNFR11/TNFRSF1B: tumor necrosis factor receptor 2.
Homer1a inhibits the activation of NLRP3 and caspase-8 inflammasomes after I/R injury
The NLRP3 inflammasome plays an important role in inflammation and immunity. An imbalance in NLRP3 inflammasome activity leads to the release of proinflammatory factors (M-CSF, bFGF, TNFR1/TNFRSF1A, TNFR11/TNFRSF1B) and chemokines (KC/CXCL1) (Peeters et al., 2013; Furuya et al., 2018; Yu et al., 2019; Gaul et al., 2021). In addition, caspase-8 has been reported to mediate nonapoptotic functions in retinal I/R injury (Chi et al., 2015). The classical NLRP3 inflammasome and nonclassical caspase-8 inflammasome coordinate the balance of proinflammatory and anti-inflammatory mediators (Chi et al., 2014). To investigate the above-mentioned inflammatory factors mediated by the NLRP3 and caspase-8 inflammasome pathways, we examined the expression levels of NLRP3 and caspase-8 inflammasome-related proteins in the retinal tissue of mice after retinal I/R injury. Western blotting showed that compared with those in the I/R group, caspase-8, NLRP3, and ASC protein levels and caspase-1 activation were significantly reduced in the Homer1a OE group, whereas caspase-8, NLRP3, and ASC protein levels and caspase-1 activation were significantly increased in the Homer1a KD group (Figure 5A–E). The expression levels of the same proteins were also determined in Homer1a OE and Homer1a KD Müller cells (Figure 5F–J) and the results were consistent with those in vivo. This finding suggested that Homer1a may play a protective role by inhibiting the activation of NLRP3 and caspase-8 inflammasomes.
Figure 5.

Homer1a inhibits the activation of NLRP3 and caspase-8 inflammasomes after retinal I/R injury.
(A–J) Representative blots and quantification showing the expression levels of caspase-8, NLRP3, ASC, caspase-1 and cleaved caspase-1 in retinal tissue (A–E) and Müller cells (F–J). GAPDH was used as an internal control. The data are expressed as the mean ± SD. There are five mice detected in each group in in vivo study and each in vitro experiment was repeated three times. **P < 0.01, ***P < 0.001, ****P < 0.0001 (one-way analysis of variance followed by Tukey's multiple comparisons test). ASC: Apoptosis-associated speck-like protein containing a caspase recruitment domain; GAPDH: glyceraldehyde-3-phosphate dehydrogenase; Homer1: homer scaffold protein 1; I/R: ischemia/reperfusion; KD: knock-down; NLRP3: NACHT-LRR-PYD domain protein 3; OE: overexpression.
The adaptor protein ASC activates downstream cascades after binding to NLRP3 and caspase-8 (Fritsch et al., 2019; Newton et al., 2019). To determine whether Homer1a plays an anti-inflammatory role by regulating the binding of NLRP3 and caspase-8 to ASC, coimmunoprecipitation was performed to examine the binding of NLRP3, caspase-8, and ASC. Because the above results showed that NLRP3, caspase-8 and ASC expression differed between the treatment groups (Figure 5A and F), sample loading between groups was adjusted such that the protein levels of NLRP3, caspase-8, and ASC were consistent to ensure comparability of the results. The coimmunoprecipitation results showed that the binding of caspase-8 and NLRP3 to ASC was increased in the Homer1a KD group, whereas binding was inhibited in the Homer1a OE group in vivo (Figure 6A–D and Additional Figure 3A–D (5.6MB, tif) ) and in vitro (Figure 6E–H and Additional Figure 3E–H (5.6MB, tif) ). These data indicated that both the classical NLRP3 inflammasome and the nonclassical caspase-8 inflammasome were activated after I/R injury and were regulated by Homer1a.
Figure 6.

Formation of NLRP3 and caspase-8 inflammasomes is regulated by Homer1a after retinal I/R injury.
(A, B) Binding of ASC and caspase-8 in retinal tissue. (C, D) Binding of ASC and NLRP3 in retinal tissue. (E, F) Binding of ASC and caspase-8 in Müller cells. (G, H) Binding of ASC and NLRP3 in Müller cells. GAPDH was used as an internal control. The quantitative results were shown in Additional Figure 3 (5.6MB, tif) . There were five mice per group in the in vivo study and each in vitro experiment was repeated three times. ASC: Apoptosis-associated speck-like protein containing a caspase recruitment domain; GAPDH: glyceraldehyde-3-phosphate dehydrogenase; Homer1: homer scaffold protein 1; I/R: ischemia/reperfusion; IP: immunoprecipitation; KD: knock-down; NLRP3: NACHT-LRR-PYD domain protein 3; OE: overexpression.
Homer1a inhibits the processing of IL-1β and IL-18 after I/R injury
The expression of IL-1β and IL-18, which are downstream cytokines induced by the NLRP3 and caspase-8 inflammasomes, reflects the severity of inflammation (Zhang et al., 2017). Compared with that in the I/R group, IL-1β and IL-18 expression was significantly decreased in the I/R + Homer1a OE group and was significantly increased in the I/R + Homer1a KD group (Figure 7A and B). ELISA analysis of Müller cell supernatants yielded similar results (Figure 7C and D). In addition, Homer1a KD increased the expression of cleaved IL-1β/IL-1β and cleaved IL-18/IL-18 after I/R injury in vivo and in vitro (Figure 7E–J). Finally, the mRNA levels of IL-1β and IL-18 were consistent with their protein levels (Figure 7K–N). These results indicated that Homer1a inhibited the processing of IL-1β and IL-18 by suppressing the formation of NLRP3 and caspase-8 inflammasomes.
Figure 7.
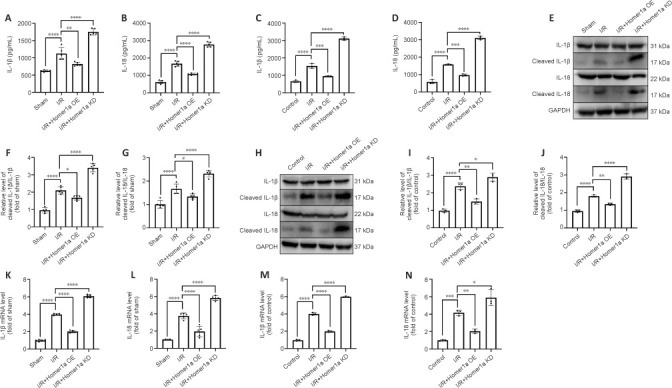
Homer1a inhibits the processing of IL-1β and IL-18 after retinal I/R injury.
(A–D) ELISA analysis of IL-1β and IL-18 levels in retinal tissue (A, B) and Müller cells (C, D). (E–J) Representative blots and quantification showing the expression levels of IL-1β, cleaved IL-1β, IL-18, and cleaved IL-18 in retinal tissue (E–G) and Müller cells (H–J). (K–N) Relative mRNA expression of IL-1β and IL-18 in retinal tissues (K, L) and Müller cells (M, N). GAPDH was used as an internal control. The data are expressed as the mean ± SD. There were five mice per group in the in vivo study and each in vitro experiment was repeated three times. *P < 0.05, **P < 0.01, ***P < 0.001, ****P < 0.0001 (one-way analysis of variance followed by Tukey's multiple comparisons test). ELISA: Enzyme-linked immunosorbent assay; GAPDH: glyceraldehyde-3-phosphate dehydrogenase; Homer1: homer scaffold protein 1; I/R: ischemia/reperfusion; IL: interleukin; KD: knock-down; OE: overexpression.
After I/R injury, Homer1a inhibits the NLRP3 inflammasome, but not the caspase-8 inflammasome, through the NF-κB P65 pathway
NF-κB P65, which plays an important role in the inflammatory immune response, stimulates inflammasome formation and IL-1β and IL-18 secretion after activation (Baeuerle and Henkel, 1994; Baeuerle and Baltimore, 1996). NF-κB P65 expression in retinal tissue and Müller cells was examined at different time points. NF-κB P65 expression changed in a time-dependent manner after I/R injury, with expression peaking at 24 hours after I/R injury (Figure 8A–D). The mRNA levels of NF-κB P65 were consistent with the protein levels (Figure 8E and F). The phosphorylation level of NF-κB P65 in the I/R + Homer1a OE group was lower than that in the I/R group, whereas the phosphorylation level of NF-κB P65 in the I/R + Homer1a KD group was higher than that in the I/R group (Figure 8G and H).
Figure 8.

NF-κB P65 level is regulated by Homer1a after retinal I/R injury.
(A–D) Representative blots and quantification showing the expression levels of NF-κB P65 and P-NF-κB P65Ser536 in retinal tissue (A, B) and Müller cells (C, D) after reperfusion. (E, F) RT-PCR results of NF-κB P65 and P-NF-κB P65Ser536 mRNA levels in retinal tissue (E) and Müller cells (F) after reperfusion. (G, H) Representative blots and quantification of NF-κB P65 and P-NF-κB P65Ser536 expression levels in retinal tissue. (I–L) Representative blots and quantification of NF-κB P65 and P-NF-κB P65Ser536 expression levels in the cytoplasm (I, J) and nucleus (K, L) of retinal tissue. (M, N) Representative blots and quantification of NF-κB P65 and P-NF-κB P65Ser536 expression levels in Müller cells. (O–R) Representative blots and quantification of NF-κB P65 and P-NF-κB P65Ser536 expression levels in the cytoplasm (O, P) and nucleus (Q, R) of Müller cells. GAPDH or H3 was used as an internal control. The data are expressed as the mean ± SD. There were five mice per group in the in vivo study and each in vitro experiment was repeated three times. *P < 0.05, **P < 0.01, ***P < 0.001, ****P < 0.0001 (one-way analysis of variance followed by Tukey's multiple comparisons test). GAPDH: Glyceraldehyde-3-phosphate dehydrogenase; Homer1: homer scaffold protein 1; I/R: ischemia/reperfusion; KD: knock-down; NF-κB: nuclear factor κB; ns: no significant difference; OE: overexpression.
NF-κB P65, which is a nuclear transcription factor, plays a regulatory role in the nucleus (Vermeulen et al., 2002). To investigate whether Homer1a affected the subcellular localization of NF-κB P65 in cells, nuclear and cytoplasmic protein extraction kits were used to separate cytoplasmic and nuclear proteins, respectively, and NF-κB P65 expression was examined in the different fractions. NF-κB P65 expression in the nucleus was significantly higher in the Homer1a KD group and was significantly lower in the Homer1a OE group than in the I/R group. These data suggested that knocking down Homer1a activated the nuclear translocation of NF-κB P65 after retinal I/R injury (Figure 8I–L). We also performed the same component assay at the cellular level, and the results were consistent with those of the in vitro experiments (Figure 8M–R).
The above results suggested that Homer1a regulated inflammasome activation and promoted the nuclear translocation of NF-κB P65. To investigate whether inflammasomes were affected by NF-κB P65, NF-κB p65 inhibitor JSH-23 and caspase-8 inhibitor Z-IETD-fmk were used (Shin et al., 2004). JSH-23 administration significantly decreased NLRP3 activation and the production and maturation of IL-1β and IL-18 after retinal I/R injury, but did not affect the protein level of caspase-8 (Figure 9A–E). Z-IETD-fmk significantly inhibited the phosphorylation level of NF-κB P65 after I/R injury in vivo (Figure 9F and G). In addition, pretreatment of Müller cells with 10 μM JSH-23 or Z-IETD-fmk for 12 hours showed consistent results after I/R injury (Figure 9H–N). Taken together, these data suggest that caspase-8 is located upstream of NF-κB P65 and activates NF-κB P65, which induces NLRP3 inflammasome formation and the production and processing of IL-1β and IL-18 after I/R injury.
Figure 9.

JSH-23 decreases the activation of NLRP3 but does not affect the expression level of caspase-8.
(A–E) Representative blots and quantification showing the expression levels of NLRP3, IL-1β, cleaved IL-1β, IL-18, caspase-8 and cleaved IL-18 in retinal tissue. (F, G) Representative blots and quantification of NF-κB P65 and P-NF-κB P65Ser536 expression levels in retinal tissue after caspase-8 inh treatment. (H–L) Representative blots and quantification of NLRP3, IL-1β, cleaved IL-1β, IL-18, caspase-8, and cleaved IL-18 expression levels in Müller cells. (M, N) Representative blots and quantification of NF-κB P65 and P-NF-κB P65Ser536 expression levels in Müller cells after caspase-8 inh treatment. GAPDH was used as an internal control. The data are expressed as the mean ± SD. There were five mice per group in the in vivo study and each in vitro experiment was repeated three times. *P < 0.05, **P < 0.01, ***P < 0.001, ****P < 0.0001 (one-way analysis of variance followed by Tukey's multiple comparisons test). GAPDH: Glyceraldehyde-3-phosphate dehydrogenase; I/R: ischemia/reperfusion; IL: interleukin; inh: inhibitor; JSH-23: a NF-κB-P65 inhibitor; KD: knock-down; NF-κB: nuclear factor κB; NLRP3: NACHT-LRR-PYD domain protein 3; ns: no significant difference; OE: overexpression.
Homer1a protein plus JSH-23 alleviates the reduction in retinal thickness and apoptosis in Müller cells after I/R injury
JSH-23 decreases inflammatory mediators and protects the retina during diabetes (Homme et al., 2021). On the basis of our results above, we hypothesized that retinal damage could be alleviated by the combination of Homer1a protein and JSH-23. First, the drug toxicity of the Homer1a protein and JSH-23 was examined by hematoxylin-eosin staining and CCK-8 assay. The use of Homer1a protein and JSH-23 alone or in combination had no adverse effects on retinal tissues (Additional Figure 4A (4.1MB, tif) and B (4.1MB, tif) ) and did not alter Müller cell viability (Additional Figure 4C (4.1MB, tif) ). To confirm the neuroprotective effect of Homer1a, Homer1flox/−/Homer1a+/−/Nestin-Cre+/− mice were generated and subjected to genetic identification by PCR (Figure 10A). Homer1flox/−/Homer1a+/−/Nestin-Cre+/− mice were intravitreally injected with Homer1a protein and JSH-23. TUNEL assay showed that either Homer1a protein or JSH-23 alone effectively reduced the number of apoptotic cells in retinal tissue after I/R injury, and the combination of the two had a larger effect (Figure 10B and E). Hematoxylin-eosin staining showed that the use of Homer1a protein or JSH-23 alone alleviated the reduction in retinal thickness induced by I/R injury, and the combination of the two had a greater effect (Figure 10D and G). In addition, Homer1a protein plus JSH-23 reduced I/R injury-induced apoptosis in Müller cells (Figure 10C and F). These results showed that Homer1a protein combined with JSH-23 alleviated retinal and Müller cell I/R injury.
Figure 10.

Homer1a protein combined with JSH-23 alleviates retinal and Müller cell injury.
(A) PCR result of the genotyping of different mice (Genotype: Homer1 flox, Mutant = 300 bp; Wild type = 232 bp. Homer1a, Mutant = 318 bp; Wild type = 485 bp. Nestin-cre, Mutant = 150 bp; Wild type = 246 bp). (B, C) Representative image of TUNEL staining showing the apoptosis of retinal tissue (B) and Müller cells (C). Arrows indicate apoptotic cells. Treatment with NF-κB inh and Homer1a protein reversed the apoptosis rate of transgenic mice retinal cells (B) and Müller cells (C) induced by I/R. Scale bars: 50 μm (B) and 200 μm (C). (D) Representative images of hematoxylin-eosin staining of ischemic retinal tissue. Treatment with NF-κB inh and Homer1a protein reversed the decrease in retinal thickness of transgenic mice induced by I/R. Arrows indicate the measured thickness. Scale bars: 100 μm. (E) Quantification of the TUNEL+ cell rate in B. (F) Quantification of the TUNEL+ cell rate in C. (G) Quantification of the mean thickness of retina. The data are expressed as the mean ± SD. There were five mice per group in the in vivo study and each in vitro experiment was repeated three times. **P < 0.01, ***P < 0.001, ****P < 0.0001 (one-way analysis of variance followed by Tukey's multiple comparisons test). DAPI: 4′,6-Diamidino-2-phenylindole; ELM: external limiting membrane; GCL: ganglion cell layer; Homer1: homer scaffold protein 1; I/R: ischemia/reperfusion; inh: inhibitor; INL: inner nuclear layer; IPL: inner plexiform layer; JSH-23: a NF-κB-P65 inhibitor; NFL: nerve fiber layer; NF-κB: nuclear factor κB; ONL: outer nuclear layer; OPL: outer plexiform layer; PCR: polymerase chain reaction; RPE: retinal pigment epithelium; TUNEL: terminal deoxynucleotidyl transferase dUTP nick end labeling.
Discussion
Our results showed that after retinal ischemia/reperfusion injury, retinal tissue thickness was decreased and apoptosis was increased. In addition, we found that the transcription and translation levels of Homer1a peaked at 24 hours after reperfusion in both in vivo and in vitro experiments. After retinal ischemia/reperfusion injury, the viability of Müller cells, the number of apoptotic cells, and a large number of inflammatory factors, such as bFGF, KC/CXCL1, M-CSF, TNFR1/TNFRSF1A, and TNFR11/TNFRSF1B, were improved in the Homer1a-overexpression group. Furthermore, Homer1a knockdown promoted the activation of NF-κB P65 by caspase-8, the formation of the NLRP3 inflammasome, the production and processing of IL-1β and IL-18, and the nuclear translocation of NF-κB P65. Conversely, the opposite results were observed in the Homer1a-overexpression group. Finally, the combined use of Homer1a protein and JSH-23 significantly improved the reduction in retinal thickness and apoptosis in Müller cells after retinal ischemia/reperfusion injury.
In the present study, pathological examination showed that retinal thickness after retinal I/R injury decreased in a time-dependent manner compared with that in the sham group, verifying the validity of the model and establishing a basis for subsequent experiments. There was no statistical difference in retinal thickness between 24 hours and 7 days after reperfusion (Additional Table 3). I/R injury mainly occurs in the early stage of reperfusion and becomes permanent if the injury is not effectively treated (Li et al., 2021c). In our study, retinal thickness was decreased to 50% of that in normal tissue after 24 hours, which persisted at 7 days of reperfusion. We think this reflects irreversible damage due to the lack of treatment in the early stage, which supports that I/R injury needs to be treated as early as possible. In addition, previous studies have reported that retinal ganglion cells undergo apoptosis, whereas Müller cells, as supporting cells for nourishing retinal ganglion cells, do not undergo apoptosis in most glaucoma patients and models (Hu et al., 2021). Glaucoma has the characteristic of pathological elevated IOP, but some patients also present with normal IOP glaucoma. Our in vivo experimental model was established by increasing IOP for 90 minutes, simulating pathological damage caused by retinal I/R rather than specific diseases such as glaucoma or age-related macular degeneration. Thus, our experimental results provide insight for diseases with pathological mechanisms of retinal I/R.
The inflammatory response in retinal tissue is involved in retinal I/R injury. Studies of other inflammatory diseases have confirmed that the expression of inflammatory factors is regulated by the classical NLRP3 inflammasome (Peeters et al., 2013; Furuya et al., 2018; Yu et al., 2019; Gaul et al., 2021). The interaction between NLRP3 and ASC reflects the level of NLRP3 activation, which promotes cleavage of the proinflammatory cytokines IL-1β and IL-18. In addition, NF-κB signaling pathway activation is involved in IL-1β and IL-18 production in ischemic tissue injury (Lin et al., 2021). Therefore, to determine the relationship between Homer1a, NLRP3, and NF-κB p65, we performed coimmunoprecipitation, ELISA and western blotting. IL-1β and IL-18 processing was inhibited by suppressing the formation of the NLRP3 inflammasome, and the nuclear translocation of NF-κB p65 was inhibited in the Homer1a OE group after I/R injury. We also found that NF-κB p65 inhibitor JSH-23 significantly decreased NLRP3 activation and the production and maturation of IL-1β and IL-18 after I/R injury, which indicates that NLRP3 was downstream of NF-κB p65. In addition, an unbiased inflammatory gene array analysis of retinal tissue showed that the increased expression of the inflammatory factors bFGF, KC/CXCL1, M-CSF, TNFR1/TNFRSF1A, and TNFR11/TNFRSF1B was inhibited in the Homer1a OE group after retinal I/R injury. These results suggest that more complex inflammatory regulation than just NLRP3/NF-κB may be involved in retinal I/R injury.
The role of caspase-8 in regulating the inflammatory response after binding to ASC in inflammasomes has attracted increasing attention. Chi et al. (2014) reported that caspase-8, through its nonapoptotic function, may be involved in inflammation after retinal I/R injury to promote the activation of microglia and the NLRP1/NLRP3 inflammasome, and the processing of IL-1β, as well as retinal ganglion cell death. Therefore, we hypothesized that in addition to NLRP3, caspase-8 is involved in retinal I/R injury but is regulated by Homer1a. Consistent with the study by Chi et al. (2014), our findings suggest that caspase-8 participates in the inflammatory response, binds to the adaptor protein ASC, and improves the expression of inflammatory factors after retinal I/R injury. Our study showed for the first time that caspase-8, through its nonapoptotic function, was regulated by upstream Homer1a after I/R injury. Therefore, we further explored the relationship between caspase-8, NLRP3, and NF-κB p65. Inhibiting NF-κB p65 had no effect on caspase-8 expression but inhibited NF-κB p65 phosphorylation, which indicated that caspase-8 was upstream of NF-κB p65. Therefore, we concluded that Homer1a is involved in the inflammatory response by modulating the caspase-8/NF-κB p65/NLRP3 signaling pathway after I/R injury. Homer1a overexpression has also been reported to be involved in other signaling pathways. For example, upregulation of Homer1a promoted retinal ganglion cell survival after retinal I/R by interacting with the Erk pathway (Fei et al., 2015). Recent studies showed that cell death in cortical neurons was alleviated upon Homer1a overexpression after I/R injury by inhibiting the protein kinase R-like ER kinase (PERK) or phosphoinositide 3-kinase/protein kinase B/mammalian target of rapamycin (PI3K/AKT/mTOR) signaling pathway (Wei et al., 2019; Wang et al., 2020). These reports suggest that the joint regulation of multiple pathways may be an important pathogenesis of I/R injury.
Inhibitor JSH-23 has been reported to have an inhibitory effect on inflammation by regulating LPS-induced NF-κB translocation (Liang et al., 2020), significantly reversing nerve conduction and nerve blood flow defects, reducing nerve lipid peroxidation, and partially supplementing the depleted level of GSH in the nerves of diabetic rats (Kumar et al., 2011). To further study the regulatory relationship between Homer1a and NF-κB P65, we chose to investigate the effects of JSH-23, an inhibitor of NF-κB P65. Genetic engineering technology, such as AAV, plasmids, and small interfering RNAs (Baloula et al., 2018), or the NF-κB P65 inhibitor JSH-23 (Peng et al., 2020) can be used for expressive inhibition or functional inhibition, respectively, of NF-κB P65. However, expressive inhibition of NF-κB P65 can cause multiple upstream and downstream cascade changes, which would confound the results. Therefore, we used the functional inhibitor JSH-23. Although our study showed that JSH-23 and Homer1a protein ameliorated the reduction in retinal thickness and decreased apoptosis in retinal tissue and Müller cells, the low oral bioavailability and high toxicity of NF-κB p65 inhibitors, including JSH-23, are major challenges for clinical translation (Morel et al., 2021). Therefore, in our study, JSH-23 was used as a tool to inhibit NF-κB P65 function to investigate the association between Homer1a and NF-κB p65, and not as a potential target agent. Moreover, studies have reported that symptoms and pathology are improved by Homer1a in many disorders of the central nervous system. Wang et al. (2015) showed that Homer1a may be a key neuroprotective endogenous molecule that protects against NMDA-induced neuronal injury. A study by Serchov et al. (2015) indicated that increased Homer1a expression is a final common pathway mediating the antidepressant effects of different antidepressant treatments. Therefore, the use of Homer1a protein may be a therapeutic strategy for retinal I/R injury-based illness. In addition, exosomes, which are the mediators of targeted drug delivery, have been reported to have the characteristics of high efficiency and low reactivity (Klingeborn et al., 2017). By combining the results of our research with genetic engineering technology, the construction of exosomes rich in Homer1a protein for the treatment of retinal I/R may have good clinical application prospects.
Our experiments had several limitations. Müller cells are large glial cells that are located throughout the retina and may play important roles in retinal protection, nutrition and metabolism (Vecino et al., 2016; Lamas and Martinez-Colin, 2022). However, the retina is divided into 10 layers (Jáñez-Escalada et al., 2019), and it is unclear which cells Homer1a targets to exert its therapeutic effects in vivo. Therefore, transgenic mice with different cell-specific conditional knockouts of Homer1a, such as Homer1flox/−/Homer1a+/−/GFAP-Cre+/− and Homer1flox/−/Homer1a+/−/Cx3Cr1-Cre+/− mice, would be useful to examine in future studies.
In the present study, we showed that retinal tissue thickness was decreased and apoptotic cell number was increased after retinal I/R injury. Homer1a knockdown promoted activation of NF-κB P65 by caspase-8, formation of the NLRP3 inflammasome, production and processing of IL-1β and IL-18, and nuclear translocation of NF-κB P65, and the opposite results were observed in the Homer1a OE group. These results suggest that Homer1a plays protective roles in retinal tissue and Müller cells in the inflammatory response via the caspase-8/NF-κB/NLRP3 pathway after I/R injury. Finally, the combined use of Homer1a protein and JSH-23 significantly improved the reduction in retinal thickness and apoptosis in Müller cells after I/R injury. These findings provide important insight for understanding the mechanism of pathological changes after retinal I/R injury and for determining potential therapeutic strategies.
Additional files:
Additional Figure 1 (2.9MB, tif) : Müller cells were identified by GS immunofluorescence.
Muller cells were identified by GS immunofluorescence.
Scale bars: 40 μm (upper) and 20 μm (lower). DAPI: 4',6-Diamidino-2-phenylindole; GS: glutamine synthetase.
Additional Figure 2 (6MB, tif) : Validation of transfection efficiency of virus.
Validation of transfection efficiency of virus.
(A-E) The relative mRNA expression (A), protein expression (B, C) and fluorescence intensity (D, E) of Homer1a in retinal tissue were detected after AAV injection. Scale bars: 500 μm. (F-J) The relative mRNA expression (F), protein expression (G, H) and fluorescence intensity (I, J) of Homer1a in Müller cells were detected after lentivirus infection. Scale bars: 200 μm. Data are expressed as the mean ± SD. *P < 0.05, ****P < 0.0001 (one-way analysis of variance followed by Tukey's multiple comparisons test). AAV: Adeno-associated virus; GAPDH: glyceraldehyde-3-phosphate dehydrogenase; NC: negative control; Lv: lentivirus; ns: no statistical difference; Homer1: homer scaffold protein 1.
Additional Figure 3 (5.6MB, tif) : Quantification of results in Figure 6.
Quantification of results in Figure 6.
(A-H) Quantification of results in Figure 6A-H. GAPDH was used as an internal control. Data are expressed as the mean ± SD. *P < 0.05, **P < 0.01, ***P < 0.001, ****P < 0.0001 (one-way analysis of variance followed by Tukey's multiple comparisons test). Asc: Apoptosis-associated speck-like protein containing a caspase recruitment domain; GAPDH: glyceraldehyde-3-phosphate dehydrogenase; Homer1: homer scaffold protein 1; I/R: ischemia/reperfusion; IP: immunoprecipitation; KD: knock-down; NLRP3: NACHT-LRR-PYD domain protein 3; OE: overexpression.
Additional Figure 4 (4.1MB, tif) : The drug toxicity of Homer1a protein and JSH-23 were detected and analyzed.
The drug toxicity of Homer1a protein and JSH-23 were detected and analyzed.
(A, B) Representative image of hematoxylin-eosin staining of the retinal tissue in each group and the mean thickness of retina in each group was quantified. Arrows represent the measured thickness. Scale bars: 100 μm. (C) The cell viability of Müller cell was determined by CCK-8 assay in each group. Müller cells were pretreated with 10 μM Homer1a protein or JSH-23 for 12 hours, and then I/R injury model was established. These data were analyzed using one-way analysis of variance and all data are expressed as the mean SD. CCK-8: Cell Counting Kit-8; ELM: external limiting membrane; GCL: ganglion cell layer; Homer1: homer scaffold protein 1; I/R: ischemia/reperfusion; Inh: inhibitor; INL: inner nuclear layer; IPL: inner plexiform layer; JSH-23: a NF-κB-P65 inhibitor; NFL: nerve fiber layer; NF-κB: nuclear factor κB; ns: no statistical difference; ONL: outer nuclear layer; OPL: outer plexiform layer; RPE: retinal pigment epithelium.
Additional Table 1: Sequence information of primers used for polymerase chain reaction.
Additional Table 2: Information for primary antibodies.
Additional Table 3: The list of statistical data in the figures.
Acknowledgments:
Graphical Abstract was created with Biorender.com.
Funding Statement
Funding: This study was supported by the Youth Development Project of Air Force Military Medical University, No. 21QNPY072; Key Project of Shaanxi Provincial Natural Science Basic Research Program, No. 2023-JC-ZD-48 (both to FF).
Footnotes
Conflicts of interest: The authors declare that they have no competing interests.
Data availability statement: All data relevant to the study are included in the article or uploaded as Additional files.
Open peer reviewer: Brijesh Kumar Singh, Columbia University Medical Center, USA.
P-Reviewer: Singh BK; C-Editor: Zhao M; S-Editors: Yu J, Li CH; L-Editors: McCollum L, Yu J, Song LP; T-Editor: Jia Y
References
- Abcouwer SF, Shanmugam S, Muthusamy A, Lin CM, Kong D, Hager H, Liu X, Antonetti DA. Inflammatory resolution and vascular barrier restoration after retinal ischemia reperfusion injury. J Neuroinflammation. 2021;18:186. doi: 10.1186/s12974-021-02237-5. [DOI] [PMC free article] [PubMed] [Google Scholar]
- Baeuerle PA, Henkel T. Function and activation of NF-kappa B in the immune system. Annu Rev Immunol. 1994;12:141–179. doi: 10.1146/annurev.iy.12.040194.001041. [DOI] [PubMed] [Google Scholar]
- Baeuerle PA, Baltimore D. NF-kappa B: ten years after. Cell. 1996;87:13–20. doi: 10.1016/s0092-8674(00)81318-5. [DOI] [PubMed] [Google Scholar]
- Baloula V, Fructuoso M, Kassis N, Gueddouri D, Paul JL, Janel N. Homocysteine-lowering gene therapy rescues signaling pathways in brain of mice with intermediate hyperhomocysteinemia. Redox Biol. 2018;19:200–209. doi: 10.1016/j.redox.2018.08.015. [DOI] [PMC free article] [PubMed] [Google Scholar]
- Bay V, Butt AM. Relationship between glial potassium regulation and axon excitability: a role for glial Kir4.1 channels. Glia. 2012;60:651–660. doi: 10.1002/glia.22299. [DOI] [PubMed] [Google Scholar]
- Bermudez MA, Gonzalez F. Differential sensitivity of the on and off visual responses to retinal ischemia. Exp Eye Res. 2020;191:107906. doi: 10.1016/j.exer.2019.107906. [DOI] [PubMed] [Google Scholar]
- Brakeman PR, Lanahan AA, O'Brien R, Roche K, Barnes CA, Huganir RL, Worley PF. Homer: a protein that selectively binds metabotropic glutamate receptors. Nature. 1997;386:284–288. doi: 10.1038/386284a0. [DOI] [PubMed] [Google Scholar]
- Bringmann A, Pannicke T, Grosche J, Francke M, Wiedemann P, Skatchkov SN, Osborne NN, Reichenbach A. Müller cells in the healthy and diseased retina. Prog Retin Eye Res. 2006;25:397–424. doi: 10.1016/j.preteyeres.2006.05.003. [DOI] [PubMed] [Google Scholar]
- Campbell LJ, Levendusky JL, Steines SA, Hyde DR. Retinal regeneration requires dynamic Notch signaling. Neural Regen Res. 2022;17:1199–1209. doi: 10.4103/1673-5374.327326. [DOI] [PMC free article] [PubMed] [Google Scholar]
- Chi W, Chen H, Li F, Zhu Y, Yin W, Zhuo Y. HMGB1 promotes the activation of NLRP3 and caspase-8 inflammasomes via NF-κB pathway in acute glaucoma. J Neuroinflammation. 2015;12:137. doi: 10.1186/s12974-015-0360-2. [DOI] [PMC free article] [PubMed] [Google Scholar]
- Chi W, Li F, Chen H, Wang Y, Zhu Y, Yang X, Zhu J, Wu F, Ouyang H, Ge J, Weinreb RN, Zhang K, Zhuo Y. Caspase-8 promotes NLRP1/NLRP3 inflammasome activation and IL-1β production in acute glaucoma. Proc Natl Acad Sci U S A. 2014;111:11181–11186. doi: 10.1073/pnas.1402819111. [DOI] [PMC free article] [PubMed] [Google Scholar]
- Chokshi V, Druciak B, Worley PF, Lee HK. Homer1a is required for establishment of contralateral bias and maintenance of ocular dominance in mouse visual cortex. J Neurosci. 2019;39:3897–3905. doi: 10.1523/JNEUROSCI.3188-18.2019. [DOI] [PMC free article] [PubMed] [Google Scholar]
- Duh EJ, Sun JK, Stitt AW. Diabetic retinopathy: current understanding, mechanisms, and treatment strategies. JCI Insight. 2017;2:e93751. doi: 10.1172/jci.insight.93751. [DOI] [PMC free article] [PubMed] [Google Scholar]
- Fei F, Li J, Rao W, Liu W, Chen X, Su N, Wang Y, Fei Z. Upregulation of Homer1a promoted retinal ganglion cell survival after retinal ischemia and reperfusion via interacting with Erk pathway. Cell Mol Neurobiol. 2015;35:1039–1048. doi: 10.1007/s10571-015-0198-2. [DOI] [PMC free article] [PubMed] [Google Scholar]
- Fei X, Dou YN, Lv W, Ding B, Wei J, Wu X, He X, Fei Z, Fei F. TLR4 deletion improves cognitive brain function and structure in aged mice. Neuroscience. 2022a;492:1–17. doi: 10.1016/j.neuroscience.2022.04.007. [DOI] [PubMed] [Google Scholar]
- Fei X, Dou YN, Wang L, Wu X, Huan Y, Wu S, He X, Lv W, Wei J, Fei Z. Homer1 promotes the conversion of A1 astrocytes to A2 astrocytes and improves the recovery of transgenic mice after intracerebral hemorrhage. J Neuroinflammation. 2022b;19:67. doi: 10.1186/s12974-022-02428-8. [DOI] [PMC free article] [PubMed] [Google Scholar]
- Fei X, Wu X, Dou YN, Sun K, Guo Q, Zhang L, Li S, Wei J, Huan Y, He X, Fei Z. TRIM22 orchestrates the proliferation of GBMs and the benefits of TMZ by coordinating the modification and degradation of RIG-I. Mol Ther Oncolytics. 2022c;26:413–428. doi: 10.1016/j.omto.2022.08.007. [DOI] [PMC free article] [PubMed] [Google Scholar]
- Flammer J, Orgül S, Costa VP, Orzalesi N, Krieglstein GK, Serra LM, Renard JP, Stefánsson E. The impact of ocular blood flow in glaucoma. Prog Retin Eye Res. 2002;21:359–393. doi: 10.1016/s1350-9462(02)00008-3. [DOI] [PubMed] [Google Scholar]
- Fritsch M, Günther SD, Schwarzer R, Albert MC, Schorn F, Werthenbach JP, Schiffmann LM, Stair N, Stocks H, Seeger JM, Lamkanfi M, Krönke M, Pasparakis M, Kashkar H. Caspase-8 is the molecular switch for apoptosis, necroptosis and pyroptosis. Nature. 2019;575:683–687. doi: 10.1038/s41586-019-1770-6. [DOI] [PubMed] [Google Scholar]
- Furuya MY, Asano T, Sumichika Y, Sato S, Kobayashi H, Watanabe H, Suzuki E, Kozuru H, Yatsuhashi H, Koga T, Ohira H, Sekine H, Kawakami A, Migita K. Tofacitinib inhibits granulocyte-macrophage colony-stimulating factor-induced NLRP3 inflammasome activation in human neutrophils. Arthritis Res Ther. 2018;20:196. doi: 10.1186/s13075-018-1685-x. [DOI] [PMC free article] [PubMed] [Google Scholar]
- Gaul S, Schaeffer KM, Opitz L, Maeder C, Kogel A, Uhlmann L, Kalwa H, Wagner U, Haas J, Behzadi A, Pelegrin P, Boeckel JN, Laufs U. Extracellular NLRP3 inflammasome particles are internalized by human coronary artery smooth muscle cells and induce pro-atherogenic effects. Sci Rep. 2021;11:15156. doi: 10.1038/s41598-021-94314-1. [DOI] [PMC free article] [PubMed] [Google Scholar]
- Goldman D. Müller glial cell reprogramming and retina regeneration. Nat Rev Neurosci. 2014;15:431–442. doi: 10.1038/nrn3723. [DOI] [PMC free article] [PubMed] [Google Scholar]
- González Fleitas MF, Bordone M, Rosenstein RE, Dorfman D. Effect of retinal ischemia on the non-image forming visual system. Chronobiol Int. 2015;32:152–163. doi: 10.3109/07420528.2014.959526. [DOI] [PubMed] [Google Scholar]
- Hamzeh A, Ayoub R, Issa S, Alhalabi N, Sawaf B, Mohsen F, Issa H, Mohsen MA, Khattab MN, Thomas G, Aljammal MB, Shibani M, Alzabibi MA, Ismail H, Hamzeh F, Almoree O, Al-Moujahed A, Saba S. War-related ocular injuries in Damascus during the Syrian Crisis. Injury. 2021;52:299–304. doi: 10.1016/j.injury.2020.11.069. [DOI] [PubMed] [Google Scholar]
- Hoang T, Wang J, Boyd P, Wang F, Santiago C, Jiang L, Yoo S, Lahne M, Todd LJ, Jia M, Saez C, Keuthan C, Palazzo I, Squires N, Campbell WA, Rajaii F, Parayil T, Trinh V, Kim DW, Wang G, et al. Gene regulatory networks controlling vertebrate retinal regeneration. Science. 2020;370:eabb8598. doi: 10.1126/science.abb8598. [DOI] [PMC free article] [PubMed] [Google Scholar]
- Homme RP, Sandhu HS, George AK, Tyagi SC, Singh M. Sustained inhibition of NF-κB activity mitigates retinal vasculopathy in diabetes. Am J Pathol. 2021;191:947–964. doi: 10.1016/j.ajpath.2021.01.016. [DOI] [PMC free article] [PubMed] [Google Scholar]
- Honjo Y, Nagineni CN, Larsson J, Nandula SR, Hooks JJ, Chan CC, Karlsson S, Kulkarni AB. Neuron-specific TGF-beta signaling deficiency results in retinal detachment and cataracts in mice. Biochem Biophys Res Commun. 2007;352:418–422. doi: 10.1016/j.bbrc.2006.11.033. [DOI] [PMC free article] [PubMed] [Google Scholar]
- Hu JH, Park JM, Park S, Xiao B, Dehoff MH, Kim S, Hayashi T, Schwarz MK, Huganir RL, Seeburg PH, Linden DJ, Worley PF. Homeostatic scaling requires group I mGluR activation mediated by Homer1a. Neuron. 2010;68:1128–1142. doi: 10.1016/j.neuron.2010.11.008. [DOI] [PMC free article] [PubMed] [Google Scholar]
- Hu X, Zhao GL, Xu MX, Zhou H, Li F, Miao Y, Lei B, Yang XL, Wang Z. Interplay between Müller cells and microglia aggravates retinal inflammatory response in experimental glaucoma. J Neuroinflammation. 2021;18:303. doi: 10.1186/s12974-021-02366-x. [DOI] [PMC free article] [PubMed] [Google Scholar]
- Jáñez-Escalada L, Jáñez-García L, Salobrar-García E, Santos-Mayo A, de Hoz R, Yubero R, Gil P, Ramírez JM. Spatial analysis of thickness changes in ten retinal layers of Alzheimer's disease patients based on optical coherence tomography. Sci Rep. 2019;9:13000. doi: 10.1038/s41598-019-49353-0. [DOI] [PMC free article] [PubMed] [Google Scholar]
- Kim BJ, Braun TA, Wordinger RJ, Clark AF. Progressive morphological changes and impaired retinal function associated with temporal regulation of gene expression after retinal ischemia/reperfusion injury in mice. Mol Neurodegener. 2013;8:21. doi: 10.1186/1750-1326-8-21. [DOI] [PMC free article] [PubMed] [Google Scholar]
- Klingeborn M, Dismuke WM, Bowes Rickman C, Stamer WD. Roles of exosomes in the normal and diseased eye. Prog Retin Eye Res. 2017;59:158–177. doi: 10.1016/j.preteyeres.2017.04.004. [DOI] [PMC free article] [PubMed] [Google Scholar]
- Kumar A, Negi G, Sharma SS. JSH-23 targets nuclear factor-kappa B and reverses various deficits in experimental diabetic neuropathy: effect on neuroinflammation and antioxidant defence. Diabetes Obes Metab. 2011;13:750–758. doi: 10.1111/j.1463-1326.2011.01402.x. [DOI] [PubMed] [Google Scholar]
- Lamas M, Martinez-Colin EJ. Müller cell molecular heterogeneity: facts and predictions. ASN Neuro. 2022;14:17590914221106903. doi: 10.1177/17590914221106903. [DOI] [PMC free article] [PubMed] [Google Scholar]
- Li Q, Cheng Y, Zhang S, Sun X, Wu J. TRPV4-induced Müller cell gliosis and TNF-α elevation-mediated retinal ganglion cell apoptosis in glaucomatous rats via JAK2/STAT3/NF-κB pathway. J Neuroinflammation. 2021a;18:271. doi: 10.1186/s12974-021-02315-8. [DOI] [PMC free article] [PubMed] [Google Scholar]
- Li S, Chen J, Liu M, Chen Y, Wu Y, Li Q, Ma T, Gao J, Xia Y, Fan M, Chen A, Lu D, Su E, Xu F, Chen Z, Qian J, Ge J. Protective effect of HINT2 on mitochondrial function via repressing MCU complex activation attenuates cardiac microvascular ischemia-reperfusion injury. Basic Res Cardiol. 2021b;116:65. doi: 10.1007/s00395-021-00905-4. [DOI] [PMC free article] [PubMed] [Google Scholar]
- Li X, Ma N, Xu J, Zhang Y, Yang P, Su X, Xing Y, An N, Yang F, Zhang G, Zhang L, Xing Y. Targeting ferroptosis: pathological mechanism and treatment of ischemia-reperfusion injury. Oxid Med Cell Longev. 2021c;2021:1587922. doi: 10.1155/2021/1587922. [DOI] [PMC free article] [PubMed] [Google Scholar]
- Liang W, Li J, Bai C, Chen Y, Li Y, Huang G, Wang X. Interleukin-5 deletion promotes sepsis-induced M1 macrophage differentiation, deteriorates cardiac dysfunction, and exacerbates cardiac injury via the NF-κB p65 pathway in mice. Biofactors. 2020;46:1006–1017. doi: 10.1002/biof.1681. [DOI] [PubMed] [Google Scholar]
- Lin B, Chen X, Lu C, Xu J, Qiu Y, Liu X, Song H, Chen A, Xiong J, Wang K, Yuan Y, Shi L, Zhong L, Jiang X. Loss of exosomal LncRNA HCG15 prevents acute myocardial ischemic injury through the NF-κB/p65 and p38 pathways. Cell Death Dis. 2021;12:1007. doi: 10.1038/s41419-021-04281-8. [DOI] [PMC free article] [PubMed] [Google Scholar]
- Lin LT, Chen JT, Tai MC, Chen YH, Chen CL, Pao SI, Hsu CR, Liang CM. Protective effects of hypercapnic acidosis on Ischemia-reperfusion-induced retinal injury. PLoS One. 2019;14:e0211185. doi: 10.1371/journal.pone.0211185. [DOI] [PMC free article] [PubMed] [Google Scholar]
- MacPherson D, Sage J, Kim T, Ho D, McLaughlin ME, Jacks T. Cell type-specific effects of Rb deletion in the murine retina. Genes Dev. 2004;18:1681–1694. doi: 10.1101/gad.1203304. [DOI] [PMC free article] [PubMed] [Google Scholar]
- Martins RA, Zindy F, Donovan S, Zhang J, Pounds S, Wey A, Knoepfler PS, Eisenman RN, Roussel MF, Dyer MA. N-myc coordinates retinal growth with eye size during mouse development. Genes Dev. 2008;22:179–193. doi: 10.1101/gad.1608008. [DOI] [PMC free article] [PubMed] [Google Scholar]
- Matei N, Leahy S, Blair NP, Shahidi M. Assessment of retinal oxygen metabolism, visual function, thickness and degeneration markers after variable ischemia/reperfusion in rats. Exp Eye Res. 2021;213:108838. doi: 10.1016/j.exer.2021.108838. [DOI] [PMC free article] [PubMed] [Google Scholar]
- Mathew B, Ravindran S, Liu X, Torres L, Chennakesavalu M, Huang CC, Feng L, Zelka R, Lopez J, Sharma M, Roth S. Mesenchymal stem cell-derived extracellular vesicles and retinal ischemia-reperfusion. Biomaterials. 2019;197:146–160. doi: 10.1016/j.biomaterials.2019.01.016. [DOI] [PMC free article] [PubMed] [Google Scholar]
- Morel KL, Hamid AA, Clohessy JG, Pandell N, Ellis L, Sweeney CJ. NF-κB blockade with oral administration of dimethylaminoparthenolide (DMAPT), delays prostate cancer resistance to androgen receptor (AR) inhibition and inhibits AR variants. Mol Cancer Res. 2021;19:1137–1145. doi: 10.1158/1541-7786.MCR-21-0099. [DOI] [PMC free article] [PubMed] [Google Scholar]
- Nasoni MG, Carloni S, Canonico B, Burattini S, Cesarini E, Papa S, Pagliarini M, Ambrogini P, Balduini W, Luchetti F. Melatonin reshapes the mitochondrial network and promotes intercellular mitochondrial transfer via tunneling nanotubes after ischemic-like injury in hippocampal HT22 cells. J Pineal Res. 2021;71:e12747. doi: 10.1111/jpi.12747. [DOI] [PMC free article] [PubMed] [Google Scholar]
- Newton K, Wickliffe KE, Maltzman A, Dugger DL, Reja R, Zhang Y, Roose-Girma M, Modrusan Z, Sagolla MS, Webster JD, Dixit VM. Activity of caspase-8 determines plasticity between cell death pathways. Nature. 2019;575:679–682. doi: 10.1038/s41586-019-1752-8. [DOI] [PubMed] [Google Scholar]
- Peeters PM, Perkins TN, Wouters EF, Mossman BT, Reynaert NL. Silica induces NLRP3 inflammasome activation in human lung epithelial cells. Part Fibre Toxicol. 2013;10:3. doi: 10.1186/1743-8977-10-3. [DOI] [PMC free article] [PubMed] [Google Scholar]
- Peng D, Li J, Deng Y, Zhu X, Zhao L, Zhang Y, Li Z, Ou S, Li S, Jiang Y. Sodium para-aminosalicylic acid inhibits manganese-induced NLRP3 inflammasome-dependent pyroptosis by inhibiting NF-κB pathway activation and oxidative stress. J Neuroinflammation. 2020;17:343. doi: 10.1186/s12974-020-02018-6. [DOI] [PMC free article] [PubMed] [Google Scholar]
- Rivera JC, Dabouz R, Noueihed B, Omri S, Tahiri H, Chemtob S. Ischemic retinopathies: oxidative stress and inflammation. Oxid Med Cell Longev. 2017;2017:3940241. doi: 10.1155/2017/3940241. [DOI] [PMC free article] [PubMed] [Google Scholar]
- Roche SL, Ruiz-Lopez AM, Moloney JN, Byrne AM, Cotter TG. Microglial-induced Müller cell gliosis is attenuated by progesterone in a mouse model of retinitis pigmentosa. Glia. 2018;66:295–310. doi: 10.1002/glia.23243. [DOI] [PubMed] [Google Scholar]
- Schneider CA, Rasband WS, Eliceiri KW. NIH Image to ImageJ: 25 years of image analysis. Nat Methods. 2012;9:671–675. doi: 10.1038/nmeth.2089. [DOI] [PMC free article] [PubMed] [Google Scholar]
- Serchov T, Clement HW, Schwarz MK, Iasevoli F, Tosh DK, Idzko M, Jacobson KA, de Bartolomeis A, Normann C, Biber K, van Calker D. Increased signaling via adenosine A1 receptors, sleep deprivation, imipramine, and ketamine inhibit depressive-like behavior via induction of Homer1a. Neuron. 2015;87:549–562. doi: 10.1016/j.neuron.2015.07.010. [DOI] [PMC free article] [PubMed] [Google Scholar]
- Sharif H, Wang L, Wang WL, Magupalli VG, Andreeva L, Qiao Q, Hauenstein AV, Wu Z, Núñez G, Mao Y, Wu H. Structural mechanism for NEK7-licensed activation of NLRP3 inflammasome. Nature. 2019;570:338–343. doi: 10.1038/s41586-019-1295-z. [DOI] [PMC free article] [PubMed] [Google Scholar]
- Shin HM, Kim MH, Kim BH, Jung SH, Kim YS, Park HJ, Hong JT, Min KR, Kim Y. Inhibitory action of novel aromatic diamine compound on lipopolysaccharide-induced nuclear translocation of NF-kappaB without affecting IkappaB degradation. FEBS Lett. 2004;571:50–54. doi: 10.1016/j.febslet.2004.06.056. [DOI] [PubMed] [Google Scholar]
- Song K, Lin Z, Cao L, Lu B, Chen Y, Zhang S, Lu J, Xu H. Sox11b regulates the migration and fate determination of Müller glia-derived progenitors during retina regeneration in zebrafish. Neural Regen Res. 2023;18:445–450. doi: 10.4103/1673-5374.346550. [DOI] [PMC free article] [PubMed] [Google Scholar]
- Swanson KV, Deng M, Ting JP. The NLRP3 inflammasome: molecular activation and regulation to therapeutics. Nat Rev Immunol. 2019;19:477–489. doi: 10.1038/s41577-019-0165-0. [DOI] [PMC free article] [PubMed] [Google Scholar]
- Tang J, Guo YS, Zhang Y, Yu XL, Li L, Huang W, Li Y, Chen B, Jiang JL, Chen ZN. CD147 induces UPR to inhibit apoptosis and chemosensitivity by increasing the transcription of Bip in hepatocellular carcinoma. Cell Death Differ. 2012;19:1779–1790. doi: 10.1038/cdd.2012.60. [DOI] [PMC free article] [PubMed] [Google Scholar]
- Tappe A, Klugmann M, Luo C, Hirlinger D, Agarwal N, Benrath J, Ehrengruber MU, During MJ, Kuner R. Synaptic scaffolding protein Homer1a protects against chronic inflammatory pain. Nat Med. 2006;12:677–681. doi: 10.1038/nm1406. [DOI] [PubMed] [Google Scholar]
- Vecino E, Rodriguez FD, Ruzafa N, Pereiro X, Sharma SC. Glia-neuron interactions in the mammalian retina. Prog Retin Eye Res. 2016;51:1–40. doi: 10.1016/j.preteyeres.2015.06.003. [DOI] [PubMed] [Google Scholar]
- Vermeulen L, De Wilde G, Notebaert S, Vanden Berghe W, Haegeman G. Regulation of the transcriptional activity of the nuclear factor-kappaB p65 subunit. Biochem Pharmacol. 2002;64:963–970. doi: 10.1016/s0006-2952(02)01161-9. [DOI] [PubMed] [Google Scholar]
- Wang Y, Rao W, Zhang C, Zhang C, Liu MD, Han F, Yao LB, Han H, Luo P, Su N, Fei Z. Scaffolding protein Homer1a protects against NMDA-induced neuronal injury. Cell Death Dis. 2015;6:e1843. doi: 10.1038/cddis.2015.216. [DOI] [PMC free article] [PubMed] [Google Scholar]
- Wang Y, Zhao M, Shang L, Zhang Y, Huang C, He Z, Luo M, Wu B, Song P, Wang M, Duan F. Homer1a protects against neuronal injury via PI3K/AKT/mTOR signaling pathway. Int J Neurosci. 2020;130:621–630. doi: 10.1080/00207454.2019.1702535. [DOI] [PubMed] [Google Scholar]
- Wei J, Wu X, Luo P, Yue K, Yu Y, Pu J, Zhang L, Dai S, Han D, Fei Z. Homer1a attenuates endoplasmic reticulum stress-induced mitochondrial stress after ischemic reperfusion injury by inhibiting the PERK pathway. Front Cell Neurosci. 2019;13:101. doi: 10.3389/fncel.2019.00101. [DOI] [PMC free article] [PubMed] [Google Scholar]
- Xiao B, Tu JC, Petralia RS, Yuan JP, Doan A, Breder CD, Ruggiero A, Lanahan AA, Wenthold RJ, Worley PF. Homer regulates the association of group 1 metabotropic glutamate receptors with multivalent complexes of homer-related, synaptic proteins. Neuron. 1998;21:707–716. doi: 10.1016/s0896-6273(00)80588-7. [DOI] [PubMed] [Google Scholar]
- Xu D, Zhong LT, Cheng HY, Wang ZQ, Chen XM, Feng AY, Chen WY, Chen G, Xu Y. Overexpressing NeuroD1 reprograms Müller cells into various types of retinal neurons. Neural Regen Res. 2023;18:1124–1131. doi: 10.4103/1673-5374.355818. [DOI] [PMC free article] [PubMed] [Google Scholar]
- Yoon S, Piguel NH, Khalatyan N, Dionisio LE, Savas JN, Penzes P. Homer1 promotes dendritic spine growth through ankyrin-G and its loss reshapes the synaptic proteome. Mol Psychiatry. 2021;26:1775–1789. doi: 10.1038/s41380-020-00991-1. [DOI] [PMC free article] [PubMed] [Google Scholar]
- Yu R, Jiang S, Tao Y, Li P, Yin J, Zhou Q. Inhibition of HMGB1 improves necrotizing enterocolitis by inhibiting NLRP3 via TLR4 and NF-κB signaling pathways. J Cell Physiol. 2019;234:13431–13438. doi: 10.1002/jcp.28022. [DOI] [PubMed] [Google Scholar]
- Zhang W, Guo S, Li B, Liu L, Ge R, Cao T, Wang H, Gao T, Wang G, Li C. Proinflammatory effect of high-mobility group protein B1 on keratinocytes: an autocrine mechanism underlying psoriasis development. J Pathol. 2017;241:392–404. doi: 10.1002/path.4848. [DOI] [PubMed] [Google Scholar]
- Zheng X, Fan X, Fu B, Zheng M, Zhang A, Zhong K, Yan J, Sun R, Tian Z, Wei H. EpCAM inhibition sensitizes chemoresistant leukemia to immune surveillance. Cancer Res. 2017;77:482–493. doi: 10.1158/0008-5472.CAN-16-0842. [DOI] [PubMed] [Google Scholar]
- Zimmerman AJ, Hafez AK, Amoah SK, Rodriguez BA, Dell'Orco M, Lozano E, Hartley BJ, Alural B, Lalonde J, Chander P, Webster MJ, Perlis RH, Brennand KJ, Haggarty SJ, Weick J, Perrone-Bizzozero N, Brigman JL, Mellios N. A psychiatric disease-related circular RNA controls synaptic gene expression and cognition. Mol Psychiatry. 2020;25:2712–2727. doi: 10.1038/s41380-020-0653-4. [DOI] [PMC free article] [PubMed] [Google Scholar]
Associated Data
This section collects any data citations, data availability statements, or supplementary materials included in this article.
Supplementary Materials
Muller cells were identified by GS immunofluorescence.
Scale bars: 40 μm (upper) and 20 μm (lower). DAPI: 4',6-Diamidino-2-phenylindole; GS: glutamine synthetase.
Validation of transfection efficiency of virus.
(A-E) The relative mRNA expression (A), protein expression (B, C) and fluorescence intensity (D, E) of Homer1a in retinal tissue were detected after AAV injection. Scale bars: 500 μm. (F-J) The relative mRNA expression (F), protein expression (G, H) and fluorescence intensity (I, J) of Homer1a in Müller cells were detected after lentivirus infection. Scale bars: 200 μm. Data are expressed as the mean ± SD. *P < 0.05, ****P < 0.0001 (one-way analysis of variance followed by Tukey's multiple comparisons test). AAV: Adeno-associated virus; GAPDH: glyceraldehyde-3-phosphate dehydrogenase; NC: negative control; Lv: lentivirus; ns: no statistical difference; Homer1: homer scaffold protein 1.
Quantification of results in Figure 6.
(A-H) Quantification of results in Figure 6A-H. GAPDH was used as an internal control. Data are expressed as the mean ± SD. *P < 0.05, **P < 0.01, ***P < 0.001, ****P < 0.0001 (one-way analysis of variance followed by Tukey's multiple comparisons test). Asc: Apoptosis-associated speck-like protein containing a caspase recruitment domain; GAPDH: glyceraldehyde-3-phosphate dehydrogenase; Homer1: homer scaffold protein 1; I/R: ischemia/reperfusion; IP: immunoprecipitation; KD: knock-down; NLRP3: NACHT-LRR-PYD domain protein 3; OE: overexpression.
The drug toxicity of Homer1a protein and JSH-23 were detected and analyzed.
(A, B) Representative image of hematoxylin-eosin staining of the retinal tissue in each group and the mean thickness of retina in each group was quantified. Arrows represent the measured thickness. Scale bars: 100 μm. (C) The cell viability of Müller cell was determined by CCK-8 assay in each group. Müller cells were pretreated with 10 μM Homer1a protein or JSH-23 for 12 hours, and then I/R injury model was established. These data were analyzed using one-way analysis of variance and all data are expressed as the mean SD. CCK-8: Cell Counting Kit-8; ELM: external limiting membrane; GCL: ganglion cell layer; Homer1: homer scaffold protein 1; I/R: ischemia/reperfusion; Inh: inhibitor; INL: inner nuclear layer; IPL: inner plexiform layer; JSH-23: a NF-κB-P65 inhibitor; NFL: nerve fiber layer; NF-κB: nuclear factor κB; ns: no statistical difference; ONL: outer nuclear layer; OPL: outer plexiform layer; RPE: retinal pigment epithelium.