

Abstract
INTRODUCTION
Early detection of Alzheimer's disease and cognitive impairment is critical to improving the healthcare trajectories of aging adults, enabling early intervention and potential prevention of decline.
METHODS
To evaluate multi‐modal feature sets for assessing memory and cognitive impairment, feature selection and subsequent logistic regressions were used to identify the most salient features in classifying Rey Auditory Verbal Learning Test‐determined memory impairment.
RESULTS
Multimodal models incorporating graphomotor, memory, and speech and voice features provided the stronger classification performance (area under the curve = 0.83; sensitivity = 0.81, specificity = 0.80). Multimodal models were superior to all other single modality and demographics models.
DISCUSSION
The current research contributes to the prevailing multimodal profile of those with cognitive impairment, suggesting that it is associated with slower speech with a particular effect on the duration, frequency, and percentage of pauses compared to normal healthy speech.
Keywords: amnestic MCI, automatic speech recognition, digital clock drawing, mild cognitive impairment, non‐amnestic MCI, speech, verbal memory, voice
1. BACKGROUND
Dementia causes substantial loss of health and quality of life and represents a significant health burden on individuals, their families, caregivers, and society at large. 1 Dementia is currently the most costly health condition in the United States. 2 Globally, the cost of caring for those with dementia was $1.3 trillion in 2019 and is expected to reach $3 trillion in 10 years’ time. 3 , 4 While pharmaceutical interventions like Lecanemab and Donanemab have recently demonstrated measurable slowing of disease progression, there are currently no widely available disease‐modifying treatments for Alzheimer's disease (AD). 5 , 6 , 7 , 8 When these treatments eventually do become widely available, their risk profile is such that assessment of cognitive impairment is warranted before prescribing. 9 In addition to recent pharmaceutical successes, there is also strong scientific evidence which indicates that early engagement in lifestyle modification strategies like physical activity and social interaction amongst others can reduce the risk of developing dementia by as much as 40%. 10 , 11 Thus, the early detection of cognitive impairment is critical to improving the healthcare trajectories of aging adults, enabling early intervention and management, as well as potentially preventing or mitigating disease progression.
Traditional cognitive screening tools (e.g., Mini Mental State Exam (MMSE), Montreal Cognitive Assessment (MoCA), or MiniCog) lack sensitivity in populations at risk of or at mild stages of cognitive decline. 12 , 13 , 14 , 15 , 16 Patients often present with cognitive complaints long after subtle symptoms began, thus these traditional tests are often administered after the onset of overt symptoms. Traditional assessments also do not easily fit the time constraints of primary‐care settings‐which are frequently at the forefront of cognitive screening‐without significant workflow modifications. Previous research has indicated that a reliable, objective, digital assessment may significantly increase the accuracy in identifying early cognitive impairment and those likely to convert to AD. 17
Recently, the Digital Clock and Recall (DCR) has emerged as a novel analysis of graphomotor and delayed recall memory performance. The DCR, a medical device registered in the United States, European Union (EU), and Canada, combines a digital clock drawing test (DCTclock), with a three‐word immediate and delayed verbal recall test. 18 , 19 , 20 Importantly, unlike the MMSE, MoCA, or MiniCog which are administrator‐scored and demonstrate low inter‐rater agreement; the DCR enables multimodal assessment of the process through which an individual performed these cognitive tasks, as opposed to only observing the final outcome. Cognitive domains assessed by the DCTclock include drawing efficiency, simple and complex motor function, information processing, visuospatial reasoning, along with the explicit assessment of verbal memory. The DCTclock can detect early signs of cognitive impairment by capturing a wide variety of cognitive and motor metrics during the clock‐drawing process using machine learning (ML) algorithms. 20 , 21
With the inclusion of a verbal recall task, during which speech utterances are digitally recorded and analyzed, speech timing and acoustic voice features may be included in the analysis of cognitive status. Speech and voice feature analysis is feasible, scalable, and cost‐effective compared to comprehensive neuropsychological batteries which can take several hours to complete. Speech and voice metrics have shown promise in classifying individuals with cognitive impairment from their cognitively unimpaired (CU) counterparts in clinical and research settings. 22 , 23 , 24 Further, high accuracy has been reported in differentiating CU individuals and those with AD (88%–97% accuracy) using various ML models that incorporate predominantly speech and voice features. 25
The current investigation evaluated the clinical utility of combining multiple modalities including speech and voice, graphomotor features, and verbal recall accuracy into a brief, objective cognitive assessment. We propose a novel multimodal machine learning model, known as the DCRP (DCR plus voice and speech features) for classifying memory impairment using the Rey Auditory Verbal Learning Test (RAVLT) long delay score. We also identified the set of features most important for classifying memory and global cognitive impairment.
RESEARCH IN CONTEXT
Systematic review: Current literature was reviewed using traditional search engines (e.g., PubMed, Embase, CIELO). This literature review revealed limited but strong evidence that dementia and cognitive impairment may be associated with speech timing and acoustic voice patterns. However, certain inconsistencies were seen in the manner in which analysis was performed and very few results were available on the analysis of short, verbal recall tasks using multimodal modeling approaches.
Interpretation: The current research suggests that accurate predictions of memory impairment can be made from a 3 minute digital cognitive assessment. It also suggests that voice and speech features extracted from as few as three words can aid in the prediction of cognitive impairment.
Future directions: Future work in this field should investigate the additional predictive accuracy of multimodal analyses including speech and voice features in the prediction of blood‐ and brain‐based biomarkers of amyloid and tau burden. It should also investigate these features longitudinally, as well as in conjunction with behavioral and pharmaceutical interventions.
2. METHODS
A sample of 922 older adults (537 female, aged 72.0 ± 6.7 years) completed a battery of cognitive and motor function tests as part of the Bio‐Hermes study on brain health (Table 1). The Bio‐Hermes study, managed by the Global Alzheimer's Platform (GAP), investigates state‐of‐the‐art methods in brain health research. 26 Ethical approval was granted by each institution participating in the GAP consortium. All participants provided written informed consent to participate in the study. Inclusion criteria were adults 60–85 years of age, willing to undergo an amyloid PET scan within 60 days of signing informed consent; have a study partner who, in the investigator's judgment, has sufficient and frequent contact with the participant and is able to provide accurate information regarding the participant's cognitive and functional abilities; willing to comply with all study procedures as outlined in the informed consent, including blood sampling; willing to be contacted for possible participation in clinical research trials once their participation in this study ends, fluent in the language of the tests used and the test site, and with a MMSE score of 20–30 at screening. Exclusion criteria were extensive and based on underlying conditions. In short, exclusion criteria included participants who, in the opinion of the Site Principal Investigator, have serious or unstable medical conditions that would prohibit their completion of all study procedures and data collection; serious or unstable medical conditions that would likely preclude their participation in an interventional research trial; are unable to undergo amyloid PET; have reported or have a known negative amyloid PET scan in past 12 months; participants with self‐reported, untreated conditions such as vitamin B12 or folate deficiency or bladder infections; history of stroke or seizures within 1 year of screening visit; participants with history of certain cancers within the past 5 years; known or suspected alcohol or drug abuse or dependence; a Geriatric Depression Scale (GDS) score greater than or equal to 8; and participants who are unable to complete cognitive testing due to inadequate visual or auditory acuity. More information can be obtained by contacting the GAP consortium and in recently published material. 26 , 27 , 28
TABLE 1.
Age, gender, ethnicity, handedness, education, and race demographics of the 942 study participants.
| Gender | Ethnicity | Handedness | Education | Race | |||||||||||
|---|---|---|---|---|---|---|---|---|---|---|---|---|---|---|---|
| Cohort |
Age Mean ± SD |
Male | Female | Hispanic and Latino | Non‐Hispanic | Right | Left | Ambi. | Less than HS | HS degree | Some college | White | Black | Asian | Other |
| All subjects | 72 ± 7 | 405 (43%) | 537 (57%) | 112 (12%) | 830 (88%) | 843 (89%) | 85 (9%) | 14 (2%) | 24 (2%) | 144 (15%) | 258 (27%) | 807 (86%) | 108 (11%) | 17 (2%) | 10 (1%) |
| RAVLT impaired | 73 ± 6 | 235 (54%) | 198 (45%) | 53 (12%) | 380 (87%) | 382 (88%) | 42 (9%) | 9 (2%) | 15 (3%) | 81 (18%) | 114 (26%) | 366 (84%) | 55 (12%) | 8 (1%) | 4 (1%) |
| RAVLT unimpaired | 72 ± 7 | 170 (33%) | 339 (66%) | 59 (11%) | 450 (88%) | 461 (90%) | 43 (8%) | 5 (1%) | 9 (1%) | 63 (12%) | 144 (28%) | 441 (86%) | 53 (10%) | 9 (1%) | 6 (1%) |
| Significance RAVLT impaired vs unimpaired | ‐2.4 (p = 0.01) | 40.7 (p < 0.001) | NS | 6.7 (p = 0.009) | 8.3 (p = 0.004) | NS | |||||||||
| MMSE < 27 | 74 ± 6 | 161 (43%) | 210 (56%) | 54 (14%) | 317 (85%) | 337 (90%) | 30 (8%) | 4 (1%) | 20 (5%) | 72 (19%) | 107 (28%) | 292 (78%) | 67 (18%) | 9 (2%) | 3 (1%) |
| MMSE ≥ 27 | 71 ± 7 | 244 (42%) | 327 (57%) | 58 (10%) | 513 (89%) | 506 (88%) | 55 (9%) | 10 (1%) | 4 (1%) | 72 (12%) | 151 (26%) | 515 (90%) | 41 (7%) | 8 (1%) | 7 (1%) |
| Gender | Ethnicity | Handedness | Education | Race | ||||||||||
|---|---|---|---|---|---|---|---|---|---|---|---|---|---|---|
|
Age Mean ± SD |
Male | Female | Hispanic and Latino | Non‐Hispanic | Right | Left | Ambi. | Less than HS | HS degree | Some college | White/non‐Hispanic | Black/African American | Asian | Other |
| 72 ± 7 | 405 (43%) | 537 (57%) | 112 (12%) | 830 (88%) | 843 (89%) | 85 (9%) | 14 (2%) | 24 (2%) | 144 (15%) | 258 (27%) | 807 (86%) | 108 (11%) | 17 (2%) | 10 (1%) |
Notes: Percentages indicate the proportion of the total number of participants. T‐test statistic results for “Age” and Chi2 statistics (p values) for “Gender” and “Education” are provided for significant differences between RAVLT determined cognitive impairment groups. NS indicates non‐significant results between groups.
Abbreviations: Ambi., ambidextrous; HS, high school; MMSE, Mini‐Mental State Examination; RAVLT, Rey Auditory Verbal Learning Test.
Each participant received a clinical examination which produced a cohort status of Cognitively Normal, Mild cognitive Impairment (MCI), or Alzheimer's Disease Related Dementia (ADRD) based on physician clinical judgment, objective evaluation of functional impairment on the Functional Activities Questionnaire, and results of the RAVLT 29 , 30 , 31 and the MMSE. 32 Participant scores on the RAVLT (age‐adjusted long delay) and MMSE (total score) are detailed in Table 2. The age‐adjusted RAVLT long delay ranges from 0 to 15 and is scored as the number of words recalled after a roughly 20‐minute delay from the first five immediate recall trials. For the purposes of this study, the sample was classified into cognitively “impaired” and “unimpaired” based on the RAVLT long delay scores. Impairment on the RAVLT long delay was defined as at least one standard deviation below the age‐adjusted norms. 33 , 34 , 35 , 36 Included in the examination was the DCR (three‐word verbal recall and clock drawing). The participants’ voices were recorded and analyzed for acoustic and speech features during both immediate and delayed three‐word recall tasks. Cognitive testing was administered via an iPad Pro (11″, 4th Generation, Apple, CA, USA), and data including voice recordings were encrypted on the tablet and uploaded to a secure cloud server.
TABLE 2.
RAVLT age‐adjusted delayed recall scores alongside mean and standard deviation delayed recall score.
| Cognitive status | Score (Mean ± SD) | |||
|---|---|---|---|---|
| Target | Impaired | Unimpaired | Impaired | Unimpaired |
| RAVLT | 433 (54%) | 509 (46%) | 2.8 ± 1.8 | 8.5 ± 2.3 |
Note: Percentages indicate the proportion of the total number of participants.
Abbreviation: RAVLT, Rey Auditory Verbal Learning Test.
T‐test statistic results for “Age” and Chi2 statistics (p values) for “Gender” and “Education” are provided for significant differences between RAVLT‐determined cognitive impairment groups (Table 1). These results are consistent with previous literature and RAVLT norms established in the field. 33 , 37
2.1. Temporal and acoustic analysis
Audio was time‐segmented and transcribed using Amazon Web Services (AWS) Automatic Speech Recognition (ASR) platform “Amazon Transcribe” (www.aws.amazon.com/transcribe/). Word‐level time‐stamped transcriptions are then used to determine verbal recall accuracy and dynamics of speech rate and timing. The Librosa package (www.librosa.org/) was applied to three‐word recall audio to extract acoustic features of fundamental frequency (e.g., mean, standard deviation, minimum, maximum, and jitter), loudness (e.g., mean, minimum, maximum, standard deviation, and shimmer). Metrics of speech timing (word and syllable rates, overall time to complete speech segments, etc.) were calculated using the AWS ASR output. 25 , 38 , 39 , 40 The Librosa analysis package allows for the detection of speech obtained from decibel (dB) and frequency (Hertz; Hz) bands where speech segments are most likely found (30–80 dB and 70–500 Hz threshold bands were used in this analysis; Figure 1). Speech timing features included initiation time, speech rate per word (total audio time/# of spoken words), speech rate per syllable (total audio time/no. of spoken syllables), and short and long silent speech pauses. Importantly, long silent speech pauses (sections of audio that did not reach the 30 dB threshold) in the current research were considered pauses of 2 seconds or longer, occurring between the start and end of the speech. These pauses were included in the analysis only if they occurred during speech and did not include pauses before the speech began or after the final word was produced. This ensures a “true” long silent speech pause metric. Short silent speech pauses were those shorter than 2 seconds long. The resultant output of the semi‐automated analyses was manually reviewed for accuracy. A complete list of the temporal and acoustic features extracted from speech are listed in Tables S1 and S2. Speech timing and acoustic voice features obtained from the audio were subsequently included as candidate features for selection to the DCRP model, to classify cognitive impairment status.
FIGURE 1.
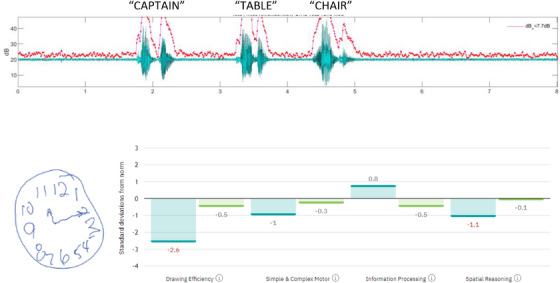
Above depicts the waveform over time and the estimated speech segments (in green) based on dB level analysis (y axis) over time (x axis; in seconds). The red trace follows fluctuations in dB above the speech threshold. A sample of DCTclock drawing (below left) is provided and scored in terms of drawing efficiency, simple and complex motor, information processing, and spatial reasoning (below right). This individual was classified as having cognitive impairment. DCTclock, digital clock test.
2.2. Clock drawing analysis
DCTclock derived features contributed significantly to DCTclock, DCR, and DCRP models. Those found in each model's feature set in Table 3 were selected from 252 drawing position, timing, and drawing rate features originally produced by the DCTclock algorithm. This algorithm utilizes a hierarchy of low‐level features which are aggregated in a series of eight composite scales: four for the Command Clock (i.e., drawing a clock with a particular time without a visual cue; COM) and four for the Copy Clock (i.e., redrawing a clock on the basis of a visual example; COP). These composite features are then themselves aggregated into a single DCTclock score (0–100), which is used to classify a participant's overall cognitive status. Some of these composite features were recurrently selected in the three aforementioned models, including COM Component Placement (i.e., a feature measuring the spatial relationship between command clock drawing attributes), COP and COM Information Processing (i.e., copy and command clock features used to assess non‐motor cognitive function, reliant on low‐level features such as stroke latency and the rate of time spent thinking rather than drawing), and COM Spatial Reasoning (i.e., a feature assessing the geometric properties of the command clock drawing, including the circularity of the clock face as well as the overall size and position of the clock on the tablet canvas). A complete list of the drawing features extracted from the DCTclock are listed in Table S3.
TABLE 3.
Ranked feature importance sets for DCRP, DCR, and DCT models in predicting age‐adjusted RAVLT scores.
| Model | DCRP | DCR | DCT |
|---|---|---|---|
| Features |
|
|
|
Note: Italics indicate the speech timing and acoustic voice features found to contribute to the model predictive accuracy.
Abbreviations: Abs., absolute; COM, command clock; COP, copy clock; DCRP, DCR plus voice and speech; DCT, DCTclock™; RAVLT, Rey Auditory Verbal Learning Test.
2.3. Preprocessing and modeling
To ensure a balanced composition of impaired and unimpaired participants in the test set the dataset was split 80–20 (N = 754, N = 188) into training and test sets. To normalize the data, the training set was fit and transformed using a min‐max scaler for a range of 0–1. The test set was then transformed using the same scaler previously fit to the training set. To handle missing data via imputation, a “missForest” iterative imputation method was used, whereby a random forest regressor was employed to impute all missing values for each feature. This was done iteratively to support imputation accuracy. 41 As with normalization, imputation was fit to the training set, and then used to transform both the training and test sets.
Logistic regression with feature selection and regularization was used for each classifier model in the study. DCRP, DCR, and DCTclock models were subject to hyperparameter tuning, determined using the mean results of a 10‐fold cross‐validation (10 CV) grid search method on the training set. For smaller feature set models (i.e., Age, Gender, Age and Gender, RAVLT), an L2 regularization penalty (Ridge) was applied, whereas for larger feature set models (i.e., DCRP, DCR, DCTclock), an elastic net regularization penalty was used with varying L1 ratio values. A complete set of the hyperparameters chosen for each model are listed in Table S4. 17
2.4. Statistical feature selection
Features for DCRP (DCR plus speech and voice features), DCR, and DCTclock models were pruned first on the basis of relevance and redundancy, then further pruned using a 10 CV recursive feature elimination method on the training set. For all models, feature selection was conducted within the innermost loop of cross‐validation to ensure unbiased model selection.
First, features with below 0.15 Pearson correlation with the target were removed from the feature set. Passing features were then assessed for any high correlation across all features in the set; any features which had correlation above 0.99 with another feature of higher correlation with the target were subsequently removed as well. The remaining features were then assessed for their rate of missing values; any with a rate above 0.05 were then individually assessed for high correlation with features outside of the set, specifically those with a lower rate of missing values. If other features were discovered to have a correlation above 0.75 with the high missing value feature, said features were then reincorporated into the feature set. If no other features were found meeting these requirements, and the assessed feature had a rate of missing values in excess of 0.10, then this feature was removed from the final set.
The final set of features was then pruned through a process of recursive feature elimination on the training set, where features were individually dropped from the set if their inclusion did not demonstrably affect the model's area under the curve (AUC) score when predicting the target, that is, age‐adjusted RAVLT long delay score. 33 , 42 DCRP, DCR, and DCTclock models had a subset of all features which were first composed using RAVLT long delay score as a target (Table 3.).
2.5. Missing data
While there were no missing values in the outcome variable, 58 individuals, particularly those with cognitive impairment, were not able to recall any of the words in the delayed recall task. Timing or acoustic values were not calculated in these cases; thus, values were imputed based on observed covariates using the missing forest algorithm in Python v3.9. 41 The acoustic voice timing features selected are robust to environment noise and recording equipment. 43 , 44
3. RESULTS
Results of logistic regression classifier models using missing forest imputation demonstrated that incorporating features across multiple modalities increased cognitive classification accuracy with each subsequent model. The model including the DCTclock graphomotor metrics, DCR verbal recall accuracy, and DCRP provided the most accurate means of classifying cognitive impairment. Age and gender models were also evaluated for reference and benchmarking purposes (Table 4).
TABLE 4.
Classifier performance for DCRP, DCR, DCT, and age + gender models in predicting memory impairment determined by age‐adjusted RAVLT scores.
| Model | Acc. | AUC | Sen. | Spec. | PPV | NPV | Thresh. |
|---|---|---|---|---|---|---|---|
| DCRP |
0.80 [0.75, 0.86] |
0.83 [0.77, 0.89] |
0.81 [0.73, 0.90] |
0.80 [0.73, 0.87] |
0.85 [0.79, 0.92] |
0.75 [0.65, 0.84] |
0.53 |
| DCR |
0.79 [0.74, 0.86] |
0.82 [0.76, 0.88] |
0.80 [0.71, 0.89] |
0.79 [0.71, 0.87] |
0.84 [0.77, 0.91] |
0.74 [0.63, 0.83] |
0.55 |
| DCT |
0.72 [0.65, 0.79] |
0.77 [0.70, 0.84] |
0.75 [0.65, 0.85] |
0.70 [0.61, 0.78] |
0.79 [0.71, 0.88] |
0.65 [0.54, 0.75] |
0.45 |
| Age + Gender |
0.62 [0.55, 0.69] |
0.67 [0.60, 0.75] |
0.75 [0.65, 0.84] |
0.52 [0.43, 0.62] |
0.74 [0.64, 0.83] |
0.54 [0.44, 0.63] |
0.40 |
| Age |
0.51 [0.44, 0.58] |
0.59 [0.50, 0.67] |
0.82 [0.73, 0.90] |
0.28 [0.19, 0.36] |
0.68 [0.54, 0.82] |
0.46 [0.38, 0.54] |
0.44 |
| Gender |
0.63 [0.57, 0.70] |
0.63 [0.56, 0.70] |
0.59 [0.47, 0.69] |
0.67 [0.58, 0.76] |
0.69 [0.60, 0.78] |
0.57 [0.46, 0.68] |
0.39 |
Abbreviations: ACC, accuracy; DCR, digital clock and recall; DCRP, DCR plus voice and speech; DCT, DCTclock™; NPV, negative predictive value; PPV, positive predictive value.
The speech timing and acoustic voice features were shown in the final model to be most strongly associated with cognitive impairment as determined by the RAVLT using logistic regression are displayed in Table 3. Long silent speech pause count was the most important speech timing feature in classifying cognitive impairment. Acoustic voice features related to jitter (peak‐to‐peak frequency variations) and average fundamental frequency (perceptually equivalent to vocal pitch) met the criteria for inclusion in the DCRP model for classifying cognitive impairment as defined by RAVLT long delay (Table 3).
Figure 2 details the results of logistic regression models used to predict RAVLT determined cognitive impairment (Table 4). AUC of the receiver operating characteristic (ROC) curve, classification accuracy (Acc), sensitivity (Sens), and specificity (Spec) were used to evaluate the model performance. Sens provides a percentage of impaired individuals correctly identified where Spec represents the percentage of individuals correctly identified as unimpaired. Finally, positive and negative predictive values (PPV and NPV) indicate the proportions of correct positive and negative memory impairment classification (Table 4).
FIGURE 2.
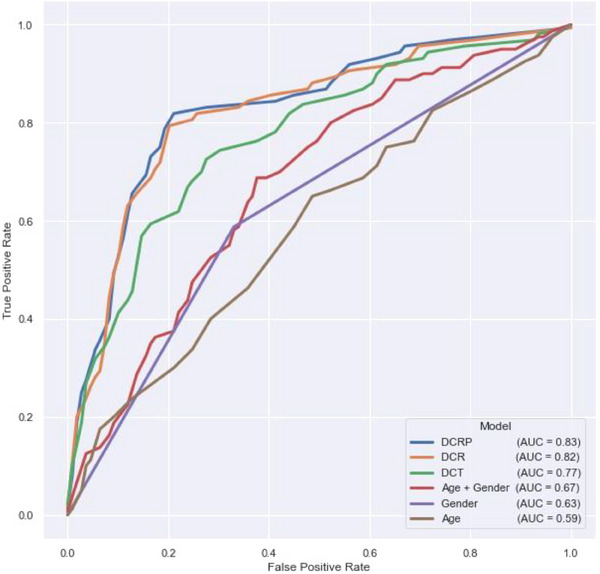
ROC curves for logistic regression models, evaluated binary classification of cognitive impairment as determined by the RAVLT long delay. AUC, area under the curve; DCR, digital clock and recall; DCRP, Digital Clock and Recall Plus Voice and Speech; DCT, digital clock test (DCTclock); RAVLT, Rey Auditory Verbal Learning Test; ROC, receiver operating characteristic.
Results indicate that features included in the DCRP speech and voice model provided the highest classification value (AUC = 0.83; Sens = 0.81, Spec = 0.80). This is an improvement over the DCR (AUC = 0.82; Sens = 0.80, Spec = 0.79), and DCTclock of only (AUC = 0.77; Sens = 0.75, Spec = 0.70) model feature sets. The DCRP outperforms all single domain and demographics models as predictors of RAVLT‐determined memory impairment (Table 4).
4. DISCUSSION
The novel multimodal approach incorporating analysis of graphomotor, verbal recall, speech, and voice features results in higher Sens and Spec than single modality and demographic statistical models in classifying cognitive impairment as determined by the RAVLT. This novel multimodal approach results in incrementally higher accuracy in classifying cognitive impairment. A comparison of classification accuracy between models based on demographics, DCTclock features alone (graphomotor), DCR metrics (DCTclock and verbal recall), and DCRP (DCR, speech timing, and acoustic analysis of verbal recall) revealed the highest Sens, Spec, PPV, and NPV values for DCRP models in impairment on the RAVLT long delay. Thus, the addition of several advanced speech and voice features extracted from a short verbal recall task to memory and global cognitive assessment should be considered in impairment classification models.
Acoustic features, largely language independent, can be altered in individuals with cognitive impairment and can be referenced longitudinally to show decline in performance. 45 This study, however, is one of a very small number of studies to attempt to classify memory and cognitive impairment using a speech task of a maximum of only three words. The acoustic features are more commonly extracted from longer speech samples such as picture description or spontaneous speech tasks, the acoustic features identified in the short verbal recall task of the DCRP are consistent with those noted in other studies. 17 , 25 , 30 , 36 Acoustic voice timing features included in this analysis have been shown to be reliable to changes in environment noise and recording equipment, making them ideal for in‐clinic and mobile screening (feature sets and mean (SD) values detailed in Table S5). 43 , 44 In particular, five speech timing and acoustic voice features extracted from the DCRP verbal recall carried substantial importance in predicting memory impairment on the RAVLT. The acoustic features that provided the most contribution to the multimodal cognitive impairment classification model were the average fundamental frequency, jitter, jitter Period Perturbation Quotient (PPQ5), and absolute‐valued jitter (Table 4).
Fundamental frequency, a correlate of voice pitch, has been shown in a number of studies to predict MCI and ADRD. 46 , 47 , 48 These studies have investigated fundamental frequency (F0) and cycle‐to‐cycle characteristics of frequency revealing that individuals with cognitive impairment tend to have lower mean of F0 and higher cycle‐to‐cycle variations. From a real‐world perspective, these acoustic features result in lower sounding vocal pitch and a flat, monotonous affect, respectively. This research has shown consistently lower fundamental frequency (and range of frequencies) in individuals with varying levels of cognitive impairment. Clinically, this results in a flat affect, with fewer fluctuations in the tone of the voice.
Jitter quantifies the cycle to cycle (peak to peak) variations of speech frequencies. 40 , 44 Disordered jitter output is commonly seen in dysphonic voices where the vocal folds vibrate in an abnormal way (or are very breathy). Jitter PPQ5 and absolute‐valued jitter compare individual voice signal periods with the five speech cycles that surround them. Generally, higher jitter values correlate with rougher sounding, breathy voice quality that sounds less natural and more disordered than traditional voice. 49 , 50 Several researchers suggest that mean, absolute, and PPQ5 jitter tend to be higher in individuals with cognitive impairment. 25 , 51 , 52 Perceptually, an increase in these jitter measures is associated with breathy, strained voices that lack stability. 50 Increased vocal instability also affects the overall perception of voice quality.
The speech timing and acoustic voice features shown to be most associated with cognitive impairment in this study are consistent with previous literature related to predicting MCI and ADRD. 25 Research indicates that the speech of individuals with cognitive impairment is slower, with more frequent silent pauses both long and short. 23 , 25 , 53 , 54 Most consistently, there is a higher percentage, count, length, and rate of silent pauses especially compared to speech content. The number of long pauses has evidence of being negatively impacted by cognitive impairment in a number of different speech contexts: reading, sentence repetition, picture description, and spontaneous speech. 25 , 53 , 55 , 56 The current research demonstrates increased number and length of silent pauses in a relatively short three‐word recall context for individuals with cognitive impairment.
The ROC curves in Figure 2 demonstrate the ability of each statistical model in classifying memory impairment as determined by the age‐adjusted RAVLT. 33 , 42 These findings are of increasing clinical importance due to recent research indicating a wide range of Sens and Spec for commonly used tests like the MMSE, MiniCog, and MoCA, particularly in the early identification of MCI. 15 Arevalo‐Rodrigez et al. published a systematic review of the MMSE's utility in early detection of cognitive impairment in AD, stating: “Although the MMSE […] covers multiple cognitive domains at once, it is necessary to remark that this test was not developed to identify the early stages of dementia or even to predict the development of dementia in the long term. In our review, […] the descriptive data provided by the studies showed that neither the sensitivity nor specificity exceeded 80% at the same time.” 15 They then called for cautioned use of the commonly used cognitive assessments and recommended a more specialized cognitive screening tool.
Besides the statistical model based on demographics, the DCTclock only model demonstrated the lowest performance of the cognitive assessments included in this analysis. However, the DCTclock graphomotor features proved crucial in cognitive impairment classification both when recall and speech and voice analysis were included in the models (Table 4 and Figure 2). In particular, DCTclock latency values and spatial reasoning features are important when paired with recall accuracy and result in a more accurate cognitive impairment DCRP classification model.
At an average time to completion of 3 min, the DCRP is quicker to administer than most other commonly used cognitive assessments, can be easily integrated into electronic health records, and avoids many false positives that might otherwise be cumbersome to primary care and clinical workflows. Including voice and speech to enhance cognitive impairment analytics models, the DCRP has increased classification accuracy over graphomotor analysis during digital clock drawing and verbal recall accuracy alone, thereby increasing its value in a clinical setting. By removing the subjectivity in scoring and the necessity for manual data entry required by paper and pencil cognitive testing, the DCRP is a brief, scalable, multimodal, alternative cognitive screening option.
Limitations of this work include the cross‐sectional nature of the data collected. While research indicates that the acoustic features used in this study present good to excellent reliability in normal healthy individuals (ICC = 0.76 to 0.99), 57 , 58 there is evidence to suggest small but statistically significant variability of these features over time. 59 , 60 , 61 , 62 Future investigations should include a longitudinal analysis of speech timing and acoustic voice features from a number of speaking contexts in memory and cognitively impaired populations. Further longitudinal analysis should include validation of findings. Finally, the cohorting used to classify memory (RAVLT long delay) did so into cognitively impaired and unimpaired groups. Future research should be enhanced with inclusion of neuroimaging or fluid biomarkers of MCI or mild dementia due to AD such as beta‐amyloid and/or tau to understand the ability of the DCRP to classify individuals who exhibit both cognitive impairment and AD biomarker positivity.
The current research contributes to the prevailing speech profile of individuals with cognitive impairment, suggesting that it is associated with slower speech, with a particular effect on the duration, frequency, and percentage of pauses compared to speech. Novel contributions include increased classification accuracy of memory impairment using speech timing and acoustic features extracted from a limited number of words compared to traditional, longer duration speech tasks. Consistent with the recent consensus work group requirements for brief cognitive assessments, the DCRP can be completed under 5 min, available in multiple languages, with the capability of integrating with electronic health records. 17 The current study shows that the DCRP also meets the rigorous requirements of the consensus work group that clinically relevant brief cognitive assessments are recommended to show 80% sensitivity and specificity.
CONFLICT OF INTEREST STATEMENT
Alvaro Pascual‐Leone is a co‐founder and Chief Medical Officer of Linus Health and declares ownership of shares or share options in the company. Alvaro Pascual‐Leone serves as a paid member of the scientific advisory boards for Neuroelectrics, Magstim Inc., TetraNeuron, Skin2Neuron, MedRhythms, and Hearts Radiant. David Bates is a co‐founder and Chief Executive Officer of Linus Health, and declares ownership of shares or share options in the company. John Showalter is the Chief Product Officer of Linus Health and declares ownership of shares or share options in the company. All other authors are employees of Linus Health and declare ownership of shares or share options in the company. Author disclosures are available in the supporting information
CONSENT STATEMENT
Written informed consent was obtained from all participants, or in the case of cognitively impaired persons, from proxies.
Supporting information
Supporting Information
Supporting Information
Supporting Information
Supporting Information
Supporting Information
Supporting Information
Supporting Information
Supporting Information
ACKNOWLEDGMENTS
The authors thank Anthony Le and Sean Kamano for their contributions to the speech and voice analysis engines during their time at Linus Health in the early stages of this work. No external funding was received for the conducting of this study.
Banks R, Higgins C, Greene BR, et al. Clinical classification of memory and cognitive impairment with multimodal digital biomarkers. Alzheimer's Dement. 2024;16:e12557. 10.1002/dad2.12557
DATA AVAILABILITY STATEMENT
The data that support the findings of this study were collected as part of the Bio‐Hermes study (ClinicalTrials.gov Identifier: NCT04733989) and are governed by the Global Alzheimer's Platform (GAP) consortium agreement. Data will be made available to the public via the Alzheimer's Disease Data Initiative (ADDI) Work bench in January 2025. All requests for data access should be made directly to GAP. The code used to calculate the reported results are available from Linus Health, Inc. upon reasonable request and with the permission of Linus Health, Inc. Usage restrictions apply to the availability of this code, which is not immediately publicly available.
REFERENCES
- 1. Brodaty H, Donkin M. Family caregivers of people with dementia. Dialogues Clin Neurosci. 2009;11(2):217‐228. doi: 10.31887/DCNS.2009.11.2/hbrodaty [DOI] [PMC free article] [PubMed] [Google Scholar]
- 2. Hudomiet P, Hurd MD, Rohwedder S. The relationship between lifetime out‐of‐pocket medical expenditures, dementia, and socioeconomic status in the U.S. J Econ Ageing. 2019;14:100181. doi: 10.1016/j.jeoa.2018.11.006 [DOI] [PMC free article] [PubMed] [Google Scholar]
- 3. World Health Organization . Global Status Report on the Public Health Response to Dementia. World Health Organization; 2021. Accessed May 23, 2022. https://apps.who.int/iris/handle/10665/344701 [Google Scholar]
- 4. Nandi A, Counts N, Chen S, et al. Global and regional projections of the economic burden of Alzheimer's disease and related dementias from 2019 to 2050: a value of statistical life approach. eClinicalMedicine. 2022;51:101580. doi: 10.1016/j.eclinm.2022.101580 [DOI] [PMC free article] [PubMed] [Google Scholar]
- 5. van Dyck CH, Swanson CJ, Aisen P, et al. Lecanemab in early Alzheimer's disease. N Engl J Med. 2023;388(1):9‐21. doi: 10.1056/NEJMoa2212948 [DOI] [PubMed] [Google Scholar]
- 6. Eisai Inc. A Placebo‐Controlled, Double‐Blind, Parallel‐Group, 18‐Month Study with an Open‐Label Extension Phase to Confirm Safety and Efficacy of BAN2401 in Subjects with Early Alzheimer's Disease. clinicaltrials.gov; 2022. Accessed May 16, 2023. https://clinicaltrials.gov/ct2/show/NCT03887455
- 7. Eli Lilly and Company . A Study of Donanemab (LY3002813) in Participants with Early Alzheimer's Disease (TRAILBLAZER‐ALZ 2)—Full Text View—ClinicalTrials.gov. Accessed May 17, 2023. https://www.clinicaltrials.gov/ct2/show/NCT04437511
- 8. Mintun MA, Lo AC, Duggan Evans C, et al. Donanemab in early Alzheimer's disease. N Engl J Med. 2021;384(18):1691‐1704. doi: 10.1056/NEJMoa2100708 [DOI] [PubMed] [Google Scholar]
- 9. Lecanemab‐irmb (LEQEMBI) Criteria for Use. 2023.
- 10. Lee M, Whitsel E, Avery C, et al. Variation in population attributable fraction of dementia associated with potentially modifiable risk factors by race and ethnicity in the US. JAMA Netw Open. 2022;5(7):e2219672. doi: 10.1001/jamanetworkopen.2022.19672 [DOI] [PMC free article] [PubMed] [Google Scholar]
- 11. Livingston G, Huntley J, Sommerlad A, et al. Dementia prevention, intervention, and care: 2020 report of the Lancet Commission. Lancet Lond Engl. 2020;396(10248):413‐446. doi: 10.1016/S0140-6736(20)30367-6 [DOI] [PMC free article] [PubMed] [Google Scholar]
- 12. Brodaty H, Aerts L, Crawford JD, et al. Operationalizing the diagnostic criteria for mild cognitive impairment: the salience of objective measures in predicting incident dementia. Am J Geriatr Psychiatry. 2017;25(5):485‐497. doi: 10.1016/j.jagp.2016.12.012 [DOI] [PubMed] [Google Scholar]
- 13. Ranson JM, Kuźma E, Hamilton W, Muniz‐Terrera G, Langa KM, Llewellyn DJ. Predictors of dementia misclassification when using brief cognitive assessments. Neurol Clin Pract. 2019;9(2):109‐117. doi: 10.1212/CPJ.0000000000000566 [DOI] [PMC free article] [PubMed] [Google Scholar]
- 14. Hoops S, Nazem S, Siderowf AD, et al. Validity of the MoCA and MMSE in the detection of MCI and dementia in Parkinson disease. Neurology. 2009;73(21):1738‐1745. doi: 10.1212/WNL.0b013e3181c34b47 [DOI] [PMC free article] [PubMed] [Google Scholar]
- 15. Arevalo‐Rodriguez I, Smailagic N, Roqué‐Figuls M, et al. Mini‐Mental State Examination (MMSE) for the early detection of dementia in people with mild cognitive impairment (MCI). Cochrane Dementia and Cognitive Improvement Group, ed. Cochrane Database Syst Rev. 2021;2021(7). doi: 10.1002/14651858.CD010783.pub3 [DOI] [PMC free article] [PubMed] [Google Scholar]
- 16. Nasreddine ZS, Phillips NA, Bédirian V, et al. The Montreal Cognitive Assessment, MoCA: a brief screening tool for mild cognitive impairment: MOCA: a brief screening tool for MCI. J Am Geriatr Soc. 2005;53(4):695‐699. doi: 10.1111/j.1532-5415.2005.53221.x [DOI] [PubMed] [Google Scholar]
- 17. Mattke S, Batie D, Chodosh J, et al.Expanding the use of brief cognitive assessments to detect suspected early‐stage cognitive impairment in primary care. Alzheimers Dement. 2023; 9 (19): 4252‐4259 doi: 10.1002/alz.13051 [DOI] [PubMed] [Google Scholar]
- 18. Helbig T, Toro‐Serey C, Thompson K, et al. Reliability of tablet‐based Digital Clock Drawing Task (DCTclock) for automated detection of cognitive impairment (P6‐6.005). Neurology. 2023;100(Supplement 2): 17. doi: 10.1212/WNL.0000000000204189 [DOI] [Google Scholar]
- 19. Rentz DM, Papp KV, Mayblyum DV, et al. Association of digital clock drawing with PET amyloid and tau pathology in normal older adults. Neurology. 2021;96(14):e1844‐e1854. doi: 10.1212/WNL.0000000000011697 [DOI] [PMC free article] [PubMed] [Google Scholar]
- 20. Souillard‐Mandar W, Davis R, Rudin C, et al. Learning classification models of cognitive conditions from subtle behaviors in the digital Clock Drawing Test. Mach Learn. 2016;102(3):393‐441. doi: 10.1007/s10994-015-5529-5 [DOI] [PMC free article] [PubMed] [Google Scholar]
- 21. Souillard‐Mandar W, Penney D, Schaible B, Pascual‐Leone A, Au R, Davis R. DCTclock: clinically‐Interpretable and automated artificial intelligence analysis of drawing behavior for capturing cognition. Front Digit Health. 2021;3:750661. doi: 10.3389/fdgth.2021.750661 [DOI] [PMC free article] [PubMed] [Google Scholar]
- 22. Monnappa D, Balasubramanium RK. Cepstral analysis of voice in healthy aged individuals. J Laryngol Voice. 2015;5(2):34. doi: 10.4103/2230-9748.183963 [DOI] [Google Scholar]
- 23. Themistocleous C, Eckerström M, Kokkinakis D. Voice quality and speech fluency distinguish individuals with mild cognitive impairment from healthy controls. PLOS ONE. 2020;15(7):e0236009. doi: 10.1371/journal.pone.0236009 [DOI] [PMC free article] [PubMed] [Google Scholar]
- 24. Agbavor F, Liang H. Predicting dementia from spontaneous speech using large language models. PLOS Digit Health. 2022;1(12):e0000168. doi: 10.1371/journal.pdig.0000168 [DOI] [PMC free article] [PubMed] [Google Scholar]
- 25. Martínez‐Nicolás I, Llorente TE, Martínez‐Sánchez F, Meilán JJG. Ten years of research on automatic voice and speech analysis of people with Alzheimer's disease and mild cognitive impairment: a systematic review article. Front Psychol. 2021;12: 620251. https://www.frontiersin.org/article/10.3389/fpsyg.2021.620251 [DOI] [PMC free article] [PubMed] [Google Scholar]
- 26. Beauregard DW, Mohs R, Dwyer J, et al. Bio‐Hermes: a validation study to assess a meaningful relationship between blood and digital biomarkers with Aβ PET scans for Alzheimer's disease. Alzheimers Dement. 2022;18(S5):e063676. doi: 10.1002/alz.063676 [DOI] [Google Scholar]
- 27. Wolz R, Bork J, Cordell C, et al. An investigation of HCV as a predictor of cognitive decline: the Bio‐Hermes protocol. Alzheimers Dement. 2021;17(S9):e053737. doi: 10.1002/alz.053737 [DOI] [Google Scholar]
- 28. Global Alzheimer's Platform . Bio‐Hermes study. Accessed May 11, 2022. https://globalalzplatform.org/biohermesstudy/
- 29. Dawidowicz LL, Ash E, Korczyn AD, Andelman F, Levy S, Elkana O. Can the RAVLT predict deterioration from MCI to dementia? Data from long term follow up. Exp Aging Res. 2021;47(4):347‐356. doi: 10.1080/0361073X.2021.1898182 [DOI] [PubMed] [Google Scholar]
- 30. Vakil E, Greenstein Y, Blachstein H. Normative data for composite scores for children and adults derived from the rey auditory verbal learning test. Clin Neuropsychol. 2010;24(4):662‐677. doi: 10.1080/13854040903493522 [DOI] [PubMed] [Google Scholar]
- 31. Messinis L, Nasios G, Mougias A, et al. Age and education adjusted normative data and discriminative validity for Rey's Auditory Verbal Learning Test in the elderly Greek population. J Clin Exp Neuropsychol. 2016;38(1):23‐39. doi: 10.1080/13803395.2015.1085496 [DOI] [PubMed] [Google Scholar]
- 32. Folstein MF, Folstein SE, McHugh PR. “Mini‐mental state”: a practical method for grading the cognitive state of patients for the clinician. J Psychiatr Res. 1975;12(3):189‐198. [DOI] [PubMed] [Google Scholar]
- 33. Mitrushina M, Boone KB, Razani J, D'Elia LF. Handbook of Normative Data for Neuropsychological Assessment. Oxford University Press; 2005. [Google Scholar]
- 34. Bour A, Rasquin S, Boreas A, Limburg M, Verhey F. How predictive is the MMSE for cognitive performance after stroke? J Neurol. 2010;257(4):630‐637. doi: 10.1007/s00415-009-5387-9 [DOI] [PMC free article] [PubMed] [Google Scholar]
- 35. Markwick A, Zamboni G, de Jager CA. Profiles of cognitive subtest impairment in the Montreal Cognitive Assessment (MoCA) in a research cohort with normal Mini‐Mental State Examination (MMSE) scores. J Clin Exp Neuropsychol. 2012;34(7):750‐757. doi: 10.1080/13803395.2012.672966 [DOI] [PubMed] [Google Scholar]
- 36. Trzepacz PT, Hochstetler H, Wang S, Walker B, Saykin AJ. Relationship between the Montreal Cognitive Assessment and mini‐mental state examination for assessment of mild cognitive impairment in older adults. BMC Geriatr. 2015;15:107. doi: 10.1186/s12877-015-0103-3 [DOI] [PMC free article] [PubMed] [Google Scholar]
- 37. Gale SD, Baxter L, Connor DJ, Herring A, Comer J. Sex differences on the Rey Auditory Verbal Learning Test and the Brief Visuospatial Memory Test–Revised in the elderly: normative data in 172 participants. J Clin Exp Neuropsychol. 2007;29(5):561‐567. doi: 10.1080/13803390600864760 [DOI] [PubMed] [Google Scholar]
- 38. McFee B, Raffel C, Liang D, et al. librosa: Audio and Music Signal Analysis in Python. In. 2015:18‐24. doi: 10.25080/Majora-7b98e3ed-003 [DOI]
- 39. McFee B, Raffel C, Liang D, et al. librosa: Audio and Music Signal Analysis in Python. Proc 14th Python Sci Conf; Published online 2015:18‐24. doi: 10.25080/Majora-7b98e3ed-003 [DOI]
- 40. Teixeira JP, Fernandes PO. Jitter shimmer and HNR classification within gender, tones and vowels in healthy voices. Procedia Technol. 2014;16:1228‐1237. doi: 10.1016/j.protcy.2014.10.138 [DOI] [Google Scholar]
- 41. Zhao Y, Udell M. gcimpute: A Package for Missing Data Imputation. Published online March 9, 2022. doi: 10.48550/arXiv.2203.05089 [DOI]
- 42. Stricker NH, Christianson TJ, Lundt ES, et al. Mayo Normative Studies: regression‐based normative data for the Auditory Verbal Learning Test for ages 30‐91 years and the importance of adjusting for sex. J Int Neuropsychol Soc JINS. 2021;27(3):211‐226. doi: 10.1017/S1355617720000752 [DOI] [PMC free article] [PubMed] [Google Scholar]
- 43. Maryn Y, Ysenbaert F, Zarowski A, Vanspauwen R. Mobile communication devices, ambient noise, and acoustic voice measures. J Voice. 2017;31(2):248.e11‐248.e23. doi: 10.1016/j.jvoice.2016.07.023 [DOI] [PubMed] [Google Scholar]
- 44. Bottalico P, Codino J, Cantor‐Cutiva LC, et al. Reproducibility of voice parameters: the effect of room acoustics and microphones. J Voice Off J Voice Found. 2020;34(3):320‐334. doi: 10.1016/j.jvoice.2018.10.016 [DOI] [PMC free article] [PubMed] [Google Scholar]
- 45. Lin H, Karjadi C, Ang TFA, et al. Identification of digital voice biomarkers for cognitive health. Explor Med. 2020;1:406‐417. doi: 10.37349/emed.2020.00028 [DOI] [PMC free article] [PubMed] [Google Scholar]
- 46. Themistocleous C, Eckerström M, Kokkinakis D. Identification of mild cognitive impairment from speech in Swedish using deep sequential neural networks. Front Neurol. 2018;9: 975. Accessed May 30, 2023. https://www.frontiersin.org/articles/10.3389/fneur.2018.00975 [DOI] [PMC free article] [PubMed] [Google Scholar]
- 47. Nagumo R, Zhang Y, Ogawa Y, et al. Automatic detection of cognitive impairments through acoustic analysis of speech. Curr Alzheimer Res. 2020;17(1):60‐68. doi: 10.2174/1567205017666200213094513 [DOI] [PMC free article] [PubMed] [Google Scholar]
- 48. Gonzalez‐Moreira E, Torres‐Boza D, Kairuz HA, et al. Automatic prosodic analysis to identify mild dementia. BioMed Res Int. 2015;2015:e916356. doi: 10.1155/2015/916356 [DOI] [PMC free article] [PubMed] [Google Scholar]
- 49. Martens JWMAF, Versnel H, Dejonckere PH. The effect of visible speech in the perceptual rating of pathological voices. Arch Otolaryngol Neck Surg. 2007;133(2):178‐185. doi: 10.1001/archotol.133.2.178 [DOI] [PubMed] [Google Scholar]
- 50. Lopes LW, Cavalcante DP, da Costa PO. Severity of voice disorders: integration of perceptual and acoustic data in dysphonic patients. CoDAS. 2014;26:382‐388. doi: 10.1590/2317-1782/20142013033 [DOI] [PubMed] [Google Scholar]
- 51. Yoshii K, Kimura D, Kosugi A, et al. Screening of mild cognitive impairment through conversations with humanoid robots: exploratory pilot study. JMIR Form Res. 2023;7(1):e42792. doi: 10.2196/42792 [DOI] [PMC free article] [PubMed] [Google Scholar]
- 52. Meilán JJG, Martínez‐Sánchez F, Carro J, López DE, Millian‐Morell L, Arana JM. Speech in Alzheimer's disease: can temporal and acoustic parameters discriminate dementia? Dement Geriatr Cogn Disord. 2014;37(5‐6):327‐334. doi: 10.1159/000356726 [DOI] [PubMed] [Google Scholar]
- 53. Pistono A, Jucla M, Barbeau EJ, et al. Pauses during autobiographical discourse reflect episodic memory processes in early Alzheimer's disease. J Alzheimers Dis. 2016;50(3):687‐698. doi: 10.3233/JAD-150408 [DOI] [PMC free article] [PubMed] [Google Scholar]
- 54. Toth L, Hoffmann I, Gosztolya G, et al. A speech recognition‐based solution for the automatic detection of mild cognitive impairment from spontaneous speech. Curr Alzheimer Res. 2018;15(2):130‐138. doi: 10.2174/1567205014666171121114930 [DOI] [PMC free article] [PubMed] [Google Scholar]
- 55. Pastoriza‐Domínguez P, Torre IG, Diéguez‐Vide F, et al. Speech pause distribution as an early marker for Alzheimer's disease. Speech Commun. 2022;136:107‐117. doi: 10.1016/j.specom.2021.11.009 [DOI] [Google Scholar]
- 56. Satt A, Sorin A, Toledo‐Ronen O, et al. Evaluation of speech‐based protocol for detection of early‐stage dementia. In: Interspeech 2013. ISCA; 2013:1692‐1696. doi: 10.21437/Interspeech.2013-32 [DOI] [Google Scholar]
- 57. Park Y, Stepp CE. Test–retest reliability of relative fundamental frequency and conventional acoustic, aerodynamic, and perceptual measures in individuals with healthy voices. J Speech Lang Hear Res. 2019;62(6):1707‐1718. doi: 10.1044/2019_JSLHR-S-18-0507 [DOI] [PMC free article] [PubMed] [Google Scholar]
- 58. Brockmann‐Bauser M, de Paula Soares MF. Do we get what we need from clinical acoustic voice measurements? Appl Sci. 2023;13(2):941. doi: 10.3390/app13020941 [DOI] [Google Scholar]
- 59. Castillo‐Allendes A, Cantor‐Cutiva LC, Hunter EJ. Acoustic Effects of Vocal Warm‐Up: A 7‐Week Longitudinal Case Study. J Voice. 2021. Nov 26:S0892‐1997 (21)00331‐3. Epub ahead of print. doi: 10.1016/j.jvoice.2021.09.030 [DOI] [PMC free article] [PubMed] [Google Scholar]
- 60. Hunter EJ, Kapsner‐Smith M, Pead P, Engar MZ, Brown WR. Age and speech production: a longitudinal study of 50 years. J Am Geriatr Soc. 2012;60(6):1175‐1177. doi: 10.1111/j.1532-5415.2012.03983.x [DOI] [PMC free article] [PubMed] [Google Scholar]
- 61. Decoster W, Debruyne F. Changes in spectral measures and voice‐onset time with age: a cross‐sectional and a longitudinal study. Folia Phoniatr Logop. 1997;49(6):269‐280. doi: 10.1159/000266467 [DOI] [PubMed] [Google Scholar]
- 62. Kasuya H, Yoshida H, Ebihara S, Mori H. Longitudinal changes of selected voice source parameters . 2010;(1):2570‐2573. doi: 10.21437/Interspeech.2010-695 [DOI]
Associated Data
This section collects any data citations, data availability statements, or supplementary materials included in this article.
Supplementary Materials
Supporting Information
Supporting Information
Supporting Information
Supporting Information
Supporting Information
Supporting Information
Supporting Information
Supporting Information
Data Availability Statement
The data that support the findings of this study were collected as part of the Bio‐Hermes study (ClinicalTrials.gov Identifier: NCT04733989) and are governed by the Global Alzheimer's Platform (GAP) consortium agreement. Data will be made available to the public via the Alzheimer's Disease Data Initiative (ADDI) Work bench in January 2025. All requests for data access should be made directly to GAP. The code used to calculate the reported results are available from Linus Health, Inc. upon reasonable request and with the permission of Linus Health, Inc. Usage restrictions apply to the availability of this code, which is not immediately publicly available.