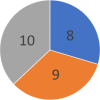
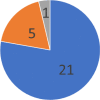
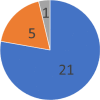
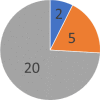
Table 4.
Breakdown of implementation of the four case studies. Frequently mentioned facilitators and obstacles to each case study are presented below the implementation counts. *Potential facilitators as study has not been implemented widely
| Total sites (N = 27) | Progression criteria | DAMOCLES | Statistical analysis plans | RECAP |
|---|---|---|---|---|
|
|

|

|

|

|
| Facilitators |
• Funder expectations (n = 8) • Best practice (n = 4) • Perceived as quality/useful (n = 4) |
• Clear guidance with useful templates (n = 8) • Best practice (n = 6) • Standardisation (n = 6) • Transparency/defining roles (n = 5) |
• Standardisation (n = 9) • Best practice (n = 7) • Clear improvements to practice (n = 6) • Perceived as quality/useful (n = 5) |
• Best practice* (n = 5) • Improve consistency in practice* (n = 2) |
| Obstacles |
• No expertise/not typically involved in area (n = 8) • Lack of awareness (n = 3) |
• Time/resource limitations (n = 2) |
• Other SOP already in use (n = 5) • Time/resource limitations (n = 2) |
• Lack of awareness (n = 13) • Unclear how to implement (n = 2) |
