

Abstract
The fourth joint inter‐agency report on integrated analysis of antimicrobial consumption (AMC) and the occurrence of antimicrobial resistance (AMR) in bacteria from humans and food‐producing animals (JIACRA) addressed data obtained by the Agencies' EU‐wide surveillance networks for 2019–2021. The analysis also sought to identify whether significant trends in AMR and AMC were concomitant over 2014–2021. AMC in both human and animal sectors, expressed in mg/kg of estimated biomass, was compared at country and European level. In 2021, the total AMC was assessed at 125.0 mg/kg of biomass for humans (28 EU/EEA countries, range 44.3–160.1) and 92.6 mg/kg of biomass for food‐producing animals (29 EU/EEA countries, range 2.5–296.5). Between 2014 and 2021, total AMC in food‐producing animals decreased by 44%, while in humans, it remained relatively stable. Univariate and multivariate analyses were performed to study associations between AMC and AMR for selected combinations of bacteria and antimicrobials. Positive associations between consumption of certain antimicrobials and resistance to those substances in bacteria from both humans and food‐producing animals were observed. For certain combinations of bacteria and antimicrobials, AMR in bacteria from humans was associated with AMR in bacteria from food‐producing animals which, in turn, was related to AMC in animals. The relative strength of these associations differed markedly between antimicrobial class, microorganism and sector. For certain antimicrobials, statistically significant decreasing trends in AMC and AMR were concomitant for food‐producing animals and humans in several countries over 2014‐2021. Similarly, a proportion of countries that significantly reduced total AMC also registered increasing susceptibility to antimicrobials in indicator E. coli from food‐producing animals and E. coli originating from human invasive infections (i.e., exhibited ‘complete susceptibility’ or ‘zero resistance’ to a harmonised set of antimicrobials). Overall, the findings suggest that measures implemented to reduce AMC in food‐producing animals and in humans have been effective in many countries. Nevertheless, these measures need to be reinforced so that reductions in AMC are retained and further continued, where necessary. This also highlights the importance of measures that promote human and animal health, such as vaccination and better hygiene, thereby reducing the need for use of antimicrobials.
Keywords: antimicrobial consumption, antimicrobial resistance, comparative trend analysis, ecological analysis, food‐producing animals, logistic regression, partial least square path modelling, public health
SUMMARY
This report was produced, at the request of the European Commission, as a collaboration between the European Centre for Disease Prevention and Control (ECDC), the European Food Safety Authority (EFSA) and the European Medicines Agency (EMA). It is the fourth joint inter‐agency report on integrated analysis of antimicrobial agent consumption and occurrence of antimicrobial resistance in bacteria from humans and food‐producing animals (JIACRA), covering the years 2019–2021. Moreover, for the first time it includes a joint analysis of trends in consumption and resistance in the same populations in humans and animals over the period from 2014 to 2021.
Antimicrobial resistance (AMR) constitutes a significant public health challenge in Europe as well as in other parts of the world, representing a serious health and economic burden and a threat to animal health and the production of food of animal origin. The main driver behind AMR is antimicrobial consumption (AMC), in both humans and animals. Recognising that human and animal health are interconnected, this report is based on a One Health approach.
Aim and scope of the report
This report provides an integrated analysis of relationships between AMC in humans and food‐producing animals and the occurrence of AMR in bacteria from humans and food‐producing animals, respectively, as well as the association between AMC and AMR in food‐producing animals and AMR in bacteria from humans.
Methods
The results and conclusions of this report are based on data from 2019, 2020 and 2021. For trend analyses, data for 2014–2021 were also included.
The data originate from five different surveillance/monitoring networks coordinated by the agencies and cover the European Union (EU) Member States, two European Economic Area (EEA) countries (Iceland and Norway) and Switzerland (only for data on food‐producing animals). The data were collected as part of existing clinical and epidemiological surveillance/monitoring systems of AMC and AMR and not specifically for the purposes of this report. The report covers seven antimicrobial groups (carbapenems, third‐ and fourth‐generation cephalosporins, fluoroquinolones and other quinolones, aminopenicillins, polymyxins, macrolides and tetracyclines). It focuses on resistance to these antimicrobials in Escherichia coli and Campylobacter spp. In addition, resistance to carbapenems in Klebsiella pneumoniae was included due to its specific importance for humans. In contrast to previous JIACRA reports and considering the limited number of Salmonella isolates of certain serovars in the animal sector and the association of AMR patterns with specific serovars, the analysis of resistance in Salmonella spp. from humans and animals was not prioritised and it is presented in the Annex.
Differences between the data collection systems of the networks are acknowledged. For example, bacterial isolates from humans are sampled from clinically ill individuals in a healthcare setting, while isolates from food‐producing animals are sampled from healthy animals domestically produced at slaughter. Food‐producing animals include broilers, turkeys, cattle under 1 year of age and pigs. Additionally, data on isolates from the Salmonella national control programmes are included in the analysis of resistance in Salmonella spp. from animals and humans (Annex B). Some analyses involving AMR in bacterial isolates from food‐producing animals include combined data from two successive years, as different animal species are monitored in even‐ and odd‐numbered years, respectively. The integrated analyses of data from humans and food‐producing animals presented here focused on combinations of antimicrobials and bacterial species considered of relevance for public health. For the comparison between AMC in humans and in food‐producing animals, data for AMC in humans, expressed as defined daily doses (DDDs) per 1000 inhabitants per day, were converted into mg of active antimicrobial substance used per kg of estimated biomass (for more details see text box under Figure 8). To allow analyses of the relationships between AMC and AMR in pigs and poultry, respectively, a proxy for AMC in each population was obtained in the form of a technically derived estimate from sales data.
FIGURE 8.

Population‐weighted mean of the total consumption of antimicrobials in humansa and food‐producing animalsb in 26 EU/EEA countriesc for which data were available both for humans and food‐producing animals, mg per kg of estimated biomass, 2014–2021. aAntibacterials for systemic use (ATC group J01). bFor antimicrobial groups included in overall consumption data (ATC and ATCvet codes), please refer to Section 3.2. cAT, BE, BG, CY, DE, DK, EE, ES, FI, FR, HR, HU, IE, IS, IT, LT, LU, LV, NL, NO, PL, PT, RO, SE, SI, SK. The levels of consumption should be compared with caution between humans and animals, as the calculation of the denominator differs. For details see text box under Figure 8. In the box plots, the lowest boundary indicates the 25th percentile, the black horizontal line within the box marks the median and the upper boundary of the box indicates the 75th percentile. The vertical extending lines denote the most extreme values within 1.5 interquartile range of the 25th and 75th percentile of each group. Only outlying observations (outside of this range) are represented as dots.
Through a series of univariate analyses and – when applicable – multivariate analysis, the relationships between consumption of selected antimicrobial groups and AMR in selected bacteria in humans and in food‐producing animals were examined as well as the potential associations between both sectors (Figure I) using data from 2019 to 2021. In this report, for the first time, trends in AMC and AMR and their concomitance were analysed for the time interval 2014–2021. The relationship between AMC in humans and AMR in bacteria from food‐producing animals was not addressed in this report. For analyses covering only one sector (food‐producing animals or humans), only univariate analyses were performed.
FIGURE I.

Schematic overview of the potential associations between antimicrobial consumption and antimicrobial resistance in humans and food‐producing animals investigated in this report.
Finally, five primary key indicators, originating from the outcome indicators for AMC and AMR developed by ECDC, EFSA and EMA (ECDC, EFSA, EMA, 2017a), were analysed at the national level and are presented in Table 55. For humans, the primary indicators included the total consumption of antimicrobials for systemic use, expressed as DDD per 1000 inhabitants per day, the proportion of methicillin‐resistant Staphylococcus aureus (MRSA) and the proportion of third‐generation cephalosporin‐resistant Escherichia coli. For food‐producing animals, the primary indicators included the overall sales of antimicrobials, expressed as mg per population correction unit (PCU), and the population‐weighted proportion of indicator commensal E. coli from broilers, fattening turkeys, fattening pigs and calves (weights equal PCU), that were completely susceptible to a predefined panel of antimicrobials. Results were based on the years 2014–2021.
TABLE 55.
A heatmap of the five key Primary indicators of antimicrobial consumption (AMC; expressed as Defined daily doses per 1000 inhabitants per day in humans and milligram per population correction unit for animals) and antimicrobial resistance (AMR represented by resistance of Escherichia coli to third‐generation cephalosporins and resistance of Staphylococcus aureus to methicillin in humans, and by complete susceptibility of Escherichia coli in food‐producing animals), for all EU/EEA countries, for the years 2014–2021.

Overview of results
Total EU/EEA population‐weighted mean antimicrobial consumption in humans and food‐producing animals
In 2021, the EU/EEA population‐weighted mean AMC, expressed in mg of active substance per kg estimated biomass was 125.0 mg/kg in humans (28 countries, range 44.3–160.1) and 92.6 mg/kg in food‐producing animals (29 countries, range 2.5–296.5). For both humans and food‐producing animals and as highlighted by the range of individual AMC country estimates and as shown in Figure II, there are still several countries with considerable higher AMC than the mean.
FIGURE II.

Population‐weighted mean of the total consumption of antimicrobials in humansa and food‐producing animalsb in 26 EU/EEA countriesc for which data were available both for humans and food‐producing animals, mg per kg of estimated biomass, 2014–2021. aAntibacterials for systemic use (ATC group J01). bFor antimicrobial groups included in overall consumption data (ATC and ATCvet codes), please refer to Section 3.2. cAT, BE, BG, CY, DE, DK, EE, ES, FI, FR, HR, HU, IE, IS, IT, LT, LU, LV, NL, NO, PL, PT, RO, SE, SI, SK. The levels of consumption should be compared with caution between humans and animals, as the calculation of the denominator differs. For details see text box under Figure 8. In the box plots, the lowest boundary indicates the 25th percentile, the black horizontal line within the box marks the median and the upper boundary of the box indicates the 75th percentile. The vertical extending lines denote the most extreme values within 1.5 interquartile range of the 25th and 75th percentile of each group. Only outlying observations (outside of this range) are represented as dots.
A statistically significant reduction in total AMC in food‐producing animals has been observed since 2014, while total AMC in humans has been relatively stable (Figure II). However, there was an increase in the completeness of AMC reporting for humans during this period, which could mask reductions in AMC in humans.
For individual antimicrobial groups the level of consumption and trends varied, as summarised in the text box below in this Summary.
Associations between antimicrobial consumption and antimicrobial resistance in humans and food‐producing animals
The findings of this fourth JIACRA report are in line with previous reports, confirming the associations between AMC and AMR and suggesting that further interventions to reduce AMC in both humans and food‐producing animals would have a beneficial impact on the occurrence of AMR in bacteria from both humans and food‐producing animals.
Data from 2019 to 2021 confirmed an association between consumption of certain groups of antimicrobials and the occurrence of AMR to these groups of antimicrobials in bacteria from both humans and food‐producing animals. In some cases, AMR in bacteria from humans was also associated with AMR in bacteria from food‐producing animals, especially for bacteria mostly causing food‐borne infections. More detailed information is available in the text box below in this Summary.
An overview over the results is presented in Figure III. The rows represent the different antimicrobials included in the analyses and the columns, the different bacteria analysed. The miniatures of Figure I included in Figure III represent the statistical associations observed. The different kinds of lines in Figure III represent different kinds of associations as explained in the figure caption.
FIGURE III.

Schematic overview of the associations between antimicrobial consumption and antimicrobial resistance in humans and food‐producing animals investigated and identified as a result of the analyses performed for this report.
Conclusions
The high levels of AMC and AMR still being reported in several EU/EEA countries show that prudent use of antimicrobial agents as well as infection prevention and control need to be further reinforced. Continued and coordinated action is needed to achieve a 20% reduction of AMC in humans by 2030 (compared to 2019 levels) and a 50% reduction in food‐producing animals by 2030 (compared to 2018 levels), as recommended by the European Council and as settled in the European Commission Farm‐to‐Fork strategy, respectively. The reduction of AMC both in humans and in food‐producing animals needed to achieve such targets, as well as the impact on AMR, will continue to be monitored by the EU agencies within the specific surveillance programmes. A coordinated response across sectors is essential and could be achieved by sustainable implementation of National Action Plans based on a One Health approach, including operational, monitoring and evaluation elements.
While this JIACRA report collates and analyses routinely collected surveillance/monitoring data on AMC and AMR in both humans and food‐producing animals, the availability of more detailed and comprehensive data would allow for better refined analyses and provide more robust results. The EU agencies continue to work on further harmonisation and integration of surveillance of AMC and of AMR across sectors, to better understand the relationships between AMC and AMR.
KEY FINDINGS BY ANTIMICROBIAL GROUP.
Carbapenems
Carbapenems are not authorised for use in food‐producing animals in the EU and therefore, only carbapenem consumption in humans was analysed in this report. To date, carbapenem resistance in E. coli from food‐producing animals is extremely rare.
Associations
A statistically significant positive association was found between consumption of carbapenems in humans and carbapenem resistance in human invasive Escherichia coli and Klebsiella pneumoniae isolates for all years (2019–2021).
As carbapenems cannot be used for animals; therefore, corresponding analyses of related associations for food‐producing animals or multivariate analysis could not be performed for this report.
Trends
At the national level, more countries (11/25) had a statistically significant increase in human consumption of carbapenems between 2014 and 2021, than a decrease (2/25). However, a decrease was unlikely in many countries on account of the low consumption level at the beginning of the observation period. Six countries out of 25 had an increase of carbapenem resistance in invasive E. coli from humans between 2014 and 2021.
Third‐ and fourth‐generation cephalosporins
In 2021, the EU/EEA population‐weighted mean consumption of third‐ and fourth‐generation cephalosporins was 5.1 mg/kg estimated biomass in humans and 0.2 mg/kg of estimated biomass in food‐producing animals.
Associations
Univariate analyses showed that, for humans, there were statistically significant positive associations between consumption of third‐ and fourth‐generation cephalosporins and resistance to third‐generation cephalosporins in invasive E. coli isolates for all years (2019–2021). Likewise, in food‐producing animals, a separate analysis based on the time periods 2018–2019, 2019–2020 and 2020–2021 showed a statistically significant association between consumption of third‐ and fourth‐generation cephalosporins and the prevalence of extended‐spectrum beta‐lactamase (ESBL)‐producing and/or AmpC beta‐lactamase‐producing E. coli.
In the final multivariate analysis model of resistance to third‐generation cephalosporins in invasive E. coli isolates from humans, however, the only 1 retained significant relationship was with consumption of third‐ and fourth‐generation cephalosporins in humans.
Trends
In most countries, consumption did not significantly change in food‐producing animals (17/27 countries) and in humans (18/25 countries) between 2014 and 2021.
In humans, among countries with a significant change in consumption of third‐ and fourth‐generation cephalosporins, more countries showed an increase than a decrease (5 vs. 1 countries). Resistance to third‐generation cephalosporins in invasive E. coli from humans showed no significant change in most countries. However, there were a few countries showing a statistically significant increase or decrease (6 vs. 6 countries).
In food‐producing animals, a significant decrease in consumption of third‐ and fourth‐generation cephalosporins was observed in seven countries, while in three countries, consumption increased. A significant decrease in resistance to third‐generation cephalosporins in E. coli was observed in 14 countries. In three of these countries, third‐ and fourth‐generation cephalosporin consumption and resistance showed a concomitant significant decrease. Only one country showed a concomitant significant increase of third‐ and fourth‐generation cephalosporin consumption and resistance in food‐producing animals.
Fluoroquinolones
In 2021, the EU/EEA population‐weighted mean consumption of fluoroquinolones and other quinolones was 6.3 mg/kg estimated biomass in humans and 2.9 mg/kg of estimated biomass in food‐producing animals.
Associations
A statistically significant positive association between consumption of fluoroquinolones and other quinolones in humans and consumption of these antimicrobials in food‐producing animals was observed for 2021, i.e. countries with high consumption in humans also tended to have a high consumption in food‐producing animals and vice versa.
Univariate analyses showed that, for humans, there were statistically significant positive associations between consumption of fluoroquinolones and other quinolones and resistance to fluoroquinolones in invasive E. coli were found for all years (2019–2021). Likewise, in food‐producing animals, statistically significant positive associations between consumption of fluoroquinolones and other quinolones and resistance to fluoroquinolones in indicator E. coli were found for all time periods (2018–2019, 2019–2020 and 2020–2021). Only 2 those associations were retained in the final multivariate analysis model.
For Campylobacter jejuni, univariate analysis showed that consumption of fluoroquinolones and other quinolones in humans was significantly associated with fluoroquinolone resistance in isolates from humans in 2 of the 3 years investigated. Likewise, consumption of fluoroquinolones in food‐producing animals was associated with fluoroquinolone resistance in C. jejuni from humans. Fluoroquinolone resistance in C. jejuni from turkeys and broilers was also significantly associated with fluoroquinolone resistance in C. jejuni from humans. For poultry, consumption of fluoroquinolones and other quinolones was associated with fluoroquinolone resistance in C. jejuni. The multivariate analysis model retained a direct association of consumption of fluoroquinolones and other quinolones in poultry with resistance in C. jejuni from poultry, which in turn was also associated with the occurrence of fluoroquinolone resistance in C. jejuni from humans.
For Campylobacter coli, univariate analysis showed that consumption of fluoroquinolones and other quinolones in humans was significantly associated with fluoroquinolone resistance in isolates from humans in 2021 only. Consumption of fluoroquinolones in pigs was significantly associated with fluoroquinolone resistance in C. coli from pigs. In the final multivariate model, the only association which remained significant was that of fluoroquinolone consumption in pigs and resistance found in isolates from pigs.
Trends
Over time, statistically significant decreases in consumption of fluoroquinolones and other quinolones were observed at the EU/EEA level both in humans and food‐producing animals, between 2014 and 2021.
No country showed a significant increase in consumption of fluoroquinolones and other quinolones in humans and 18 countries showed a significant decrease in consumption of these antimicrobials between 2014 and 2021. In seven of these latter countries, a concomitant decrease in fluoroquinolone resistance in invasive E. coli from humans was observed.
In food‐producing animals, 13 countries showed a significant decrease in consumption of fluoroquinolone and other quinolones and only one country reported an increase over the same time period, but this was not associated with a concomitant increase in resistance. Four countries observed a concomitant significant decrease both in the consumption of these antimicrobials and resistance to fluoroquinolones in indicator E. coli.
Polymyxins
In 2021, the EU/EEA population‐weighted mean consumption of polymyxins (colistin) was 0.7 mg/kg estimated biomass in humans and 2.5 mg/kg of estimated biomass in food‐producing animals.
Associations
Consumption of polymyxins in food‐producing animals was significantly associated with resistance to polymyxins in indicator E. coli from food‐producing animals for the time periods 2018–2019 and 2019–2020. When analysed separately for poultry and for pigs, the association was statistically significant for poultry for the only period analysed (2020), whereas in pigs, it was statistically significant in 2019 but not in 2021.
As data on polymyxin resistance were not available for bacterial isolates from humans, corresponding analyses of related associations for humans or multivariate analysis could not be performed for this report.
Trends
From 2014 to 2021, overall consumption of polymyxins in food‐producing animals in the EU/EEA decreased significantly, while it increased in humans.
In food‐producing animals, a larger number of countries recorded a statistically significant reduction in consumption, than an increase (9 vs. 0). Likewise, more countries registered a significant decrease in resistance (four) than an increase (one). Three countries observed a concomitant significant decrease in polymyxin consumption and polymyxin resistance in indicator E. coli from food‐producing animals. In many countries, the levels of polymyxin (colistin) resistance in E. coli isolates from food‐producing animals have already remained low over this period.
Aminopenicillins
In 2021, the EU/EEA population‐weighted mean consumption of aminopenicillins was 64.1 mg/kg estimated biomass in humans and 25.8 mg/kg of estimated biomass in food‐producing animals.
Associations
A statistically significant positive association was observed between consumption of aminopenicillins in humans and in food‐producing animals for 2021, i.e. countries with high consumption among humans also tended to have a high consumption in food‐producing animals and vice versa.
Univariate analyses showed that, in food‐producing animals, there were statistically significant positive associations between consumption of aminopenicillins and ampicillin resistance in indicator E. coli for all time periods (2018–2019, 2019–2020 and 2020–2021). Similarly, a statistically significant positive association between ampicillin resistance in indicator E. coli from food‐producing animals and ampicillin resistance in invasive E. coli from humans was observed for all years. Furthermore, statistically significant positive associations were observed between consumption of aminopenicillins in food‐producing animals as well as in humans and resistance to aminopenicillins in invasive E. coli from humans.
In the multivariate analysis, the final multivariate model only retained the statistically significant positive association of the consumption of aminopenicillins in food‐producing animals with aminopenicillin resistance in indicator E. coli from food‐producing animals, which, in turn was associated with aminopenicillin resistance in invasive E. coli from humans.
Trends
Between 2014 and 2021, the overall EU/EEA consumption of aminopenicillins significantly decreased in humans. No such trend was observed in food‐producing animals.
At the national level, significant findings included a statistically significant decrease in the consumption of aminopenicillins in humans in 18 countries between 2014 and 2021. Consumption did not increase in any country. During the same period, aminopenicillin resistance in invasive E. coli from humans also decreased in 17 countries. Thirteen countries saw a concomitant decrease of both aminopenicillin consumption and aminopenicillin resistance in E. coli during 2014–2021.
In food‐producing animals, more countries registered a decrease rather than a statistically significant increase in consumption of aminopenicillins during 2014–2021 (10 vs. 4 countries). Likewise, more countries recorded a significant decrease rather than an increase in aminopenicillin resistance in indicator E. coli (7 vs. 4). Four countries observed a concomitant significant decrease and one country a concomitant significant increase in aminopenicillin consumption and aminopenicillin resistance in E. coli from food‐producing animals.
Macrolides
In 2021, the EU/EEA population‐weighted mean consumption of macrolides was 6.2 mg/kg estimated biomass in humans and 7.8 mg/kg of estimated biomass in food‐producing animals.
Associations
A statistically significant positive association between the consumption of macrolides in humans and in food‐producing animals was observed, i.e. countries with a higher consumption among humans also tended to have a higher consumption in food‐producing animals and vice versa.
Univariate analyses showed that, in food‐producing animals, statistically significant positive associations were observed between the consumption of macrolides in pigs and the occurrence of macrolide resistance of C. coli from pigs in 2021.
The multivariate model retained the statistically significant positive association between the consumption of macrolides in food‐producing animals and macrolide resistance in C. coli from pigs, which, in turn was associated with macrolide resistance in C. coli from humans.
Trends
Between 2014 and 2021, the overall EU/EEA consumption of macrolides decreased both in humans and food‐producing animals. As resistance of E. coli to macrolides was not studied and, in this report, the trend analyses were only performed for data on E. coli, no comparative analysis of trends in consumption and resistance was performed for macrolides.
Tetracyclines
In 2021, the EU/EEA population‐weighted mean consumption of tetracyclines was 1.9 mg/kg estimated biomass in humans and 23.6 mg/kg of estimated biomass in food‐producing animals.
Associations
Univariate analyses showed that, in food‐producing animals, statistically significant positive associations were observed between the consumption of tetracyclines and tetracycline resistance in indicator E. coli. Moreover, significant positive associations were found between the estimated consumption of tetracyclines in poultry and the resistance of E. coli and C. jejuni from poultry to tetracyclines as well as between the estimated consumption of tetracyclines in pigs and the resistance of E. coli and C. coli from pigs to tetracyclines. Furthermore, for 2020, a statistically significant positive association was found between tetracycline resistance in C. jejuni from broilers and from turkeys and tetracycline resistance in C. jejuni from humans. Statistically significant associations were also observed between tetracycline consumption in food‐producing animals and tetracycline resistance in C. jejuni from humans for all years (2019–2021).
In the multivariate analysis, tetracycline resistance in C. jejuni from humans was associated with tetracycline resistance in C. jejuni from poultry. For C. coli, no significant associations could be assessed. For E. coli, no multivariate analysis was carried out as sufficient data on tetracycline resistance of invasive E. coli from humans were not available.
Trends
Between 2014 and 2021, the overall EU/EEA consumption of tetracyclines did not significantly change in humans but decreased significantly in food‐producing animals. At the national level, tetracycline consumption in food‐producing animals decreased in 18 countries and increased in two countries. Likewise, tetracycline resistance in indicator E. coli from food‐producing animals decreased in 18 countries and increased in only one country. In 14 countries, a concomitant statistically significant decrease both in tetracycline consumption and tetracycline resistance of E. coli from food‐producing animals was observed, while no country showed a concomitant increase both in tetracycline consumption and tetracycline resistance.
Total AMC and complete susceptibility in Escherichia coli
Associations
In both humans and food‐producing animals, a lower total AMC was significantly associated with a higher proportion of E. coli exhibiting complete susceptibility to a defined panel of antimicrobials. This was observed in all time periods (2018–2019, 2019–2020 and 2020–2021) confirming the general positive association between AMC with the level of AMR in E. coli. In food‐producing animals, this reflected the association and confirmed the consistency between the established primary key outcome indicators for AMC and AMR. In humans, complete susceptibility to a defined panel of antimicrobials in invasive E. coli isolates was assessed for the first time, using a different set of antimicrobials.
Trends
In humans, total AMC significantly decreased in 19 countries and did not significantly increase in any country between 2014 and 2021. During the same period, nine of these 19 countries saw a significant increase in the percentage of invasive E. coli with complete susceptibility to the defined set of antimicrobials in E. coli from humans, while five countries saw a decrease.
In food‐producing animals, 20 countries recorded a significant decrease in total AMC between 2014 and 2021, while three countries registered an increase. During the same period, 15 countries reported a significant increase in the proportion of indicator E. coli from food‐producing animals, exhibiting a complete susceptibility to the harmonised test panel of antimicrobials, while two countries registered a decrease. In ten countries, a significant decrease in total AMC was concomitant with a significant increase in the proportion of indicator E. coli isolates with complete susceptibility, while a concomitant increase in both was not detected in any country.
Primary key indicators
Primary key outcome indicators for humans and for food‐producing animals are reported by the EU agencies in their respective reports. In this JIACRA report, they are summarised in one chapter to allow comparison between humans and food‐producing animals.
Substantial variations of all five primary key indicators were observed among EU/EEA countries, and between years within each country. In a few countries, the key indicators were all at either a consistently high or a consistently low level during 2014–2021.
In most countries, the key AMC indicator values decreased, both for humans and for food‐producing animals.
For key AMR indicators, the proportion of indicator E. coli from food‐producing animals exhibiting complete antimicrobial susceptibility increased in about a half of EU/EEA countries (see above). In humans, the proportion of Staphylococcus aureus resistant to methicillin (i.e. MRSA) decreased in most EU/EEA countries, whereas the proportion of E. coli from humans with resistance to third‐generation cephalosporins showed divergent trends depending on the countries.
Salmonella species
Previous JIACRA reports had addressed Salmonella spp. due to its relevance as a food‐borne zoonotic pathogen. AMR data on Salmonella spp. have peculiarities in limited availability at the serovar level among sectors. Differences in resistance traits and epidemiology would also need to be taken into account in the assessment of associations and trends. For those reasons, associations between AMC and the occurrence of AMR in Salmonella spp. are more challenging to assess than those for other bacteria (e.g. E. coli and Campylobacter) considered in this report. For this report, Salmonella spp. analyses are consolidated in Annex B, while focusing on E. coli and Campylobacter spp. analyses in the main body of the report.
1. INTRODUCTION
Following requests from the European Commission based on the Action Plan against the rising threats from antimicrobial resistance (AMR) (European Commission, 2017), three agencies – the European Centre for Disease Prevention and Control (ECDC), the European Food Safety Authority (EFSA) and the European Medicines Agency (EMA) – have previously collaborated on the analysis of possible relationships between the antimicrobial consumption (AMC) in human and veterinary medicine and the occurrence of AMR in bacteria from humans and food‐producing animals in the European Union/European Economic Area (EU/EEA). For some analyses limited to food‐producing animals, data from Switzerland were also included. As a result, three Joint Inter‐agency Antimicrobial Consumption and Resistance Analysis (JIACRA) reports have been published to date, covering the periods 2011–2012, 2013–2015 and 2016–2018 respectively (ECDC, EFSA and EMA, 2017a, 2017b, 2021).
The compilation of this fourth JIACRA report arises from a request based on the ongoing commitment in the new ‘European One Health Action Plan against Antimicrobial Resistance (AMR)’, adopted by the European Commission in June 2017 (European Commission, 2017). This report includes an analysis of recent AMC and AMR surveillance data from 2019 to 2021 and, for the first time, trends in the association of AMC and AMR in humans and food‐producing animals between 2014 and 2021 were investigated. Regulation (EC) No 726/2004 as amended by Regulation (EU) 2019/5 requires that the joint JIACRA reporting by ECDC, EFSA, and EMA shall be carried out at least every three years.
2. AIM AND SCOPE OF THE REPORT
The aim of this fourth JIACRA report is to provide an integrated analysis of the relationships between AMC in human and veterinary medicine and the occurrence of AMR in bacteria from humans and food‐producing animals, as was the aim of the three preceding reports. The data included in the analysis originate from five different surveillance networks coordinated by the three agencies. Data on AMC in humans and data on AMR in bacterial isolates from cases of human infection were provided by ECDC. EFSA provided data on AMR in bacteria from food‐producing animals, and EMA provided data on AMC in food‐producing animals. All data were originally reported to the agencies by the countries participating in the respective surveillance system. The surveillance systems coordinated by ECDC cover EU/EEA countries; the systems coordinated by EFSA and EMA include EU/EEA countries and Switzerland.
3. METHODOLOGY AND DATA SOURCES
Four data sets relating to AMC in humans and food‐producing animals and AMR in isolates from humans and food‐producing animals, respectively, were available from the surveillance systems currently in place (see Section 3.2 Data sources). These sets of data and the potential relationships between them, which are addressed in this report, are illustrated in Figure 1.
FIGURE 1.

Schematic overview of the potential associations between antimicrobial consumption and antimicrobial resistance in humans and food‐producing animals investigated in this report.
The analysis included the relationships between AMC and AMR within the human and food‐producing animal populations. It also included the relationship between AMR in bacteria from humans and AMR in bacteria from food‐producing animals, AMC in humans and AMC in food‐producing animals and finally AMC in food‐producing animals and AMR in bacteria from humans (Figure 1). Potential relationships were investigated through a series of univariate analyses addressing selected antimicrobial group and bacterium combinations of interest.
In a second step, multivariate analyses were performed for the selected antimicrobial group and bacterium combinations to assess relationships between AMR in bacteria from humans and AMC in both human and food‐producing animal populations, as well as AMR in bacteria in food‐producing animals. This was done accounting for the characteristics of the data analysed, in particular the relatively small number of observations in a number of countries involved in the ecological analysis, and multicollinearity among dependent variables.
The relationship between AMC in humans and AMR in bacteria from food‐producing animals was not addressed in this report. For analyses covering one sector (food‐producing animals or humans), only univariate analyses were performed.
3.1. Rationale for the selection of combinations of antimicrobials and bacteria for analysis
In the current report, data on AMR in bacteria obtained from domestically produced food‐producing animals at slaughter have been used. Data on AMR in bacteria from food were considered insufficient with respect to quantity and comparability between countries and relevant metadata were missing, such as on domestic vs. imported production. Only antimicrobial groups and bacteria which are considered to have particular relevance for public health were selected for analysis.
The EMA's Antimicrobial Advice ad hoc Expert Group (AMEG) list (AMEG, 2019) and the WHO list of critically important antimicrobials (WHO, 2019) were taken into account when selecting the combinations of antimicrobials and bacteria for detailed analysis. In particular, fluoroquinolones, polymyxins and third‐ or fourth‐generation cephalosporins have been considered as three of the groups of antimicrobial agents critically important in human medicine with a need to restrict use in animals to mitigate the risk to public health. In recent years, most countries have taken efforts to reduce the usage of these drugs in food‐producing animals. Macrolides were included with respect to Campylobacter spp. on account of their relevance for treating Campylobacter infections in humans. Aminopenicillins and tetracyclines were included because they are widely used in food‐producing animals and have been so for a long time. The wide dissemination of resistance to these drug groups in food‐producing animals makes a role in co‐selection of resistance likely. Moreover, aminopenicillins are also widely used in human medicine, in contrast to tetracyclines. Carbapenems were investigated in relation to their consumption in human medicine. This group is not allowed for use in animals, hence no analysis of carbapenem consumption and resistance in food‐producing animals was performed. To this end, Klebsiella spp. were included in the analysis only for this antimicrobial group on account of their dominant role in carbapenem‐resistant infections. On the other hand, resistance to colistin could not be studied in the human sector due to specific requirements for susceptibility testing of this drug that substantially limit the availability of data.
For a bacterium with an animal reservoir to cause infection in humans via ingestion of meat, it needs to survive the meat production chain and to be infectious to humans. Salmonella spp. and Campylobacter spp. are well‐recognised food‐borne zoonoses and it is considered important to include these bacteria in the analysis, although infections in humans may also arise from imported food or be related to foreign travel. Both can show extensive resistance, thus compromising treatment options when treatment is considered necessary.
E. coli is a normal commensal of the gut of warm‐blooded species, including humans. At the same time, it can cause severe infections. In food‐producing animals, E. coli is considered a good indicator of the resistance situation and therefore included in the monitoring. In humans, it is tested on account of the severe infections that it may cause. Of note, it is not only the potential transmission of E. coli bacteria from food‐producing animals to humans that is of concern, but also their role as carriers of mobile genetic elements with resistance genes that they may shuttle from animal bacterial populations to human bacterial populations.
An overview of the rationale for the selection of antimicrobial group/bacterium combinations included in the analysis is available in Table 1.
TABLE 1.
Combinations of antimicrobial groups and bacteria selected for analysis and rationale for the selection.
| Antimicrobial group | WHO categorisation a | AMEG categorisation b | Campylobacter spp. | Salmonella | Escherichia coli | Klebsiella pneumoniae |
|---|---|---|---|---|---|---|
| Carbapenems | Authorised for use in humans only | Category A | Carbapenems are antimicrobials of major clinical significance in humans. Resistance to carbapenems is emerging in several bacterial species capable of causing serious, invasive infections. This group of antimicrobials is not authorised for use in food‐producing animals in EU | |||
| Third‐ and fourth‐generation cephalosporins | Highest priority CIA | Category B | These antimicrobial groups constitute one of the first‐line therapies for invasive gram‐negative bacterial infections in humans in many EU/EEA countries | |||
| Fluoroquinolones and other quinolones | Highest priority CIA | Category B | Fluoroquinolones and macrolides are used to treat infections with Campylobacter spp. in humans when treatment is considered necessary by the clinician. | This antimicrobial group constitutes one of the first‐line therapies for invasive gram‐negative bacterial infections in humans in many EU/EEA countries. | ||
| Polymyxins | Highest priority CIA | Category B |
Colistin, a polymyxin, may be the only choice for treatment of serious invasive infections caused by multidrug‐resistant Gram‐negative bacteria. Use of colistin in EU/EEA hospitals, mainly in intensive care, is increasing A high consumption of colistin has been reported in food‐producing animals in some countries (AMEG, 2016); though current data indicate major decreases in several countries (ESVAC, 2022) Data on resistance to colistin in isolates from humans were not available for this report |
|||
| Aminopenicillins | HIA | Category C (with inhibitors) and D (without inhibitors) |
An antimicrobial group that has been widely used in humans and food‐producing animals for many years Resistance to aminopenicillins and to other antimicrobials is common in bacteria from humans and food‐producing animals. This may play a role in co‐selection through the genetic linkage of resistance genes |
|||
| Macrolides | CIA | Category C | See fluoroquinolones above | |||
| Tetracyclines | HIA | Category D |
An antimicrobial group widely used in food‐producing animals for many years Resistance to tetracyclines and to other antimicrobials, which is common, may play a role in co‐selection through the genetic linkage of resistance genes |
|||
Note: Shaded cells mean that the corresponding combinations were not analysed in this report.
WHO, World Health Organization; CIA, critically important antimicrobial; HIA, highly important antimicrobial.
AMEG, EMA's Antimicrobial Advice ad hoc Expert Group; Category A (‘Avoid’) includes antibiotics that are currently not authorised in veterinary medicine in the EU. These medicines may not be used in food‐producing animals and may be given to individual companion animals only under exceptional circumstances; are critically important in human medicine and their use in animals should be restricted to mitigate the risk to public health; Category B (‘Restrict’) refers to quinolones, third‐ and fourth‐generation cephalosporins and polymyxins. Antibiotics in this category are critically important in human medicine and their use in animals should be restricted to mitigate the risk to public health; Category C (‘Caution’) covers antibiotics for which alternatives in human medicine generally exist in the EU, but only few alternatives are available in certain veterinary indications. These antibiotics should only be used when there are no antimicrobial substances in Category D that would be clinically effective; Category D (“Prudence”) includes antibiotics that should be used as first‐line treatments, whenever possible. These antibiotics can be used in animals in a prudent manner. This means that unnecessary use and long treatment periods should be avoided, and group treatment should be restricted to situations where individual treatment is not feasible.
3.2. Data sources
ECDC has a mandate to gather and analyse data and information on emerging public health threats and developments for the purposes of protecting public health in the EU (Regulation (EC) No 851/2004 (Official Journal of the European Union, 2004)). Surveillance is conducted in accordance with Regulation (EU) 2022/2371 (Official Journal of the European Union, 2022a) on serious cross‐border threats to health. Data on AMR in bacterial isolates from humans included in this report were obtained from two surveillance networks: the European Antimicrobial Resistance Surveillance Network (EARS‐Net) and the Food‐ and Waterborne Diseases and Zoonoses Network (FWD‐Net). Data on AMC in humans were obtained from the European Surveillance of Antimicrobial Consumption Network (ESAC‐Net).
EFSA is responsible for analysing data on zoonoses, AMR and food‐borne outbreaks collected from the countries in accordance with Directive 2003/99/EC (Official Journal of the European Union, 2003), and for reporting annually on the results (Article 33 in Regulation (EC) No 178/2002 (Official Journal of the European Union, 2002)). For AMR, a specific EU Summary Report is produced in collaboration with ECDC on an annual basis. The EU Summary Report on AMR includes data related to AMR in bacterial isolates from both food‐producing animals and foodstuffs, collected under Directive 2003/99/EC, and bacterial isolates from human cases, derived from FWD‐Net, coordinated by ECDC.
The main responsibility of the EMA is the protection and promotion of public and animal health through the evaluation and supervision of medicines for human and veterinary use. The European Surveillance of Veterinary Antimicrobial Consumption (ESVAC) project was launched by the EMA in September 2009, following a request from the European Commission to develop a harmonised approach to the collection and reporting of data on the consumption of antimicrobial agents in food‐producing animals. The ESVAC reports present data on the consumption of veterinary antimicrobial agents from EU and EEA countries provided in accordance with a standardised protocol and template (ESVAC, 2021).
3.2.1. Antimicrobial consumption in humans
The European Surveillance of Antimicrobial Consumption Network (ESAC‐Net), coordinated by ECDC, is a network of national surveillance systems monitoring human AMC in the EU/EEA. All EU Member States, as well as two EEA countries (Iceland and Norway) report data to the network on an annual basis. Data are collected for the community (primary care) sector and the hospital sectors separately where possible, and are mainly based on sales data, or a combination of sales and reimbursement data.
Data are categorised using the Anatomical Therapeutic Chemical (ATC) classification system and analysed using the defined daily dose (DDD) methodology developed by the World Health Organization (WHO) Collaborating Centre for Drug Statistics Methodology (Oslo, Norway) (WHO, 2022). Further details on the methodology can be found in the ESAC‐Net reporting protocol (European Centre for Disease Prevention and Control and TESSy (The European Surveillance System), 2023), and a more detailed description of the data and its interpretation in the latest ESAC‐Net annual epidemiological report (ECDC, 2022a).
Data on human AMC of ATC group J01, antibacterials for systemic use, from 29 EU/EEA countries from 2014 to 2021 were retrieved from the TESSy database, hosted by ECDC, in March 2023. Separate data sets for total consumption of ATC group J01 and specific antimicrobial groups (Table 2) were prepared with consumption expressed as both mg/kg estimated biomass and DDD per 1000 inhabitants per day. The DDDs listed in the ATC Index for 2022 were used for all data (WHO, 2022).
TABLE 2.
Human antimicrobial consumption: Antimicrobial groups and related ATC codes included in JIACRA IV.
| Antimicrobial group | ATC codes |
|---|---|
| Total consumption | J01 |
| Carbapenems | J01DH |
| Third‐ and fourth‐generation cephalosporins | J01DD and J01DE |
| Quinolones (including fluoroquinolones) | J01M (J01MA) |
| Polymyxins | J01XB |
| Aminopenicillins (including aminopenicillins with enzyme inhibitors) a | J01CA01, J01CA2, J01CA04, (J01CR01 and J01CR02) |
| Macrolides | J01FA |
| Tetracyclines | J01A |
| Amphenicols | J01B |
| Penicillins | J01C |
| First‐ and second‐generation cephalosporins | J01DB + J01DC |
| Trimethoprim | J01EA, J01EE |
| Sulfonamides | J01EB, J01EC, J01ED, J01EE |
| Lincosamides | J01FF |
| Aminoglycosides | J01G |
In JIACRA III, only aminopenicillins without enzyme inhibitors were included in analyses. For this report, aminopenicillins with enzyme inhibitors (J01CR01 and J01CR02) were also included in analyses as their consumption can also contribute to resistance.
ESAC‐Net AMC data for the period 2014 to 2021 were used throughout the report for time series, the logistic correlation analyses and for the multivariate analyses. The latest available AMC results, expressed as DDD per 1000 inhabitants per day at the 4th ATC group level, are publicly available in the ESAC‐Net interactive database on the ESAC‐Net webpages (ECDC, 2021, 2023). To facilitate the comparison between AMC in humans and in food‐producing animals, DDD data were subsequently converted into mass of active substance per antimicrobial group and country (expressed in tonnes), as described below.
All EU/EEA population‐weighted means of AMC in humans are calculated by multiplying consumption data for each country with the corresponding Eurostat population, and dividing the product by the total population of all participating EU/EEA countries.
3.2.1.1. Conversion of number of DDDs to weight of active substances
Based on the TESSy data set with AMC data, the numbers of DDDs consumed at the substance level (5th ATC group level) were converted into weight according to the ATC/DDD index 2022. The weight is expressed in tonnes or in mg per kg estimated human biomass, using the population under surveillance and a standard human body weight of 62.5 kg. The methodology used to define the standard human body weight is described in detail in JIACRA III (ECDC, EFSA and EMA, 2021).
Since the DDD allocation for colistin (ATC code J01XB01) is defined in million units (MU) and not in weight units, a conversion factor was applied to calculate the weight of consumption expressed as DDD. In humans, colistin is almost exclusively used as colistin methane sulfonate with a concentration of 12,700 IU/mg (Theuretzbacher, 2014). Therefore, a conversion factor of one million units (MU) = 78.74 mg was applied.
For ‘combined products' containing two or more active substances (antibacterials), for which DDDs are expressed in unit doses, the weight was calculated in grams based on the number of grams of each substance per DDD.
3.2.1.2. Missing data
Most countries reported human AMC data for the community (primary care) sector and the hospital sector separately for all years during 2014–2021. Some countries started with reporting community data only but moved to reporting AMC for both the community and hospital sectors at different points in time between 2014 and 2021. Further details regarding reported data by sector during the past 10 years can be found in the latest ESAC‐Net annual epidemiological report (ECDC, 2022a).
One country (Germany) was unable to report human AMC data across both sectors and only reported community AMC for all years. For the univariate and multivariate analyses, Germany was included with hospital and total (community and hospital) AMC values imputed using the EU/EEA population‐weighted mean percentages of community consumption out of total consumption for each antimicrobial group by year. These population‐weighted mean percentages of total consumption attributed to the community sector were calculated among all current EU/EEA countries reporting data for both sectors in the respective year. These percentages were then used to estimate Germany's total (community and hospital) AMC values from its community consumption data for each antimicrobial group by year. Because of the lack of data with respect to nationwide hospital consumption in Germany, Germany was not able to formally approve the validity of the extrapolated estimates.
As Germany's consumption values from the community sector are relatively low compared to many other countries, extrapolation using the population‐weighted ratio of community‐to‐total consumption among all EU/EEA countries may not be accurate for Germany. In addition, Germany is one of the countries with the highest densities of hospitals and number of hospital patient‐days in Europe (Eurostat, 2023). Therefore, extrapolation using population‐based measures available may not correctly reflect the AMC situation at the hospital level in Germany. However, the imputation method used resulted in no influential data points from Germany in the models. In tables and bar charts presenting human AMC data, only reported data (i.e. no imputed values) are presented. Imputed values for Germany were only used for univariate and multivariate analyses, but not in EU/EEA population‐weighted mean calculations for humans or the trend analyses.
3.2.2. Antimicrobial consumption in food‐producing animals
The ESVAC project (ESVAC, 2020), coordinated by EMA, collects harmonised data on consumption of antimicrobial veterinary medicinal products (VMPs) from European countries on an annual basis. Consumption data are collected from various national sources – wholesalers, marketing authorisation holders, feed mills and pharmacies – based on the Anatomical Therapeutic Chemical classification system for veterinary medicinal products (ATCvet), available at https://www.whocc.no/atcvet/atcvet_index. Detailed methodology can be found in the ESVAC Protocol (ESVAC, 2021) and latest ESVAC annual report (ESVAC, 2022) (Table 3).
TABLE 3.
Groups and ATCvet codes of antimicrobial substances with antibiotic activity used in veterinary medicine included in the ESVAC database and in JIACRA IV.
| Groups of antimicrobial substances | ATCvet codes |
|---|---|
| Antimicrobial substances for intestinal use | QA07AA; QA07AB |
| Antimicrobial substances for intrauterine use | QG01AA; QG01AE; QG01BA; QG01BE QG51AA; QG51AG |
| Antimicrobial substances for systemic use | QJ01 |
| Antimicrobial substances for intramammary use | QJ51 |
| Antimicrobial substances used as antiprotozoals | QP51AG |
ESVAC monitors the sales of antimicrobial VMPs (injectables, oral powders, oral solutions, intramammary products and intrauterine devices) marketed for all food‐producing animal species, including horses, as a proxy for consumption. To normalise the consumption data for the food‐producing animal population that can be subjected to treatment with antimicrobial agents, a population correction unit (PCU) is used as a proxy for the size of the food‐producing animal population (1 PCU = 1 kg animal biomass). The data sources and the methodology for the calculation of PCU are comprehensively described in Annex 2 to EMA's report ‘Trends in the sales of veterinary antimicrobial agents in nine European countries: 2005–2009’ (ESVAC, 2011). The limitations of this approach have been discussed in the first JIACRA report and include a potential overestimation of the biomass by not considering the lifespan of animals, as the latter data are not consistently available and may differ between countries (ECDC, EFSA and EMA, 2015).
Consumption of antimicrobial VMPs is then expressed as mg of active substance normalised by the PCU (mg/PCU). All EU/EEA population‐weighted means represent aggregated consumption, i.e. total quantity of all antimicrobial active substances sold (mg) in all countries divided by the total PCU (kg) of all countries.
Data on the overall consumption for food‐producing animals and on the biomass of food‐producing animals from 29 EU/EEA countries and Switzerland from 2014 to 2021 were retrieved from the ESVAC database, hosted by EMA, in January 2023. For Greece, data are available only from 2015 and for Malta from 2017.
3.2.2.1. Technically derived estimates of the sales of veterinary antimicrobials for pigs and poultry
VMPs are typically marketed for more than one species. Therefore, the sales data as such do not provide information on sales by food‐producing animal species. As a proxy, technically derived estimates have been calculated for pigs and poultry for the purposes of this report.
The data used to obtain the technically derived estimates were acquired from the ESVAC database by country and year. A standardised methodology was applied by EMA and used to establish sales estimates of antimicrobial VMPs used in pigs and poultry that contained aminopenicillins – i.e. amoxicillin with and without beta‐lactamase inhibitors, ampicillin and metampicillin – belonging to the ATCvet groups QA07AA98, QA07AA99, QJ01CA01, QJ01CA04, QJ01CR01, QJ01CR02, QJ01CR50, QJ01RA01, QJ01RA95 and QJ01RV01; third‐ and fourth‐generation cephalosporins, fluoroquinolones, other quinolones, polymyxins, macrolides and tetracyclines belonging to ATCvet groups QA07AA and QJ01. The selected antimicrobials cover antimicrobial VMPs for oral administration and injectables. The data used for the technically derived estimate of consumption for pigs and poultry represent the data available in the ESVAC database in January 2023.
For each of the antimicrobial VMP presentations included in the analysis, information on authorised target food‐producing species was obtained from the Summary of Product Characteristics (SPC) of each country. The total annual sales (mg of active substance) of each VMP presentation were then distributed between the authorised target food‐producing species according to its biomass ratio in the corresponding country. The biomass ratio for pigs and poultry is defined as the fraction of these species' biomass (PCU) of the total food‐producing animal biomass (PCU) in the respective country. For some VMPs, the SPC data indicated poultry as a target species and consequently, estimates could not be derived for turkey and chickens. Since cattle in general is typically given as the target species in the product information, sales for bovines under 1 year could not be estimated with this approach.
The sales (mg of active substance) attributed to pigs and poultry were subsequently used to calculate the indicator expressing the exposure to antimicrobials – i.e. number of defined daily doses for food‐producing animals (DDDvet) per kilogram of food‐producing animal biomass per species (DDDvet/kg biomass) per year and country. The DDDvet system, established by EMA, provides standardised units of measurement for the reporting of data on consumption by species, taking into account differences in dosing between the active substances, formulations and animal species. Where possible, the principles for assignment of DDDvet (ESVAC, 2015) are harmonised with the principles for assignment of DDDs in human medicine. Similar to the DDD established for human medicinal products, DDDvet is a technical unit of measurement solely intended for drug consumption studies and outputs should not necessarily be assumed to reflect the daily doses recommended or prescribed.
It should be emphasised that the estimates obtained on sales for pigs and poultry using this methodology are purely technically derived estimates. Therefore, the calculated numbers of DDDvet used per kilogram of food‐producing animal biomass per year and country should not be considered as the exact exposure of pigs and poultry to antimicrobials in the ESVAC participating countries (see Annex A2.3 of the third JIACRA report [ECDC, EFSA and EMA, 2021]). In the following, the term ‘milligrams per kilogram of estimated biomass’ will be used as a synonym of ‘milligrams per human EU population‐ and age group‐weighted biomass’ and ‘milligrams per PCU’.
3.2.3. Antimicrobial resistance in humans
3.2.3.1. Escherichia coli and Klebsiella pneumoniae
EARS‐Net monitors AMR in isolates of bacteria from blood and cerebrospinal fluids of humans, and covers eight bacteria of public health importance: Escherichia coli, Klebsiella pneumoniae, Pseudomonas aeruginosa, Acinetobacter species, Streptococcus pneumoniae, Staphylococcus aureus, Enterococcus faecalis and Enterococcus faecium. Data originate from routine antimicrobial susceptibility test (AST) performed at local medical microbiology laboratories in the EU/EEA. Further details on the methodology can be found in the EARS‐Net reporting protocol (European Centre for Disease Prevention and Control and TESSy (The European Surveillance System), 2023), and a more detailed description of the data and its interpretation in the latest EARS‐Net annual report (ECDC, 2022a).
K. pneumoniae and E. coli AST data from 2014 to 2021 were retrieved from the TESSy database, hosted by ECDC, in December 2022. The antimicrobial agents included in the panel for initial determination of susceptibility in invasive E. coli and K. pneumoniae isolates varied among countries. To allow for comparison, results are presented at the antimicrobial group level, merging test results from several antimicrobial agents and giving priority to the most resistant result. The panel of antimicrobial agents included are shown in Table 4.
TABLE 4.
Antimicrobial agents and confirmation tests included in the antimicrobial groups included in JIACRA IV, EARS‐Net 2014–2021.
| Antimicrobial group | Test and antimicrobial agents included in panels for testing |
|---|---|
| Carbapenems | Meropenem, imipenem |
| Third‐generation cephalosporins | Cefotaxime, ceftazidime, ceftriaxone |
| Aminopenicillins | Ampicillin, amoxicillin |
| Fluoroquinolones | Ciprofloxacin, ofloxacin, levofloxacin |
Since 2019, EARS‐Net only accepts data interpreted by the European Committee on Antimicrobial Susceptibility Testing (EUCAST) clinical breakpoints. During the period 2014 to 2018, a few laboratories still used Clinical and Laboratory Standards Institute (CLSI) clinical breakpoints. For more information, the reader should refer to the EARS‐Net reports for 2014 to 2018 (ECDC, 2017, 2018a, 2019a, 2019b).
In order to allow for comparison between clinical isolates of invasive E. coli from humans and commensal E. coli from food‐producing animals, the latter monitored by the epidemiological cut‐off value (ECOFF), the term ‘resistance’ in human data refers to isolates tested as both I – ‘susceptible, increased exposure’ and R – resistant. In most cases, there was a difference of one to four dilution steps, depending on antimicrobial, between the I + R category and the non‐wild type (microbiologically resistant) based on ECOFFs (Figure 2). For consistency, AST results for K. pneumoniae were also merged into an I + R category, even though no comparisons were made with data from food‐producing animals.
FIGURE 2.

Comparison of clinical breakpoints for I – ‘susceptible, increased exposure’ and R –‘resistant’ categories combined and epidemiological cut‐off values used to interpret MIC data reported for Escherichia coli from humans and food‐producing animals, 2021 breakpoint data.
3.2.3.2. Salmonella species and Campylobacter species
FWD‐Net currently covers surveillance of 18 diseases that are mainly acquired by humans through the consumption of food or water or contact with food‐producing animals. AMR data are collected as part of the case‐based data sets for salmonellosis and campylobacteriosis and, since the 2013 data collection, as part of the molecular surveillance of Salmonella species and Campylobacter species isolates. The case‐based data set contains data to inform and monitor clinical treatment and therefore the results are interpreted using clinical breakpoints for assessing treatment options by default. The isolate‐based data are submitted by the National Public Health Reference Laboratories that conduct reference testing of isolates and can report the actual results of the AST as minimum inhibitory concentration (MIC) or inhibition zone diameter. Since 2019 data collection, it is also possible to report resistance (as wild type/non‐wild type) predicted from whole genome sequencing. The number of EU/EEA countries reporting AMR data in 2019–2021 was 23–26 for Salmonella spp. and 18–24 for Campylobacter spp.
The methods used for AST of Salmonella spp. and Campylobacter spp. isolates from humans varied among countries (EFSA and ECDC, 2015, 2016, 2017). Quantitative data were interpreted by ECDC based on EUCAST ECOFF values, where available. Where ECOFFs did not exist, EUCAST CLSI clinical breakpoints were applied. For the qualitative SIR data, categories were combined to align with the MIC ECOFF. In most cases, category I (susceptible, increased exposure) and R (resistant) results were combined into one category to align with the non‐wild type (NWT), but sometimes there was direct correspondence between the R and NWT MIC. When analysed in this way, there was a close concordance (± 1 dilution) across categories for the antimicrobials included for Salmonella spp. and Campylobacter spp. (Figures 3 and 4).
FIGURE 3.

Comparison of clinical breakpoints for I – ‘susceptible, increased exposure’ and R – ‘resistant’ categories combined and epidemiological cut‐off values used to interpret MIC data reported for Salmonella from humans and food‐producing animals.
FIGURE 4.

Comparison of clinical breakpoints for I – ‘susceptible, increased exposure’ and R – ‘resistant’ categories combined and epidemiological cut‐off values used to interpret MIC data reported for Campylobacter spp. from humans and food‐producing animals.
3.2.4. Antimicrobial resistance in bacteria from food‐producing animals and food
3.2.4.1. Harmonised and representative monitoring of AMR
Directive 2003/99/EC on the monitoring of zoonoses and zoonotic agents sets out generic requirements for the monitoring and reporting of AMR in isolates of zoonotic Salmonella spp. and Campylobacter spp., as well as in selected other bacterial species – in so far as they present a threat to public health – from food‐producing animals and food in the EU/EEA countries. Within the framework of AMR monitoring in food‐producing animals and food, the occurrence of AMR is typically defined as the proportion of bacterial isolates tested for a given antimicrobial and found to present any degree of acquired reduced phenotypic susceptibility – i.e. to display ‘microbiological resistance’. ECOFF values are used as interpretative criteria of microbiological resistance.
In line with the general requirements of Directive 2003/99/EC, EFSA provided specific guidance on the monitoring and reporting of AMR in Salmonella spp. and Campylobacter spp. (EFSA, 2007) and in indicator E. coli from the commensal flora (EFSA, 2008). The AMR monitoring in food‐producing animals and food was further harmonised by Commission Implementing Decision 2013/652/EU, which has been repealed and replaced by Commission Implementing Decision (EU) 2020/1729 (Official Journal of the European Union, 2020), both implementing Directive 2003/99/EC over the years 2014–2020 and from 2021 onwards, respectively. Those Commission Implementing Decisions set out monitoring priorities from a public health perspective and described those combinations of bacterial species, antimicrobial substances, food‐producing animal populations and food products which should be monitored as a minimum requirement from 2014 onwards. The Commission Implementing Decisions also define the frequency of the monitoring and the extent to which the sampling is required. The monitoring of AMR in zoonotic and indicator organisms focused on the animal populations to which the consumer is most likely to be exposed through food derived thereof, such as domestic fowl (mainly broilers), pigs and cattle. Since the implementation of the Commission Implementing Decisions, the monitoring of AMR in zoonotic Salmonella spp. and Campylobacter jejuni, as well as in indicator E. coli, from the major food‐producing animal populations, has become mandatory (Table 5). The antimicrobials recommended for inclusion in the harmonised monitoring by EFSA consisted of a concise set of substances, selected according to their relevance for human therapeutic use (e.g. critically important antimicrobials (CIAs) with highest priority for human medicine) and/or of epidemiological relevance.
TABLE 5.
Bacterial species included in mandatory AMR monitoring in food‐producing animals from 2014 onwards, as set out in Commission Implementing Decisions 2013/652/EU and (EU) 2020/1729.
| Food‐producing animals | Year of sampling | Salmonella spp. | Campylobacter jejuni | Campylobacter coli a | Escherichia coli |
|---|---|---|---|---|---|
| Broilers | Even years (e.g. 2014, 2016, 2018 and 2020) | M, NCP, PHC | M, CSS | M, CSS | M, CSS |
| Laying hens | M, NCP | – | – | – | |
| Fattening turkeys | M, NCP, PHC | M, CSS | M, CSS | ||
| Bovines, aged < 1 year | Odd years (e.g. 2015, 2017, 2019 and 2021) | M, CSS | M, CSS | M, CSS | M, CSS |
| Fattening pigs | M, CSS | M, CSS | M, CSS | M, CSS |
Abbreviations: CSS, caecal samples from healthy food‐producing animals at slaughter; M, mandatory monitoring; NCP, Salmonella national control programmes; PHC, process hygiene criteria.
Monitoring of C. coli is only mandatory according to CID 2013/652/EU.
Data are collected from all EU Member States, two EEA countries (Iceland and Norway) and Switzerland on a mandatory basis. Indicator E. coli and Campylobacter spp. isolates derive from active monitoring programmes, based on representative random sampling of carcasses of healthy domestically produced food‐producing animals. For this monitoring, caecal samples are collected at slaughterhouses. For Salmonella spp. from broilers, laying hens and fattening turkeys, isolates are included which originate from Salmonella national control programmes, as well as isolates from carcasses of broilers and fattening turkeys, sampled as part of the hygiene criteria process. For Salmonella spp. isolates are included originating from the carcasses of fattening pigs and bovine animals under 1 year of age, sampled as part of the verification of the hygiene criteria process. The target number of organisms of each bacterial species which should be examined is 170 from each type of domestic animal (this is reduced to 85 organisms from poultry and pigs, if production is less than 100,000 tonnes per annum). From 2014 onwards, poultry/poultry meat was monitored in 2014, 2016, 2018 and 2020 and pigs and bovines under 1 year, pork and beef were monitored in 2015, 2017, 2019 and 2021. Within each Member State, the various types of livestock and meat from those livestock should be monitored when production exceeds 10,000 tonnes slaughtered per year.
Commission Implementing Decisions 2013/652/EU and (EU) 2020/1729 stipulate that culture using selective media for cephalosporin‐resistant E. coli should be performed. Caecal samples from broilers, fattening turkeys, fattening pigs and bovines under 1 year of age, as well as samples from broiler and turkey meat, pork and beef collected at retail sites, should be examined for cefotaxime‐resistant E. coli using selective media incorporating the third‐generation cephalosporin cefotaxime.
All presumptive extended‐spectrum beta‐lactamase (ESBL)‐, AmpC beta‐lactamase‐ or carbapenemase‐producing E. coli isolates identified through selective plating, as well as all those randomly selected isolates of Salmonella spp. and E. coli, recovered from non‐selective media that are resistant to cefotaxime or ceftazidime or meropenem, are further tested with a second panel of antimicrobial substances. This second panel of antimicrobials includes cefotaxime and ceftazidime, with and without clavulanic acid (to investigate whether synergy is observed with clavulanic acid), as well as the antimicrobials cefoxitin, cefepime, temocillin, ertapenem, imipenem and meropenem. The second panel of antimicrobials is designed to enable phenotypic characterisation of ESBL, AmpC and carbapenem resistance.
3.2.4.2. Summary indicator of microbiological resistance and complete susceptibility
For the purpose of comparing AMC and AMR data, a summary indicator of microbiological resistance (SIMR) at the national level was calculated as the weighted mean of the proportion of AMR in bacteria from broilers, turkeys, pigs and cattle under 1 year at slaughter for 2‐year intervals. This took into consideration AMR data assessed in 2018 and 2019; 2019 and 2020; and 2020 and 2021. The PCU values of the 4 (or 2 when considering Campylobacter jejuni data from poultry) food‐producing animal categories in the countries were used as weighting factors.
An additional SIMR in bacteria from poultry was also constructed by addressing data on both broilers and turkeys for 2020. For the countries which did not have data on AMR in bacteria from turkeys due to the small size of the turkey production, the SIMR in bacteria from poultry equalled the occurrence of AMR in bacteria from broilers. SIMR were compared to corresponding AMC data in food‐producing animals.
In the food‐producing animal sector, the reporting of AMR data at the individual isolate level allowed phenotypic resistance profiles to be characterised according to the harmonised panel of antimicrobial substances tested. A completely susceptible E. coli isolate is non‐resistant to all of the antimicrobial substances tested. The key indicator of complete susceptibility has been used to investigate the associations between the occurrence of complete susceptibility and total AMC in food‐producing animals.
3.2.5. Primary key indicators
A list of harmonised key AMC and AMR indicators was published jointly by ECDC, EFSA and EMA to support EU/EEA countries in monitoring their progress in reducing AMC and AMR in both humans and food‐producing animals (ECDC, EFSA, EMA, 2017a). The list includes a total of 15 indicators, divided into primary and secondary indicators. The indicators are based on data already collected through the monitoring systems, as described above. In this report, only the primary key indicators used in the different sectors are included (Table 6).
TABLE 6.
Overview of the five primary key indicators.
| Sector | AMC | AMR |
|---|---|---|
| Humans | Total consumption of antibacterials for systemic use (defined daily doses per 1000 inhabitant and per year) |
Proportion of methicillin‐resistant Staphylococcus aureus (MRSA) Proportion of third‐generation cephalosporin‐resistant Escherichia coli (3GCR E. coli) |
| Food‐producing animals | Overall sales of veterinary antimicrobials (mg/PCU) | Proportion of indicator E. coli from broilers, fattening turkeys, fattening pigs and calves, weighted by PCU, completely susceptible to the predefined panel of antimicrobials |
Abbreviations: AMC, antimicrobial consumption; AMR, antimicrobial resistance.
A full description, rationale for selection and limitations for each of these primary key indicators can be found in the joint report published by ECDC, EFSA and EMA (ECDC, EFSA, EMA, 2017a). Any comparison of the changes in the different sectors needs to be carried out with caution, given the differences in the data collected and the loss of detail resulting from the combination of data into indicators. Indicators should not be directly compared between countries, but should be used for comparisons within the country (ECDC, EFSA, EMA, 2017a).
The primary key indicators for AMC in humans and food‐producing animals for the period 2014–2021 were included in this report. The methodology for defining each indicator and the calculations of the EU/EEA means are further described in the referenced source reports from ECDC, EFSA and EMA (ECDC, EFSA, EMA, 2017a).
For humans, the total consumption of antimicrobials for systemic use, expressed as DDD per 1000 inhabitants and per day at the national level and as an EU/EEA population‐weighted mean, were extracted from the ECDC ESAC‐Net AMC dashboard, and the latest ECDC annual epidemiological report on AMC (ESAC‐Net) (ECDC, 2022a). For food‐producing animals, the overall sales expressed as mg/PCU at the national level and as aggregated overall sales for 29 EU/EEA countries were extracted from the ESVAC database.
The primary key indicators for AMR in humans include the proportion of methicillin‐resistant Staphylococcus aureus (MRSA) and third‐generation cephalosporin‐resistant E. coli. National and EU/EEA population‐weighted mean percentages for the period 2014–2021 were extracted from the latest ECDC annual epidemiological report on AMR (EARS‐Net) (ECDC, 2022b).
To complement analyses of data from food‐producing animals, the proportion of E. coli isolates from blood and cerebrospinal fluids of humans susceptible to a defined panel of antimicrobial groups, including fluoroquinolones, third‐generation cephalosporins, aminoglycosides and carbapenems, were calculated based on data reported to EARS‐Net between 2019 and 2021.
The statistical assessment of time trends was conducted using the primary AMC and AMR indicators for the period 2014–2021 disclosed in the source reports from ECDC, EFSA and EMA.
3.3. Statistical methods
3.3.1. Spearman's rank correlation test
To assess whether there was an association between AMC in humans and in food‐producing animals at the EU/EEA level (both expressed in mg per kg of estimated biomass), a Spearman's rank correlation test was used. Spearman's rank correlation coefficient is a non‐parametric measure used to assess the degree of statistical association between two variables and the test does not depend on any assumptions about the distribution of the data. The Spearman's rank correlation coefficient is identified by rho (ρ) and varies from −1 (perfect negative rank correlation) to 1 (perfect positive rank correlation).
3.3.2. Logistic regression
Logistic regression models were used to assess statistically significant associations between (1) consumption of antimicrobial agents in humans and the probability of resistance in bacteria from humans, (2) consumption of antimicrobial agents in food‐producing animals and occurrence of resistance in bacteria from humans, (3) occurrence of resistance in bacteria from food‐producing animals and occurrence of resistance in bacteria from humans and (4) consumption of antimicrobial agents in food‐producing animals and occurrence of resistance in bacteria from food‐producing animals. The models were additionally utilised to evaluate the correlations between AMC and the probability of complete susceptibility in E. coli from both humans and food‐producing animals.
3.3.2.1. Candidate models
Three different candidate logistic regression models were considered:
Model 1: a logistic model where the relationship between the predictor (x) and the logit of the probability of interest is linear
The other two models allow additional curvature in this relationship.
Model 2: a logistic model where the predictor is log‐transformed
Model 3: a logistic model where the predictor is quadratic‐transformed
Other and more complex models could of course be considered. However, the above three candidate models, each modelling a different type of relationship, are expected to fit all data sets analysed in this report sufficiently well. Moreover, for all three models, the strength of the association between the predictor (x) and the outcome is represented by a single parameter, the slope parameter ß 1 , or correspondingly, by the odds ratio OR = exp(ß 1 ). This relationship is modelled using the logit of the probability of interest. The logit is a function that transforms probabilities into a form that allows linear modelling. It is the logarithm of the odds of the probability (i.e. the left hand side of model equations 1, 2 and 3). If a 95% confidence interval (CI) for the OR contains the value 1, there is no statistical evidence from the available data that the predictor is associated with the outcome (the null hypothesis of no association cannot be rejected at the level of significance 0.05). A CI with a lower bound exceeding the value 1 implies a significant positive statistical association (an increase in the predictor's value is associated with an increase in the odds of the outcome). A CI with an upper bound below the value 1 implies a significant negative statistical association (an increase in the predictor's value is associated with a decrease in the odds of the outcome).
The three models differ, however, in their interpretation of the OR = exp(ß 1 ):
Model 1: the effect of the predictor (x) is ‘homogeneous’: the value of the OR = exp(ß 1 ) corresponds to a 1‐unit increase in the predictor (x). For example, an OR = 1.09 represents an increase of 9% in the odds of the outcome by a 1‐unit increase of x (e.g. from x = 1–2 or x = 10–11).
Models 2 and 3: the effect of the predictor (x) is ‘heterogeneous’: the value of the OR no longer corresponds to a 1‐unit increase in the predictor (x).
Model 2: the effect of x levels off for increasing x, so that the OR = exp(ß 1 ) corresponds to an increase larger than a 1‐unit increase for larger x‐values; it corresponds (approximately) to a doubling of the predictor x. For example, an OR = 1.09 represents an increase of 9% in the odds of the outcome by an approximate increase of x = 1–2 or x = 10–20, etc.
Model 3: the effect of x rises with increasing x, so that the OR = exp(ß 1 ) corresponds to an increase smaller than a 1‐unit increase for larger x‐values; more precisely, it corresponds to an increase in the predictor x to sqrt(x 2 + 1). For example, OR = 1.09 represents an increase of 9% in the odds of the outcome by an increase of x = 1 to sqrt(2) ≈ 1.414, or x = 10 to sqrt(101) ≈ 10.050.
All three logistic models were fitted to the data for a particular antimicrobial agent–bacteria combination and the model with the lowest Akaike's information criterion (AIC) (Akaike, 1983) was chosen as the final model. If data from several years or periods (combination of years) were available for that particular antimicrobial agent/bacteria combination, the model selection was based on the collapsed data and afterwards the final model was fitted to all years/periods separately. The parameters and the standard errors of the final logistic model are estimated using the method of Williams (Williams, 1982), accounting for so‐called overdispersion (a phenomenon related to violations of the basic assumption underlying the logistic regression model, being the binomial distribution for the number of positive events out of the number of tests).
Logistic regression models were fitted only when five or more countries reported information on both the outcome of interest and predictor, and where the total number of isolates tested within each country was equal to 10 or more.
3.3.2.2. Outputs
The results of the final selected models are summarised in tables. The tables show the countries that were included in the analysis next to the model chosen, and the point and interval estimates.
Next to the tables, graphs visualise the data together with the fitted curve of the final model, selected for each antimicrobial agent/pathogen. Such graphs are only included if the association is statistically significant (at a level of significance of 0.05), or in a matrix‐plot over several years/periods, if it was for at least 1 year/period. The size of the bubbles displayed in the graphs reflects the number of tests involved, with a bigger size indicating a larger number of tests. The use of such bubbles rather than points of the same size visualises, at a single glance, the differences in the values for the predictor and the outcome of interest. It also shows the differences in the underlying number of tests between countries, and consequently, the differences in their contribution to the final fitted curve (larger bubbles having more impact on the fit than small bubbles).
Data outliers were identified by systematically omitting each single observation from the data set, rerunning the analysis and examining the impact in a subsequent sensitivity analysis. If omission changed significance and impact was found to be relevant, the results of the sensitivity analyses were commented on in the text.
3.3.3. Partial least squares path modelling
To further assess potential relationships between the AMC in humans (in the community and at the hospital) and resistance to antimicrobials in bacteria from humans, AMC in food‐producing animals (pigs and poultry) and resistance in bacteria from food‐producing animals (pigs and poultry), multivariate analyses were performed using partial least squares path modelling (PLS‐PM). PLS‐PM was selected as a convenient tool to investigate multiple relationships between blocks of variables (represented through latent variables as a mean of summarising measured variables into fewer factors) without requiring assumptions on data distributions (Tenenhaus et al., 2005).
Multivariate analyses were based on data reported for 2020 and 2021. Data on AMR in isolates from pigs and poultry were recorded in 2021 and 2020, respectively. Data on AMR in isolates from humans were calculated by pooling the corresponding data collected in 2020 and 2021, and AMC in humans was calculated as the mean of 2020 and 2021 data. For countries that did not report AMC data on hospital consumption, this consumption was estimated by using other countries' partition between hospital and community consumption. All data were standardised (i.e. mean = 0 and variance = 1) prior to inclusion in the model.
3.3.3.1. Outcomes
The typical outcomes of PLS‐PM are presented in Table 7 and illustrated in Figure 5.
TABLE 7.
Outcomes of PLS‐PM models used in the multivariate analyses.
| Outcomes | Characteristics |
|---|---|
| R 2 | Indicates the amount of variance in the dependent variable explained by the independent latent variables. Its value is usually considered high when it is greater than 0.50 or 0.60, depending on the authors |
| Path coefficients (β) | Usually placed next to the corresponding arrow, they are coefficients of the paths between latent variables, which vary between −1 and + 1, and are standardised. The closer to |1| the coefficient, the stronger the path |
Effects
|
Corresponds to the effect of one latent variable on another one. It corresponds to the path coefficient when the effect is direct but is termed an indirect effect when a latent variable mediates this effect indirectly, such as the indirect effect of AMC by food‐producing animals on resistance in human isolates, mediated by resistance in food‐producing animals |
FIGURE 5.

Diagram showing the initial model considered to assess the potential relationships between resistance in bacteria from humans (AMRhuman) and antimicrobial consumption in humans (AMChuman), antimicrobial consumption in food‐producing animals (AMCanimal) (whether as direct or indirect influential factor), and resistance in bacteria in food‐producing animals (AMRanimal). Although AMR data used in this report covered cattle under 1 year of age, sales for the same animal population could not be estimated with the approach used – cattle in general is typically given as the target species in the product information. Consequently, cattle under 1 year of age could not be addressed in the multivariate analysis.
3.3.3.2. Full initial model
The full initial model computed is presented with related outcomes (Figure 5), according to the usual representation of PLS‐PM. Indicators, also called ‘manifest variables’, are presented in green rectangles; they correspond to measured data on AMR and AMC. The variables displayed in blue ovals are ‘latent variables’, which were obtained from ‘manifest variables’. Models were formative since latent constructs were formed by their indicators, as shown by arrows going from rectangles to ovals in Figure 5. Models were fitted using R PLS‐PM package (Sanchez, 2013). The non‐significant relationships (p > 0.05) were discarded from the model in a step‐by‐step backward process.
3.3.4. Comparative analyses of temporal trends
Temporal trend analyses were further investigated for E. coli and a set of antimicrobial groups depending on the sector (i.e. animal vs. human).
The time trend analysis is based on country specific longitudinal models for consumption and resistance (or complete susceptibility). For each country, this results in a pair of slopes, one slope summarising the time (i.e. yearly) trend for consumption, and one for resistance (or complete susceptibility). The significance and the sign of each estimated slope allows a categorisation of each country in nine categories expressing, e.g. a (significant) decreasing time trend in consumption and resistance (or complete susceptibility), or no significant time trend in consumption and a (significant) decreasing time trend in resistance (or complete susceptibility), etc.
More precisely, the longitudinal mixed model for consumption is defined as:
for country and time points , with the number of countries and the number of time points for country . The country specific intercepts and country specific slopes are assumed to vary across countries according to a bivariate normal distribution. Note that the slope parameter refers to a relative change over time on the original consumption scale.
For the probability of resistance (or complete susceptibility), the longitudinal model is a generalised linear mixed model, defined as
for country and time points , with the number of countries and the number of time points for country . The country specific intercepts and country specific slopes are assumed to vary across countries according to a bivariate normal distribution. Note that the slope parameter refers to a relative change over time on the odds scale .
All slope parameters were tested for being statistically significantly different from 0 (value 0 reflecting no time trend), and each country was classified in exactly one of nine categories based on its pair of slopes , for each slope: being not statistically different from 0, and, if statistically different from 0, the estimate being positive (increasing trend) or negative (decreasing trend) (Table 8).
TABLE 8.
Categorisation of outcomes from the time trend analyses using country specific longitudinal modelling for consumption and resistance by group or complete susceptibility.
| Resistance → consumption ↓ |
|
not rejected |
|
||
|---|---|---|---|---|---|
|
|
Decreasing trend in consumption and decreasing trend in resistance | Decreasing trend in consumption and no trend in resistance | Decreasing trend in consumption and increasing trend in resistance | ||
|
|
No trend in consumption and decreasing trend in resistance | No trend in consumption and no trend in resistance | No trend in consumption and increasing trend in resistance | ||
|
|
Increasing trend in consumption and decreasing trend in resistance | Increasing trend in consumption and no trend in resistance | Increasing trend in consumption and increasing trend in resistance |
The above categorisation is visualised in a scatter plot of the pairs of slopes .
The number of countries can vary across different substances and animal species, as well as the number of time points can differ from country to country. Only countries with at least five pairwise time points () are included in the analyses. For countries with incomplete longitudinal patterns (i.e. data for a specific year is missing), it is assumed that the missing observations are ‘missing completely at random’ (missingness is unrelated to any study variable). For more details on linear and generalised linear mixed models, and missing data mechanisms, see (Molenberghs & Verbeke, 2005; Verbeke & Molenberghs, 2011).
Procedure NLMIXED of SAS version 9.4 (SAS Institute, Cary, NC) was used for fitting the longitudinal models.
3.3.5. Code repository
All the code developed used for the univariate, multivariate and time trend analyses can be found in this GitHub repository. The repository includes code written in various programming languages, such as R (version 4.1.2), and SAS Enterprise (version 7.1).
4. ANTIMICROBIAL CONSUMPTION IN HUMANS AND FOOD‐PRODUCING ANIMALS
4.1. Total tonnes of active substance and estimated biomass
In this section, data for 2021 were analysed, as these were the most recent data available from humans and food‐producing animals at the time of analysis.
In 2021, reported consumption of active antimicrobial substances for humans and for food‐producing animals was 3061 and 4994 tonnes, respectively, in the 29 EU/EEA countries delivering consumption data for both humans and food‐producing animals (Table 9).
TABLE 9.
Amount of antimicrobial active substance a , estimated biomass and antimicrobial consumption in humans and food‐producing animals a , 29 EU/EEA countries for which data were available both for humans and food‐producing animals, 2021.
| Country | Amount of active antimicrobial substance b (tonnes) | Estimated biomass (1000 tonnes) | Antimicrobial consumption (mg/kg estimated biomass) | ||||
|---|---|---|---|---|---|---|---|
| Humans | Food‐producing animals | Total | Humans c | Food‐producing animals | Humans | Food‐producing animals | |
| Austria | 45 | 39 | 84 | 558 | 945 | 79.8 | 41.3 |
| Belgium | 83 | 169 | 252 | 722 | 1770 | 115.2 | 95.3 |
| Bulgaria | 54 | 49 | 102 | 432 | 391 | 124.2 | 124.5 |
| Croatia | 27 | 21 | 48 | 243 | 331 | 113.1 | 62.7 |
| Cyprus | 8 | 45 | 53 | 56 | 152 | 139.9 | 296.5 |
| Czechia | 94 | 35 | 129 | 657 | 709 | 142.8 | 50.0 |
| Denmark | 45 | 82 | 127 | 365 | 2452 | 123.5 | 33.4 |
| Estonia | 5 | 5 | 11 | 83 | 114 | 65.7 | 46.6 |
| Finland | 32 | 8 | 40 | 346 | 492 | 92.6 | 17.0 |
| France | 678 | 349 | 1027 | 4232 | 6758 | 160.1 | 51.7 |
| Germany d | 181 | 591 | 772 | 4582 | 8071 | 39.5 | 73.2 |
| Greece | 99 | 120 | 219 | 667 | 1100 | 148.4 | 108.8 |
| Hungary | 40 | 132 | 171 | 608 | 846 | 65.1 | 155.6 |
| Iceland | 2 | 1 | 3 | 23 | 145 | 101.9 | 3.6 |
| Ireland | 39 | 93 | 133 | 313 | 2196 | 126.1 | 42.4 |
| Italy | 479 | 662 | 1141 | 3702 | 3813 | 129.4 | 173.5 |
| Latvia | 8 | 4 | 12 | 118 | 153 | 68.8 | 25.5 |
| Lithuania | 16 | 6 | 22 | 175 | 297 | 94.2 | 20.3 |
| Luxembourg | 4 | 1 | 5 | 36 | 54 | 99.4 | 27.1 |
| Malta | 4 | 2 | 5 | 32 | 15 | 113.2 | 110.5 |
| Netherlands | 45 | 147 | 192 | 1013 | 3092 | 44.3 | 47.6 |
| Norway | 44 | 5 | 49 | 337 | 2197 | 130.3 | 2.5 |
| Poland | 248 | 775 | 1023 | 2365 | 4417 | 104.7 | 175.5 |
| Portugal | 63 | 159 | 222 | 616 | 1063 | 101.8 | 149.9 |
| Romania | 187 | 174 | 361 | 1200 | 2943 | 155.8 | 59.0 |
| Slovakia | 29 | 10 | 39 | 341 | 230 | 85.5 | 41.7 |
| Slovenia | 11 | 6 | 17 | 132 | 184 | 82.4 | 31.8 |
| Spain | 433 | 1296 | 1729 | 2958 | 8245 | 146.5 | 157.2 |
| Sweden | 58 | 9 | 67 | 649 | 788 | 90.1 | 10.9 |
| 29 EU/EEA countries | 3061 | 4994 | 8056 | 27,564 | 53,961 | 125.0 e | 92.6 e |
Calculated from exact figures (not rounded figures).
For antimicrobial groups included in overall consumption data (ATC and ATCvet codes), please refer to Section 3.2.
Population under surveillance for human antimicrobial consumption. Countries reporting < 100% AMC data coverage: Germany (88%, community sector coverage), Luxembourg (90% community sector and 95% hospital sector coverage), the Netherlands (93% community sector coverage) and Portugal (70% hospital sector coverage).
Germany's antimicrobial consumption data are for the community sector only, as hospital sector data were not reported.
Population‐weighted mean. For humans, AMC rates for the populations under surveillance were weighted using 2021 Eurostat populations. Germany was excluded from the population‐weighted mean for humans due to non‐reporting of AMC for the hospital sector.
The estimated biomass covered by the surveillance in 2021, expressed in 1000 tonnes, was 27,564 for humans and 53,961 for food‐producing animals, respectively. The proportion of the total estimated biomass (sum of the biomass of humans and food‐producing animals) accounted for by the food‐producing animal population varied considerably between countries (from 32% to 88%). This variation, as well the different human population numbers in the EU/EEA countries, underline the need to account for differences in population size between human and food‐producing animal sectors within a country and between countries, when comparing consumption in humans and food‐producing animals.
4.2. Population biomass‐corrected consumption
4.2.1. Overall consumption
The comparison of the EU/EEA population‐weighted mean consumption of antimicrobials in humans and food‐producing animals (expressed in mg per kg of estimated biomass) in 2021 is shown in Figure 6 and in Table 9. In 2021, the EU/EEA population‐weighted mean consumption was 125.0 mg/kg in humans (range 44.3–160.1 mg/kg; median 108.9 mg/kg; German data were not considered due to non‐reporting of AMC for the hospital sector). In food‐producing animals, the EU/EEA population‐weighted mean consumption was 92.6 mg/kg (range 2.5–296.5 mg/kg; median 50.0 mg/kg).
FIGURE 6.

Comparison of population biomass‐corrected consumption of antimicrobialsa (milligrams per kilogram estimated biomass) in humans and food‐producing animals by country, in 29 EU/EEA countries for which data were available both for humans and food‐producing animals, 2021. An asterisk (*) denotes that only community consumption was provided for human medicine. The weighted mean represents the population‐weighted mean of data from included countries providing total consumption (community and hospital sectors combined). Note: The estimates presented are crude and must be interpreted with caution. For limitations hampering comparison of antimicrobial consumption in humans and food‐producing animals, see Section 15.12. aFor antimicrobial groups included in overall consumption data (ATC and ATCvet codes), please refer to Section 3.2.
There was no significant association between the consumption in humans and food‐producing animals within country (Spearman's rank correlation coefficient, rho = 0.36, p = 0.06).
4.2.1.1. Consumption by the antimicrobial group
Consumption in 2021 of selected antimicrobial groups (expressed in mg/kg of estimated biomass), aggregated for the 29 EU/EEA countries for which data were available both for humans and food‐producing animals, is shown in Figure 7.
FIGURE 7.

Comparison of consumption of antimicrobial groupsa in humans and food‐producing animals, in 29 EU/EEA countries for which data were available both for humansb and food‐producing animals, 2021. aFor antimicrobial groups included (ATC and ATCvet codes), please refer to Section 3.2. bGermany's antimicrobial consumption data are for the community sector only, as hospital sector data were not reported. cAminopenicillins are shown in dark colour and all other penicillins in light colour. dFluoroquinolones are shown in dark colour and other quinolones in light colour. 1The figure on the right hand side is presented on a different scale to better illustrate the data of substances with a limited use. 2The estimates presented are crude and must be interpreted with caution. For limitations hampering comparison of antimicrobial consumption by humans and food‐producing animals, see Section 15.12.
Penicillins were the highest consumed group for humans (61.9% of total tonnes of J01 substances), followed by first‐ and second‐generation cephalosporins (5.6%), fluoroquinolones and other quinolones combined (5.0%) and macrolides (4.9%). For food‐producing animals, penicillins and tetracyclines were the highest selling groups, accounting for 29.0% and 23.6% of total antimicrobial veterinary medicinal products, respectively. Of note, monobactams and carbapenems have not been assigned a maximum residue limit (MRL) 3 value and consequently they are not allowed for use in food‐producing animals in the EU/EEA countries. Therefore, there is no consumption of such antimicrobials in food‐producing animals. Likewise, pleuromutilins have only recently been authorised for systemic use in humans and no such consumption was reported in humans.
Comparing the distributions of AMC by antimicrobial group across the human and food‐producing animal sectors in 2017 and 2021 (ECDC, EFSA and EMA, 2017b), reductions in human consumption of sulfonamides and trimethoprim were apparent. Additionally, pleuromutilin consumption (food‐producing animals only) was lower in 2021 than that of amphenicols. Trimethoprim consumption also reduced between 2017 and 2021.
Figures with data from all 29 EU/EEA countries included can be found in Sections 5.1–11.1. The range, median and mean of the consumption of the selected groups in humans and food‐producing animals, expressed in mg per kg of estimated biomass, are summarised in Table 10.
TABLE 10.
Range, median and population‐weighted mean antimicrobial consumption in humans and food‐producing animals for the groups selected for analysis and overall, 29 EU/EEA countries for which data were available both for humans and food‐producing animals a , 2021.
| Antimicrobial group b | Antimicrobial consumption (mg/kg estimated biomass) | |||||
|---|---|---|---|---|---|---|
| Humans | Food‐producing animals | |||||
| Range | Median | Mean c | Range | Median | Mean c | |
| Third‐ and fourth‐generation cephalosporins | 0.4–18.3 | 3.0 | 5.1 | < 0.01–0.5 | 0.2 | 0.2 |
| Fluoroquinolones and other quinolones | 1.0–19.0 | 4.6 | 6.3 | < 0.01–14.8 | 0.9 | 2.9 |
| Polymyxins | 0–3.7 | 0.4 | 0.7 | 0–12.7 | 0.5 | 2.5 |
| Aminopenicillins | 6.5–101.0 | 47.2 | 64.1 | 0.05–59.6 | 8.8 | 25.8 |
| Macrolides | 0.5–11.1 | 5.0 | 6.2 | 0–22.6 | 5.0 | 7.8 |
| Tetracyclines | 0.3–6.0 | 1.7 | 1.9 | 0.04–113.4 | 16.2 | 23.6 |
| Total consumption | 44.3–160.1 | 108.9 | 125.0 | 2.5–296.5 | 50.0 | 92.6 |
AT, BE, BG, CY, CZ, DE, DK, EE, EL, ES, FI, FR, HR, HU, IE, IS, IT, LT, LU, LV, MT, NL, NO, PL, PT, RO, SE, SI and SK. DE is not included in human antimicrobial consumption values in this table due to non‐reporting of antimicrobial consumption (AMC) for the hospital sector.
For antimicrobial groups included (ATC and ATCvet codes), please refer to Section 3.2.
Population‐weighted mean.
TABLE 11 Spearman's rank correlation coefficient (rho) for antimicrobial consumption in humans and in food‐producing animals for the groups selected for analysis and overall, 28 EU/EEA countries a for which complete data were available for humans and food‐producing animals, 2021.
| Antimicrobial groups b | Correlation coefficient (p‐value) |
|---|---|
| Third‐ and fourth‐generation cephalosporins | 0.34 (0.08) |
| Fluoroquinolones and other quinolones | 0.74 (< 0.001) |
| Polymyxins | 0.49 (0.008) |
| Aminopenicillins | 0.53 (0.004) |
| Macrolides | 0.51 (0.006) |
| Tetracyclines | −0.31 (0.11) |
| Total consumption | 0.36 (0.06) |
AT, BE, BG, CY, CZ, DK, EE, EL, ES, FI, FR, HR, HU, IE, IS, IT, LT, LU, LV, MT, NL, NO, PL, PT, RO, SE, SI and SK.
For antimicrobial groups included (ATC and ATCvet codes), please refer to Section 3.2.
4.2.1.2. Temporal trends
The EU/EEA population‐weighted average consumption of antimicrobials in humans, expressed in mg/kg estimated biomass, remained stable in the period from 2014 to 2021 for the 26 countries included in the analysis (p = 0.10, linear regression) (Figure 8). Data used for this analysis included all reported AMC data for countries that reported AMC for both human and food‐producing animals; no imputations were done where data were missing (e.g. hospital sector data for certain countries during certain years).
For the EU/EEA population‐weighted mean consumption of antimicrobials in food‐producing animals, expressed in mg/kg estimated biomass, there was a significant change for the 26 countries included in the analysis (p = 0.0001, linear regression). A decline of 45% was observed between 2014 and 2021 (Figure 8), primarily due to a reduction in the consumption of the two highest consumed antimicrobial groups – i.e. tetracyclines (−58%) and penicillins (−29%).
During the last 3 years covered by this report (2019–2021), the mean AMC in the countries decreased by 0.5% in food‐producing animals and by 16.5% in humans (expressed in milligrams per kilogram of estimated biomass).
For the JIACRA, AMC has been expressed as mg per kg of estimated biomass and per year for humans and food‐producing animals. Several limitations inherent to the characteristics of the data collected and the measurements used have been discussed in previous JIACRA reports and in Section 15.12 of this report. This parameter is a technical measure that does not take account of differences between humans and animal species in dosing regimens and formulations used. Calculation of the biomass denominator differs between humans and categories of animals in the accuracy with which it can be estimated and does not take account of differences between the populations (e.g. in demographics, on account of limited lifespan of some animal categories). These limitations should be borne in mind while comparing human and animal consumption of antimicrobials expressed as mg/kg estimated biomass. In addition, multiple factors that affect AMC, such as, environmental conditions, endemic diseases and preventive/therapeutic options, vary widely between humans and different food‐producing animal species, influencing the interpretation of such comparison.
The same measure of consumption is used for consistency with earlier JIACRA reports, allowing for temporal trend analyses, in the absence of an improved measure that can be practically implemented considering the current availability of data in the reporting countries. AMC data are presented on the same graphs primarily to demonstrate the variability and display trends in both sectors.
5. CARBAPENEMS
Carbapenems are a last‐line group of antimicrobials and are mainly used in hospitals for treatment of patients with confirmed or suspected infections involving multidrug‐resistant (MDR) Gram‐negative bacteria. In the WHO AWaRe classification, carbapenems belong to the ‘Watch’ group of antimicrobials, with the exception of meropenem‐vaborbactam and imipenem‐cilastatin‐relebactam, which are in the ‘Reserve’ group (WHO, 2021). Carbapenems are considered by WHO as ‘Critically Important Antimicrobials’ (CIA) in human medicine (WHO, 2019). According to EMA's AMEG categorisation, carbapenems belong to Category A with the indication ‘Avoid’ use in veterinary medicine in the EU (AMEG, 2019). Substances in this category are not authorised in veterinary medicine and, in the absence of evaluation for maximum residue limits (MRLs), cannot be used for food‐producing animals. The use of these antimicrobials in animals is prohibited since 2022 (Official Journal of the European Union, 2022b). Therefore, this chapter only refers to AMC data from human medicine.
5.1. Consumption in humans by country
In 2021, the consumption of carbapenems in hospitals constituted 78%–100% of the total consumption of carbapenems and in most of the countries (19/27) this percentage was > 99%.
In 2021, the EU/EEA population‐weighted mean consumption of carbapenems in humans was 0.067 DDD per 1000 inhabitants per day. The corresponding range was 0.02–0.22 (median 0.06) DDD per 1000 inhabitants per day. The consumption of carbapenems in humans by country in 2021 is shown in Figure 9.
FIGURE 9.

Consumption of carbapenems in humans expressed as DDD per 1000 inhabitants and per day, by country, EU/EEA, 2021. *For Germany, only community consumption was provided for human medicine. Germany's human consumption data were therefore not included in the weighted mean, as only countries providing total consumption (community and hospital sectors combined) were considered for the population‐weighted mean consumption value. aFor antimicrobial agents included (ATC codes), please refer to Section 3.2.
Overall consumption of carbapenems in humans significantly increased (p < 0.001) over the period 2014–2021 (Figure 10).
FIGURE 10.

Trend graph of consumption of carbapenemsa for humans in EU/EEA countriesb, defined daily doses per 1000 inhabitants, 2014–2021. aFor antimicrobial groups included in overall consumption data (ATC codes), please refer to Section 3.2. bThe countries involved in the analysis may slightly vary between years; consequently, a trend line was not generated, and the specific country names are not listed in this context. Carbapenems are not authorised in veterinary medicine and, in the absence of evaluation for maximum residue limits (MRLs), cannot be used for food‐producing animals. The use of these antimicrobials in food‐producing animals is prohibited since 2022. Therefore, this graph only displays AMC data in humans. In the box plots, the lowest boundary indicates the 25th percentile, the black horizontal line within the box marks the median and the upper boundary of the box indicates the 75th percentile. The vertical extending lines denote the most extreme values within 1.5 interquartile range of the 25th and 75th percentile of each group. Only outlying observations (outside of this range) are represented as dots.
5.2. Consumption in humans and resistance in bacteria from humans (univariate analysis)
5.2.1. Klebsiella pneumoniae
Statistically significant positive associations were observed between the consumption of carbapenems and carbapenem resistance in invasive K. pneumoniae isolates for all included years (2019–2021) (Table 12).
TABLE 12.
Consumption of carbapenems in humans, expressed as DDD per 1000 inhabitants and per day, and the probability of resistance to carbapenems in invasive Klebsiella pneumoniae from humans, EU/EEA, 2019–2021 (logistic regression, see Figure 11).
| Year | Countries | Model | OR | p‐value | 95% CI |
|---|---|---|---|---|---|
| 2019 | AT, BE, BG, CY, CZ, DE, DK, EE, EL, ES, FI, FR, HR, HU, IE, IS, IT, LT, LU, LV, MT, NL, NO, PL, PT, RO, SE, SI, SK (n = 29) | log | 3.17 | 0.004 | 1.45–6.96 |
| 2020 | AT, BE, BG, CY, CZ, DE, DK, EE, EL, ES, FI, FR, HR, HU, IE, IS, IT, LT, LU, LV, MT, NL, NO, PL, PT, RO, SE, SI, SK (n = 29) | log | 5.61 | < 0.001 | 2.60–12.11 |
| 2021 | AT, BE, BG, CY, CZ, DE, DK, EE, EL, ES, FI, FR, HR, HU, IE, IS, IT, LT, LU, LV, MT, NL, NO, PL, PT, RO, SE, SI, SK (n = 29) | log | 5.26 | < 0.001 | 2.57–10.75 |
Abbreviations: CI, confidence interval; OR, odds ratio.
Note: OR varies from 0 to infinity. When OR equals 1 or CI includes 1, the association is not considered statistically significant.
FIGURE 11.

Consumption of carbapenems in humans and the probability of resistance to carbapenems in invasive Klebsiella pneumoniae from humans, EU/EEA, 2019–2021 (see Table 12). The figure displays results of logistic regression analyses. Bubbles represent the countries included in the analysis. The size of the bubbles indicates the amount of available resistance data per country.
FIGURE 12.

Consumption of carbapenems in humans and the probability of resistance to carbapenems in invasive Escherichia coli from humans, EU/EEA, 2019–2021 (see Table 13). The figure displays results of logistic regression analyses. Bubbles represent the countries included in the analysis. The size of the bubbles indicates the amount of available resistance data per country.
5.2.2. Escherichia coli
Statistically significant positive associations were observed between consumption of carbapenems and resistance to carbapenems of invasive E. coli for all included years (2019–2021) (Table 13).
TABLE 13.
Consumption of carbapenems in humans expressed as DDD per 1000 inhabitants and per day, and the probability of resistance to carbapenems in invasive Escherichia coli from humans, EU/EEA, 2019–2021 (logistic regression, see Figure 12).
| Year | Countries | Model | OR | p‐value | 95% CI |
|---|---|---|---|---|---|
| 2019 | AT, BE, BG, CY, CZ, DE, DK, EE, EL, ES, FI, FR, HR, HU, IE, IS, IT, LT, LU, LV, MT, NL, NO, PL, PT, RO, SE, SI, SK (n = 29) | log | 2.99 | 0.002 | 1.49–6.00 |
| 2020 | BE, BG, CY, CZ, DE, DK, EE, EL, ES, FI, FR, HR, HU, IE, IS, IT, LT, LU, LV, MT, NL, NO, PL, PT, RO, SE, SI, SK (n = 28) | log | 2.40 | 0.001 | 1.40–4.13 |
| 2021 | AT, BE, BG, CY, CZ, DE, DK, EE, EL, ES, FI, FR, HR, HU, IE, IS, IT, LT, LU, LV, MT, NL, NO, PL, PT, RO, SE, SI, SK (n = 29) | log | 2.50 | < 0.001 | 1.64–3.79 |
Abbreviations: CI, confidence interval; OR, odds ratio.
Note: OR varies from 0 to infinity. When OR equals 1 or CI includes 1, the association is not considered statistically significant.
5.3. Resistance in bacteria from humans and from food‐producing animals (univariate analysis)
Resistance to carbapenems in food‐producing animals is extremely rare; occasional findings in E. coli have been recorded in pigs and chickens and calves since 2011. K. pneumoniae is not routinely tested for AMR in food‐producing animals in most countries. A correlation analysis between resistance in isolates from food‐producing animals and humans was not possible.
5.4. Multivariate analysis
The occurrence of carbapenem resistance in Enterobacterales from food‐producing animals is rare and the use of this antimicrobial in food‐producing animals is prohibited. Therefore, a multivariate analysis for the emergence of carbapenem resistance in E. coli or K. pneumoniae in relation to the consumption of carbapenems and resistance to these antimicrobials in food‐producing animals, as well as carbapenem consumption in humans, could not be performed.
5.5. Trends in consumption and resistance from 2014 to 2021
Trends in carbapenem consumption and resistance were only investigated for humans as carbapenems may not be used in animals and resistant isolates from animals are only observed in exceptional cases. Overall trends between 2014 and 2021 could be analysed for 25 countries (Figure 13). More countries had a statistically significant increase in consumption of carbapenems than a decrease (11 vs. 2). Six countries experienced a statistically significant increase in carbapenem resistance of invasive E. coli. No country documented a statistically significant decrease in carbapenem resistance in invasive E. coli.
FIGURE 13.

Comparison of annual changes in consumption of carbapenems in humans and in resistance to carbapenems in Escherichia coli from humans between 2014 and 2021 by EU/EEA country. White zone, statistical difference in both the change in consumption and the change in resistance; dotted grey zone, non‐statistically significant difference in the change in consumption; grey zone, non‐statistically significant difference in the change in resistance.
6. THIRD‐ AND FOURTH‐GENERATION CEPHALOSPORINS
In WHO's AWaRe classification, third‐ and fourth‐generation cephalosporins belong to the ‘Watch’ group of antimicrobials, with the exception of ceftazidime‐avibactam, which is in ‘Reserve’ (WHO, 2021). Third‐ and fourth‐generation cephalosporins are considered by WHO as ‘Highest Priority Critically Important Antimicrobials’ (HPCIA) in human medicine (WHO, 2019). This group has also been categorised as Veterinary Critically Important Antimicrobial Agents (VCIA) in the WOAH list of antimicrobials of veterinary importance (WOAH, 2021). According to EMA's AMEG categorisation, third‐ and fourth‐generation cephalosporins belong to Category B, with the designation ‘Restrict’ use in veterinary medicine in the EU (AMEG, 2019). This means that the risk to public health resulting from veterinary use needs to be mitigated by specific restrictions. Third‐ and fourth‐generation cephalosporins should only be used for the treatment of clinical conditions in food‐producing animals when there are no antimicrobials in the lower Categories C (‘Caution’) or D (‘Prudence’) that could be clinically effective.
6.1. Consumption in humans and food‐producing animals by country
In 2021, the EU/EEA population‐weighted mean consumption of third‐ and fourth‐generation cephalosporins in humans and food‐producing animals was 5.1 and 0.2 mg/kg of estimated biomass, respectively (Table 10). The corresponding ranges were 0.4–18.3 (median 3.0) in humans and < 0.01–0.5 (median 0.2) mg/kg of estimated biomass in food‐producing animals, respectively. In Figure 14 the biomass‐corrected consumption in humans and food‐producing animals is shown by country.
FIGURE 14.

Population biomass‐corrected consumption of third‐ and fourth‐generation cephalosporins in humans and food‐producing animals in 29 EU/EEA countries for which data were available both for humans and food‐producing animals, 2021. *For Germany, only community consumption was provided for human medicine. Germany's human consumption data were therefore not included in the weighted mean, as only countries providing total consumption (community and hospital sectors combined) were considered for the population‐weighted mean consumption value. Note: The estimates presented are crude and must be interpreted with caution. For limitations hampering comparison of antimicrobial consumption in humans and food‐producing animals, see Section 15.12. aFor antimicrobial agents included (ATC and ATCvet codes), please refer to Section 3.2. The levels of consumption should be compared with caution between humans and animals, as the calculation of the denominator differs. For details see text box under Figure 8.
There was no significant association between the consumption of third‐ and fourth‐generation cephalosporins in humans and in food‐producing animals (Spearman's rank correlation coefficient, rho 0.34, p = 0.08) at the national level in 2021.
Between 2014 and 2021 consumption of third‐ and fourth‐generation cephalosporins did not change significantly in humans nor in food‐producing animals (Figure 15).
FIGURE 15.

Trend graph of population biomass‐corrected consumption of third‐ and fourth‐generation cephalosporinsa for humans and food‐producing animals in EU/EEA countriesb, mg/kg of estimated biomass, 2014–2021. aFor antimicrobial groups included in overall consumption data (ATC and ATCvet codes), please refer to Section 3.2. bThe countries involved in the analysis may slightly vary between years; consequently, a trend line was not generated, and the specific country names are not listed in this context. The levels of consumption should be compared with caution between humans and animals, as the calculation of the denominator differs. For details see text box under Figure 8. In the box plots, the lowest boundary indicates the 25th percentile, the black horizontal line within the box marks the median and the upper boundary of the box indicates the 75th percentile. The vertical extending lines denote the most extreme values within 1.5 interquartile range of the 25th and 75th percentile of each group. Only outlying observations (outside of this range) are represented as dots.
Consumption of third and fourth‐generation cephalosporins for humans and food‐producing animals from 2014 to 2021 is depicted in Figure 15.
6.2. Consumption in humans and resistance in bacteria from humans (univariate analysis)
6.2.1. Escherichia coli
A statistically significant positive association between the total consumption (community and hospital) of third and fourth‐generation cephalosporins and resistance to third‐generation cephalosporins in invasive E. coli isolates from humans was found for 2019, 2020 and 2021 with odds ratios being constant over the years (Table 14, Figure 16).
TABLE 14.
Consumption of third‐ and fourth‐generation cephalosporins in humans, expressed as DDD per 1000 inhabitants and per day, and the probability of resistance to third‐generation cephalosporins in Escherichia coli from humans, EU/EEA, 2019–2021 (logistic regression, see Figure 16).
| Year | Countries | Model | OR | p‐value | 95% CI |
|---|---|---|---|---|---|
| 2019 | AT, BE, BG, CY, CZ, DE, DK, EE, EL, ES, FI, FR, HR, HU, IE, IS, IT, LT, LU, LV, MT, NL, NO, PL, PT, RO, SE, SI, SK (n = 29) | log | 1.29 | < 0.001 | 1.18–1.40 |
| 2020 | AT, BE, BG, CY, CZ, DE, DK, EE, EL, ES, FI, FR, HR, HU, IE, IS, IT, LT, LU, LV, MT, NL, NO, PL, PT, RO, SE, SI, SK (n = 29) | log | 1.36 | < 0.001 | 1.24–1.48 |
| 2021 | AT, BE, BG, CY, CZ, DE, DK, EE, EL, ES, FI, FR, HR, HU, IE, IS, IT, LT, LU, LV, MT, NL, NO, PL, PT, RO, SE, SI, SK (n = 29) | log | 1.34 | < 0.001 | 1.24–1.46 |
Abbreviations: CI, confidence interval; OR, odds ratio.
Note: OR varies from 0 to infinity. When OR equals 1 or CI includes 1, the association is not considered statistically significant.
FIGURE 16.

Consumption of third‐ and fourth‐generation cephalosporins in humans and the probability of resistance to third‐generation cephalosporins in Escherichia coli, EU/EEA, 2019–2021 (see Table 14). The figure displays results of logistic regression analyses. Bubbles represent the countries included in the analysis. The size of the bubbles indicates the amount of available resistance data per country.
6.3. Consumption in food‐producing animals and resistance in bacteria from food‐producing animals (univariate analysis)
As third‐ and fourth‐generation cephalosporins are not licensed for use in poultry, it should be noted that data on consumption of these substances only includes consumption in other animal species.
6.3.1. Escherichia coli from food‐producing animals
In order to investigate possible relationships between the consumption of third‐ and fourth‐generation cephalosporins and cephalosporin resistance, the SIMR to cefotaxime in E. coli from food‐producing animals was compared with the consumption of third‐ and fourth‐generation cephalosporin in food‐producing animals (expressed in mg per kg of estimated biomass) for the 2‐year intervals 2018–2019, 2019–2020 and 2020–2021 (mean consumption over the respective years) at the national level (Table 15). The category ‘food‐producing animals’ for the resistance data includes broilers, turkeys, pigs and calves, sampled at slaughter, for each time interval.
TABLE 15.
Consumption of third‐ and fourth‐generation cephalosporins in food‐producing animals, expressed in mg per kg of estimated biomass, and the probability of resistance to third‐generation cephalosporins in indicator Escherichia coli from food‐producing animals, EU/EEA, 2018–2021 (logistic regression).
| Year | Countries | Model | OR | p‐value | 95% CI |
|---|---|---|---|---|---|
| 2018–2019 | AT, BE, BG, CY, CZ, DE, DK, EE, EL, ES, FI, FR, HR, HU, IE, IS, IT, LT, LV, MT, NL, NO, PL, PT, RO, SE, SI, SK (n = 28) | log | 1.24 | 0.088 | 0.97–1.57 |
| 2019–2020 | AT, BE, BG, CY, CZ, DE, DK, EE, EL, ES, FI, FR, HR, HU, IE, IS, IT, LT, LU, LV, MT, NL, NO, PL, PT, RO, SE, SI, SK (n = 29) | log | 1.29 | 0.073 | 0.98–1.70 |
| 2020–2021 | AT, BE, BG, CY, CZ, DE, DK, EE, EL, ES, FI, FR, HR, HU, IE, IS, IT, LT, LU, LV, MT, NL, NO, PL, PT, RO, SE, SI, SK (n = 29) | log | 1.25 | 0.074 | 0.98–1.58 |
Abbreviations: CI, confidence interval; OR, odds ratio.
Note: OR varies from 0 to infinity. When OR equals 1 or CI includes 1, the association is not considered statistically significant.
For all three periods, the association was assessed as borderline statistically significant. Removal of outliers (one country for 2018–2019 and 2019–2020) turned the association significant.
6.3.2. Indicator Escherichia coli from pigs
The estimated consumption of third‐ and fourth‐generation cephalosporins in pigs was compared with the occurrence of resistance to cefotaxime in indicator E. coli from slaughter pigs for 2019 and 2021 for 30 reporting countries. The corresponding analysis was not performed in poultry, since there is no veterinary medicinal product based on third‐ or fourth‐generation cephalosporins authorised in poultry in the EU. Therefore, there is no consumption of these substances in poultry.
Although variations in consumption of third‐ and fourth‐generation cephalosporins in pigs were observed among the countries considered, cefotaxime resistance in indicator E. coli from slaughter pigs was typically reported at very low levels.
For E. coli, the association was significant for 2019 and borderline significant for 2021 (Table 16, Figure 17).
TABLE 16.
Consumption of third‐ and fourth‐generation cephalosporins in pigs, expressed as DDDvet/kg of estimated biomass/year, and the probability of resistance to cefotaxime in indicator Escherichia coli from pigs, EU/EEA, 2019–2021 (logistic regression, see Figure 17).
| Year | Country | Model | OR | p‐value | 95% CI |
|---|---|---|---|---|---|
| 2019 | AT, BE, BG, CH, CY, CZ, DE, DK, EE, EL, ES, FI, FR, HR, HU, IE, IS, IT, LT, LU, LV, MT, NL, NO, PL, PT, RO, SE, SI, SK (n = 30) | log | 1.27 | 0.032 | 1.02–1.58 |
| 2021 | AT, BE, BG, CH, CY, CZ, DE, DK, EE, EL, ES, FI, FR, HR, HU, IE, IS, IT, LT, LU, LV, MT, NL, NO, PL, PT, RO, SE, SI, SK (n = 30) | log | 1.21 | 0.068 | 0.99–1.47 |
Abbreviations: CI, confidence intervall OR: odds ratio.
Note: OR varies from 0 to infinity. When OR equals 1 or CI includes 1, the association is not considered statistically significant.
FIGURE 17.

Consumption of third‐ and fourth‐generation cephalosporins in pigs and the probability of resistance to third‐generation cephalosporins in indicator Escherichia coli from pigs, EU/EEA, 2019 and 2021 (see Table 16). The figure displays results of logistic regression analyses. Bubbles represent the countries included in the analysis. The size of the bubbles indicates the amount of available resistance data per country. A solid trend line indicates significance at a 5% level, whereas a dashed trend line represents significance at a 10% level.
6.4. Resistance in bacteria from humans and food‐producing animals (univariate analysis)
6.4.1. Escherichia coli from humans and food‐producing animals
Data on the resistance of invasive E. coli from humans to third‐generation cephalosporins (2019–2021) were compared with the resistance to third‐generation cephalosporins of indicator E. coli from broilers and turkeys (2020) as well as from pigs and calves (2019, 2021).
A statistically significant association was found only between resistance of invasive E. coli from humans to third‐generation cephalosporins and resistance to third‐generation cephalosporins of indicator E. coli from calves in the year 2019 and a borderline significant association from broilers in the year 2020 (Table 17, Figure 18). However, both analyses revealed few outliers. Removal of any of these outliers turned the results borderline significant for calves (2019) and significant for broilers (2020). No statistically significant associations were found for calves in 2021, turkeys (2020) and pigs (2019, 2021).
TABLE 17.
Probability of resistance to third‐generation cephalosporins in Escherichia coli from humans and food‐producing animals, EU/EEA, 2019–2021 (logistic regression, see Figure 18).
| FPA | Year | Countries | Model | OR | p‐value | 95% CI |
|---|---|---|---|---|---|---|
| Pigs | 2019 | AT, BE, BG, CY, CZ, DE, DK, EE, EL, ES, FI, FR, HR, HU, IE, IS, IT, LT, LU, LV, MT, NL, NO, PL, PT, RO, SE, SI, SK (n = 29) | log | 1.01 | 0.807 | 0.91–1.12 |
| 2021 | AT, BE, BG, CY, CZ, DE, DK, EE, EL, ES, FI, FR, HR, HU, IE, IS, IT, LT, LU, LV, MT, NL, NO, PL, PT, RO, SE, SI, SK (n = 29) | log | 1.07 | 0.178 | 0.97–1.19 | |
| Calves | 2019 | BE, DE, DK, ES, FR, HR, IT, NL, NO, PT (n = 10) | log | 1.17 | 0.042 | 1.01–1.36 |
| 2021 | BE, DE, DK, ES, FR, HR, IT, NL, NO, PT, RO, SE (n = 12) | log | 1.03 | 0.756 | 0.87–1.21 | |
| Broilers | 2020 | AT, BE, BG, CY, CZ, DE, DK, EE, EL, ES, FI, FR, HR, HU, IE, IS, IT, LT, LU, LV, MT, NL, NO, PL, PT, RO, SE, SI, SK (n = 29) | log | 1.08 | 0.089 | 0.99–1.18 |
| Turkeys | 2020 | AT, BE, DE, ES, FR, HU, IT, NO, PL, PT, RO, SE (n = 12) | log | 1.00 | 0.968 | 0.87–1.14 |
Abbreviations: CI, confidence interval; FPA, food‐producing animals; OR, odds ratio.
Note: OR varies from 0 to infinity. When OR equals 1 or CI includes 1, the association is not considered statistically significant.
FIGURE 18.

Probability of resistance to third‐generation cephalosporins in Escherichia coli from humans and calves, EU/EEA, 2019 and 2021 (see Table 17). The figure displays results of logistic regression analyses. Bubbles represent the countries included in the analysis. The size of the bubbles indicates the amount of available resistance data per country.
6.4.2.
6.4.2 Prevalence of ESBL‐ and/or AmpC‐producing Escherichia coli from food‐producing animals and consumption of third‐ and fourth‐generation cephalosporins
The prevalence of ESBL and/or AmpC‐producing E. coli has been retained as one of the key indicators of AMR in food‐producing animals in the EU (ECDC, EFSA, EMA, 2017a). It is defined as the proportion of samples from broilers, fattening turkeys, fattening pigs and bovine animals aged under 1 year, weighted by PCU, that are identified as positive for presumptive ESBL and/or AmpC‐producing E. coli when performing specific monitoring for ESBL‐/AmpC−/carbapenemase‐producing E. coli in food‐producing animals. The specific monitoring, which has been in place since 2015, comprises culture of caecal samples on medium containing cefotaxime for selective isolation of ESBL‐/AmpC‐/carbapenemase‐producing E. coli (Commission Implementing Decision 2013/652/EU (for 2019 and 2020), Commission Implementing Decision (EU) 2020/1729 (for 2021)).
The prevalence of ESBL and/or AmpC producers in food‐producing animals was compared with the national consumption of third‐ and fourth‐generation cephalosporins in food‐producing animals (expressed in mg per kg of estimated biomass) for the time periods 2018–2019, 2019–2020 and 2020–2021 at the national level. As the statutory specific monitoring of ESBL and/or AmpC producers foresees testing of the food‐producing animal populations on a biennial basis, two consecutive years were considered together in all analyses. Both data on the prevalence of ESBL and/or AmpC producers and the national consumption of third‐ and fourth‐generation cephalosporins were available together for 26, 27 and 26 countries, respectively.
Marked variations in the prevalence of ESBL‐ and/or AmpC producers and the consumption of third‐ and fourth‐generation cephalosporins were observed among the countries included in the analyses (Table 18, Figure 19). The prevalence of ESBL‐ and/or AmpC producers ranged between 90% in some countries to very low levels in other countries. Consumption of third‐ and fourth‐generation cephalosporins varied from zero to less than 1 mg/kg of estimated biomass. For all time intervals, significant positive associations of the same magnitude were observed between the probability of detecting an ESBL‐ and/or AmpC‐producing E. coli and the consumption of third‐ and fourth‐generation cephalosporins (Table 18).
TABLE 18.
Consumption of third‐ and fourth‐generation cephalosporins in food‐producing animals (expressed in mg per kg estimated biomass) and prevalence of ESBL‐ and/or AmpC‐producing Escherichia coli in food‐producing animals, EU/EEA, 2018–2021 (logistic regression, see Figure 19).
| Year | Countries | Model | OR | p‐value | 95% CI |
|---|---|---|---|---|---|
| 2018–2019 | AT, BE, BG, CY, CZ, DE, DK, EE, EL, ES, FI, FR, HR, HU, IE, IS, LT, LV, NL, NO, PL, PT, RO, SE, SI, SK (n = 26) | log | 1.29 | < 0.001 | 1.16–1.43 |
| 2019–2020 | AT, BE, BG, CY, CZ, DE, DK, EE, EL, ES, FI, FR, HR, HU, IE, IS, LT, LU, LV, NL, NO, PL, PT, RO, SE, SI, SK (n = 27) | log | 1.29 | < 0.001 | 1.17–1.43 |
| 2020–2021 | AT, BE, BG, CZ, DE, DK, EE, EL, ES, FI, FR, HR, HU, IE, IS, LT, LU, LV, NL, NO, PL, PT, RO, SE, SI, SK (n = 26) | log | 1.35 | < 0.001 | 1.22–1.50 |
Abbreviations: CI, confidence interval; OR, odds ratio.
Note: OR varies from 0 to infinity. When OR equals 1 or CI includes 1, the association is not considered statistically significant. Food‐producing animals include broilers, turkeys, pigs and veal calves.
FIGURE 19.

Consumption of third‐ and fourth‐generation cephalosporins in food‐producing animals and the prevalence of ESBL‐ and/or AmpC‐producing Escherichia coli in food‐producing animals for 2018–2019, 2019–2020 and 2020–2021 (see Table 18). The figure displays results of logistic regression analyses. Bubbles represent the countries included in the analysis. The size of the bubbles reflects the amount of examined samples per country.
TABLE 18.
Consumption of third‐ and fourth‐generation cephalosporins in food‐producing animals (expressed in mg per kg estimated biomass) and prevalence of ESBL‐ and/or AmpC‐producing Escherichia coli in food‐producing animals, EU/EEA, 2018–2021 (logistic regression, see Figure 19).
| Year | Countries | Model | OR | p‐value | 95% CI |
|---|---|---|---|---|---|
| 2018–2019 | AT, BE, BG, CY, CZ, DE, DK, EE, EL, ES, FI, FR, HR, HU, IE, IS, LT, LV, NL, NO, PL, PT, RO, SE, SI, SK (n = 26) | log | 1.29 | < 0.001 | 1.16–1.43 |
| 2019–2020 | AT, BE, BG, CY, CZ, DE, DK, EE, EL, ES, FI, FR, HR, HU, IE, IS, LT, LU, LV, NL, NO, PL, PT, RO, SE, SI, SK (n = 27) | log | 1.29 | < 0.001 | 1.17–1.43 |
| 2020–2021 | AT, BE, BG, CZ, DE, DK, EE, EL, ES, FI, FR, HR, HU, IE, IS, LT, LU, LV, NL, NO, PL, PT, RO, SE, SI, SK (n = 26) | log | 1.35 | < 0.001 | 1.22–1.50 |
Abbreviations: CI, confidence interval; OR, odds ratio.
Note: OR varies from 0 to infinity. When OR equals 1 or CI includes 1, the association is not considered statistically significant. Food‐producing animals include broilers, turkeys, pigs and veal calves.
FIGURE 19.
Consumption of third‐ and fourth‐generation cephalosporins in food‐producing animals and the prevalence of ESBL‐ and/or AmpC‐producing Escherichia coli in food‐producing animals for 2018–2019, 2019–2020 and 2020–2021 (see Table 18). The figure displays results of logistic regression analyses. Bubbles represent the countries included in the analysis. The size of the bubbles reflects the amount of examined samples per country.
6.5. Consumption in food‐producing animals and resistance in bacteria from humans (univariate analysis)
To investigate a possible relationship between the consumption of third‐ and fourth‐generation cephalosporins in food‐producing animals with resistance to third‐generation cephalosporins in bacteria causing infections in humans, the occurrence of AMR in invasive E. coli from humans was compared with consumption of third‐ and fourth‐ generation cephalosporins in food‐producing animals (expressed in milligrams per kg of estimated biomass) for 2019, 2020 and 2021.
6.5.1. Escherichia coli
A statistically significant positive association was found between consumption of third‐ and fourth‐generation cephalosporins in food‐producing animals and resistance to third‐generation cephalosporins in invasive E. coli isolates from humans for all 3 years (Table 19, Figure 20).
TABLE 19.
Consumption of third‐ and fourth‐generation cephalosporins in food‐producing animals, expressed in mg/PCU, and the probability of resistance to third‐generation cephalosporins in Escherichia coli from humans, EU/EEA, 2019–2021 (logistic regression, see Figure 20).
| Year | Countries | Model | OR | p‐value | 95% CI |
|---|---|---|---|---|---|
| 2019 | AT, BE, BG, CY, CZ, DE, DK, EE, EL, ES, FI, FR, HR, HU, IE, IS, IT, LT, LU, LV, MT, NL, NO, PL, PT, RO, SE, SI, SK (n = 29) | log | 1.12 | 0.002 | 1.04–1.20 |
| 2020 | AT, BE, BG, CY, CZ, DE, DK, EE, EL, ES, FI, FR, HR, HU, IE, IS, IT, LT, LU, LV, MT, NL, NO, PL, PT, RO, SE, SI, SK (n = 29) | log | 1.12 | 0.003 | 1.04–1.21 |
| 2021 | AT, BE, BG, CY, CZ, DE, DK, EE, EL, ES, FI, FR, HR, HU, IE, IS, IT, LT, LU, LV, MT, NL, NO, PL, PT, RO, SE, SI, SK (n = 29) | log | 1.14 | 0.001 | 1.05–1.23 |
Abbreviations: CI, confidence interval; OR, odds ratio.
Note: OR varies from 0 to infinity. When OR equals 1 or CI includes 1, the association is not considered statistically significant.
FIGURE 20.

Consumption of third‐ and fourth‐generation cephalosporins in food‐producing animals, and the probability of resistance to third‐generation cephalosporins in Escherichia coli from humans, EU/EEA, 2019–2021 (see Table 19). The figure displays results of logistic regression analyses. Bubbles represent the countries included in the analysis. The size of the bubbles indicates the amount of available resistance data per country.
6.6. Multivariate analysis
The only significant relationship retained in the final model of resistance to third‐generation cephalosporins in invasive E. coli from humans was the strong direct impact of the consumption of these groups of antimicrobials in humans (Figure 21).
FIGURE 21.

Diagram of PLS‐PM model of resistance to third‐generation cephalosporins in human invasive Escherichia coli (2020–2021), considering resistance to third‐generation cephalosporins in indicator E. coli from food‐producing animals (poultry in 2020 and pigs in 2021), consumption of third‐ and fourth‐generation cephalosporins in humans (2020–2021 mean, expressed as DDD per 1000 inhabitants and per day) and in food‐producing animals (pigs in 2021, expressed as DDDvet/kg of estimated biomass). 27 countries: AT, BE, BG, CY*, CZ*, DE*, DK, EE, EL, ES, FI, FR, HR, HU, IE, IS*, IT, LT, LV, NL, NO, PL, PT, RO, SE, SI, SK. *For these countries, data on human consumption in the hospital sector were not available, and hospital consumption was estimated from the proportion reported by the other countries for the same year. (Goodness‐of‐fit = 0.766).
6.7. Trends in consumption and resistance from 2014 to 2021
In humans, a statistically significant increase in AMC of third‐ and fourth‐generation cephalosporins between 2014 and 2021 was seen in five countries as opposed to two countries with a statistically significant decrease over time (Figure 22). A statistically significant increase of invasive E. coli from humans resistant to third‐generation cephalosporins was documented in six countries in the same time period while eight countries observed a statistically significant decrease in resistance in E. coli from humans to these substances. A concurrent statistically significant decrease of both consumption of third‐ and fourth‐generation cephalosporins and resistance of invasive E. coli from humans to third‐generation cephalosporins was only seen in one country, while a concurrent statistically significant increase in both consumption and resistance was seen in two countries.
FIGURE 22.

Comparison of annual changes in consumption of third‐ and fourth‐generation cephalosporins in humans and resistance to third‐generation cephalosporins in Escherichia coli from humans between 2014 and 2021 by EU/EEA country. White zone, statistical difference in both the change in consumption and the change in resistance; dotted grey zone, non‐statistically significant difference in the change in consumption; grey zone, non‐statistically significant difference in the change in resistance.
In contrast, in food‐producing animals, more countries observed a statistically significant decrease in consumption of third‐ and fourth‐generation cephalosporins (7 vs. 3) and also a statistically significant decrease was observed more often than an increase (14 vs. 1) in resistance of E. coli from food‐producing animals to third‐generation cephalosporins (Figure 23). In food‐producing animals, three countries observed a concurrent statistically significant decrease of consumption of third‐ and fourth‐generation cephalosporins and resistance of E. coli to third‐generation cephalosporins, while only one country had a concurrent statistically significant increase in both consumption of thjrd‐ and fourth‐generation cephalosporins and resistance of E. coli to third‐generation cephalosporins.
FIGURE 23.

Comparison of annual changes in consumption of third‐ and fourth‐generation cephalosporins in food‐producing animals and resistance to third‐generation cephalosporins in Escherichia coli from food‐producing animals between 2014 and 2021 by EU/EEA country. White zone, statistical difference in both the change in consumption and the change in resistance; dotted grey zone, non‐statistically significant difference in the change in consumption; grey zone, non‐statistically significant difference in the change in resistance.
It has to be considered that in countries with low levels of consumption and/or resistance at the beginning of the observation period, a significant decrease in consumption and/or resistance was likely not possible. In those countries, conserving the low levels has to be considered as a success.
7. FLUOROQUINOLONES AND OTHER QUINOLONES
Quinolones consumed in humans are almost exclusively fluoroquinolones. Since 2019, their use in human medicine has been restricted due to the risk of disabling, long‐lasting and potentially irreversible side effects (EMA, 2023).
In WHO's AWaRe classification, quinolones (fluoroquinolones and other quinolones) belong to the ‘Watch’ group of antimicrobials (WHO, 2021). Quinolones are considered by WHO as HPCIA in human medicine (WHO, 2019).
Fluoroquinolones have been categorised as VCIA in the WOAH list of antimicrobials of veterinary importance. Other quinolones are categorised as Veterinary Highly Important Antimicrobial Agents (VHIA) (WOAH, 2021).
According to EMA's AMEG categorisation, quinolones belong to Category B with the indication of ‘Restrict’ use in veterinary medicine in the EU (AMEG, 2019). This means that the risk to public health resulting from veterinary use needs to be mitigated by specific restrictions. Fluoroquinolones should only be used for the treatment of clinical conditions in food‐producing animals when there are no antimicrobials in Categories C (‘Caution’) or D (‘Prudence’) that could be clinically effective.
7.1. Consumption in humans and food‐producing animals by country
In 2021, the population‐weighted mean consumption of fluoroquinolones and other quinolones in humans and food‐producing animals was 6.3 and 2.9 mg/kg of estimated biomass, respectively. The corresponding ranges were 1.0–19.0 (median 4.6) and < 0.01–14.8 (median 0.9) mg/kg, respectively. Mean, range and median were similar for ‘fluoroquinolones and other quinolones’ (Table 10) in comparison with ‘fluoroquinolones’ alone. Population‐corrected consumption of fluoroquinolones and other quinolones in humans and food‐producing animals by country is shown in Figure 24. Consumption of other quinolones was mainly observed in food‐producing animals, particularly in some countries, while in humans, the consumption was negligible.
FIGURE 24.

Population biomass‐corrected consumption of fluoroquinolones and other quinolones in humans and food‐producing animals in 29 EU/EEA countries for which data were available both for humans and food‐producing animals, 2021. *For Germany, only community consumption was provided for human medicine. Germany's human consumption data were therefore not included in the weighted mean, as only countries providing total consumption (community and hospital sectors combined) were considered for the population‐weighted mean consumption value. Note: The estimates presented are crude and must be interpreted with caution. For limitations hampering comparison of antimicrobial consumption in humans and food‐producing animals, see Section 15.12. aFor antimicrobial agents included (ATC and ATCvet codes), please refer to Section 3.2. The levels of consumption should be compared with caution between humans and animals, as the calculation of the denominator differs. For details see text box under Figure 8.
There was a marked variation between countries in the quantity of fluoroquinolones consumed in humans and/or food‐producing animals. There was a significant association between the national level consumption of fluoroquinolones in humans and in food‐producing animals (Spearman's rank correlation coefficients: rho 0.74, p‐value < 0.001) (Table 10).
Between 2014 and 2021 the consumption of fluoroquinolones decreased in both humans (p < 0.001) and food‐producing animals (p = 0.004) with the lowest median consumption (without interpolation of missing hospital consumption data for a few countries and years) in both food‐producing animals (0.9) and humans (4.4) in 2021 (Figure 25).
FIGURE 25.

Trend graph of population biomass‐corrected consumption of fluoroquinolones and other quinolonesa for humans and food‐producing animals in EU/EEA countriesb, mg/kg of estimated biomass, 2014–2021. aFor antimicrobial groups included in overall consumption data (ATC and ATCvet codes), please refer to Section 3.2. bThe countries involved in the analysis may slightly vary between years; consequently, a trend line was not generated, and the specific country names are not listed in this context. The levels of consumption should be compared with caution between humans and animals, as the calculation of the denominator differs. For details see text box under Figure 8. In the box plots, the lowest boundary indicates the 25th percentile, the black horizontal line within the box marks the median and the upper boundary of the box indicates the 75th percentile. The vertical extending lines denote the most extreme values within 1.5 interquartile range of the 25th and 75th percentile of each group. Only outlying observations (outside of this range) are represented as dots.
7.2. Consumption in humans and resistance in bacteria from humans (univariate analysis)
7.2.1. Escherichia coli
To investigate the possible associations between the consumption of fluoroquinolones and the occurrence of resistance to fluoroquinolones in invasive E. coli isolates from humans, the total consumption of fluoroquinolones and other quinolones in humans, expressed as DDD per 1000 inhabitants and per day, was analysed against the occurrence of fluoroquinolone resistance in invasive E. coli isolates from humans for 2019, 2020 and 2021.
Statistically significant positive associations were observed between the consumption of fluoroquinolones and other quinolones in humans and resistance to fluoroquinolones in invasive E. coli isolates from humans for all 3 years (2019–2021) (Table 20, Figure 26).
TABLE 20.
Consumption of fluoroquinolones and other quinolones in humans, expressed as DDD per 1000 inhabitants per day, and the probability of resistance to fluoroquinolones in Escherichia coli from humans, EU/EEA, 2019–2021 (logistic regression, see Figure 26).
| Year | Countries | Model | OR | p‐value | 95% CI |
|---|---|---|---|---|---|
| 2019 | AT, BE, BG, CY, CZ, DE, DK, EE, EL, ES, FI, FR, HR, HU, IE, IS, IT, LT, LU, LV, MT, NL, NO, PL, PT, RO, SE, SI, SK (n = 29) | log | 1.55 | < 0.001 | 1.38–1.75 |
| 2020 | AT, BE, BG, CY, CZ, DE, DK, EE, EL, ES, FI, FR, HR, HU, IE, IS, IT, LT, LU, LV, MT, NL, NO, PL, PT, RO, SE, SI, SK (n = 29) | Log | 1.57 | < 0.001 | 1.41–1.75 |
| 2021 | AT, BE, BG, CY, CZ, DE, DK, EE, EL, ES, FI, FR, HR, HU, IE, IS, IT, LT, LU, LV, MT, NL, NO, PL, PT, RO, SE, SI, SK (n = 29) | Log | 1.58 | < 0.001 | 1.42–1.74 |
Abbreviations: CI, confidence interval; OR, odds ratio.
Note: OR varies from 0 to infinity. When OR equals 1 or CI includes 1, the association is not considered statistically significant.
FIGURE 26.

Consumption of fluoroquinolones and other quinolones in humans and the probability of resistance to fluoroquinolones in Escherichia coli from humans, EU/EEA, 2019–2021 (see Table 20). The figure displays results of logistic regression analyses. Bubbles represent the countries included in the analysis. The size of the bubbles indicates the amount of available resistance data per country.
7.2.2. Campylobacter jejuni
A statistically significant positive association was reported between the consumption of fluoroquinolones and other quinolones in humans and resistance to fluoroquinolones in C. jejuni isolates from humans for 2020 and 2021 but not for 2019 (Table 21, Figure 27). One outlier was identified for 2019 and when it was excluded, the association was significant (p = 0.008).
TABLE 21.
Consumption of fluoroquinolones and other quinolones in humans, expressed as DDD per 1000 inhabitants per day, and the probability of resistance to fluoroquinolones in Campylobacter jejuni from humans, EU/EEA, 2019–2021 (logistic regression, see Figure 27).
| Year | Countries | Model | OR | p‐value | 95% CI |
|---|---|---|---|---|---|
| 2019 | AT, BG, CY, DK, EE, ES, FI, FR, IS, IT, LT, LU, MT, NL, NO, PL, PT, RO, SI, SK (n = 20) | log | 1.35 | 0.172 | 0.88–2.08 |
| 2020 | AT, CY, DK, EE, ES, FI, FR, IE, IS, IT, LU, MT, NL, NO, PL, PT, SE, SI, SK (n = 19) | log | 3.57 | < 0.001 | 2.07–6.15 |
| 2021 | AT, BG, CY, DE, DK, EE, ES, FI, FR, HU, IE, IS, IT, LT, LU, MT, NL, NO, PL, PT, RO, SE, SI, SK (n = 24) | log | 1.91 | 0.013 | 1.15–3.18 |
Abbreviations: CI, confidence interval; OR, odds ratio.
Note: OR varies from 0 to infinity. When OR equals 1 and CI includes 1, the association is not considered statistically significant.
FIGURE 27.

Consumption of fluoroquinolones and other quinolones in humans and the probability of resistance to fluoroquinolones in Campylobacter jejuni from humans, EU/EEA, 2019–2021 (see Table 21). Bubbles represent the countries included in the analysis. The size of the bubbles indicates the amount of resistance data available per country.
7.2.3. Campylobacter coli
A statistically significant positive association was reported between the consumption of fluoroquinolones and other quinolones in humans and resistance to fluoroquinolones in C. coli isolates from humans only for 2021 but not for 2019 and 2020 (Table 22, Figure 28). Three outliers were observed for 2021 and when excluding them one by one, the association became non‐significant.
TABLE 22.
Consumption of fluoroquinolones and other quinolones in humans, expressed as DDD per 1000 inhabitants per day, and the probability of resistance to fluoroquinolones in Campylobacter coli from humans, EU/EEA, 2019–2021 (logistic regression, see Figure 28).
| Year | Countries | Model | OR | p‐value | 95% CI |
|---|---|---|---|---|---|
| 2019 | AT, BG, CY, EE, ES, FI, FR, IS, IT, LT, LU, MT, NL, NO, PL, PT, RO, SI, SK (n = 19) | log | 0.81 | 0.341 | 0.53–1.25 |
| 2020 | AT, CY, EE, ES, FI, FR, IS, IT, LU, MT, NL, NO, PL, PT, SE, SI, SK (n = 17) | log | 1.20 | 0.489 | 0.72–1.98 |
| 2021 | AT, CY, DE, DK, EE, ES, FI, FR, HU, IE, IS, IT, LT, LU, MT, NL, NO, PL, PT, SE, SI, SK (n = 22) | log | 1.84 | 0.013 | 1.14–2.99 |
Abbreviations: CI, confidence interval; OR, odds ratio.
Notes: OR varies from 0 to infinity. When OR equals 1 and CI includes 1, the association is not considered statistically significant.
FIGURE 28.

Consumption of fluoroquinolones and other quinolones in humans and the probability of resistance to fluoroquinolones in Campylobacter coli from humans, EU/EEA, 2019–2021 (see Table 22). Bubbles represent the countries included in the analysis. The size of the bubbles indicates the amount of resistance data available per country.
7.3. Consumption in food‐producing animals and resistance in bacteria from food‐producing animals (univariate analysis)
7.3.1. Escherichia coli from food‐producing animals
To investigate possible relationships between the consumption of fluoroquinolones and other quinolones in food‐producing animals and fluoroquinolone resistance in bacteria from food‐producing animals, the SIMR to ciprofloxacin in E. coli was compared with the consumption of fluoroquinolones and other quinolones in food‐producing animals (expressed in mg per kg of estimated biomass) for the 2‐year intervals 2018–2019, 2019–2020 and 2020–2021 (mean consumption over the respective years) at the national level. The category ‘food‐producing animals’ includes resistance data on broilers, turkeys, pigs and calves for all time intervals.
Statistically significant positive associations between ciprofloxacin resistance in indicator E. coli, and fluoroquinolones and other quinolones consumption in food‐producing animals were observed for all time intervals (Table 23, Figure 29).
TABLE 23.
Consumption of fluoroquinolones and other quinolones in food‐producing animals, expressed in mg/kg of estimated biomass/year, and the probability of resistance to fluoroquinolones in indicator Escherichia coli from food‐producing animals, EU/EEA, 2018–2021 (logistic regression, see Figure 29).
| Year | Country | Model | OR | p‐value | 95% CI |
|---|---|---|---|---|---|
| 2018–2019 | AT, BE, BG, CY, CZ, DE, DK, EE, EL, ES, FI, FR, HR, HU, IE, IS, IT, LT, LV, MT, NL, NO, PL, PT, RO, SE, SI, SK (n = 28) | log | 1.59 | < 0.001 | 1.39–1.82 |
| 2019–2020 | AT, BE, BG, CY, CZ, DE, DK, EE, EL, ES, FI, FR, HR, HU, IE, IS, IT, LT, LU, LV, MT, NL, NO, PL, PT, RO, SE, SI, SK (n = 29) | log | 1.53 | < 0.001 | 1.35–1.73 |
| 2020–2021 | AT, BE, BG, CY, CZ, DE, DK, EE, EL, ES, FI, FR, HR, HU, IE, IS, IT, LT, LU, LV, MT, NL, NO, PL, PT, RO, SE, SI, SK (n = 29) | log | 1.45 | < 0.001 | 1.28–1.65 |
Abbreviations: CI, confidence interval; OR, odds ratio.
Note: OR varies from 0 to infinity. When OR equals 1 and CI includes 1, the association is not considered statistically significant. The category ‘food‐producing animals’ includes broilers, turkeys, pigs and calves.
FIGURE 29.

Consumption of fluoroquinolones and other quinolones in food‐producing animals and the probability of resistance to ciprofloxacin in indicator Escherichia coli from food‐producing animals, EU/EEA, 2019–2021 (see Table 23). The figure displays curves of logistic regression models. Bubbles represent the countries included in the analysis. The size of the bubbles indicates the amount of available resistance data per country. The category ‘food‐producing animals’ includes broilers, turkeys, pigs and calves. The category ‘quinolones’ includes both fluoroquinolones and other quinolones.
7.3.2. Escherichia coli and Campylobacter jejuni from poultry
The estimated consumption of fluoroquinolones and other quinolones in poultry, expressed as DDDvet/kg of estimated biomass, was compared with the poultry SIMR to ciprofloxacin in E. coli and C. jejuni from poultry (i.e. broilers and turkeys) in 2020. Statistically significant positive associations were found between the consumption of fluoroquinolones and other quinolones and resistance to ciprofloxacin in both indicator E. coli and C. jejuni (Table 24, Figure 30).
TABLE 24.
Consumption of fluoroquinolones and other quinolones in poultry, expressed as DDDvet/kg of estimated biomass/year, and the probability of resistance to fluoroquinolones in bacteria from poultry in 2020, EU/EEA (logistic regression, see Figure 30).
| Bacteria | Countries | Model | OR | p‐value | 95% CI |
|---|---|---|---|---|---|
| E. coli | AT, BE, BG, CH, CY, CZ, DE, DK, EE, EL, ES, FI, FR, HR, HU, IE, IS, IT, LT, LU, LV, MT, NL, NO, PL, PT, RO, SE, SI, SK (n = 30) | log | 1.34 | < 0.001 | 1.22–1.47 |
| C. jejuni | AT, BE, BG, CH, CY, CZ, DE, DK, EE, EL, ES, FI, FR, HR, HU, IE, IT, LT, LU, LV, MT, NL, NO, PL, PT, RO, SE, SI, SK (n = 29) | log | 1.35 | < 0.001 | 1.20–1.52 |
Abbreviations: CI, confidence interval; OR, odds ratio.
Note: OR varies from 0 to infinity. When OR equals 1 and CI includes 1, the association is not considered statistically significant.
FIGURE 30.

Consumption of fluoroquinolones and other quinolones in poultry, and the probability of resistance to ciprofloxacin in indicator Escherichia coli and Campylobacter jejuni from poultry in 2020, EU/EEA (see Table 24). The figure displays curves of logistic regression models. Bubbles represent the countries included in the analysis. The size of the bubbles indicates the amount of available resistance data per country. The category ‘quinolones’ includes both fluoroquinolones and other quinolones.
7.3.3. Escherichia coli and Campylobacter coli from pigs
The estimated consumption of fluoroquinolones and other quinolones in pigs (expressed as DDDvet/kg of estimated biomass) was compared with the occurrence of resistance to ciprofloxacin in indicator E. coli from slaughter pigs in 2019 and 2021 and C. coli in 2021.
Statistically significant positive associations were found for all analysed combinations (Table 25, Figure 31).
TABLE 25.
Consumption of fluoroquinolones and other quinolones in pigs, expressed as DDDvet/kg of estimated biomass/year, and the probability of resistance to fluoroquinolones in bacteria from slaughter pigs in 2019 and 2021, EU/EEA (logistic regression, see Figure 31).
| Bacteria | Year | Countries | Model | OR | p‐value | 95% CI |
|---|---|---|---|---|---|---|
| E. coli | 2019 | AT, BE, BG, CH, CY, CZ, DE, DK, EE, EL, ES, FI, FR, HR, HU, IE, IS, IT, LT, LU, LV, MT, NL, NO, PL, PT, RO, SE, SI, SK (n = 30) | log | 1.59 | < 0.001 | 1.34–1.89 |
| E. coli | 2021 | AT, BE, BG, CH, CY, CZ, DE, DK, EE, EL, ES, FI, FR, HR, HU, IE, IS, IT, LT, LU, LV, MT, NL, NO, PL, PT, RO, SE, SI, SK (n = 30) | log | 1.68 | < 0.001 | 1.36–2.06 |
| C. coli | 2021 | AT, BE, BG, CH, CY, DE, DK, EE, EL, ES, FI, FR, HR, HU, IE, IS, IT, LT, LU, LV, MT, NL, NO, PL, PT, RO, SE, SI, SK (n = 29) | log | 1.21 | < 0.001 | 1.11–1.33 |
Abbreviations: CI, confidence interval; OR, odds ratio.
Note: OR varies from 0 to infinity. When OR equals 1 and CI includes 1, the association is not considered statistically significant.
FIGURE 31.
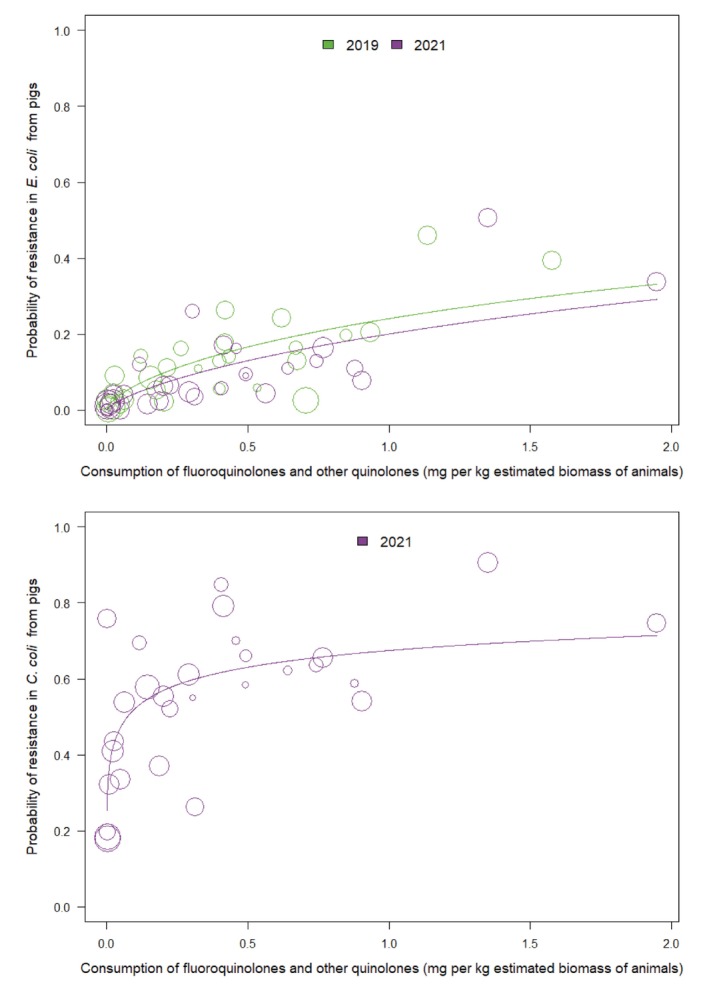
Consumption of all quinolones in pigs and the probability of resistance to ciprofloxacin in indicator Escherichia coli from slaughter pigs in 2019 and 2021, and Campylobacter coli from slaughter pigs in 2021, EU/EEA (see Table 25). The figure displays results of logistic regression analyses. Bubbles represent the countries included in the analysis. The size of the bubbles indicates the amount of available resistance data per country.
7.4. Resistance in bacteria from humans and in food‐producing animals (univariate analysis)
7.4.1. Escherichia coli from humans and from food‐producing animals
Data on the occurrence of resistance to fluoroquinolones in invasive E. coli isolated from humans (2019–2021) were compared with the occurrence of resistance to fluoroquinolones in indicator E. coli isolates from broilers and turkeys (2020) and from pigs and calves (2019 and 2021).
A statistically significant positive association was found between resistance of fluoroquinolones in indicator E. coli from broilers, turkeys, pigs and calves and fluoroquinolone resistance of invasive E. coli from humans for all years tested (Table 26, Figure 32). For 2020 and turkeys, there was one outlier. Removal of this outlier turned the association borderline significant. For 2021 and calves, there were two outliers and when removing them individually, the association turned non‐significant.
TABLE 26.
Probability of resistance to fluoroquinolones in Escherichia coli from humans and food‐producing animals, EU/EEA, 2019–2021 (logistic regression, see Figure 32).
| FPA | Year | Countries | Model | OR | p‐value | 95% CI |
|---|---|---|---|---|---|---|
| Pigs | 2019 | AT, BE, BG, CY, CZ, DE, DK, EE, EL, ES, FI, FR, HR, HU, IE, IS, IT, LT, LU, LV, MT, NL, NO, PL, PT, RO, SE, SI, SK (n = 29) | log | 1.19 | < 0.001 | 1.10–1.29 |
| 2021 | AT, BE, BG, CY, CZ, DE, DK, EE, EL, ES, FI, FR, HR, HU, IE, IS, IT, LT, LU, LV, MT, NL, NO, PL, PT, RO, SE, SI, SK (n = 29) | log | 1.20 | < 0.001 | 1.11–1.30 | |
| Calves | 2019 | BE, DE, DK, ES, FR, HR, IT, NL, NO, PT (n = 10) | log | 1.17 | 0.003 | 1.06–1.30 |
| 2021 | BE, DE, DK, ES, FR, HR, IT, NL, NO, PT, RO, SE (n = 12) | log | 1.13 | 0.028 | 1.01–1.26 | |
| Broilers | 2020 | AT, BE, BG, CY, CZ, DE, DK, EE, EL, ES, FI, FR, HR, HU, IE, IS, IT, LT, LU, LV, MT, NL, NO, PL, PT, RO, SE, SI, SK (n = 29) | Linear | 3.32 | < 0.001 | 1.89–5.82 |
| Turkeys | 2020 | AT, BE, DE, ES, FR, HU, IT, NO, PL, PT, RO, SE (n = 12) | log | 1.27 | 0.011 | 1.06–1.53 |
Abbreviations: CI, confidence interval; FPA, food‐producing animals; OR, odds ratio.
Note: OR varies from 0 to infinity. When OR equals 1 and CI includes 1, the association is not considered statistically significant.
FIGURE 32.

Probability of resistance to fluoroquinolones in Escherichia coli from humans and pigs, and calves, 2019 and 2021, and broilers and turkeys, 2020 (see Table 27). The figure displays results of logistic regression analyses. Bubbles represent the countries included in the analysis. The size of the bubbles indicates the amount of available resistance data per country.
7.4.2. Campylobacter jejuni from humans and food‐producing animals
A statistically significant positive association was found between fluoroquinolone resistance in C. jejuni from turkeys and fluoroquinolone resistance of C. jejuni from humans for 2020.
No statistically significant association was found between fluoroquinolone resistance in C. jejuni both from broilers and fluoroquinolone resistance of C. jejuni from humans for 2020. (Table 27, Figure 33).
TABLE 27.
Probability of resistance to fluoroquinolones in Campylobacter jejuni from humans and food‐producing animals, 2020 (logistic regression, see Figure 33).
| FPA | Year | Countries | Model | OR | p‐value | 95% CI |
|---|---|---|---|---|---|---|
| Broilers | 2020 | AT, CY, DK, EE, ES, FI, FR, IE, IT, LU, MT, NL, NO, PL, PT, SE, SI, SK (n = 18) | log | 1.13 | 0.211 | 0.93–1.37 |
| Turkeys | 2020 | AT, ES, FR, IT, NO, PL, PT (n = 7) | log | 1.42 | 0.001 | 1.14–1.75 |
Abbreviations: CI, confidence interval; FPA, food‐producing animals; OR, odds ratio.
Note: OR varies from 0 to infinity. When OR equals 1 and CI includes 1, the association is not considered statistically significant.
FIGURE 33.

Probability of resistance to fluoroquinolones in Campylobacter jejuni from humans and turkeys, EU/EEA, 2020 (see Table 27). The figure displays results of logistic regression analyses. Bubbles represent the countries included in the analysis. The size of the bubbles indicates the amount of available resistance data per country.
For turkeys, there was one outlier (among seven countries included in total). Removal of this outlier turned the association non‐significant, but the number of countries included was low (n = 7).
7.4.3. Campylobacter coli from humans and food‐producing animals
No statistically significant association was observed between fluoroquinolone resistance in C. coli from pigs and fluoroquinolone resistance of C. coli from humans for 2021 (Table 28). One outlier was identified and when removing it, the association became statistically significant.
TABLE 28.
Probability of resistance to fluoroquinolones in Campylobacter coli from humans and from pigs, EU/EEA, 2021 (logistic regression).
| Year | Countries | Model | OR | p‐value | 95% CI |
|---|---|---|---|---|---|
| 2021 | AT, CY, DE, DK, EE, ES, FI, FR, HU, IE, IS, IT, LT, LU, MT, NL, NO, PL, PT, SE, SI, SK (n = 22) | Quadratic | 4.75 | 0.126 | 0.65–34.99 |
Abbreviations: CI, confidence interval; OR, odds ratio.
Note: OR varies from 0 to infinity. When OR equals 1 and CI includes 1, the association is not considered statistically significant.
7.5. Consumption in food‐producing animals and resistance in bacteria from humans (univariate analysis)
To investigate possible relationships between the consumption of fluoroquinolones or other quinolones in food‐producing animals and fluoroquinolone resistance in bacteria causing infections in humans, the occurrence of resistance in invasive E. coli, C. jejuni and C. coli from humans was compared with the total consumption of fluoroquinolones and quinolones (milligrams per kilogram of estimated biomass) in food‐producing animals for 2019, 2020 and 2021 by country.
7.5.1. Escherichia coli
A statistically significant positive association was reported between fluoroquinolones and other quinolones consumption in food‐producing animals and fluoroquinolone resistance in invasive E. coli isolates from humans for all the years (Table 29, Figure 34).
TABLE 29.
Consumption of fluoroquinolones and other quinolones in food‐producing animals, expressed in mg/kg estimated biomass, and the probability of resistance to fluoroquinolones in Escherichia coli from humans, EU/EEA, 2019–2021 (logistic regression, see Figure 34).
| Year | Countries | Model | OR | p‐value | 95% CI |
|---|---|---|---|---|---|
| 2019 | AT, BE, BG, CY, CZ, DE, DK, EE, EL, ES, FI, FR, HR, HU, IE, IS, IT, LT, LU, LV, MT, NL, NO, PL, PT, RO, SE, SI, SK (n = 29) | log | 1.17 | < 0.001 | 1.11–1.24 |
| 2020 | AT, BE, BG, CY, CZ, DE, DK, EE, EL, ES, FI, FR, HR, HU, IE, IS, IT, LT, LU, LV, MT, NL, NO, PL, PT, RO, SE, SI, SK (n = 29) | log | 1.19 | < 0.001 | 1.11–1.27 |
| 2021 | AT, BE, BG, CY, CZ, DE, DK, EE, EL, ES, FI, FR, HR, HU, IE, IS, IT, LT, LU, LV, MT, NL, NO, PL, PT, RO, SE, SI, SK (n = 29) | log | 1.17 | < 0.001 | 1.09–1.25 |
Abbreviations: CI, confidence interval; OR, odds ratio.
Note: OR varies from 0 to infinity. When OR equals 1 and CI includes 1, the association is not considered statistically significant.
FIGURE 34.

Consumption of fluoroquinolones and other quinolones in food‐producing animals and the probability of resistance to fluoroquinolones in Escherichia coli from humans, EU/EEA, 2019–2021 (see Table 29). The figure displays results of logistic regression analyses. Bubbles represent the countries included in the analysis. The size of the bubbles indicates the amount of available resistance data per country.
7.5.2. Campylobacter jejuni
A statistically significant positive association was reported between the total consumption of fluoroquinolones and other quinolones in food‐producing animals and fluoroquinolone resistance in C. jejuni isolates from humans for 2019, 2020 and 2021 (Table 30 and Figure 35). For 2019, two outliers were identified and when they were individually removed, the association became borderline significant.
TABLE 30.
Consumption of fluoroquinolones and other quinolones in food‐producing animals, expressed in mg/kg estimated biomass, and the probability of resistance to fluoroquinolones in Campylobacter jejuni from humans, EU/EEA, 2019–2021 (logistic regression, see Figure 35).
| Year | Countries | Model | OR | p‐value | 95% CI |
|---|---|---|---|---|---|
| 2019 | AT, BG, CY, DK, EE, ES, FI, FR, IS, IT, LT, LU, MT, NL, NO, PL, PT, RO, SI, SK (n = 20) | log | 1.18 | 0.016 | 1.03–1.36 |
| 2020 | AT, CY, DK, EE, ES, FI, FR, IE, IS, IT, LU, MT, NL, NO, PL, PT, SE, SI, SK (n = 19) | log | 1.62 | < 0.001 | 1.36–1.92 |
| 2021 | AT, BG, CY, DE, DK, EE, ES, FI, FR, HU, IE, IS, IT, LT, LU, MT, NL, NO, PL, PT, RO, SE, SI, SK (n = 24) | log | 1.48 | < 0.001 | 1.26–1.74 |
Abbreviations: CI, confidence interval; OR, odds ratio.
Note: OR varies from 0 to infinity. When OR equals 1 and CI includes 1, the association is not considered statistically significant.
FIGURE 35.
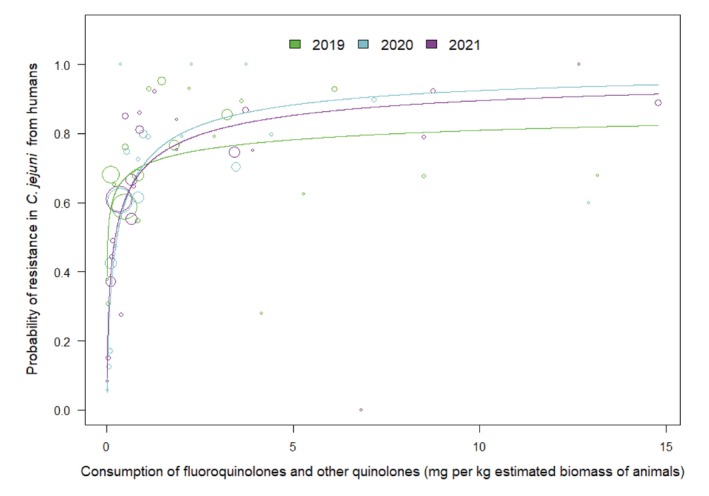
Consumption of fluoroquinolones and other quinolones in food‐producing animals and the probability of resistance to fluoroquinolones in Campylobacter jejuni from humans, EU/EEA, 2019–2021 (see Table 30). The figure displays results of logistic regression analyses. Bubbles represent the countries included in the analysis. The size of the bubbles indicates the amount of available resistance data per country.
7.5.3. Campylobacter coli
A statistically significant positive association was observed between the total consumption of fluoroquinolones and other quinolones in food‐producing animals and fluoroquinolone resistance in C. coli isolates from humans in 2021 but not in 2019 and 2020 (Table 31, Figure 36). One outlier was identified for 2020 and when removed, the association became significant.
TABLE 31.
Consumption of fluoroquinolones and other quinolones in food‐producing animals, expressed in mg/kg estimated biomass, and the probability of resistance to fluoroquinolones in Campylobacter coli from humans, EU/EEA, 2019–2021 (logistic regression, see Figure 36).
| Year | Countries | Model | OR | p‐value | 95% CI |
|---|---|---|---|---|---|
| 2019 | AT, BG, CY, EE, ES, FI, FR, IS, IT, LT, LU, MT, NL, NO, PL, PT, RO, SI, SK (n = 19) | log | 1.06 | 0.491 | 0.90–1.26 |
| 2020 | AT, CY, EE, ES, FI, FR, IS, IT, LU, MT, NL, NO, PL, PT, SE, SI, SK (n = 17) | log | 1.11 | 0.199 | 0.95–1.29 |
| 2021 | AT, CY, DE, DK, EE, ES, FI, FR, HU, IE, IS, IT, LT, LU, MT, NL, NO, PL, PT, SE, SI, SK (n = 22) | log | 1.27 | 0.010 | 1.06–1.52 |
Abbreviations: CI, confidence interval; OR, odds ratio.
Note: OR varies from 0 to infinity. When OR equals 1 and CI includes 1, the association is not considered statistically significant.
FIGURE 36.

Consumption of fluoroquinolones and other quinolones in food‐producing animals and the probability of resistance to fluoroquinolones in Campylobacter coli from humans, EU/EEA, 2019–2021 (see Table 31). The figure displays results of logistic regression analyses. Bubbles represent the countries included in the analysis. The size of the bubbles indicates the amount of available resistance data per country.
7.6. Multivariate analysis
7.6.1. Escherichia coli
As reported in the univariate analysis, in both humans and food‐producing animals, the consumption of fluoroquinolones and other quinolones was significantly related to resistance in invasive E. coli from humans and resistance in commensal E. coli, respectively (Figure 37).
FIGURE 37.

Diagram of the PLS‐PM of resistance to fluoroquinolones in human invasive Escherichia coli (2020 and 2021), considering resistance to fluoroquinolones in indicator Escherichia coli from food‐producing animals (poultry in 2020 and pigs in 2021) and consumption of fluoroquinolones and other quinolones in humans (2020–2021 mean, expressed as DDD per 1000 inhabitants and per day), and in food‐producing animals (poultry in 2020 and pigs in 2021, expressed as DDDvet/kg of estimated biomass). 27 countries: AT, BE, BG, CY, CZ, DE*, DK, EE, EL, ES, FI, FR, HR, HU, IE, IS, IT, LT, LV, NL, NO, PL, PT, RO, SE, SI, SK. *For Germany, data on human consumption in the hospital sector were not available, and hospital consumption was estimated from the proportion reported by the other countries for the same year. (Goodness‐of‐fit = 0.732).
According to the R 2, 70% ([0.54–0.93]) of the variance of resistance in food‐producing animals is explained by the corresponding latent variable: fluoroquinolones and other quinolones consumption in food‐producing animals, while 64% ([0.42–0.84]) of the variance of resistance in humans is explained by the latent variable fluoroquinolones and other quinolones consumption in humans.
7.6.2. Campylobacter jejuni
Given the limited data available on resistance in C. jejuni from pigs, the model only included data on consumption and resistance in C. jejuni from poultry, so 20 countries were involved in the model (Figure 38). According to R 2, 89% [79%–96%] of the variance of resistance in humans is explained by resistance in food‐producing animals where, conversely variance is poorly explained by consumption of fluoroquinolones and quinolones in food‐producing animals (R 2 = 0.28 [0.15–0.49]). Consumption of fluoroquinolones and other quinolones in humans was a non‐significant latent variable in the model.
FIGURE 38.

Diagram of the PLS‐PM model of resistance to fluoroquinolones in Campylobacter jejuni in humans (in 2020 and 2021), considering resistance to fluoroquinolones in C. jejuni from food‐producing animals (poultry in 2020) and consumption of fluoroquinolones and other quinolones in humans (expressed as DDD per 1000 inhabitants per day for 2020 and 2021) in food‐producing animals (poultry in 2020, expressed as DDDvet/kg of estimated biomass). 20 countries: AT, BG, CY, DE*, DK, EE, ES, FI, FR, HU, IE, IT, LT, NL, NO, PL, PT, SE, SI, SK. *For Germany, data on human consumption in the hospital sector were not available, and hospital consumption was estimated from the proportion reported by the other countries for the same year.
7.6.3. Campylobacter coli
The model only included data on consumption and resistance in C. coli from pigs, so 19 countries were involved in the model (Figure 39). According to R 2, only 40% [9%–69%] of the variance of resistance in pigs is explained by consumption of fluoroquinolones and quinolones in food‐producing animals. The path between resistance in humans and food‐producing animals was borderline significant (p = 0.06).
FIGURE 39.

Diagram of the PLS‐PM model of resistance to fluoroquinolones in Campylobacter coli in humans (in 2020 and 2021), considering resistance to fluoroquinolones in C. coli from food‐producing animals (pigs in 2021) and consumption of fluoroquinolones and other quinolones in humans (expressed as DDD per 1000 inhabitants per day for 2020 and 2021) in food‐producing animals (pigs in 2021, expressed as DDDvet/kg of estimated biomass). 19 countries: AT, CY, DE*, DK, EE, ES, FI, FR, HU, IE, IT, LT, LU, MT, NL, PT, SE, SI, SK. *For Germany, data on human consumption in the hospital sector were not available, and hospital consumption was estimated from the proportion reported by the other countries for the same year.
7.7. Trends in consumption and resistance from 2014 to 2021
Consumption of fluoroquinolones in humans decreased in 18 countries between 2014 and 2021 (Figure 40). There was no significant increase in consumption in any country. AMR in invasive E. coli from humans to fluoroquinolones decreased more often than it increased (9 vs. 4). A concurrent decrease of both was seen in eight countries, a concurrent increase of both was not observed.
FIGURE 40.

Comparison of annual changes in consumption of fluoroquinolones and other quinolones in humans and resistance to fluoroquinolones in Escherichia coli from humans between 2014 and 2021 by EU/EEA country. White zone, statistical difference in both the change in consumption and the change in resistance; dotted grey zone, non‐statistically significant difference in the change in consumption; grey zone, non‐statistically significant difference in the change in resistance.
In food‐producing animals, there was a decrease in consumption of fluoroquinolones and other quinolones in 13 countries between 2014 and 2021, while there was an increase in only one country (from very low levels to levels still < 0.2 mg/kg) (Figure 41). AMR in bacteria from food‐producing animals decreased more often than it increased (8 vs. 2). A decrease in both was seen in four countries, while a concurrent increase of both was not observed.
FIGURE 41.

Comparison of annual changes in consumption of fluoroquinolones and other quinolones in food‐producing animals and resistance to ciprofloxacin in Escherichia coli from food‐producing animals between 2014 and 2021 by EU/EEA country. White zone, statistical difference in both the change in consumption and the change in resistance; dotted grey zone, non‐statistically significant difference in the change in consumption; grey zone, non‐statistically significant difference in the change in resistance.
It has to be considered that in countries with low levels of consumption and/or resistance at the beginning of the observation period, a significant decrease in consumption and/or resistance was likely not possible. In those countries, conserving the low levels has to be considered as a success.
8. POLYMYXINS
Polymyxins – mainly colistin in parenteral form – have been used in hospitals in humans as last‐resort antimicrobials to treat infections caused by MDR Gram‐negative bacteria that are resistant to carbapenems.
In WHO's AWaRe classification, polymyxins belong to the ‘Reserve’ group of antimicrobials (WHO, 2021). Polymyxins are considered by WHO as HPCIA in human medicine (WHO, 2019).
This group has also been categorised as VHIA in the WOAH list of antimicrobials of veterinary importance (WOAH, 2021).
According to EMA's AMEG categorisation, polymyxins belong to Category B with the designation to ‘Restrict’ use in veterinary medicine in the EU (AMEG, 2019). This means that the risk to public health resulting from veterinary use needs to be mitigated by specific restrictions. Polymyxins should only be used for the treatment of clinical conditions in food‐producing animals when there are no antimicrobials in Categories C (‘Caution’) or D (‘Prudence’) that could be clinically effective.
As the availability of data on the susceptibility of human E. coli isolates to colistin was limited in the data sources used for this report, no investigation of the related associations or multivariate analyses have been performed.
8.1. Consumption in humans and food‐producing animals by country
In 2021, the EU/EEA overall population‐weighted mean consumption of polymyxins in humans and food‐producing animals were 0.7 and 2.5 mg/kg of estimated biomass, respectively. The corresponding ranges were 0.0–3.7 (median 0.4) mg/kg in humans and 0.0–12.7 (median 0.5) mg/kg in food‐producing animals. The population‐corrected consumption of polymyxins in humans and food‐producing animals by country is shown in Figure 42.
FIGURE 42.

Population biomass‐corrected consumption of polymyxins in humans and food‐producing animals in 29 EU/EEA countries for which data were available both for humans and food‐producing animals, 2021. *For Germany, only community consumption was provided for human medicine. Germany's human consumption data were therefore not included in the weighted mean, as only countries providing total consumption (community and hospital sectors combined) were considered for the population‐weighted mean consumption value. Note: The estimates presented are crude and must be interpreted with caution. For limitations hampering comparison of antimicrobial consumption in humans and food‐producing animals, see Section 15.12. aFor antimicrobial agents included (ATC and ATCvet codes), please refer to Section 3.2. The absolute levels of consumption should not be directly compared between humans and animals as the calculation of the denominator differs. For details see text box under Figure 8.
The consumption of polymyxins in food‐producing animals has declined substantially between 2014 and 2021 (p = 0.001), whereas it has increased in the human sector (p < 0.001). The decline in consumption in food‐producing animals has been particularly marked in some high‐using countries (Figure 43), although there was still wide variation between countries in the quantities of polymyxins consumed in 2021 (Figure 42). There was no consumption in food‐producing animals in Finland, Iceland and Norway over the period 2019–2021, and in Denmark and Ireland in 2021. There was a significant association within country between consumption of polymyxins in humans and consumption in food‐producing animals (Spearman's rank correlation, rho = 0.49, p = 0.008); although in 2021, with the exception of Cyprus, the four highest consuming countries in veterinary medicine (CY, HU, PL, PT) were not the same as the four highest consuming countries in human medicine (CY, EL, ES, SK).
FIGURE 43.

Trend graph of population biomass‐corrected consumption of polymyxins(a) for humans and food‐producing animals in EU/EEA countries(b), mg/kg of estimated biomass, 2014–2021. aFor antimicrobial groups included in overall consumption data (ATC and ATCvet codes), please refer to Section 3.2. bThe countries involved in the analysis may slightly vary between years; consequently, a trend line was not generated, and the specific country names are not listed in this context. The absolute levels of consumption should not be directly compared between humans and animals as the calculation of the denominator differs. For details see text box under Figure 8. In the box plots, the lowest boundary indicates the 25th percentile, the black horizontal line within the box marks the median and the upper boundary of the box indicates the 75th percentile. The vertical extending lines denote the most extreme values within 1.5 interquartile range of the 25th and 75th percentile of each group. Only outlying observations (outside of this range) are represented as dots.
8.2. Resistance in bacteria from humans (univariate analysis)
The distribution of polymyxin resistance in isolates originating from humans is difficult to assess through EARS‐Net as susceptibility testing is generally not part of the initial routine antimicrobial susceptibility test panel and is mostly performed at the reference laboratory level following the referral of MDR isolates. Hence data on resistance to polymyxins in human isolates are not included in this report.
8.3. Consumption in food‐producing animals and resistance in bacteria from food‐producing animals (univariate analysis)
8.3.1. Escherichia coli from food‐producing animals
In order to investigate possible relationships between the consumption of polymyxins and colistin resistance, the SIMR to colistin in E. coli from food‐producing animals was compared with the consumption of polymyxins in food‐producing animals (expressed in mg per kg of estimated biomass) for the 2‐year intervals 2018–2019, 2019–2020 and 2020–2021 (mean consumption over the respective years) at the national level (Table 32 and Figure 44). The category ‘food‐producing animals’ includes broilers, turkeys, pigs and calves at slaughter for all time intervals.
TABLE 32.
Consumption of polymyxins in food‐producing animals, expressed in mg/kg of estimated biomass, and the probability of resistance to polymyxins in indicator Escherichia coli from food‐producing animals, EU/EEA, 2018–2021 (logistic regression, see Figure 44).
| Period | Countries | Model | OR | p‐value | 95% CI |
|---|---|---|---|---|---|
| 2018–2019 | AT, BE, BG, CY, CZ, DE, DK, EE, EL, ES, FI, FR, HR, HU, IE, IS, IT, LT, LV, MT, NL, NO, PL, PT, RO, SE, SI, SK (n = 28) | log | 1.97 | < 0.001 | 1.40–2.27 |
| 2019–2020 | AT, BE, BG, CY, CZ, DE, DK, EE, EL, ES, FI, FR, HR, HU, IE, IS, IT, LT, LU, LV, MT, NL, NO, PL, PT, RO, SE, SI, SK (n = 29) | log | 1.90 | < 0.001 | 1.52–2.38 |
| 2020–2021 | AT, BE, BG, CY, CZ, DE, DK, EE, EL, ES, FI, FR, HR, HU, IE, IS, IT, LT, LU, LV, MT, NL, NO, PL, PT, RO, SE, SI, SK (n = 29) | log | 1.31 | 0.094 | 0.96–1.80 |
Abbreviations: CI, confidence interval; OR, odds ratio.
Note: OR varies from 0 to infinity. When OR equals 1 and CI includes 1, the association is not considered statistically significant.
FIGURE 44.

Consumption of polymyxins in food‐producing animals and the probability of resistance to colistin in indicator Escherichia coli from food‐producing animals, EU/EEA, 2019–2021 (see Table 32). The figure displays results of logistic regression analyses. Bubbles represent the countries included in the analysis. The size of the bubbles indicates the amount of available resistance data per country. A solid trend line indicates significance at a 5% level, whereas a dashed trend line represents significance at a 10% level.
In the EU overall, resistance to colistin in indicator E. coli from food‐producing animals remains at very low/low levels. In 2020–2021, most countries did not detect colistin resistance in E. coli from any animal species, although varying levels of resistance were reported in some countries. Over the period investigated, consumption of polymyxins in individual countries ranged from zero up to nearly 13 mg/kg of estimated biomass.
Statistically significant positive associations between colistin resistance in indicator E. coli and polymyxin consumption in food‐producing animals were observed in 2018–2019 and 2019–2020, as also noted for all preceding JIACRA analyses. Although the association appeared as borderline significant for the period 2020–2021, the removal of one outlying country made the relationship become statistically significant (p‐value < 0.001).
8.3.2. Indicator Escherichia coli from pigs and poultry
The estimated consumptions of polymyxins in pigs and poultry were compared with the occurrence of resistance to colistin in indicator E. coli from slaughter pigs for 2019 and 2021 and from poultry (broilers and turkeys) for 2020.
Most countries did not detect resistance in E. coli from pigs at all. Where detected, colistin resistance in indicator E. coli from pigs was typically reported at very low/low levels. A significant association was shown between consumption of polymyxins and resistance to colistin in indicator E. coli in pigs in 2019 but not in 2021.
In poultry, where detected, the levels of resistance observed in E. coli were generally low although slightly higher than those in pigs. A significant association was shown between consumption of polymyxins and resistance to colistin in indicator E. coli from poultry in 2020 (Table 33, Figure 45), as also identified in 2016 and 2018 in the third JIACRA report (ECDC, EFSA and EMA, 2021).
TABLE 33.
Consumption of polymyxins in pigs and poultry, expressed as DDDvet/kg of estimated biomass/year, and the probability of resistance to polymyxins in indicator Escherichia coli isolates from slaughter pigs for 2019 and 2020 and poultry for 2020, respectively, EU/EEA (logistic regression, see Figure 45).
| FPA | Year | Country | Model | OR | p‐value | 95% CI |
|---|---|---|---|---|---|---|
| Pigs | 2019 | AT, BE, BG, CH, CY, CZ, DE, DK, EE, EL, ES, FI, FR, HR, HU, IE, IS, IT, LT, LU, LV, MT, NL, NO, PL, PT, RO, SE, SI, SK (n = 30) | log | 2.26 | < 0.001 | 1.51–3.38 |
| 2021 | AT, BE, BG, CH, CY, CZ, DE, DK, EE, EL, ES, FI, FR, HR, HU, IE, IS, IT, LT, LU, LV, MT, NL, NO, PL, PT, RO, SE, SI, SK (n = 30) | log | 0.98 | 0.856 | 0.78–1.23 | |
| Poultry | 2020 | AT, BE, BG, CH, CY, CZ, DE, DK, EE, EL, ES, FI, FR, HR, HU, IE, IS, IT, LT, LU, LV, MT, NL, NO, PL, PT, RO, SE, SI, SK (n = 30) | log | 2.38 | < 0.001 | 1.8–3.02 |
Abbreviations: CI, confidence interval; FPA, food‐producing animals; OR, odds ratio.
Note: OR varies from 0 to infinity. When OR equals 1 and CI includes 1, the association is not considered statistically significant.
FIGURE 45.

Consumption of polymyxins in pigs and poultry and the probability of resistance to colistin in indicator Escherichia coli from slaughter pigs, 2019 and 2021, and broilers, 2020, EU/EEA (see Table 33). The figure displays results of logistic regression analyses. Bubbles represent the countries included in the analysis. The size of the bubbles indicates the amount of available resistance data per country.
8.4. Trends in consumption and resistance from 2014 to 2021
From 2014 to 2021, there was a statistically significant trend in reduction in the consumption of polymyxins in food‐producing animals in nine countries (Figure 46). In all of these countries, this was accompanied by a reduction in resistance in E. coli isolates from food‐producing animals and in three countries the trend was statistically significant. It should be noted that the levels of colistin resistance in E. coli isolates from food‐producing animals have remained low/very low in most countries over this period; therefore, a trend in reduction of resistance may not be detected. In one country, there was a significant increase in resistance in E. coli over the period, but a statistically significant increase in the consumption of polymyxins was not observed in any country.
FIGURE 46.

Comparison of annual changes in consumption of polymyxins in food‐producing animals and resistance to colistin in Escherichia coli from food‐producing animals between 2014 and 2021 by EU/EEA country. White zone, statistical difference in both the change in consumption and the change in resistance; dotted grey zone, non‐statistically significant difference in the change in consumption; grey zone, non‐statistically significant difference in the change in resistance.
9. AMINOPENICILLINS
Aminopenicillins are commonly used first‐line antimicrobial in human medicine, but alternatives are available for most of the indications. In veterinary medicine aminopenicillins are approved for use in food‐producing and companion animals for a wide range of indications.
In the recent WHO AWaRe classification, aminopenicillins belong to the ‘Access’ group of antimicrobials (WHO, 2021). Aminopenicillins are considered by WHO as ‘Critically Important Antimicrobials’ (CIA) in human medicine (WHO, 2019). This group has also been categorised as VCIA in the WOAH list of antimicrobials of veterinary importance (WOAH, 2021).
According to EMA's AMEG categorisation, aminopenicillins in combination with beta‐lactamase inhibitors belong to Category C (‘Caution’) and the aminopenicillins without beta‐lactamase inhibitors to the Category D (‘Prudence’). Compared to aminopenicillins alone, aminopenicillins with enzyme inhibitors have a wider spectrum and thereby a higher selection pressure for MDR bacteria. Aminopenicillins combined with an enzyme inhibitor are therefore in a higher AMEG category.
9.1. Consumption in humans and food‐producing animals by country
In 2021, the EU/EEA population‐weighted mean consumption of aminopenicillins in humans and food‐producing animals was 64.1 and 25.8 mg/kg of estimated biomass, respectively (Figure 47). The corresponding ranges were 6.5–101.0 (median 47.2) in humans and 0.05–59.6 (median 8.8) mg/kg in food‐producing animals, respectively. In the biomass‐corrected consumption in humans and food‐producing animals is shown by country. There was wide variation between countries in the quantities of aminopenicillins consumed in humans as well as in food‐producing animals. In humans, aminopenicillins with beta‐lactamase inhibitors were consumed more often than in food‐producing animals.
FIGURE 47.

Population biomass‐corrected consumption of aminopenicillins in humans and food‐producing animals in 29 EU/EEA countries for which data were available both for humans and food‐producing animals, 2021. *For Germany, only community consumption was provided for human medicine. Germany's human consumption data were therefore not included in the weighted mean, as only countries providing total consumption (community and hospital sectors combined) were considered for the population‐weighted mean consumption value. Note: The estimates presented are crude and must be interpreted with caution. For limitations hampering comparison of antimicrobial consumption in humans and food‐producing animals, see Section 15.12. aFor antimicrobial agents included (ATC and ATCvet codes), please refer to Section 3.2. The absolute levels of consumption should not be directly compared between humans and animals as the calculation of the denominator differs. For details see text box under Figure 8.
There was a significant association between the consumption of aminopenicillins in humans and in food‐producing animals (Spearmen's rank correlation coefficient, rho‐0.53) at the national level in 2021, although except for Spain, the three highest consuming countries in veterinary medicine (PL, IT, ES) were not the same as the three highest consuming countries in human medicine (FR, RO, ES).
The consumption of aminopenicillins in humans decreased significantly (p < 0.001) between 2014 and 2021. In food‐producing animals, consumption did not change significantly in that period (Figure 48).
FIGURE 48.

Trend graph of population biomass‐corrected consumption of aminopenicillins(a) for humans and food‐producing animals in EU/EEA countries(b), mg/kg of estimated biomass, 2014–2021. aFor antimicrobial groups included in overall consumption data (ATC and ATCvet codes), please refer to Section 3.2. bThe countries involved in the analysis may slightly vary between years; consequently, a trend line was not generated, and the specific country names are not listed in this context. The absolute levels of consumption should not be directly compared between humans and animals as the calculation of the denominator differs. For details see text box under Figure 8. In the box plots, the lowest boundary indicates the 25th percentile, the black horizontal line within the box marks the median and the upper boundary of the box indicates the 75th percentile. The vertical extending lines denote the most extreme values within 1.5 interquartile range of the 25th and 75th percentile of each group. Only outlying observations (outside of this range) are represented as dots.
9.2. Consumption in humans and resistance in bacteria from humans (univariate analysis)
9.2.1. Escherichia coli
To investigate the possible associations between the consumption of aminopenicillins and the occurrence of resistance to aminopenicillins in invasive E. coli isolates from humans, the total consumption of aminopenicillins (with and without enzyme inhibitors) in humans, expressed as DDD per 1000 inhabitants and per day, was analysed against the occurrence of aminopenicillin resistance in invasive E. coli isolates from humans, for 2019, 2020 and 2021. A statistically significant positive association was reported between the consumption of aminopenicillins and aminopenicillin resistance in invasive E. coli isolates for 2019, 2020 and 2021 (Table 34, Figure 49).
TABLE 34.
Consumption of aminopenicillins in humans, expressed as DDD per 1000 inhabitants per day, and the probability of resistance to aminopenicillins in Escherichia coli from humans, EU/EEA, 2019–2021 (logistic regression, see Figure 49).
| Year | Countries | Model | OR | p‐value | 95% CI |
|---|---|---|---|---|---|
| 2019 | AT, BE, BG, CY, CZ, DE, DK, EE, EL, ES, FI, FR, HR, HU, IE, IS, IT, LT, LU, LV, MT, NL, NO, PL, PT, RO, SI, SK (n = 28) | log | 1.27 | < 0.001 | 1.13–1.43 |
| 2020 | AT, BE, BG, CY, CZ, DE, DK, EE, EL, ES, FI, FR, HR, HU, IE, IS, IT, LT, LU, LV, MT, NL, NO, PL, PT, RO, SI, SK (n = 28) | log | 1.27 | < 0.001 | 1.15–1.39 |
| 2021 | AT, BE, BG, CY, CZ, DE, DK, EE, EL, ES, FI, FR, HR, HU, IE, IS, IT, LT, LU, LV, MT, NL, NO, PL, PT, RO, SI, SK (n = 28) | log | 1.34 | < 0.001 | 1.22–1.48 |
Abbreviations: CI, confidence interval; OR, odds ratio.
Note: OR varies from 0 to infinity. When OR equals 1 and CI includes 1, the association is not considered statistically significant.
FIGURE 49.

Consumption aminopenicillins in humans and the probability of resistance to aminopenicillins in Escherichia coli from humans, EU/EEA, 2019–2021 (see Table 34). The figure displays results of logistic regression analyses. Bubbles represent the countries included in the analysis. The size of the bubbles indicates the amount of available resistance data per country.
9.3. Consumption in food‐producing animals and resistance in bacteria from food‐producing animals (univariate analysis)
9.3.1. Escherichia coli from food‐producing animals
To investigate possible relationships between the consumption of aminopenicillins in food‐producing animals and ampicillin resistance in bacteria from food‐producing animals, the SIMR to ampicillin E. coli, was compared with the consumption of aminopenicillins in food‐producing animals (expressed in mg per kg of estimated biomass) for the 2‐year intervals 2018–2019, 2019–2020 and 2020–2021 (mean consumption over the respective years) at the national level. The category ‘food‐producing animals’ includes broilers, turkeys, pigs and calves for resistance in all time intervals.
Marked variations in ampicillin resistance in indicator E. coli were observed between countries involved in the analysis. Consumption of aminopenicillins ranged from 0.05 up to nearly 60 mg/kg of estimated biomass. Statistically significant positive associations between ampicillin resistance in indicator E. coli and aminopenicillin consumption in food‐producing animals were observed for all the time intervals (Table 35, Figure 50).
TABLE 35.
Consumption of aminopenicillins in food‐producing animals, expressed in mg/kg of estimated biomass/year, and the probability of resistance to aminopenicillin in indicator Escherichia coli from food‐producing animals, EU/EEA, 2018–2021 (logistic regression, see Figure 50).
| Period | Countries | Model | OR | p‐value | 95% CI |
|---|---|---|---|---|---|
| 2018–2019 | AT, BE, BG, CY, CZ, DE, DK, EE, EL, ES, FI, FR, HR, HU, IE, IS, IT, LT, LV, MT, NL, NO, PL, PT, RO, SE, SI, SK (n = 28) | log | 1.38 | < 0.001 | 1.23–1.55 |
| 2019–2020 | AT, BE, BG, CY, CZ, DE, DK, EE, EL, ES, FI, FR, HR, HU, IE, IS, IT, LT, LU, LV, MT, NL, NO, PL, PT, RO, SE, SI, SK (n = 29) | log | 1.40 | < 0.001 | 1.25–1.57 |
| 2020–2021 | AT, BE, BG, CY, CZ, DE, DK, EE, EL, ES, FI, FR, HR, HU, IE, IS, IT, LT, LU, LV, MT, NL, NO, PL, PT, RO, SE, SI, SK (n = 29) | log | 1.36 | < 0.001 | 1.23–1.51 |
Abbreviations: CI, confidence interval; OR, odds ratio.
Note: OR varies from 0 to infinity. When OR equals 1 and CI includes 1, the association is not considered statistically significant.
FIGURE 50.

Consumption of aminopenicillins in food‐producing animals and the probability of resistance to ampicillin in indicator Escherichia coli from food‐producing animals, EU/EEA, 2019–2021 (see Table 35). The figure displays results of logistic regression analyses. Bubbles represent the countries included in the analysis. The size of the bubbles indicates the amount of available resistance data per country.
9.3.2. Escherichia coli from poultry and pigs
The estimated consumption of aminopenicillins in pigs and poultry were compared with the occurrence of resistance to ampicillin in indicator E. coli from slaughter pigs for 2019 and 2021 and from poultry (broilers and turkeys) for 2020. Where detected, aminopenicillin resistance in indicator E. coli from pigs and poultry was typically reported at high levels. In poultry, the levels of resistance observed were generally higher than those reported in pigs.
The association detected between consumption of aminopenicillins and resistance to ampicillin in indicator E. coli in poultry in 2020 was significantly positive. The association assessed between consumption of aminopenicillins and resistance to ampicillin in indicator E. coli in pigs in 2019 and 2021 was significantly positive (Table 36, Figure 51).
TABLE 36.
Consumption of aminopenicillins in poultry and pigs, expressed as DDDvet/kg of estimated biomass/year, and the probability of resistance to ampicillin in indicator Escherichia coli from slaughter pigs for 2019 and 2021 and poultry (broilers and turkeys) for 2020, EU/EEA (logistic regression, see Figure 51).
| FPA | Year | Country | Model | OR | p‐value | 95% CI |
|---|---|---|---|---|---|---|
| Pigs | 2019 | AT, BE, BG, CH, CY, CZ, DE, DK, EE, EL, ES, FI, FR, HR, HU, IE, IS, IT, LT, LU, LV, MT, NL, NO, PL, PT, RO, SE, SI, SK (n = 30) | log | 1.42 | < 0.001 | 1.25–1.63 |
| Pigs | 2021 | AT, BE, BG, CH, CY, CZ, DE, DK, EE, EL, ES, FI, FR, HR, HU, IE, IS, IT, LT, LU, LV, MT, NL, NO, PL, PT, RO, SE, SI, SK (n = 30) | log | 1.40 | < 0.001 | 1.25–1.57 |
| Poultry | 2020 | AT, BE, BG, CH, CY, CZ, DE, DK, EE, EL, ES, FI, FR, HR, HU, IE, IS, IT, LT, LU, LV, MT, NL, NO, PL, PT, RO, SE, SI, SK (n = 30) | log | 1.31 | < 0.001 | 1.19–1.45 |
Abbreviations: CI, confidence interval; FPA, food‐producing animals; OR, odds ratio.
Note: OR varies from 0 to infinity. When OR equals 1 and CI includes 1, the association is not considered statistically significant.
FIGURE 51.

Consumption of aminopenicillins in pigs and the probability of resistance to aminopenicillins in indicator Escherichia coli from slaughter pigs, 2019 and 2021, and poultry (broilers and turkeys), 20, EU/EEA (see Table 36). The figure displays results of logistic regression analyses. Bubbles represent the countries included in the analysis. The size of the bubbles indicates the amount of available resistance data per country.
9.4. Resistance of bacteria from humans and food‐producing animals (univariate analysis)
9.4.1. Escherichia coli
Data on the resistance of invasive E. coli from humans to aminopenicillins (2019–2021) were compared with the resistance to aminopenicillins of indicator E. coli from broilers and turkeys (2020) as well as from pigs and calves (2019, 2021).
A statistically significant association was found between aminopenicillin resistance of invasive E. coli from humans and aminopenicillin resistance of indicator E. coli from broilers and turkeys for the year 2020, from pigs for the years 2019 and 2021 and from calves for the year 2019 (Table 37, Figure 52).
TABLE 37.
Probability of resistance to aminopenicillins in Escherichia coli from humans and food‐producing animals, 2019–2021 (logistic regression, see Figure 52).
| FPA | Year | Countries | Model | OR | p‐value | 95% CI |
|---|---|---|---|---|---|---|
| Pigs | 2019 | AT, BE, BG, CY, CZ, DE, DK, EE, EL, ES, FI, FR, HR, HU, IE, IS, IT, LT, LU, LV, MT, NL, NO, PL, PT, RO, SI, SK (n = 28) | log | 1.32 | < 0.001 | 1.19–1.47 |
| 2021 | AT, BE, BG, CY, CZ, DE, DK, EE, EL, ES, FI, FR, HR, HU, IE, IS, IT, LT, LU, LV, MT, NL, NO, PL, PT, RO, SI, SK (n = 28) | log | 1.37 | < 0.001 | 1.22–1.54 | |
| Calves | 2019 | BE, DE, DK, ES, FR, HR, IT, NL, NO, PT (n = 10) | log | 1.20 | 0.009 | 1.05–1.37 |
| 2021 | BE, DE, DK, ES, FR, HR, IT, NL, NO, PT, RO (n = 11) | log | 1.12 | 0.128 | 0.97–1.28 | |
| Broilers | 2020 | AT, BE, BG, CY, CZ, DE, DK, EE, EL, ES, FI, FR, HR, HU, IE, IS, IT, LT, LU, LV, MT, NL, NO, PL, PT, RO, SI, SK (n = 28) | Linear | 2.21 | < 0.001 | 1.49–3.29 |
| Turkeys | 2020 | AT, BE, DE, ES, FR, HU, IT, NO, PL, PT, RO (n = 11) | log | 1.47 | < 0.001 | 1.20–1.79 |
Abbreviations: CI, confidence interval; FPA, food‐producing animals; OR, odds ratio.
Note: OR varies from 0 to infinity. When OR equals 1 and CI includes 1, the association is not considered statistically significant.
FIGURE 52.

Probability of resistance to aminopenicillins in Escherichia coli from humans and from food‐producing animals pigs, calves, 2019 and 2021, and turkeys, broilers, 2020, EU/EEA (see Table 37). The figure displays results of logistic regression analyses. Bubbles represent the countries included in the analysis. The size of the bubbles indicates the amount of available resistance data per country.
9.5. Consumption in food‐producing animals and resistance in bacteria from humans (univariate analysis)
9.5.1. Escherichia coli
A statistically significant positive association was found between consumption of aminopenicillins in food‐producing animals and resistance to aminopenicillins in invasive E. coli isolates from humans for all 3 years (Table 38, Figure 53).
TABLE 38.
Consumption of aminopenicillins in food‐producing animals, expressed in mg/PCU, and the probability of resistance to aminopenicillins in Escherichia coli from humans, EU/EEA, 2019–2021 (logistic regression, see Figure 53).
| Year | Countries | Model | OR | p‐value | 95% CI |
|---|---|---|---|---|---|
| 2019 | AT, BE, BG, CY, CZ, DE, DK, EE, EL, ES, FI, FR, HR, HU, IE, IS, IT, LT, LU, LV, MT, NL, NO, PL, PT, RO, SI, SK (n = 28) | log | 1.11 | < 0.001 | 1.05–1.16 |
| 2020 | AT, BE, BG, CY, CZ, DE, DK, EE, EL, ES, FI, FR, HR, HU, IE, IS, IT, LT, LU, LV, MT, NL, NO, PL, PT, RO, SI, SK (n = 28) | log | 1.09 | < 0.001 | 1.05–1.14 |
| 2021 | AT, BE, BG, CY, CZ, DE, DK, EE, EL, ES, FI, FR, HR, HU, IE, IS, IT, LT, LU, LV, MT, NL, NO, PL, PT, RO, SI, SK (n = 28) | log | 1.11 | < 0.001 | 1.06–1.16 |
Abbreviations: CI, confidence interval; OR, odds ratio.
Note: OR varies from 0 to infinity. When OR equals 1 and CI includes 1, the association is not considered statistically significant.
FIGURE 53.
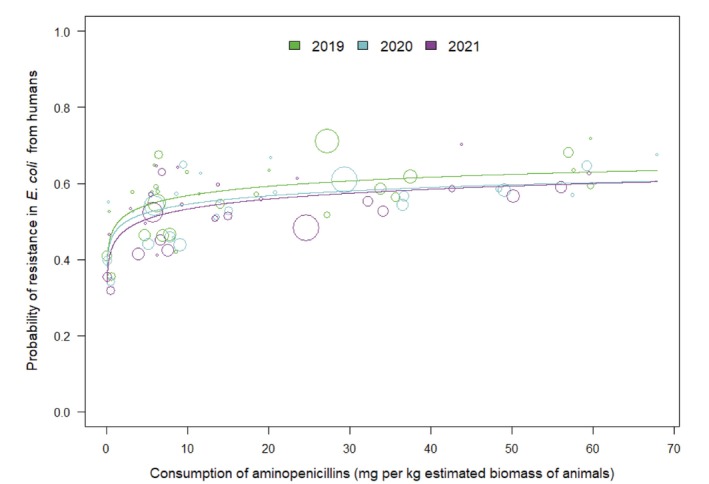
Consumption of aminopenicillins in food‐producing animals and the probability of resistance to aminopenicillins in invasive Escherichia coli from humans, EU/EEA, 2019–2021 (see Table 38). The figure displays results of logistic regression analyses. Bubbles represent the countries included in the analysis. The size of the bubbles indicates the amount of available resistance data per country.
9.6. Multivariate analysis
9.6.1. Escherichia coli
The consumption of aminopenicillins in food‐producing animals was significantly related to resistance in bacteria from food‐producing animals which was significantly related to resistance in invasive Escherichia coli from humans (Figure 54).
FIGURE 54.

Diagram of the PLS‐PM of resistance to ampicillin in human invasive Escherichia coli (2020 and 2021), considering resistance to ampicillin in indicator Escherichia coli from food‐producing animals (pigs 2021 and poultry 2020) and consumption of aminopenicillins in humans (2020–2021 mean, expressed as DDD per 1000 inhabitants and per day) and in food‐producing animals (pigs in 2021 and poultry in 2020, expressed as DDDvet/kg of estimated biomass). 26 countries: AT, BE, BG, CY*, CZ*, DE*, DK, EE, EL, ES, FI, FR, HR, HU, IE, IS*, IT, LT, LV, NL, NO, PL, PT, RO, SI, SK. *For these countries, data on human consumption in the hospital sector were not available, and hospital consumption was estimated from the proportion reported by the other countries for the same year. (Goodness‐of‐fit = 0.682).
According to the R 2, 52% ([0.33–0.76]) of the variance of resistance in food‐producing animals is explained by the corresponding latent variable: aminopenicillins consumption in food‐producing animals, while 65% ([0.37–0.81]) of the variance of resistance in humans is explained by the latent variable resistance in food‐producing animals.
9.7. Trends in consumption and resistance from 2014 to 2021
For aminopenicillins, all reporting countries showed a decrease in consumption in humans between 2014 and 2021, which was statistically significant in the majority of countries (18/24 countries) (Figure 55). In most of those countries with a statistically significant trend in consumption (13/18 countries), a statistically significant reduction in resistance of invasive E. coli to aminopenicillins could also be observed. Likewise, four countries with a non‐significant decrease in consumption still had a significant decrease in resistance. A significant increase in consumption and/or resistance was not observed in any country.
FIGURE 55.

Comparison of annual changes in consumption of aminopenicillins in humans and resistance to aminopenicillins of Escherichia coli from humans between 2014 and 2021 by EU/EEA country. White zone, statistical difference in both the change in consumption and the change in resistance; dotted grey zone, non‐statistically significant difference in the change in consumption; grey zone, non‐statistically significant difference in the change in resistance.
In food‐producing animals, in the same time period, more countries experienced a decrease in consumption of aminopenicillins than an increase (10 vs 4 countries) (Figure 56). Likewise, resistance of E. coli to aminopenicillin was reduced more frequently than it increased (7 vs 4 countries). Four countries observed a concurrent decrease both in AMC and AMR regarding aminopenicillins. Only one country registered an increase both in consumption and AMR at the same time.
FIGURE 56.

Comparison of annual changes in consumption of aminopenicillins in food‐producing animals and resistance to aminopenicillins of Escherichia coli from food‐producing animals between 2014 and 2021 by EU/EEA country. White zone, statistical difference in both the change in consumption and the change in resistance; dotted grey zone, non‐statistically significant difference in the change in consumption; grey zone, non‐statistically significant difference in the change in resistance.
10. MACROLIDES
Macrolides are important antimicrobials in human medicine. They belong to the ‘Watch’ group in the WHO AWaRe classification. Macrolides are considered by WHO as HPCIA in human medicine. (WHO, 2019, 2021). They are also important in veterinary medicine and have been categorised as VCIA in the list of antimicrobials of veterinary importance issued by WOAH (2021). According to EMA's AMEG categorisation, macrolides belong to Category C (‘Caution’), with the indication that they should be used with caution in veterinary medicine in the EU (AMEG, 2019). For those substances proposed for inclusion in this category, general alternatives exist in human medicine in the EU but there are few alternatives in veterinary medicine for certain indications. These antimicrobials should only be used in food‐producing animals when there is no available substance in Category D (‘Prudence’) that would be clinically effective.
10.1. Consumption in humans and food‐producing animals by country
The population‐weighted mean consumption of macrolides in humans and food‐producing animals in 2021 was 6.2 and 7.8 mg/kg estimated biomass, respectively. The corresponding ranges were 0.5–11.1 (median 5.0) mg/kg for humans and 0–22.6 (median 5.0) mg/kg for food‐producing animals, respectively. Population‐corrected consumption of macrolides in humans and food‐producing animals by country in 2021 is shown in Figure 57. The trend in consumption from 2014 to 2021 is shown in Figure 58.
FIGURE 57.

Population biomass‐corrected consumption of macrolides for humans and food‐producing animals in 29 EU/EEA countries for which data were available both for humans and food‐producing animals, 2021. *For Germany, only community consumption was provided for human medicine. Germany's human consumption data were therefore not included in the weighted mean, as only countries providing total consumption (community and hospital sectors combined) were considered for the population‐weighted mean consumption value. Note: The estimates presented are crude and must be interpreted with caution. For limitations hampering comparison of antimicrobial consumption in humans and food‐producing animals, see Section 15.12. aFor antimicrobial agents included (ATC and ATCvet codes), please refer to Section 3.2. The absolute levels of consumption should not be directly compared between humans and animals as the calculation of the denominator differs. For details see text box under Figure 8.
FIGURE 58.

Trend graph of population biomass‐corrected consumption of macrolidesa for humans and food‐producing animals in EU/EEA countriesb, mg/kg of estimated biomass, 2014–2021. aFor antimicrobial groups included in overall consumption data (ATC and ATCvet codes), please refer to Section 3.2. bThe countries involved in the analysis may slightly vary between years; consequently, a trend line was not generated, and the specific country names are not listed in this context. The absolute levels of consumption should not be directly compared between humans and animals as the calculation of the denominator differs. For details see text box under Figure 8. In the box plots, the lowest boundary indicates the 25th percentile, the black horizontal line within the box marks the median and the upper boundary of the box indicates the 75th percentile. The vertical extending lines denote the most extreme values within 1.5 interquartile range of the 25th and 75th percentile of each group. Only outlying observations (outside of this range) are represented as dots.
The amount of macrolides consumed in humans and in food‐producing animals varied among countries. Notably, there was no consumption of macrolides in food‐producing animals in Iceland. There was a statistically significant association between the levels of consumption of macrolides in humans and in food‐producing animals (Spearman's rank correlation coefficient, rho = 0.51, p = 0.006) at the national level.
Over time, consumption of macrolides decreased significantly between 2014 and 2021 in both, humans (p < 0.001) and food‐producing animals (p = 0.05) (Figure 58). It should be noted that the consumption of macrolides has remained low/very low in several countries over this period; therefore, a further decrease of consumption may not be expected in these countries.
10.2. Consumption in humans and resistance in bacteria from humans (univariate analysis)
10.2.1. Campylobacter jejuni
The consumption of macrolides in humans (expressed as DDD per 1000 inhabitants per day) was compared with the occurrence of resistance to macrolides in C. jejuni from humans. No statistically significant association was found between the consumption of macrolides in humans and the occurrence of macrolide resistance of C. jejuni from humans (Table 39).
TABLE 39.
Consumption of macrolides in humans, expressed as DDD per 1000 inhabitants per day, and the probability of resistance to macrolides in Campylobacter jejuni from humans, EU/EEA, 2019–2021 (logistic regression).
| Year | Countries | Model | OR | p‐value | 95% CI |
|---|---|---|---|---|---|
| 2019 | AT, BG, CY, DK, EE, ES, FI, FR, IS, IT, LT, LU, MT, NL, NO, PL, PT, RO, SI, SK (n = 20) | log | 1.09 | 0.708 | 0.71–1.67 |
| 2020 | AT, CY, DK, EE, ES, FI, FR, IE, IS, IT, LU, MT, NL, NO, PL, PT, SE, SI, SK (n = 19) | log | 1.52 | 0.389 | 0.59–3.91 |
| 2021 | AT, BG, CY, DE, DK, EE, ES, FI, FR, HU, IE, IS, IT, LT, LU, MT, NL, NO, PL, PT, RO, SE, SI, SK (n = 24) | log | 1.15 | 0.756 | 0.47–2.82 |
Abbreviations: CI, confidence interval; OR, odds ratio.
Note: OR varies from 0 to infinity. When OR equals 1 and CI includes 1, the association is not considered statistically significant.
10.2.2. Campylobacter coli
The consumption of macrolides in humans (expressed as DDD per 1000 inhabitants per day) was compared with the occurrence of resistance to macrolides in C. coli from humans. No statistically significant association was found between the consumption of macrolides in humans and the occurrence of macrolide resistance of C. coli in humans (Table 40).
TABLE 40.
Consumption of macrolides in humans, expressed as DDD per 1000 inhabitants per day, and the probability of resistance to macrolides in Campylobacter coli from humans, EU/EEA, 2019–2021 (logistic regression).
| Year | Countries | Model | OR | p‐value | 95% CI |
|---|---|---|---|---|---|
| 2019 | AT, BG, CY, EE, ES, FI, FR, IS, IT, LT, LU, MT, NL, NO, PL, PT, RO, SI, SK (n = 19) | log | 0.99 | 0.986 | 0.46–2.12 |
| 2020 | AT, CY, EE, ES, FI, FR, IS, IT, LU, MT, NL, NO, PL, PT, SE, SI, SK (n = 17) | log | 0.67 | 0.166 | 0.38–1.18 |
| 2021 | AT, CY, DE, DK, EE, ES, FI, FR, HU, IE, IS, IT, LT, LU, MT, NL, NO, PL, PT, SE, SI, SK (n = 22) | log | 0.91 | 0.753 | 0.52–1.60 |
Abbreviations: CI, confidence interval; OR, odds ratio.
Note: OR varies from 0 to infinity. When OR equals 1 and CI includes 1, the association is not considered statistically significant.
Two countries were identified as statistical outliers in 2020. If these countries were excluded from the statistical model, there was a statistically significant association. However, this association was not biologically reasonable, as it indicated that a high consumption of macrolides would be protective regarding occurrence of resistance.
10.3. Consumption in food‐producing animals and resistance in bacteria from food‐producing animals (univariate analysis)
10.3.1. Campylobacter jejuni from poultry
The estimated consumption of macrolides in poultry (expressed as DDDvet/kg of estimated biomass) was compared with the occurrence of resistance to erythromycin in C. jejuni from broilers and turkeys (SIMR) in 2020. Resistance in C. jejuni from turkeys is only accounted for in those countries with a substantial turkey production sector. Resistance to erythromycin in C. jejuni from poultry was very low or absent in many countries, while a few countries had up to around 7% resistant isolates. No statistically significant association was found between the estimated consumption of macrolides in poultry and the occurrence of macrolide resistance of C. jejuni in poultry (Table 41).
TABLE 41.
Consumption of macrolides in poultry, expressed as DDDvet/kg of estimated biomass/year, and the probability of resistance to macrolides in Campylobacter jejuni from poultry, EU/EEA, 2020 (logistic regression).
| Year | Countries | Model | OR | p‐value | 95% CI |
|---|---|---|---|---|---|
| 2020 | AT, BE, BG, CH, CY, CZ, DE, DK, EE, EL, ES, FI, FR, HR, HU, IE, IT, LT, LU, LV, MT, NL, NO, PL, PT, RO, SE, SI, SK (n = 29) | Linear | 18.18 | 0.331 | 0.05–6326.1 |
Abbreviations: CI, confidence interval; OR, odds ratio.
Note: OR varies from 0 to infinity. When OR equals 1 and CI includes 1, the association is not considered statistically significant. The category ‘poultry’ includes data from broilers and turkeys for AT, DE, ES, HU, IT, PL, PT and RO, and broiler data for the other countries included in the analysis.
10.3.2. Campylobacter coli from pigs
The estimated consumption of macrolides in pigs (expressed as DDDvet/kg of estimated biomass) was compared with the occurrence of resistance to macrolides in C. coli from pigs in 2021. A statistically significant positive association was found between the consumption of macrolides in pigs and the occurrence of macrolide resistance of C. coli in pigs in 2021 (Table 42, Figure 59).
TABLE 42.
Consumption of macrolides in pigs, expressed as DDDvet/kg of estimated biomass/year, and the probability of resistance to macrolides in Campylobacter coli from slaughter pigs, EU/EEA, 2021 (logistic regression, see Figure 59).
| Year | Countries | Model | OR | p‐value | 95% CI |
|---|---|---|---|---|---|
| 2021 | AT, BE, BG, CH, CY, DE, DK, EE, EL, ES, FI, FR, HR, HU, IE, IS, IT, LT, LU, LV, MT, NL, NO, PL, PT, RO, SE, SI, SK (n = 29) | log | 2.97 | < 0.001 | 2.05–4.29 |
Abbreviations: CI, confidence interval; OR, odds ratio.
Note: OR varies from 0 to infinity. When OR equals 1 and CI includes 1, the association is not considered statistically significant.
FIGURE 59.

Consumption of macrolides in pigs and the probability of resistance to macrolides in Campylobacter coli from slaughter pigs in 2021 (see Table 42). The figure displays results of logistic regression analyses. Bubbles represent the countries included in the analysis. The size of the bubbles indicates the amount of available resistance data per country.
10.4. Resistance in bacteria from humans and food‐producing animals (univariate analysis)
10.4.1. Campylobacter jejuni
The probability of resistance to macrolides in C. jejuni from humans was compared with the probability of resistance in broilers and turkeys.
Overall resistance to erythromycin was reported at 0.7% and 1.1% in C. jejuni isolates from humans in 2020 and 2021, respectively, at 0.8% in isolates from broilers (2020), 0.8% in isolates from fattening turkeys (2020).
No statistically significant association was found between the occurrence of macrolide resistance in C. jejuni in humans and in broilers or turkeys (Table 43).
TABLE 43.
Probability of resistance to macrolides in Campylobacter jejuni from humans and broilers or turkeys, EU/EEA, 2020–2021 (logistic regression).
| FPA | Year | Countries | Model | OR | p‐value | 95% CI |
|---|---|---|---|---|---|---|
| Broilers | 2020 | AT, CY, DK, EE, ES, FI, FR, IE, IT, LU, MT, NL, NO, PL, PT, SE, SI, SK (n = 18) | log | 1.06 | 0.791 | 0.69–1.63 |
| Turkeys | 2020 | AT, ES, FR, IT, NO, PL, PT (n = 7) | log | 1 | 0.989 | 0.58–1.74 |
Abbreviations: CI, confidence interval; OR, odds ratio.
Note: OR varies from 0 to infinity. When OR equals 1 and CI includes 1, the association is not considered statistically significant.
One among the seven countries was identified as a statistical outlier when comparing data from turkeys and humans in 2020. If this country was excluded from the statistical model, there was a statistically significant association.
10.4.2. Campylobacter coli
The probability of resistance to macrolides in C. coli from humans was compared with the probability of resistance in pigs.
There was no statistically significant association between the occurrence of macrolide resistance of C. coli in humans and in pigs (Table 44).
TABLE 44.
Probability of resistance to macrolides in Campylobacter coli from humans and pigs, EU/EEA, 2021 (logistic regression).
| FPA | Year | Countries | Model | OR | p‐value | 95% CI |
|---|---|---|---|---|---|---|
| Pigs | 2021 | AT, CY, DE, DK, EE, ES, FI, FR, HU, IE, IS, IT, LT, LU, MT, NL, NO, PL, PT, SE, SI, SK (n = 22) | log | 1.25 | 0.056 | 0.99–1.58 |
Abbreviations: CI, confidence interval; FPA, food‐producing animals; OR, odds ratio.
Note: OR varies from 0 to infinity. When OR equals 1 and CI includes 1, the association is not considered statistically significant.
10.5. Consumption in food‐producing animals and resistance in bacteria from humans (univariate analysis)
10.5.1. Campylobacter jejuni
The consumption of macrolides in food‐producing animals (expressed in mg per kg of estimated biomass/year) was compared with the probability of resistance to macrolides in C. jejuni causing infections in humans.
A statistically significant positive association was found between the consumption of macrolides in food‐producing animals and the occurrence of macrolide resistance of C. jejuni causing infections in humans in 2020. This association was borderline statistically significant for the years 2019 and 2021 (Table 45, Figure 60).
TABLE 45.
Consumption of macrolides in food‐producing animals (expressed in mg per kg of estimated biomass/year) and the probability of resistance to macrolides in Campylobacter jejuni causing infections in humans, EU/EEA, 2019–2021 (logistic regression, see Figure 60).
| Year | Countries | Model | OR | p‐value | 95% CI |
|---|---|---|---|---|---|
| 2019 | AT, BG, CY, DK, EE, ES, FI, FR, IS, IT, LT, LU, MT, NL, NO, PL, PT, RO, SI, SK (n = 20) | Linear | 1.05 | 0.089 | 0.99–1.10 |
| 2020 | AT, CY, DK, EE, ES, FI, FR, IE, IS, IT, LU, MT, NL, NO, PL, PT, SE, SI, SK (n = 19) | Linear | 1.11 | < 0.001 | 1.05–1.16 |
| 2021 | AT, BG, CY, DE, DK, EE, ES, FI, FR, HU, IE, IS, IT, LT, LU, MT, NL, NO, PL, PT, RO, SE, SI, SK (n = 24) | Linear | 1.10 | 0.095 | 0.98–1.22 |
Abbreviations: CI, confidence interval; OR, odds ratio.
Note: OR varies from 0 to infinity. When OR equals 1 and CI includes 1, the association is not considered statistically significant.
FIGURE 60.

Consumption of macrolides in food‐producing animals and the probability of resistance to macrolides in Campylobacter jejuni from humans, EU/EEA, 2019–2021 (see Table 45). The figure displays results of logistic regression analyses. Bubbles represent the countries included in the analysis. The size of the bubbles indicates the amount of available resistance data per country. A solid trend line indicates significance at a 5% level, whereas a dashed trend line represents significance at a 10% level.
Three countries were identified as statistical outliers in 2019 and two countries were identified in 2021. If these countries were excluded from the statistical model, there was a statistically significant association also in these years.
10.5.2. Campylobacter coli
The consumption of macrolides in food‐producing animals (expressed in mg per kg of estimated biomass/year) was compared with the probability of resistance to macrolides in C. coli causing infections in humans.
A borderline significant positive association was found between the consumption of macrolides in food‐producing animals and the occurrence of macrolide resistance of C. coli causing infections in humans in 2021 but there was no statistically significance for the year 2019 and 2020 (Table 46).
TABLE 46.
Consumption of macrolides in food‐producing animals, expressed in mg per kg of estimated biomass/year, and the probability of resistance to macrolides in Campylobacter coli causing infections in humans, EU/EEA, 2019–2021 (logistic regression).
| Year | Countries | Model | OR | p‐value | 95% CI |
|---|---|---|---|---|---|
| 2019 | AT, BG, CY, EE, ES, FI, FR, IS, IT, LT, LU, MT, NL, NO, PL, PT, RO, SI, SK (n = 19) | Quadratic | 1.00 | 0.880 | 0.996–1.005 |
| 2020 | AT, CY, EE, ES, FI, FR, IS, IT, LU, MT, NL, NO, PL, PT, SE, SI, SK (n = 17) | Quadratic | 1.00 | 0.740 | 0.997–1.005 |
| 2021 | AT, CY, DE, DK, EE, ES, FI, FR, HU, IE, IS, IT, LT, LU, MT, NL, NO, PL, PT, SE, SI, SK (n = 22) | Quadratic | 1.00 | 0.088 | 0.999–1.008 |
Abbreviations: CI, confidence interval; OR, odds ratio.
Note: OR varies from 0 to infinity. When OR equals 1 and CI includes 1, the association is not considered statistically significant.
In each year, there was one country identified as a statistical outlier. If these countries were excluded from the statistical model, there was a statistically significant association in 2019 and 2020 but no longer any significant association in 2021.
10.6. Multivariate analysis
A multivariate analysis including correlations of consumption as well as resistance of macrolides in humans and farm animals in 2020–2021 was performed. Consumption was expressed as DDD per 1000 inhabitants and per day (humans) and DDDvet/kg of estimated biomass (farm animals).
A statistically significant relation was seen for the consumption of macrolides for pigs, the resistance to macrolides in C. coli from pigs, and the resistance to macrolides in C. coli from humans. This relation explained about half of the variance (R 2 = 0.55, 95% confidence interval 0.02–0.90) (Figure 61).
FIGURE 61.

Diagram of the PLS‐PM of resistance to macrolides in Campylobacter coli from humans (2021), considering resistance to macrolides in C. coli from food‐producing animals (pigs in 2021), consumption of macrolides in humans (2021, expressed as DDD per 1000 inhabitants and per day) and consumption of macrolides in pigs (in 2021, expressed as DDDvet/kg of estimated biomass). 17 countries: AT, DE, DK, EE, ES, FI, FR, JU, IE, IT, LT, LU, MT, NL, PT, SI, SK.
No statistically significant relation was seen for C. jejuni.
11. TETRACYCLINES
In WHO's AWaRe classification, the tetracyclines are assigned to different categories. While some are in the ‘Access’ category (e.g. doxycycline, tetracycline) others are on the ‘Watch’ list (e.g. chlortetracycline, oxytetracycline). However, some tetracyclines are also categorised as ‘Reserve’ (e.g. eravacycline, minocycline, omadacycline, tigecycline) (WHO, 2021). The latter are not authorised for use in animals.
Tetracyclines are considered by WHO as ‘Highly Important Antimicrobials’ (HIA) in human medicine (WHO, 2019). This group has also been categorised as VCIA in the WOAH list of antimicrobials of veterinary importance (WOAH, 2021).
According to EMA's AMEG categorisation, tetracyclines belong to Category D (‘Prudence’) with the indication that they should be used prudently in veterinary medicine in the EU (AMEG, 2019). Responsible use principles should be adhered to in everyday practice to keep the risk from use of these groups as low as possible.
11.1. Consumption in humans and food‐producing animals by country
The population‐weighted mean consumption of tetracyclines in humans and food‐producing animals was 1.9 and 23.6 mg/kg of estimated biomass, respectively. The corresponding ranges were 0.3–6.0 (median 1.7) and 0.04–113.4 (median 16.2) mg/kg, respectively. Population‐corrected consumption of tetracyclines in humans and food‐producing animals by country is shown in Figure 62. The variation between countries in the quantities of tetracyclines consumed in food‐producing animals was very wide. There was no significant association within country between consumption of tetracyclines in humans and food‐producing animals (Spearman's rank correlation, rho = −0.28).
FIGURE 62.

Population biomass‐corrected consumption of tetracyclines for humans and food‐producing animals in 29 EU/EEA countries for which data were available both for humans and food‐producing animals, 2021. *For Germany, only community consumption was provided for human medicine. Germany's human consumption data were therefore not included in the weighted mean, as only countries providing total consumption (community and hospital sectors combined) were considered for the population‐weighted mean consumption value. Note: The estimates presented are crude and must be interpreted with caution. For limitations hampering comparison of antimicrobial consumption in humans and food‐producing animals, see Section 15.12. aFor antimicrobial agents included (ATC and ATCvet codes), please refer to Section 3.2. The absolute levels of consumption should not be directly compared between humans and animals as the calculation of the denominator differs. For details see text box under Figure 8.
Between 2014 and 2021, consumption of tetracyclines decreased significantly in food‐producing animals (p = 0.001), while it did not change significantly in humans (Figure 63).
FIGURE 63.

Trend graph of population biomass‐corrected consumption of tetracyclinesa for humans and food‐producing animals in EU/EEA countriesb, mg/kg of estimated biomass, 2014–2021. aFor antimicrobial groups included in overall consumption data (ATC and ATCvet codes), please refer to Section 3.2. bThe countries involved in the analysis may slightly vary between years; consequently, a trend line was not generated, and the specific country names are not listed in this context. The absolute levels of consumption should not be directly compared between humans and animals as the calculation of the denominator differs. For details see text box under Figure 8. In the box plots, the lowest boundary indicates the 25th percentile, the black horizontal line within the box marks the median and the upper boundary of the box indicates the 75th percentile. The vertical extending lines denote the most extreme values within 1.5 interquartile range of the 25th and 75th percentile of each group. Only outlying observations (outside of this range) are represented as dots.
FIGURE 64.

Consumption of tetracyclines in food‐producing animals and the probability of resistance to tetracyclines in indicator Escherichia, EU/EEA, 2019–2021 (see Table 49). The figure displays the results of logistic regression analyses. Bubbles represent the countries included in the analysis. The size of the bubbles indicates the amount of available resistance data per country. Category ‘food‐producing animals’ includes broilers, turkeys, pigs and calves for all three time considered intervals.
11.2. Consumption in humans and resistance in bacteria from humans (univariate analysis)
Tetracyclines are generally not used for treatment of E. coli infections in humans, and resistance to tetracyclines in invasive E. coli isolates from humans is not under surveillance.
11.2.1. Campylobacter jejuni
No evidence of a statistically significant association was discerned between total (community and hospital) consumption of tetracyclines and the occurrence of tetracycline resistance of C. jejuni isolates from humans for 2019, 2020 and 2021 (Table 47).
TABLE 47.
Consumption of tetracyclines in humans, expressed as DDD per 1000 inhabitants per day, and the probability of resistance to tetracyclines in Campylobacter jejuni from humans, EU/EEA, 2019–2021 (logistic regression).
| Year | Countries | Model | OR | p‐value | 95% CI |
|---|---|---|---|---|---|
| 2019 | AT, BG, CY, DK, EE, ES, FI, FR, IT, LT, LU, MT, NL, NO, PL, PT, RO, SI, SK (n = 19) | log | 1.01 | 0.969 | 0.73–1.39 |
| 2020 | AT, CY, DK, EE, ES, FI, FR, IE, IT, LU, MT, NL, NO, PL, PT, SE, SI, SK (n = 18) | log | 0.75 | 0.130 | 0.51–1.09 |
| 2021 | AT, BG, CY, DE, DK, EE, ES, FI, FR, HU, IE, IT, LT, LU, MT, NL, NO, PL, PT, RO, SE, SI, SK (n = 23) | log | 0.70 | 0.101 | 0.46–1.07 |
Abbreviations: CI, confidence interval; OR, odds ratio.
Note: OR varies from 0 to infinity. When OR equals 1 and CI includes 1, the association is not considered statistically significant.
11.2.2. Campylobacter coli
No evidence of a statistically significant association was discerned between total (community and hospital) consumption of tetracyclines, and the occurrence of tetracycline resistance of C. coli isolates from humans for 2019–2021 (Table 48).
TABLE 48.
Consumption of tetracyclines in humans, expressed as DDD per 1000 inhabitants per day, and the probability of resistance to tetracyclines in Campylobacter coli from humans, EU/EEA, 2019–2021 (logistic regression).
| Year | Countries | Model | OR | p‐value | 95% CI |
|---|---|---|---|---|---|
| 2019 | AT, BG, CY, EE, ES, FI, FR, IT, LT, LU, MT, NL, NO, PL, PT, RO, SI, SK (n = 18) | log | 1.12 | 0.588 | 0.75–1.66 |
| 2020 | AT, CY, EE, ES, FI, FR, IT, LU, MT, NL, NO, PT, SE, SI, SK (n = 15) | log | 0.99 | 0.973 | 0.69–1.43 |
| 2021 | AT, CY, DE, DK, EE, ES, FI, FR, HU, IE, IT, LT, LU, MT, NL, NO, PL, PT, SE, SI, SK (n = 21) | log | 1.08 | 0.771 | 0.65–1.80 |
Abbreviations: CI, confidence interval; OR, odds ratio.
Note. OR varies from 0 to infinity. When OR equals 1 and CI includes 1, the association is not considered statistically significant.
11.3. Consumption in food‐producing animals and resistance in bacteria from food‐producing animals (univariate analysis)
11.3.1. Escherichia coli from food‐producing animals
In order to investigate possible relationships between the consumption of tetracyclines and tetracycline resistance, the SIMR to tetracyclines in indicator E. coli from food‐producing animals, was compared with the consumption of tetracyclines in food‐producing animals (expressed in mg per kg of estimated biomass) for the 2‐year intervals 2018–2019, 2019–2020 and 2020–2021 (mean consumption over the respective years) at the national level (Table 49). The category ‘food‐producing animals’ includes broilers, turkeys, pigs and calves at slaughter for all time‐intervals.
TABLE 49.
Consumption of tetracyclines by food‐producing animals, expressed in mg per kg of estimated biomass/year, and the probability of resistance to tetracyclines in indicator Escherichia coli from food‐producing animals, EU/EEA, 2018–2021 (logistic regression, see Figure 64).
| Year | Countries | Model | OR | p‐value | 95% CI |
|---|---|---|---|---|---|
| 2018–2019 | AT, BE, BG, CY, CZ, DE, DK, EE, EL, ES, FI, FR, HR, HU, IE, IS, IT, LT, LV, MT, NL, NO, PL, PT, RO, SE, SI, SK (n = 28) | log | 1.53 | < 0.001 | 1.36–1.73 |
| 2019–2020 | AT, BE, BG, CY, CZ, DE, DK, EE, EL, ES, FI, FR, HR, HU, IE, IS, IT, LT, LU, LV, MT, NL, NO, PL, PT, RO, SE, SI, SK (n = 29) | log | 1.47 | < 0.001 | 1.30–1.65 |
| 2020–2021 | AT, BE, BG, CY, CZ, DE, DK, EE, EL, ES, FI, FR, HR, HU, IE, IS, IT, LT, LU, LV, MT, NL, NO, PL, PT, RO, SE, SI, SK (n = 29) | log | 1.38 | < 0.001 | 1.26–1.52 |
Abbreviations: CI, confidence interval; OR, odds ratio.
Note: The odds ratio (OR) varies from 0 to infinity. When OR equals 1 and CI includes 1, the association is not considered statistically significant. The category ‘food‐producing animals’ includes broilers, turkeys, pigs and calves.
Marked variations in tetracycline resistance in indicator E. coli were observed between the countries included in the analysis over the period investigated. The consumption of tetracyclines ranged between a few mg per kg of estimated biomass to around 120 mg/kg of estimated biomass. Statistically significant positive associations between tetracycline resistance of indicator E. coli and tetracycline consumption in food‐producing animals were observed in all the 2‐year intervals considered.
11.3.2. Escherichia coli, Campylobacter jejuni and Campylobacter coli from pigs and from poultry
The estimated consumption of tetracyclines in poultry and pigs (expressed as DDDvet/kg of estimated biomass) was compared with the occurrence of resistance to tetracyclines in indicator E. coli from slaughter pigs for 2019 and 2021 and from poultry in 2020. It was also compared to the resistance of C. jejuni in poultry for 2020 and C. coli in pigs for 2021.
A significant positive association was observed between the estimated consumption of tetracyclines in poultry and resistance to tetracyclines in E. coli and C. jejuni from poultry in 2020 (Table 50, Figure 65). A significant positive association was also found between consumption of tetracyclines in pigs and resistance of E. coli from pigs in 2019 and 2021 and C. coli in 2021 (Table 50, Figure 66).
TABLE 50.
Consumption of tetracyclines in pigs and poultry, expressed as DDDvet/kg of estimated biomass/year, and the probability of resistance to tetracyclines in bacteria from slaughter pigs and poultry, EU/EEA, 2019–2021 (logistic regression, see Figure 65).
| FPA | Year | Countries | Model | OR | p‐value | 95% CI |
|---|---|---|---|---|---|---|
| E. coli | ||||||
| Poultry | 2020 | AT, BE, BG, CH, CY, CZ, DE, DK, EE, EL, ES, FI, FR, HR, HU, IE, IT, LT, LU, LV, MT, NL, NO, PL, PT, RO, SE, SI, SK (n = 29) | log | 1.27 | < 0.001 | 1.14–1.41 |
| Pigs | 2019 | AT, BE, BG, CH, CY, CZ, DE, DK, EE, EL, ES, FI, FR, HR, HU, IE, IS, IT, LT, LU, LV, MT, NL, NO, PL, PT, RO, SE, SI, SK (n = 30) | log | 1.57 | < 0.001 | 1.35–1.83 |
| Pigs | 2021 | AT, BE, BG, CH, CY, CZ, DE, DK, EE, EL, ES, FI, FR, HR, HU, IE, IS, IT, LT, LU, LV, MT, NL, NO, PL, PT, RO, SE, SI, SK (n = 30) | log | 1.38 | < 0.001 | 1.24–1.54 |
| C. coli | ||||||
| Pigs | 2021 | AT, BE, BG, CH, CY, DE, DK, EE, EL, ES, FI, FR, HR, HU, IE, IS, IT, LT, LU, LV, MT, NL, NO, PL, PT, RO, SE, SI, SK (n = 29) | log | 1.85 | < 0.001 | 1.46–2.36 |
| C. jejuni | ||||||
| Poultry | 2020 | AT, BE, BG, CH, CY, CZ, DE, DK, EE, EL, ES, FI, FR, HR, HU, IE, IT, LT, LU, LV, MT, NL, NO, PL, PT, RO, SE, SI, SK (n = 29) | log | 1.23 | < 0.001 | 1.09–1.37 |
Abbreviations: CI, confidence interval; FPA, food‐producing animals; OR, odds ratio.
Note: OR varies from 0 to infinity. When OR equals 1 and CI includes 1, the association is not considered statistically significant.
FIGURE 65.

Consumption of tetracyclines in poultry, expressed as DDDvet/kg of estimated biomass/year, and the probability of resistance to tetracyclines in indicator Escherichia coli, and Campylobacter jejuni from poultry in 2020 EU/EEA (see Table 50). The figure displays the results of logistic regression analyses. Bubbles represent the countries included in the analysis. The size of the bubbles indicates the amount of available resistance data per country.
FIGURE 66.

Consumption of tetracyclines in pigs, expressed as DDDvet/kg of estimated biomass/year, and the probability of resistance to tetracyclines in indicator Escherichia coli from slaughter pigs, 2019 and 2021, and Campylobacter coli from slaughter pigs, 2021, EU/EEA (see Table 50). The figure displays the results of logistic regression analyses. Bubbles represent the countries included in the analysis. The size of the bubbles indicates the amount of available resistance data per country.
11.4. Resistance in bacteria from humans and food‐producing animals (univariate analysis)
Resistance to tetracyclines of Campylobacter spp. has been detected both in humans and food‐producing animals, but it varies markedly among the EU/EEA Member States. Resistance of invasive E. coli from humans is not routinely monitored and therefore not included in the analysis.
11.4.1. Campylobacter jejuni from humans and food‐producing animals
A statistically significant positive association was found between tetracycline resistance in C. jejuni from turkeys and broilers and tetracycline resistance of C. jejuni from humans for 2020 (Table 51, Figure 67). The number of countries included in the analysis on turkeys in 2020 is very limited. For the analysis on turkeys in 2020, there is one outlier which is an influential point since its removal results in making the association non‐significant. The instability may be linked to the very limited number of countries included in the analysis.
TABLE 51.
Probability of resistance to tetracyclines in Campylobacter jejuni from humans and broilers and turkeys, EU/EEA, 2020 (logistic regression, see Figure 67).
| FPA | Year | Countries | Model | OR | p‐value | 95% CI |
|---|---|---|---|---|---|---|
| Broilers | 2020 | AT, CY, DK, EE, ES, FI, FR, IE, IT, LU, MT, NL, NO, PL, PT, SE, SI, SK (n = 18) | log | 1.42 | < 0.001 | 1.22–1.66 |
| Turkeys | 2020 | AT, ES, FR, IT, NO, PL, PT (n = 7) | log | 1.44 | < 0.001 | 1.22–1.70 |
Abbreviations: CI, confidence interval; FPA, food‐producing animals; OR, odds ratio.
Note: OR varies from 0 to infinity. When OR equals 1 and CI includes 1, the association is not considered statistically significant.
FIGURE 67.

Probability of tetracycline resistance in Campylobacter jejuni from humans and broilers and turkeys, EU/EEA, 2020 (see Table 51). The figure displays the results of logistic regression analyses. Bubbles represent the countries included in the analysis. The size of the bubbles indicates the amount of available resistance data per country.
11.4.2. Campylobacter coli from humans and pigs
A statistically significant positive association was found between tetracycline resistance in C. coli from pigs and tetracycline resistance of C. coli from humans for 2021 (Table 52, Figure 68). For this analysis, there is one outlier which is an influential point since its removal results in making the association non‐significant.
TABLE 52.
Probability of resistance to tetracyclines in Campylobacter coli from humans and pigs, EU/EEA, 2021 (logistic regression, see Figure 68).
| Year | Countries | Model | OR | p‐value | 95% CI |
|---|---|---|---|---|---|
| 2021 | AT, CY, DE, DK, EE, ES, FI, FR, HU, IE, IT, LT, LU, MT, NL, NO, PL, PT, SE, SI, SK (n = 21) | Quadratic | 4.11 | 0.041 | 1.06–15.90 |
Abbreviations: CI, confidence interval; OR, odds ratio.
Note: OR varies from 0 to infinity. When OR equals 1 and CI includes 1, the association is not considered statistically significant.
FIGURE 68.

Probability of tetracycline resistance in Campylobacter coli from humans and pigs, EU/EEA, 2021 (see Table 52). The figure displays the results of logistic regression analyses. Bubbles represent the countries included in the analysis. The size of the bubbles indicates the amount of available resistance data per country.
11.5. Consumption in food‐producing animals and resistance in bacteria from humans (univariate analysis)
11.5.1. Campylobacter jejuni
A statistically significant association was found between the total tetracycline consumption in food‐producing animals and tetracycline resistance in C. jejuni from humans for all the years 2019–2021 (Table 53, Figure 69). In 2019, one country characterised by an extremely low consumption was an outlier. Removal of this country turned the association to borderline significant.
TABLE 53.
Consumption of tetracyclines in food‐producing animals, expressed in mg/kg estimated biomass, and the probability of resistance to tetracyclines in Campylobacter jejuni isolated from humans, EU/EEA, 2019–2021 (logistic regression, see Figure 69).
| Year | Countries | Model | OR | p‐value | 95% CI |
|---|---|---|---|---|---|
| 2019 | AT, BG, CY, DK, EE, ES, FI, FR, IT, LT, LU, MT, NL, NO, PL, PT, RO, SI, SK (n = 19) | log | 1.18 | 0.003 | 1.06–1.31 |
| 2020 | AT, CY, DK, EE, ES, FI, FR, IE, IT, LU, MT, NL, NO, PL, PT, SE, SI, SK (n = 18) | log | 1.45 | < 0.001 | 1.33–1.57 |
| 2021 | AT, BG, CY, DE, DK, EE, ES, FI, FR, HU, IE, IT, LT, LU, MT, NL, NO, PL, PT, RO, SE, SI, SK (n = 23) | log | 1.33 | < 0.001 | 1.16–1.53 |
Abbreviations: CI, confidence interval; OR, odds ratio.
Note: OR varies from 0 to infinity. When OR equals 1 and CI includes 1, the association is not considered statistically significant.
FIGURE 69.

Consumption of tetracyclines in food‐producing animals and the probability of resistance to tetracyclines in Campylobacter jejuni from humans, EU/EEA, 2019–2021 (see Table 53). The figure displays the results of logistic regression analyses. Bubbles represent the countries included in the analysis. The size of the bubbles indicates the amount of available resistance data per country.
11.5.2. Campylobacter coli
No statistically significant association was found between the total tetracycline consumption in food‐producing animals and tetracycline resistance in C. coli from humans for 2019–2021 (Table 54).
TABLE 54.
Consumption of tetracyclines in food‐producing animals, expressed in mg/kg estimated biomass, and the probability of resistance to tetracyclines in Campylobacter coli isolated from humans, EU/EEA, 2019–2021 (logistic regression).
| Year | Countries | Model | OR | p‐value | 95% CI |
|---|---|---|---|---|---|
| 2019 | AT, BG, CY, EE, ES, FI, FR, IT, LT, LU, MT, NL, NO, PL, PT, RO, SI, SK (n = 18) | log | 1.12 | 0.187 | 0.95–1.33 |
| 2020 | AT, CY, EE, ES, FI, FR, IT, LU, MT, NL, NO, PT, SE, SI, SK (n = 15) | log | 1.16 | 0.177 | 0.94–1.43 |
| 2021 | AT, CY, DE, DK, EE, ES, FI, FR, HU, IE, IT, LT, LU, MT, NL, NO, PL, PT, SE, SI, SK (n = 21) | log | 1.14 | 0.210 | 0.93–1.41 |
Abbreviations: CI, confidence interval; OR, odds ratio.
Note: OR varies from 0 to infinity. When OR equals 1 and CI includes 1, the association is not considered statistically significant.
11.6. Multivariate analysis
For C. coli, multivariate analysis only involved 17 countries for which all data were available. No significant relationship could be assessed.
For C. jejuni, from data available in 20 countries, the direct effect of resistance in poultry on resistance in human isolates was estimated to be 0.78. Sixty‐one per cent of the variance of C. jejuni resistance rate in humans could be explained by the model (95% confidence interval: 22–87) (Figure 70). No significant association was observed between tetracycline consumption in poultry and resistance of C. jejuni in poultry, or between tetracycline consumption in humans and resistance of C. jejuni in humans.
FIGURE 70.

Diagram of PLS‐PM model of resistance to tetracyclines in Campylobacter jejuni from humans (2020 and 2021), considering resistance to tetracyclines in C. jejuni from food‐producing animals (poultry in 2020), consumption of tetracyclines in humans (2020–2021 mean, expressed as DDD per 1000 inhabitants and per day) and in poultry (in 2020, expressed as DDDvet/kg of estimated biomass). 20 countries: AT, BG, CY*, DE*, DK, EE, ES, FI, FR, HU, IE, IT, LT, NL, NO, PL, PT, SE, SI, SK. *For these countries, data on human consumption in the hospital sector were not available, and hospital consumption was estimated from the proportion reported by the other countries for the same year.
11.7. Trends in consumption and resistance from 2014 to 2021
As there are no resistance data for E. coli from humans, the analysis was only carried out in food‐producing animals. From 2014 to 2021, the majority of countries (14 countries) recorded a statistically significant trend in reduction in both AMC and AMR regarding tetracyclines. Overall, a decrease in AMC was observed in 18 countries, and a decrease in AMR was also seen in 18 countries. A concurrent increase of both AMC and AMR was not observed in any country. An increase in AMC was registered in two countries (Figure 71).
FIGURE 71.

Comparison of annual changes in consumption of tetracyclines in food‐producing animals and resistance to tetracyclines in Escherichia coli from food‐producing animals between 2014 and 2021 by EU/EEA country. White zone, statistical difference in both the change in consumption and the change in resistance; dotted grey zone, non‐statistically significant difference in the change in consumption; grey zone, non‐statistically significant difference in the change in resistance.
12. PRIMARY KEY INDICATORS OF ANTIMICROBIAL CONSUMPTION AND RESISTANCE
12.1. Trends in key indicators
Primary key indicators of AMC and AMR have been proposed by ECDC, EFSA and EMA (ECDC, EFSA, EMA, 2017a). Table 55 displays the level of the five proposed primary key indicators and their changes over time (2014–2021). The purpose of this joint description is mainly to provide an in‐country comparison of the values over the years, in order to identify policy needs and challenges. More detailed information on the data used for the indicators, along with statistical trend analyses for individual countries, can be found in the enhanced surveillance reports published by the respective agencies (ESVAC, 2021, 2022; ECDC, 2019a, 2020, 2021).
13. ANTIMICROBIAL CONSUMPTION AND PROPORTION OF COMPLETE SUSCEPTIBILITY IN ESCHERICHIA COLI
13.1. Antimicrobial consumption and complete susceptibility in Escherichia coli from food‐producing animals
Complete susceptibility (CS), in the context of this report and the analysis performed, refers to susceptibility to each of the substances in the standard panel of antimicrobials tested within the harmonised monitoring of AMR in bacteria from food‐producing animals in the EU (see Section 3.2.4).
To investigate the possible relationship between overall AMC and CS in commensal bacteria in food‐producing animals, the occurrence of CS to the common set of 14 antimicrobials tested for commensal indicator E. coli isolates from food‐producing animals was compared with the total AMC in food‐producing animals (expressed in mg per kg of estimated biomass) for the periods 2018–2019, 2019–2020 and 2020–2021 at the national level. As the mandatory monitoring of AMR foresees testing of the animal populations on a biennial basis, two consecutive years were considered together in all analyses. The category resistance in ‘food‐producing animals’ included broilers, turkeys, pigs and calves at slaughter for all periods. Data on CS and overall AMC were both available for 28, 26 and 26 countries for the three 2‐year periods. Similar results were observed for preceding 2‐year time intervals in the JIACRA III report.
There were marked variations in the levels of CS and the overall AMC among the countries (Figure 72). CS ranged between 80% in some countries and very low levels, or zero. Total AMC varied from a few mg per kg of estimated biomass to 300 or 400 mg/kg of estimated biomass in the time intervals.
FIGURE 72.

Total national AMC in food‐producing animals and the probability of complete susceptibility to the harmonised set of substances tested in indicator Escherichia coli isolates from food‐producing animals for 2018–2019, 2019–2020 and 2020–2021, EU/EEA (see Table 56). The figure displays results of logistic regression analyses. Bubbles represent the countries included in the analysis. The size of the bubbles indicates the amount of available resistance data per country.
For all intervals, significant negative associations of the same magnitude were observed between the probability of CS and the overall consumption of antimicrobials in food‐producing animals (Table 56). When considering the odds ratios across the different time intervals, it can be observed that there is no statistically significant increasing or decreasing trend in the odds ratios over time; therefore, the association between overall AMC and CS appears not to change over time.
TABLE 56.
Total national AMC in food‐producing animals (expressed in mg per kg of estimated biomass) and complete susceptibility to the harmonised set of substances tested in indicator Escherichia coli from food‐producing animals, EU/EEA, 2018–2021 (logistic regression, see Figure 72).
| Year | Country | Model | OR | p‐value | 95% CI |
|---|---|---|---|---|---|
| 2018–2019 | AT, BE, BG, CY, DE, DK, EE, EL, ES, FI, FR, HR, HU, IE, IS, IT, LT, LU, LV, MT, NL, NO, PL, PT, RO, SE, SI, SK (n = 28) | log | 0.58 | < 0.001 | 0.48–0.68 |
| 2019–2020 | AT, BE, BG, CY, DE, DK, EE, EL, ES, FI, FR, HR, HU, IE, IS, IT, LT, LV, NL, NO, PL, PT, RO, SE, SI, SK (n = 26) | log | 0.59 | < 0.001 | 0.50–0.71 |
| 2020–2021 | AT, BE, BG, CY, DE, DK, EE, EL, ES, FI, FR, HR, HU, IE, IS, IT, LT, LV, NL, NO, PL, PT, RO, SE, SI, SK (n = 26) | log | 0.59 | < 0.001 | 0.50–0.70 |
Abbreviations: CI, confidence interval; OR, odds ratio.
Note: OR varies from 0 to infinity. When OR equals 1 and CI includes 1, the association is not considered statistically significant. Food‐producing animals include broilers, turkeys, pigs and veal calves for all periods considered.
13.2. Antimicrobial consumption and proportion of susceptible Escherichia coli from humans
To complement the analyses of data from food‐producing animals, the proportion of human invasive E. coli susceptible to a defined antimicrobial panel including fluoroquinolones, third‐generation cephalosporins, aminoglycosides and carbapenems was compared with the total human AMC as DDD per 1000 inhabitants and day for 2019 to 2021. Statistically significant negative associations were reported between the total AMC for systemic use and E. coli susceptible to the defined panel for the included years (2019–2021) (Table 57, Figure 73).
TABLE 57.
Total national AMC in humans (expressed as DDD per 1000 inhabitants and day) and susceptibility to the harmonised set of substances* tested in Escherichia coli from humans, EU/EEA, 2019–2021 (logistic regression, see Figure 73).
| Year | Country | Model | OR | p‐value | 95% CI |
|---|---|---|---|---|---|
| 2019 | AT, BE, BG, CY, CZ, DE, DK, EE, EL, ES, FI, FR, HR, HU, IE, IS, IT, LT, LU, LV, MT, NL, NO, PL, PT, RO, SE, SI, SK (n = 29) | log | 0.54 | < 0.001 | 0.39–0.75 |
| 2020 | AT, BE, BG, CY, CZ, DE, DK, EE, EL, ES, FI, FR, HR, HU, IE, IS, IT, LT, LU, LV, MT, NL, NO, PL, PT, RO, SE, SI, SK (n = 29) | log | 0.50 | < 0.001 | 0.36–0.70 |
| 2021 | AT, BE, BG, CY, CZ, DE, DK, EE, EL, ES, FI, FR, HR, HU, IE, IS, IT, LT, LU, LV, MT, NL, NO, PL, PT, RO, SE, SI, SK (n = 29) | log | 0.46 | < 0.001 | 0.34–0.64 |
Abbreviations: CI, confidence interval; OR, odds ratio.
Note: OR varies from 0 to infinity. When OR equals 1 and CI includes 1, the association is not considered statistically significant.
*Fluoroquinolones, third‐generation cephalosporins, aminoglycosides and carbapenems.
FIGURE 73.

Total national AMC in humans and probability of complete susceptibility to the harmonised set of substances* tested in Escherichia coli from humans, EU/EEA, 2019–2021 (see Table 57). The figure displays the results of logistic regression analyses. Bubbles represent the countries included in the analysis. The size of the bubbles indicates the amount of available resistance data per country. *Fluoroquinolones, third‐generation cephalosporins, aminoglycosides and carbapenems. As the definition of complete susceptibility differs no integrated analysis could be performed.
13.3. Trends in overall antimicrobial consumption and complete susceptibility in Escherichia coli from 2014 to 2021 in humans and in food‐producing animals
Total consumption of antimicrobials in humans decreased significantly in most countries (19/25 included countries) between 2014 and 2021. Consequently, a significant increase in CS was observed in nine countries. In the other 16 countries, the proportion of fully susceptible isolates either did not change (11 countries) or decreased (5 countries). A significant increase in total AMC in humans was not observed in any country (Figure 74).
FIGURE 74.

Comparison of annual changes in total consumption in humans and complete susceptibility in E. coli isolates from humans, EU/EEA, 2014–2021. White zone: statistical difference in both the change in consumption and the change in resistance; dotted grey zone: non‐statistically significant difference in the change in consumption; grey zone: non‐statistically significant difference in the change in resistance.
In food‐producing animals, likewise, most countries registered a significant decrease in total AMC in food‐producing animals between 2014 and 2021 (20/26 included countries). In line with this, a significant increase in the proportion of isolates exhibiting CS was observed in 10 of those countries, while only two countries recorded a decrease. In eight countries, the proportion of completely susceptible isolates did not change significantly. A significant increase in consumption was observed in three countries, and two of those countries recorded an increase in CS (Figure 75).
FIGURE 75.

Comparison of annual changes in total consumption in food‐producing animals and complete susceptibility in Escherichia coli from food‐producing animals, EU/EEA, 2014–2021. White zone, statistical difference in both the change in consumption and the change in resistance; dotted grey zone, non‐statistically significant difference in the change in consumption; grey zone, non‐statistically significant difference in the change in resistance.
14. INTEGRATED ANALYSES OF TRENDS
In this report, for the first time a systematic comparative analysis of trends in AMC and AMR in E. coli from humans and animals was undertaken.
Table 58 gives a summary of the observed statistically significant trends on the national level in humans and food‐producing animals regarding increasing and decreasing trends in consumption of the individual antimicrobial groups in rows and AMR in E. coli in columns. The numbers in the fields reflect, how many countries showed the respective trends (or did not show significant trends). It also indicates the combination of trends in AMC and AMR, e.g. increases in AMC along with increases in AMR in E. coli. Overall, the table shows that in both sectors a negative trend in AMC is frequently accompanied by a negative trend in AMR. Of the 40 negative trends in consumption observed for antimicrobial groups in humans, 22 (55.0%) were accompanied by a negative trend in AMR and only 2 (5.0%) by a positive trend in AMR. Similarly, in food‐producing animals, of the 57 negative trends in AMC, 28 (49.1%) were accompanied by a negative trend in AMR and only 2 (3.5%) were accompanied by a positive trend in AMR.
TABLE 58.
Comparative analysis of trends in AMC and AMR in E. coli from humans and food‐producing animals, EU/EEA, 2014–2021 (cells represent numbers of MSs).
| In humans: | In food‐producing animals: | ||||||||||
|---|---|---|---|---|---|---|---|---|---|---|---|
| Carbapenems | AMR↓ | AMR→ | AMR↑ | Total | Carbapenems are not authorised for use in food‐producing animals in the EU and therefore, only carbapenem consumption in humans was analysed in this report. | ||||||
| AMC↓ | 0 | 2 | 0 | 2 | |||||||
| AMC→ | 0 | 9 | 3 | 12 | |||||||
| AMC↑ | 0 | 8 | 3 | 11 | |||||||
| Total | 0 | 19 | 6 | 25 | |||||||
| See also: | Figure 13 | ||||||||||
| Third‐ and fourth‐gen. cephalosporins | AMR↓ | AMR→ | AMR↑ | Total | Third‐ and fourth‐gen. cephalosporins | AMR↓ | AMR→ | AMR↑ | Total | ||
| AMC↓ | 1 | 1 | 0 | 2 | AMC↓ | 3 | 4 | 0 | 7 | ||
| AMC→ | 7 | 7 | 4 | 18 | AMC→ | 9 | 8 | 0 | 17 | ||
| AMC↑ | 0 | 3 | 2 | 5 | AMC↑ | 2 | 0 | 1 | 3 | ||
| Total | 8 | 11 | 6 | 25 | Total | 14 | 12 | 1 | 27 | ||
| See also: | Figure 22 | See also | Figure 23 | ||||||||
| Quinolones | AMR↓ | AMR→ | AMR↑ | Total | Quinolones | AMR↓ | AMR→ | AMR↑ | Total | ||
| AMC↓ | 8 | 8 | 2 | 18 | AMC↓ | 4 | 8 | 1 | 13 | ||
| AMC→ | 1 | 4 | 2 | 7 | AMC→ | 4 | 8 | 1 | 13 | ||
| AMC↑ | 0 | 0 | 0 | 0 | AMC↑ | 0 | 1 | 0 | 1 | ||
| Total | 9 | 12 | 4 | 25 | Total | 8 | 17 | 2 | 27 | ||
| See also: | Figure 40 | See also | Figure 41 | ||||||||
| As data on polymyxin resistance were not available for bacterial isolates from humans, corresponding analyses of related associations for humans or multivariate analysis could not be performed for this report | Polymyxins | AMR↓ | AMR→ | AMR↑ | Total | ||||||
| AMC↓ | 3 | 6 | 0 | 9 | |||||||
| AMC→ | 1 | 16 | 1 | 18 | |||||||
| AMC↑ | 0 | 0 | 0 | 0 | |||||||
| Total | 4 | 22 | 1 | 27 | |||||||
| See also | Figure 46 | ||||||||||
| Aminopenicillins | AMR↓ | AMR→ | AMR↑ | Total | Aminopenicillins | AMR↓ | AMR→ | AMR↑ | Total | ||
| AMC↓ | 13 | 5 | 0 | 18 | AMC↓ | 4 | 6 | 0 | 10 | ||
| AMC→ | 4 | 2 | 0 | 6 | AMC→ | 2 | 8 | 3 | 13 | ||
| AMC↑ | 0 | 0 | 0 | 0 | AMC↑ | 1 | 2 | 1 | 4 | ||
| Total | 17 | 7 | 0 | 24 | Total | 7 | 16 | 4 | 27 | ||
| See also: | Figure 55 | See also | Figure 56 | ||||||||
| As data on tetracycline resistance were not available for bacterial isolates from humans, corresponding analyses of related associations for humans or multivariate analysis could not be performed for this report. | Tetracyclines | AMR↓ | AMR→ | AMR↑ | Total | ||||||
| AMC↓ | 14 | 3 | 1 | 18 | |||||||
| AMC→ | 3 | 4 | 0 | 7 | |||||||
| AMC↑ | 1 | 1 | 0 | 2 | |||||||
| Total | 18 | 8 | 1 | 27 | |||||||
| See also | Figure 71 | ||||||||||
| In 4 antimicrob. groups* | AMR↓ | AMR→ | AMR↑ | Total | In 5 antimicrobial groups** | AMR↓ | AMR→ | AMR↑ | Total | ||
| AMC↓ | 22 | 16 | 2 | 40 | AMC↓ | 28 | 27 | 2 | 57 | ||
| AMC→ | 12 | 22 | 9 | 43 | AMC→ | 19 | 44 | 5 | 68 | ||
| AMC↑ | 0 | 11 | 5 | 16 | AMC↑ | 4 | 4 | 2 | 10 | ||
| Total | 34 | 49 | 16 | 99 | Total | 51 | 75 | 9 | 135 | ||
|
Overall AMC |
CS↓ | CS→ | CS↑ | Total |
Overall AMC |
CS↓ | CS→ | CS↑ | Total | ||
| AMC↓ | 4 | 6 | 9 | 19 | AMC↓ | 2 | 8 | 10 | 20 | ||
| AMC→ | 1 | 5 | 0 | 6 | AMC→ | 0 | 0 | 3 | 3 | ||
| AMC↑ | 0 | 0 | 0 | 0 | AMC↑ | 0 | 1 | 2 | 3 | ||
| Total | 5 | 11 | 9 | 25 | Total | 2 | 9 | 15 | 26 | ||
| See also | Figure 74 | See also | Figure 75 | ||||||||
Abbreviations: AMR, Antimicrobial resistance of Escherichia coli; AMC, Antimicrobial consumption; CS, Complete susceptibility of Escherichia coli (in humans based in specific antimicrobials [see Section 13.2], in food‐producing animal, based on a predefined panel of antimicrobials [See Section 13.1]).
↑: Statistically significant increase; ↓: statistically significant decrease; →: no statistically significant change.
Green numbers represent the number of countries with a statistically significant decrease in AMC which was combined with a simultaneously statistically significant decrease in AMR.
Red numbers represent the number of countries with a statistically significant increase in AMC which was combined with a simultaneously statistically significant increase in AMR at the country level.
Numbers in Grey cells represent the number of countries with a non‐statistically significant change in AMC/AMR in accordance to specific condition (AMC, AMR or both AMC/AMR).
Each number represents the total number of countries who fulfil the criteria for the specific condition in this table.
Ref: Reference to each Figure in the report with corresponding data.
a4 Antimicrobial groups: Carbapenems, third‐ and fourth‐generation cephalosporins, quinolones, aminopenicillins.
b14 Antimicrobials (food‐producing animals): third generation cephalosporins (cefotaxime, ceftazidime), meropenem, quinolones (ciprofloxacin, nalidixic acid), colistin, ampicillin, tetracyclines, gentamicin, chloramphenicol, sulfamethoxazole, trimethoprim, azithromycin, tigecycline).
Conversely, of the 16 countries with positive trends in AMC in humans, 5 (31.2%) also showed significant positive trends in AMR and none was associated with a negative trend in AMR. In food‐producing animals, however, only 20.0% of the countries with positive trends in AMC (2/10), also saw an increasing trend in AMR, while in 40% of cases, a negative trend in AMR was observed despite a positive trend in AMC.
The last set of rows in the table displays the associations of trends in total consumption of antimicrobials vs CS of E. coli from humans and food‐producing animals to a defined set of antimicrobials on the national level. As for the individual substances, a significant decreasing trend in total AMC is often accompanied by a significant decreasing trend in resistance, i.e. an increase in the proportion of CS. In the human sector, this was the case in 47.4% of cases (9/19), in food‐producing animals in 50.0% (10/20). However, in both sectors, negative trends in total consumption were sometimes accompanied by a reduction of the proportion of completely susceptible isolates. In humans this was found four times (21.1%), in food‐producing animals only twice (10.0%). Of the three countries, showing an increasing trend in total consumption in food‐producing animals, two also observed a decreasing trend in CS.
15. KEY FINDINGS AND DISCUSSION
The data for the years 2020 and 2021 included in this report coincide with the first years of the coronavirus disease (COVID‐19) pandemic. The initial overall decrease in antibiotic consumption in humans during the first phase of the pandemic has been attributed to non‐pharmaceutical interventions generally reducing the spread of pathogens, as well as disrupted access to healthcare services influencing prescription practices (ECDC, 2022a; Högberg et al., 2021). It is not known, whether there were also effects on food animal husbandry from the COVID‐19 pandemic.
15.1. Antimicrobial consumption in humans and food‐producing animals
Key findings
In 2021, humans consumed 38% of total antimicrobials consumed among both humans and food‐producing animals in 29 EU/EEA countries (expressed in tonnes of active substance), while representing 34% of the estimated combined biomass of both humans and food‐producing animals.
For most of the 29 EU/EEA countries, the population biomass‐corrected consumption seemed to be higher in humans than in food‐producing animals in 2021. However, due to limitations in the calculation of this measure, this finding should be interpreted with great care.
The mean AMC in food‐producing animals decreased by 44% between 2014 and 2021 (expressed in mg/kg of estimated biomass, for 26 countries that reported AMC for both human and food‐producing animals), while the mean consumption in humans in these 26 countries remained relatively stable during this period. During the last 3 years covered by this report (2019–2021), the mean AMC in the same 26 countries decreased by 0.5% in food‐producing animals and by 16.5% in humans (expressed in milligrams per kilogram of estimated biomass).
Discussion
The population‐weighted mean of the total consumption of antimicrobials in humans in 26 EU/EEA countries, expressed in mg/kg of estimated biomass, remained stable during 2014–2021 with aminopenicillins accounting for more than half of total consumption. However, the trend analyses in this report do not include missing data and completeness of AMC datareported for the human sector has increased over time.
ESAC‐Net reported a significant reduction in total consumption for humans between 2012 and 2021, however this reduction was seen in consumption expressed as ‘DDD per 1 000 inhabitants per day’ rather than ‘mg per kg of estimated biomass’ and with imputed data where AMC data were missing (i.e. total AMC or hospital AMC imputed for some countries during some years). When consumption is expressed as DDD per 1000 inhabitants per day, the main measure reported by ECDC's ESAC‐Net, population‐weighted mean of total consumption in humans consistently decreased annually since 2016 (ECDC, 2022a). The trends observed may reflect antimicrobial stewardship activities in EU/EEA countries, including awareness campaigns connected to the European Antibiotic Awareness Day since its introduction in 2008 (ECDC, 2019a; Peñalva et al., 2019).
The largest annual decrease in total consumption of antimicrobials in humans seen in ESAC‐Net's two‐decade history was between 2019 and 2020 (17% decrease in consumption expressed as DDD per 1000 inhabitants per day). Significant reductions in consumption in the community sector in 2020 were likely associated with alterations in disease epidemiology and healthcare delivery related to the COVID‐19 pandemic (Högberg et al., 2021). In 2021, EU/EEA total consumption for humans was similar to that in 2020, however half of the countries reporting community consumption had increases in their community consumption, indicating that the effects of the pandemic were waning (ECDC, 2022a).
ECDC's ESAC‐Net also saw a rise in the ratio of ‘broad’ to ‘narrow’ spectrum antibacterials for systemic use and large increases in consumption of broad‐spectrum and last‐line antimicrobials in the hospital sector, including carbapenems, third‐ and fourth‐generation cephalosporins, and polymyxins, which are included in this report. Increased consumption of these broad‐spectrum and last‐line antimicrobials are potentially associated with increases in AMR, though further investigation is needed to clarify the relationship between increases in consumption of these antimicrobials and increases in AMR. There were statistically significant reductions in the EU/EEA mean 10‐year trends (2012–2021) for quinolone consumption in both the hospital and community sectors (ECDC, 2022a). This reduction is likely a consequence of actions taken in 2018 by EMA to suspend the marketing authorisation of medicines containing certain quinolones and to restrict use of remaining fluoroquinolone antimicrobials due to disabling and potentially permanent side effects (EMA, 2023).
Between 2014 and 2021, the overall mean AMC in food‐producing animals decreased in 24 EU/EEA countries (range − 1.4%–62.5%), while for two consumption has increased (25.7% and 50.1%) (ESVAC, 2022).
The reduction in the overall mean AMC in food‐producing animals across 26 EU/EEA countries between 2014 and 2021 can be explained by a decrease in consumption of all antimicrobial groups (except aminoglycosides). The greatest reduction (in mg per kg estimated animal biomass) is observed for tetracyclines and penicillins, which account for 60% of the reduction during this period. AMC of those antimicrobial groups belonging to the AMEG Category B and also considered as HPCIA by WHO (i.e. polymyxins, fluoroquinolones and other quinolones, and third‐ and fourth‐generation cephalosporins) have also been in decline, contributing 14% to the overall AMC reduction in food‐producing animals during this period. The reduction in the consumption of tetracyclines has not been caused by a shift from high‐dose to low‐dose tetracyclines. The dosing for premixes is typically much higher than for the other group treatment pharmaceutical forms – i.e. oral powder and oral solution. For premixes and oral powders, the overall mean AMC in food‐producing animals across 26 EU/EEA countries declined substantially during the period 2014–2021, while for oral solutions it increased.
Generally, in many of the 26 EU/EEA countries there have been a variety of measures implemented which are assumed to have supported the decline in the consumption of antimicrobials for food‐producing animals. These include legal actions as well as measures taken by the industry, increased focus on prevention of bacterial diseases; implementation of national action plans to reduce the occurrence of resistance; campaigns to promote prudent use of antimicrobials; restrictions on use of certain antimicrobials in food‐producing animals; prescription control measures; awareness‐raising regarding the threat of AMR and antibiotic stewardship; setting up benchmarking systems and/or the setting of targets for reduction of sales (ESVAC, 2022). The focus of the measures varied between countries, but in most cases, measures were followed by substantial reductions once they were put in the focus.
While there was no significant association of overall consumption on a national level between the human and the animal sector, such an association was observed for four of the six antimicrobial groups included in this report (fluoroquinolones and other quinolones, polymyxins, aminopenicillins and macrolides). These relationships could influence the associations found in analyses of consumption and resistance across animal and human sectors.
15.2. Carbapenems
Key findings
In 2021, the EU/EEA population‐weighted mean consumption of carbapenems was 0.067 DDD per 1000 inhabitants per day in humans. Significant associations were found between the consumption of carbapenems and resistance to carbapenems in invasive K. pneumoniae and E. coli in the human sector.
The use of carbapenems is prohibited in animals in the EU and resistance to carbapenems in food‐producing animals is rare. Associations between carbapenem consumption and resistance in food‐producing animals and resistance in humans were hence not studied and no attempt was made to fit a multivariate model to the data.
More countries registered an increase in AMC of carbapenems than a decrease. One in four countries experienced a significant increase in carbapenem resistance of E. coli, whereas no country documented a significant decrease in carbapenem resistance of E. coli. As consumption of carbapenems was close to zero at the beginning of the observation period in many countries, a significant decrease in consumption could not be expected.
Discussion
Carbapenems belong to an important antimicrobial group in human medicine, being almost exclusively used in hospitals and for treatment of serious infections caused by MDR Gram‐negative bacteria.
The increase in carbapenem‐resistant bacteria in the EU/EEA is a cause for concern (ECDC, 2022b), as infections with these bacteria are associated with high mortality, primarily due to delays in the administration of effective treatment and the limited availability of treatment options. ECDC's study on the health burden of AMR concluded that even in countries with lower levels of carbapenem‐resistant bacteria, the impact on the national health burden is significant because of the high mortality and considerable impact on the disability‐adjusted life years (DALY) attributed of these infections (ECDC, 2022c).
Interventions aiming to reduce further emergence and spread of carbapenem‐resistant bacteria, including timely and appropriate diagnosis, high standards of infection prevention and control (IPC) and antimicrobial stewardship are of great importance in order to prevent further deterioration of the situation (Magiorakos et al., 2017; WHO, 2017). Positive associations between human carbapenem consumption and carbapenem resistance in human E. coli and K. pneumoniae isolates presented in this report, as well as similar findings in previous JIACRA reports (ECDC, EFSA and EMA, 2015; 2017b, 2021), underline the importance of prudent antibiotic use as an important component of a comprehensive public health response. Healthcare settings provide an environment with a high selection pressure due to antimicrobial use favouring carbapenem‐resistant and MDR bacteria, of which spread is further facilitated by poor IPC practices.
Carbapenems are not authorised for use in animals in the EU. Therefore, in EMA's AMEG categorisation, carbapenems belong to Category A, with the designation ‘Avoid’ use in veterinary medicine in the EU (AMEG, 2019). The use of these antimicrobials in animals in the EU is prohibited since 2022 (Official Journal of the European Union, 2022b). Under Commission Implementing Decision 2013/652/EU, EU‐wide monitoring of food‐producing animals for carbapenem‐resistant E. coli was undertaken on a voluntary basis but this became mandatory as of 1 January 2021, in accordance with Commission Implementing Decision (EU) 1729/2020 (Official Journal of the European Union, 2020).
Overall, in 2020 and 2021, 14 E. coli with elevated MIC to meropenem were detected by four countries among all samples and isolates from animals and meat derived thereof. These were investigated within the harmonised monitoring by phenotypic methods, and another 29 carbapenem‐resistant isolates were detected by two countries using whole genome sequencing (WGS). In particular, in 2020, four such isolates were detected in broilers and one in a turkey by three countries either within the specific monitoring of carbapenemase‐producing E. coli or within the specific monitoring of ESBL/AmpC‐producing E. coli. In 2021, two carbapenem‐resistant isolates were reported by one country in fattening pigs within the specific monitoring of carbapenemase‐producing E. coli, and 29 isolates were detected by two countries from fattening pigs (24 isolates) and calves (five isolates) using WGS. In addition, in 2021, five isolates were detected from bovine meat and two from pig meat by one country (EFSA and ECDC, 2023).
Although the total number of suspected carbapenemase‐producing E. coli (CPE) isolated within the monitoring is still low, there has been an increase in numbers compared with the previous years (EFSA and ECDC, 2023). This increased reporting can be related to the use of WGS as WGS might also detected CPE that do not show phenotypical resistance.
The occurrence of carbapenemase‐producing E. coli among farm animals and meat derived thereof in several countries is of concern. Due to the public health importance of carbapenem‐resistant E. coli and/or Salmonella, both as pathogens and as vectors for resistance mechanisms, there is a need to follow up possible further developments in this area for farm animals and food derived thereof. WGS seems to have detected more carbapenemase‐producing E. coli isolates than phenotypic methods, even though only four countries reported molecular data (Carfora et al., 2022). The authorisation of WGS as an alternative method to phenotypic testing will likely increase the detection rates (Official Journal of the European Union, 2020).
15.3. Third‐ and fourth‐generation cephalosporins
Key findings
In 2021, the EU/EEA population‐weighted mean consumption of third‐ and fourth‐generation cephalosporins was 5.1 mg/kg estimated biomass in humans and 0.2 mg/kg of estimated biomass in food‐producing animals.
Total AMC of third‐ and fourth‐generation cephalosporins in humans was significantly and positively associated with resistance to third‐generation cephalosporins in invasive E. coli from humans.
Significant positive association was observed between the consumption of cephalosporins in food‐producing animals and the key indicator of the proportion of samples positive for ESBL‐/AmpC‐producing E. coli (prevalence of ESBL‐/AmpC‐producing E. coli) in food‐producing animals.
The multivariate analysis showed that the only significant relationship retained in the final model of resistance to third‐generation cephalosporins in invasive E. coli from humans was the strong direct impact of the consumption of these groups of antimicrobials in humans.
Between 2014 and 2021 consumption of third‐ and fourth‐generation cephalosporins did not change significantly in humans nor in food‐producing animals.
The trend analysis in humans indicated a significant increase in AMC of third‐ and fourth‐generation cephalosporins in five countries as opposed to two countries with a decrease over time. AMR in E. coli from humans increased significantly in six countries while eight countries recorded a decrease in AMR in E. coli from humans to these substances. In contrast, in food‐producing animals, more countries (seven) observed a significant decrease in AMC rather than an increase (three countries). Similarly for AMR, more countries (14) showed a decrease rather than an increase (one country).
Discussion
Resistance to third‐generation cephalosporins in invasive E. coli from humans was found to be mostly related to the human consumption of third‐ and fourth‐generation cephalosporins. This is in line with the expected higher impact of direct exposure within the population to the antimicrobial, compared to exposure to resistant bacteria from other exposed populations. This reinforces the need to use third‐ and fourth‐generation cephalosporins judiciously, not only in veterinary but also in human medicine (ECDC, 2014; Tacconelli et al., 2020).
Combinations of third‐ and fourth‐generation cephalosporins with beta‐lactamase inhibitors were never licensed for food‐producing animals and have been banned from use in animals since 2022 (Official Journal of the European Union, 2022b). Likewise, ceftobiprole and ceftaroline which are fifth‐generation cephalosporins are prohibited for use in animals (Official Journal of the European Union, 2022b). In addition, no medicines containing these active substances have been approved for use in poultry, neither as premixes, oral powders, nor as oral solutions. This limits the potential group treatments in food‐producing animals (ESVAC, 2022; EMA, CVMP and SAGAM, 2009; EMA and CVMP, 2012).
In a population‐based modelling study performed in the Netherlands, community acquisition of ESBL and plasmid‐mediated AmpC production in E. coli isolates in humans was mainly driven by human‐to‐human transmission. However, one third of the direct transmission was attributable to non‐human sources such as food, animal and environmental sources (Mughini‐Gras et al., 2019). Similarly, a recent study using the One Health approach assessed the risk factors for community acquired urinary tract infections in humans caused by ESBL‐producing E. coli. This cross sectional study conducted in France found that fluoroquinolone and tetracycline use, overcrowded households, preschool‐aged children and poultry density play a role in the epidemiology of community acquisition of ESBL‐producing E. coli isolates in humans (Goyal et al., 2019).
Nevertheless, within hospitals, the spread of ESBL‐producing Enterobacterales through patient‐to‐patient transmission may cause outbreaks and adherence to established infection control measures for MDR bacteria is needed (ECDC, 2014). Hygiene and cleaning practices may also decrease household transmission of ESBL‐producing bacteria especially with children of preschool age (Haverkate et al., 2017; Van den Bunt et al., 2016).
An association was found between the consumption of third‐ and fourth‐generation cephalosporins and the key indicator of prevalence of ESBL‐/AmpC‐producing E. coli in food‐producing animals. This indicates that the selective isolation approach may be more sensitive for detecting the impact of cephalosporin consumption on cephalosporin resistance, explaining the observed association.
ESBL/AmpC‐encoding genes also provide resistance specifically to aminopenicillins, suggesting that use of aminopenicillins may also select for bacteria harbouring such genes. Moreover, the genes encoding ESBL/AmpC production tend to be located on mobile genetic elements that also may harbour genes encoding resistance to other antimicrobials (Darphorn et al., 2021). Further analyses of the association between consumption of aminopenicillins, and of non‐beta‐lactam antimicrobials, could provide a better understanding of factors influencing the prevalence of ESBL/AmpC‐encoding genes. However, this is beyond the scope of the present report as we only investigated the direct association of the consumption of an antimicrobial group and resistance to antimicrobials from this group and decided not to study cross or co‐resistance.
Use in food‐producing animals occurs not only in meat‐producing animals (excluding poultry) but in the case of cattle also in dairy cows, where cephalosporins can be used in the treatment of mastitis (Merle et al., 2012) or for other conditions, such as metritis or respiratory disease (EMA and CVMP, 1999). Enteric bacteria from young calves (0–2 months of age) that may be exposed to cephalosporins via waste milk (i.e. milk that may not be sold for human consumption after cows have been treated with antimicrobials) (EFSA, 2017) have been shown to have very high resistance rates to third‐generation cephalosporins (Tenhagen et al., 2020). However, these animals do not enter the food chain at that age and their enteric flora changes as they age. Milk is commonly heat‐treated before being marketed for consumption, i.e. even if it contains E. coli resistant to third‐generation cephalosporins these will be eliminated by heat treatment (Tenhagen et al., 2020). Detailed investigation of AMC and AMR data by animal species, age and production type would therefore be optimal. However, there are also complicating factors in some countries. For example, a certain amount of third‐ and fourth‐generation cephalosporins may also be used in the treatment of companion animals, (Hur et al., 2020; Méndez & Moreno, 2020) especially cats (Mateus et al., 2011), i.e. animals that are not producing food and not included in the resistance monitoring. This further adds to the differences between the treated animal population and the population where AMR is monitored. The use of these substances in animal populations that are not included in the AMR data may have contributed to the observed lack of association between AMC and AMR for food‐producing animals. Consumption of third‐ and fourth‐generation cephalosporins should ideally continue to be low in food‐producing animals in order to avoid an increase in AMR similar to that recorded in humans.
The inconsistency in lack of association between resistance to third‐generation cephalosporins in humans and food‐producing animals and the significant association of AMC in food‐producing animals and AMR in bacteria from humans cannot be explained by the data as the association of consumption in food‐producing animals with consumption in humans was only borderline significant. However, in the multivariate model, this latter was not confirmed. There are also differences for consumers in the degree of exposure to resistant bacteria derived from the different ages, groups and production types of animals. Moreover, exposure to resistant bacteria via the food chain is also dependent on standard food hygiene procedures, such as slaughterhouse practices or pasteurisation of milk and dairy products.
15.4. Fluoroquinolones and other quinolones
Key findings
In 2021, the EU/EEA population‐weighted mean consumption of fluoroquinolones and other quinolones was 6.3 mg/kg estimated biomass in humans and 2.9 mg/kg of estimated biomass in food‐producing animals.
There was a significant association between the consumption of fluoroquinolones and other quinolones in humans and in food‐producing animals at the national level. The consumption of fluoroquinolones has decreased significantly in both humans and food‐producing animals in the period 2014 to 2021, with a particularly marked decrease in humans from 2018 onwards.
Consumption of fluoroquinolones and other quinolones in humans was significantly associated with resistance to fluoroquinolones in invasive E. coli and C. jejuni from humans.
There was a significant positive association between consumption of fluoroquinolones and other quinolones in food‐producing animals and resistance in E. coli from food‐producing animals (SIMR). In poultry, a significant association between consumption and resistance was observed in E. coli and C. jejuni. In pigs, a significant association was detected in E. coli and C. coli.
A significant positive association between fluoroquinolone resistance in isolates from food‐producing animals and from humans was observed for E. coli (all food‐producing animals) and C. jejuni (only data from turkeys).
In the multivariate analysis on E. coli, the association between consumption of fluoroquinolones and other quinolones in food‐producing animals and resistance in commensal E. coli from food‐producing animals was highly significant. Similarly, the association between the consumption of fluoroquinolones and other quinolones in humans and resistance in invasive E. coli from humans was highly significant.
For C. jejuni, a significant association was observed between resistance to fluoroquinolones in poultry and in humans in the multivariate analysis. The resistance in food‐producing animals was significantly correlated with consumption in food‐producing animals.
For C. coli, the only significant association was between consumption in food‐producing animals and resistance in pigs.
A significant decreasing trend in the consumption of fluoroquinolones and quinolones between 2014 and 2021 was observed in both human and food‐producing animal populations over the study period.
In humans, a concurrent significant decrease both in AMC and in AMR in E. coli between 2014 and 2021 was observed in eight countries, while a concurrent increase was not observed in any country. In food‐producing animals, a concurrent significant decrease both in AMC and AMR in E. coli was observed in four countries, while a concurrent increase was not observed in any country.
Discussion
Fluoroquinolones have been classified as HPCIA (WHO, 2019) and their use should be restricted in food‐producing animals (AMEG, 2019). In food‐producing animals, quinolones are among the few alternatives for treatment of diarrheas in piglets (E. coli) or severe (life threatening) sepsis with Enterobacterales in various animal species. In humans, fluoroquinolones are used for the treatment of infections with both Gram‐positive and Gram‐negative bacteria, including E. coli infections and serious infections caused by Streptococcus pneumoniae, Salmonella spp. and Campylobacter spp. Since 2019, however, their use in human medicine has been restricted due to the risk of disabling, long‐lasting and potentially irreversible side effects (Sanchez, 2013). The marketing authorisations of medicines containing certain quinolones have been suspended while for others, stricter recommendations on their correct use are promoted.
Other quinolones were not commonly used and when used, this was mainly in food‐producing animals. The observed reduction in fluoroquinolone consumption in humans is most likely attributed to the recommendations from EMA's safety committee (PRAC), endorsed by EMA's human medicines committee (CHMP) to restrict its use in humans, although some effects of the COVID‐19 pandemic in reduced access to healthcare may also have contributed.
The significant association observed between the consumption of fluoroquinolones and other quinolones in humans and in food‐producing animals indicates that a country having a high consumption in one sector would tend to have a high consumption in the other, and vice versa. The reason for this association is not clear. It seems likely that countries either make efforts to restrict the use of fluoroquinolones in both sectors or they do not. However, more research into national policies is needed to understand this association.
Consumption of fluoroquinolones and other quinolones in humans was significantly associated with resistance to fluoroquinolones in invasive E. coli, as could be expected and has been found in previous studies (Durham et al., 2010; ECDC, EFSA and EMA, 2015; Gallini et al., 2010; Jensen et al., 2010) and the previous JIACRA report. Most of the consumption of fluoroquinolones occurs in the community. The association between the consumption of fluoroquinolones and other quinolones and the resistance of invasive E. coli might be explained by the high proportion of community‐associated infections reported for this bacterium (Heuer et al., 2014).
Most Campylobacter infections in humans are attributed to animal sources, especially broiler meat (Cody et al., 2019; Rosner et al., 2017), and guidelines do not advocate routine treatment of such infections with antimicrobials. In line with the food‐borne origin of the infections, a significant association between fluoroquinolone resistance in C. jejuni from turkeys and from humans was found. However, a significant association was also observed between consumption of fluoroquinolones and other quinolones in humans and resistance to fluoroquinolones in C. jejuni from humans. This association was however not confirmed in the multivariate model.
There was a significant positive association between consumption of fluoroquinolones and other quinolones in food‐producing animals and resistance in E. coli from all food‐producing animals taken together (SIMR), as well as from poultry and pigs, when considered separately. Strong associations between consumption of fluoroquinolones and other quinolones and resistance in E. coli have been described previously in national (Gallini et al., 2010; Jensen et al., 2010) and international ecological studies (ECDC, EFSA and EMA, 2015; Durham et al., 2010) and are in line with the findings of this study. It should be noted that the level of resistance differed substantially between poultry on the one hand and pigs and calves on the other, with much higher fluoroquinolone resistance observed in poultry (EFSA and ECDC, 2023). This is in line with expectations based on the AMC of fluoroquinolones, which is substantially higher in poultry than in pigs and calves (e.g. in Germany (Flor et al., 2018) and France (ANSES, 2018; Roth et al., 2019) and has been demonstrated previously (ECDC, EFSA and EMA, 2017b). The association was confirmed in the multivariate analysis.
In poultry, this association with fluoroquinolone and other quinolone consumption was also seen with resistance of C. jejuni, again in line with previous results. In pigs, a significant association was found between fluoroquinolone and other quinolone consumption and resistance of C. coli.
A significant positive association between fluoroquinolone resistance in isolates from food‐producing animals and invasive E. coli from humans was observed for E. coli (all food‐producing animals). There was also a significant positive association between consumption of fluoroquinolones and other quinolones in food‐producing animals and resistance in E. coli and in C. jejuni from humans. This is plausible for C. jejuni because of the food‐borne nature of the infections, and it is confirmed by the strong association of resistance in food‐producing animals and resistance in humans. The reasons for the association with respect to E. coli are less clear. Again, an artefact caused by the associations of consumption in humans and food‐producing animals cannot be excluded (see above). However, the effect, mediated through the resistance in E. coli from food‐producing animals, was not observed in the multivariate model.
The trend in AMC and AMR in humans and food‐producing animals was negative, i.e. more countries significantly reduced the AMC and AMR than countries that increased AMC and/or AMR. This is in line with the EU policy of reducing AMC and AMR and indicates that, for fluoroquinolones and other quinolones efforts have been successful over time, although there are still exceptions to the rule.
15.5. Polymyxins
Key findings
In 2021, the EU/EEA population‐weighted mean consumption of polymyxins (colistin) was 0.7 mg/kg estimated biomass in humans and 2.5 mg/kg of estimated biomass in food‐producing animals.
Statistically significant positive associations have been found between the consumption of polymyxins in food‐producing animals and resistance to colistin in indicator E. coli from food‐producing animals for the time periods 2018–2019 and 2019–2020.
In poultry, consumption of polymyxins and resistance to colistin in indicator E. coli were significantly associated in 2020 (the single year analysed for this report). For pigs, the association was statistically significant in 2019 but not in 2021.
The availability of data on the susceptibility of human E. coli isolates to colistin was limited in the data sources used for this report; therefore, no investigation of the related associations between consumption and resistance or multivariate analyses have been performed.
The consumption of polymyxins in food‐producing animals has declined substantially between 2014 and 2021, particularly in some high‐using countries, whereas consumption has increased in the human sector.
In food‐producing animals, from 2014 to 2021, there was a statistically significant trend in reduction in the consumption of polymyxins in nine countries and in three of these countries, this was accompanied by a significant trend in reduction in resistance in E. coli isolates. In many countries, the levels of colistin resistance in E. coli isolates from food‐producing animals have remained low/very low over this period; therefore, a significant trend in reduction in resistance may not be detected.
Discussion
The consumption of colistin in human medicine (DDD per 1000 inhabitants per day) was very low compared with the overall consumption of other antimicrobial groups (< 1%). However, the EU/EEA population‐weighted mean consumption of polymyxins in the hospital sector has increased substantially between 2012 and 2021, from 0.007 to 0.011 DDD per 1000 inhabitants per day, with a statistically significant increase in seven countries (ECDC, 2022a). Usage is highest in southern European countries (e.g. Greece, Spain) where infections due to carbapenem‐resistant Enterobacterales (CRE) have become a serious healthcare problem and are associated with prolonged hospitalisation and increased risk of mortality (ECDC, 2016, 2018b; Monaco et al., 2014; Mezzatesta et al., 2011; Weterings et al., 2015; Parisi et al., 2015). Options for the treatment of colistin and carbapenem‐resistant Enterobacterales (CCRE) are extremely limited.
In the animal sector, colistin has been used for several decades, mostly as an oral group treatment, with a recent survey showing that the most important indications are gastrointestinal diseases (predominantly due to E. coli) in pigs followed by septicaemia in poultry (Jansen et al., 2022). Consumption for use in food‐producing animals in 2021 varied markedly between reporting countries (range 0–12.7 mg/PCU) with five EU/EEA countries reporting no consumptions (ESVAC, 2022). This variation cannot be directly linked to predominance of specific animal species or husbandry systems in different countries (AMEG, 2016). Colistin is categorised as a critically important antimicrobial recognising its use as last resort for serious human infections (AMEG, 2019; WHO, 2019), which is why its use in food‐producing animals has come under examination. Following the discovery of a horizontally transferable mechanism of resistance (MCR‐1) in 2015, EMA proposed targets for the reduction of colistin consumption to 5 mg/PCU for high and moderate consumer countries and 1 mg/PCU for other consumption, to be achieved by 2020 (AMEG, 2016). Restrictions on the use of polymyxins in livestock, including requirements for use to be based on susceptibility testing and bans from use in certain sectors, have been introduced by both industry and governments. In 2021, 23 EU/EEA countries reported consumption of < 5 mg/PCU with 15 of these countries having consumption below the more conservative target of 1 mg/PCU (ESVAC, 2022). ESVAC reported that between 2011 and 2021 the consumption of polymyxins had declined by 79.5% in the 25 countries that provided data over the period, with most of the reduction occurring from 2016 onwards (ESVAC, 2022). The new EU regulations on veterinary medicinal products (EU) 2019/6 and medicated feed (EU) 2019/4, which became applicable in February 2022, introduced a ban on the prophylactic administration of antimicrobials to groups of food‐producing animals and may have a further impact on colistin use.
There was a significant association between the consumption of polymyxins in humans and in food‐producing animals at the national level; however, in general, in 2021 the countries with the highest consumption in food‐producing animals were not the same as for humans.
Mutational colistin resistance has long been recognised in animal isolates; in many cases the mechanisms are unstable, potentially explaining why historically levels of resistance remained low (AMEG, 2016). Following identification of the plasmid‐mediated mcr‐1 gene in 2015, other mcr genes (mcr‐2 to mcr‐10) have been reported in Enterobacterales (AbuOun et al., 2017; Borowiak et al., 2017; Carattoli et al., 2017; Carroll et al., 2019; Wang et al., 2018; Wang, Feng, et al., 2020; Xavier et al., 2016; Yang et al., 2018; Yin et al., 2017) and retrospective analysis of strain collections showed that mcr genes had already existed in E. coli from food‐producing animals for several years (Irrgang et al., 2016). Mcr genes have been found in similar plasmids in the same bacterial species isolated from food‐producing animals, food, humans and the environment, indicating the possibility for transmission between the compartments (Lima et al., 2019; Skov & Monnet, 2016). A recent study identified indistinguishable MDR E. coli ST744 harbouring mcr‐1 from humans and dogs in the same household; however, studies in Germany in turkeys, pigs and farm personnel did not identify clonality between the human and animal mcr‐1‐positive E. coli isolates from the same farms (Effelsberg et al., 2021; Menezes et al., 2022; Nordhoff et al., 2023). Due to lack of data on the human side the potential association of resistance in isolates from food‐producing animals and isolates from humans cannot yet be estimated in this JIACRA report.
The overall EU level of colistin resistance in indicator E. coli isolates from all animal origins has remained very low at 1.1% in 2020–2021. Although most countries did not detect resistance at all, individual countries reported levels of colistin resistance up to 3.0% in E. coli isolates from pigs, 10.1% in broilers and 23.9% in turkeys. At the Member State group level, over the period from 2014 to 2021, statistically significant decreasing trends in resistance were observed in isolates from broilers and calves while there was no change for pigs and turkeys (EFSA and ECDC, 2023).
Despite the low levels of resistance in isolates from food‐producing animals, in our analysis a significant positive association was found between the consumption of colistin in food‐producing animals and resistance to colistin in indicator E. coli from food‐producing animals for the time periods 2018–2019 and 2019–2020. This association became borderline significant for the period 2020–2021. The positive association is consistent with that identified in previous JIACRA reports. When analysed by species, the association was significant for poultry in 2020, as had been found in previous analyses for 2016 and 2018. In pigs, as for 2017, the association was statistically significant in 2019; however, no significant association was found in 2021. The trend analysis showed a statistically significant trend in the reduction of consumption of polymyxins in food‐producing animals in nine countries over the period from 2014 to 2021. This was associated with a trend in reduction of resistance in indicator E. coli from food‐producing animals which was statistically significant in three countries. Taken overall, these observations suggest that there is a potential to reduce the resistance levels in E. coli through measures to reduce consumption of colistin. However, the persistence of resistance may also be dependent on the influence of factors such as co‐selection by other antimicrobials and the fitness cost of resistance mechanisms such as MCR‐1 (Sundqvist, 2014). The co‐occurrence of ESBL genes (including bla CTX‐M‐15, more typically associated with human E coli strains) with mcr‐1 on plasmids in E coli isolates from animal sources has been demonstrated, and in in vitro studies mcr genes can be co‐selected by third‐generation cephalosporins (Shafiq et al., 2019; Zhang et al., 2019). Encouraging findings were reported following the withdrawal of colistin as an antimicrobial growth promoter by China in 2017, where epidemiological studies showed that the substantial reduction in sales of colistin in food‐producing animals was rapidly followed by a significant reduction in the prevalence of mcr‐1 in E. coli in both the animal and human sectors (Wang et al., 2020). Studies in other geographical regions have demonstrated similar benefits from One Health policy interventions restricting the use of colistin in livestock (Rhouma et al., 2023).
Mandatory monitoring in the EU under Commission Implementing Decisions 2013/652/EU and (EU) 2020/1729 is based on phenotypic susceptibility and does not discriminate between different colistin resistance mechanisms. Molecular testing is required to confirm the underlying mechanisms of resistance and to gain a better understanding of the epidemiology of E. coli carrying the mcr gene in food‐producing animals (Irrgang et al., 2016), including potential transmission to humans. However, several studies have shown that overall, mcr genes contribute substantially to the level of phenotypic resistance to colistin in E. coli from food‐producing animals (Irrgang et al., 2016).
Data on resistance to polymyxins in human isolates are not included in this report. Due to the absence of routine testing for susceptibility to colistin in many countries and inconsistent use of the EUCAST‐recommended methods, EARS‐Net data are still not considered suitable for polymyxin susceptibility surveillance. Efforts are needed to overcome this deficit and to enable a better understanding of the potential association of polymyxin resistance in isolates from humans and food‐producing animals. In response to the need for enhanced surveillance of CCRE, a project has been established as part of EURGen‐Net. In the future, this project will determine colistin resistance mechanisms through genomic methodologies (ECDC, 2018c).
15.6. Aminopenicillins
Key findings
In 2021, the EU/EEA population‐weighted mean consumption of aminopenicillins was 64.1 mg/kg estimated biomass in humans and 25.8 mg/kg of estimated biomass in food‐producing animals. Aminopenicillins with beta‐lactamase inhibitors were mainly used in the human sector.
There was a significant association between the consumption of aminopenicillins in humans and in food‐producing animals at the national level.
In humans, a statistically significant association was found between consumption of aminopenicillins (with or without beta‐lactamase inhibitors) and resistance of E. coli to aminopenicillins for the years 2019–2021.
In food‐producing animals, statistically significant associations between consumption of aminopenicillins and resistance to aminopenicillins in E. coli (SIMR) were found over the study periods. In pigs and in poultry, significant associations were found between estimated consumption per species and resistance to aminopenicillins in indicator E. coli for all the years.
A significant association was found between aminopenicillin resistance in E. coli from humans and in indicator E. coli from pigs (2019, 2021), calves (2019), broilers and turkeys (2020).
Statistically significant positive associations were found between consumption of aminopenicillins in food‐producing animals and resistance to aminopenicillins in invasive E. coli from humans for all 3 years.
In the multivariate analysis for E. coli, the consumption of aminopenicillins in food‐producing animals was significantly related to resistance in food‐producing animals which was significantly related to resistance in invasive E. coli from humans.
Consumption of aminopenicillins in humans decreased significantly (p < 0.001) between 2014 and 2021. In food‐producing animals, consumption did not change significantly in that period.
All reporting countries showed a negative trend in consumption in humans, which was significant in the majority of countries (18/24). In most of those countries with a negative trend in consumption, a negative trend in resistance could also be observed. Likewise, four countries with a non‐significant decrease in consumption still had a significant decrease in resistance. A significant increase in consumption and/or resistance was observed in no country.
In food‐producing animals, more countries experienced a significant trend in decrease in consumption than an increase (10 vs. 4) from 2014 to 2021. Likewise, resistance was reduced more frequently than it increased (7 vs. 4). In only one country consumption increased and at the same time an increase in AMR was observed.
Discussion
In humans, aminopenicillins with and without beta‐lactamase inhibitors were the most commonly used penicillins at the EU/EEA level, as well as in most countries (ECDC, 2022a). In most of the antimicrobial stewardship programmes, aminopenicillins are preferred (i.e. for respiratory tract infections) to other antimicrobial agents with broader antimicrobial spectrum, such as cephalosporins or fluoroquinolones, contributing to the high consumption in human medicine. In the present report, data on human consumption for aminopenicillins with and without enzyme inhibitors were included in the univariate as well as the multivariate analyses, whereas in the JIACRA III report only aminopenicillins without enzyme inhibitors were included in the univariate analysis. Therefore, the results of the two reports are not always comparable.
The explanation for the significant association observed between the consumption of aminopenicillins in humans and in food‐producing animals could be similar to that for fluoroquinolones and other quinolones. A country with a high aminopenicillin consumption in one sector is more likely to also be observed to have a high aminopenicillin consumption in the other sector, and vice versa. This has to be considered when analysing the results of the association of consumption with resistance as it may mask existing associations or evoke statistical associations that have no biological correlate. The reason for this association is not clear. It seems likely that the level of effort to restrict the use of aminopenicillins that countries made is similar in both sectors. However, more research into national policies is needed to understand this association.
A high level of resistance to aminopenicillins in E. coli isolates from humans has been documented for all EU/EEA countries and this has been the case for years (ECDC, n.d.). In particular, more than half of the E. coli isolates reported for 2021 (EARS‐Net) were resistant to at least one of the antimicrobial groups under regular surveillance and aminopenicillin resistance was present in over 90% of the single or multiple resistant phenotypes (ECDC, 2019b). In the univariate analysis, a significant association was found between the occurrence of aminopenicillin resistance in invasive E. coli from humans and consumption of aminopenicillins in humans across the different countries. However, in the multivariate analysis, aminopenicillin resistance in E. coli from humans was not correlated to aminopenicillin consumption in human healthcare. This could be explained by several factors, including the high level of aminopenicillin resistance in all EU/EEA countries with limited variation between countries, although there were substantial differences in aminopenicillin consumption.
Resistance to aminopenicillins is also very frequently found in indicator E. coli from food‐producing animals. In this report, we found significant associations between aminopenicillin consumption and aminopenicillin resistance, mainly in indicator E. coli from food‐producing animals. This is in line with the findings of a previous study conducted on a small data set of seven EU countries. In this study, the level of aminopenicillin consumption strongly correlated with the level of aminopenicillin resistance in commensal E. coli isolates in pigs, poultry and cattle at the national level (Chantziaras et al., 2014) and with a reduction in aminopenicillin resistance in countries where AMC in food‐producing animals decreased in recent years (Hesp et al., 2019).
In both univariate and multivariate analyses, aminopenicillin resistance in E. coli isolates from humans was associated with aminopenicillin resistance in indicator E. coli from food‐producing animals, as well as consumption of aminopenicillins in food‐producing animals. This is in line with current evidence, that humans and food‐producing animals may share identical beta‐lactamase‐producing Enterobacterales, suggesting interspecies transfer (EFSA BIOHAZ Panel, 2011; Hammerum et al., 2014; Marques et al., 2018; Pomba et al., 2017).
The observation of a reduction in resistance to aminopenicillins in countries that decreased consumption of aminopenicillins in humans is encouraging. In food‐producing animals, the consumption did not decrease significantly on the European level, in contrast to the consumption of many other antimicrobials. The reason for this has to be thoroughly analysed.
15.7. Macrolides
Key findings
In 2021, the EU/EEA population‐weighted mean consumption of macrolides was 6.2 mg/kg estimated biomass in humans and 7.8 mg/kg of estimated biomass in food‐producing animals.
No statistically significant association was found between the consumption of macrolides in humans and the occurrence of macrolide resistance in C. jejuni or C. coli from humans.
A statistically significant positive association was observed between the consumption of macrolides in pigs and resistance to macrolides in C. coli from pigs. No statistically significant association was observed between the consumption of macrolides in poultry and resistance to macrolides in C. jejuni from poultry.
In the multivariate analyses, a statistically significant association was seen for the consumption of macrolides in pigs, the resistance to macrolides in C. coli from pigs and the resistance to macrolides in C. coli from humans. About half of the variance was explained by this latent variable.
Over the period 2014–2021, the overall EU/EEA consumption of macrolides decreased significantly in humans and with a less marked trend in food‐producing animals. As trend analyses per country were only done for resistance in E. coli, macrolides have not been included.
Discussion
There were large variations in the consumption of macrolides among countries, both for humans and for food‐producing animals. Furthermore, analysis showed significant association within countries between the consumption of macrolides in humans and consumption in food‐producing animals.
In the third JIACRA report concerning the years 2016–2018, macrolide resistance in C. jejuni in humans could be related to the resistance in food‐producing animals. However, in this fourth report, no such relation was seen, possibly because the occurrence of resistance in food‐producing animals was generally low. Instead, a statistically significant association was seen for the consumption of macrolides in pigs, the resistance to macrolides in Campylobacter coli from pigs and the resistance to macrolides in C. coli from humans. While resistance to macrolides is rare in C. jejuni, it is more frequently observed in C. coli. Therefore, the variation is bigger allowing for associations to be discovered. While pigs are not a relevant source of C. jejuni for humans, they are probably among the main sources of C. coli (Rosner et al., 2017), although this Campylobacter species only is responsible for a minor proportion of human cases.
The absence of a significant association between the consumption of macrolides in humans and resistance to macrolides in C. jejuni or C. coli from humans was expected. This is because Campylobacter only colonise the human intestines on a transient basis and are therefore infrequently co‐exposed through AMC in humans. Moreover, most Campylobacter infections are food‐borne and source attribution studies have shown that broilers play a major role as a source of human infections (Rosner et al., 2017).
Furthermore, gastroenteritis caused by Campylobacter spp. is mostly self‐limiting and antimicrobial therapy is normally not required. However, macrolides are one of the few antimicrobials available that are efficient for the treatment of serious Campylobacter infections in humans.
15.8. Tetracyclines
Key findings
In 2021, the EU/EEA population‐weighted mean consumption of tetracyclines was 1.9 mg/kg estimated biomass in humans and 23.6 mg/kg of estimated biomass in food‐producing animals. Large variations in the consumption of food‐producing animals were noted among countries.
No significant association was observed between the consumption of tetracyclines by humans and food‐producing animals.
In food‐producing animals, in pigs and poultry specifically, statistically significant positive associations were observed between the estimated consumption of tetracyclines in animals and resistance to tetracyclines in E. coli from food‐producing animals during the period studied. The same was observed for the estimated consumption of tetracyclines in poultry and resistance to tetracycline in C. jejuni from poultry and the estimated consumption in pigs and resistance to tetracycline in C. coli pigs.
There was a significant positive association between tetracycline resistance in C. jejuni from broilers and turkeys and in C. jejuni from humans for 2020.
Significant univariate associations were also observed between consumption of tetracyclines in food‐producing animals and resistance to tetracycline in C. jejuni in humans.
In the multivariate analysis for C. jejuni, a significant association between resistance to tetracycline in poultry and resistance to tetracycline in humans was found. For C. coli, no such association was observed in the multivariate analysis.
Overall EU/EEA tetracycline consumption decreased significantly in food‐producing animals over 2014–2021 while there was no significant trend in consumption in humans.
From 2014 to 2021, the majority of countries observed a significant trend showing a decrease both in tetracycline consumption and tetracycline resistance in E. coli in food‐producing animals (14 countries). No country observed a significant increase in both. Overall, a decrease in AMC was seen in 18 countries, and a decrease in AMR was also seen in 18 countries. A concurrent increase both in AMC and AMR was not observed in any country. No trend analysis was performed for humans as no relevant AMR data are available.
Discussion
Tetracyclines are not routinely used for treatment of Enterobacterales infections in humans. Therefore, there are no surveillance data on tetracycline resistance in invasive E. coli from humans. For Campylobacter spp., tetracyclines are a treatment option in humans. Tetracyclines have been and continue to be very widely used in food‐producing animals, although, over the years, a significant decrease in the consumption of tetracyclines for use in food‐producing animals has been observed. Resistance to tetracyclines is (a) common and (b) commonly a core component of many MDR patterns. It is still of note that in Europe many target pathogens in many countries remain susceptible to tetracyclines, so there is a rationale for use. Tetracycline resistance is commonly associated with other resistance, which means that the use of tetracycline co‐selects for the other resistance and vice versa.
No significant associations were found between consumption of tetracyclines in humans and resistance to tetracyclines in C. jejuni from humans. C. jejuni are not permanent colonisers in humans. Consequently, they are only exposed to antimicrobial treatments during infections. In contrast, in food‐producing animals, C. jejuni, C. coli and E. coli are permanent colonisers of the gut and therefore exposed to any antimicrobial treatment these food‐producing animals receive. In food‐producing animals, tetracyclines are among the most consumed antimicrobials (ESVAC, 2022). Therefore, a statistically significant positive association between consumption of tetracyclines and resistance to tetracyclines in E. coli and C. jejuni could be expected and was observed.
The association between resistance of C. jejuni from broilers and turkeys and resistance in humans may be explained by the dominant role of these poultry species and their meat as sources of human Campylobacter infections (Rosner et al., 2017).
The multivariate analysis indicated that there is a significant association between the resistance to tetracyclines observed in C. jejuni from poultry and humans. The resistance data from food‐producing animals included in this analysis were from poultry as pigs rarely carry C. jejuni. Consumption of poultry meat and the handling of poultry and poultry meat are important transmission routes for Campylobacter spp. infections in humans (Mughini‐Gras et al., 2019).
15.9. Antimicrobial consumption and proportion of complete susceptibility in Escherichia coli
Key findings
In both humans and animals, a lower level of total consumption was associated with a higher proportion of completely susceptible isolates to a defined set of antimicrobials for all included years (2019–2021).
Over time, total consumption of antimicrobials decreased significantly in most countries between 2014 and 2021 in both humans and food‐producing animals and in both, the number of countries with a significant increase in complete susceptibility was higher than the number of countries with a significant decrease in complete susceptibility.
For food‐producing animals and when considering the odds ratios across the different time periods, there was not statistically significant increasing or decreasing trend in the ORs over time; therefore, the association between consumption and complete susceptibility appears to be not changing over time. Similar results were noted for the human analysis.
Discussion
For food‐producing animals, in the context of this report and in the analysis performed, complete susceptibility refers to susceptibility to each of the 14 substances in the standard panel of antimicrobials tested. The proportion of indicator E. coli isolates from the most important food‐producing animals (i.e. broilers, fattening turkeys, fattening pigs and calves) that are completely susceptible to the entire harmonised panel of antimicrobials (see Section 3.2.4.1) has been retained as the primary key indicator in food‐producing animals. The harmonised AMR monitoring in the EU yields data based on use of the same panel of antimicrobials – defined in the legislation – and applying harmonised criteria (ECOFF) to interpret microbiological resistance. Adherence to legislation by the Member States guarantees this uniformity. The assumption underlying the choice of this specific indicator is that only E. coli which is rarely, if ever, exposed to antimicrobials, will be completely susceptible. The occurrence of complete susceptibility can therefore be used to assess the development of AMR in relation to the total consumption of antimicrobials (total AMC) in food‐producing animals.
The total AMC in food‐producing animals and the proportion of completely susceptible E. coli isolates in food‐producing animals both varied substantially between countries, providing a range of data to be analysed by logistic regression. The uniqueness of the model fitted ensured comparability between the results obtained for the intervals. A statistically significant negative association was consistently detected between total AMC and the occurrence of complete susceptibility to all of the antimicrobials in the harmonised panel tested. When considering the odds ratios across the different time periods, no statistically significant increasing or decreasing trend in the odds ratios over time was observed. Thus, the association between AMC and CS appears to be not changing over time. The odds ratio estimates obtained by the models were remarkably consistent for all 2‐year periods considered, indicating that a two‐fold increase in total AMC (expressed in mg per kg of estimated biomass and per year) resulted in a decrease by about 50% in the occurrence of complete susceptibility in E. coli. The consistency of the outputs, and the availability of data from a large number of countries, suggest that the association between complete susceptibility and total AMC is a key area for investigation in analyses of the type performed in the JIACRA report.
In humans, for the purpose of this analysis, a similar value was calculated associating total AMC in humans with resistance in E. coli strains from humans to a set of antimicrobial groups. This reflects substances that are commonly tested in E. coli from humans. Despite the difference in the definition of the values similar results were obtained when studying the association of the measure of AMR with the total AMC in the respective population.
In contrast to the observations on individual antimicrobial groups, this approach includes effects obtained by co‐selection of resistance if resistance to several antimicrobials is genetically linked, e.g. by being combined on a plasmid. It therefore allows a fairly general statement, but does not reflect the different importance of antimicrobial groups in humans and food‐producing animals as reflected in the categorisation done by EMA's AMEG and WHO.
15.10. Primary key indicators of antimicrobial consumption and resistance
Key findings
There was substantial variation in all five primary key indicators among countries and between years within the countries.
Primary key indicators for AMC decreased in most countries in both humans and food‐producing animals.
Primary key indicators of AMR in humans showed divergent trends. The proportion of MRSA decreased in most countries.
Primary key indicator of AMR in food‐producing animals measures the proportion of indicator E. coli isolates susceptible to all tested substances and decreased in very few countries.
Discussion
In 2017, to facilitate assessments of the progress in reducing AMC and AMR, EFSA, EMA and ECDC proposed key indicators for both (ECDC, EFSA, EMA, 2017a). Variability among the indicators between countries suggests potential room for improvement, and variability over time indicates changes in AMC and AMR that may help when evaluating management measures to reduce them. While it is not the purpose of the indicators to compare countries, they may help identify key areas for action by putting the national indicator into perspective.
The observed reduction in the primary AMC indicators for humans and food‐producing animals underlines the efforts taken by the EU/EEA countries to reduce AMC and prevent the spread of resistant bacteria. The heterogeneous trends in AMC in relation to the human primary AMR indicators show that the development of AMR, in relation to AMC, is not necessarily parallel between different bacterial species and resistance. However, for further analysis of these divergent trends, more detailed data are needed that are not covered by the indicators.
Changes over time in primary key indicator values for AMC and AMR for both humans and food‐producing animals may help EU/EEA countries to customise interventions using a One Health approach. This feedback via primary key indicators may help each EU/EEA country to focus on exploring potential barriers in the event of an increase in AMR and AMC in humans or food‐producing animals, or to explore facilitators, in the event of a decrease in AMC and AMR.
Indicator E. coli has been selected as the reporting organism, since it is expected to better represent the overall AMR situation, including resistance due to plasmid‐mediated AMR genes. Plasmid‐mediated AMR genes are considered to be a more significant part of the total resistance that could be acquired from the food‐producing animal sector to human healthcare than resistance acquired through most zoonotic pathogens with non‐transferrable AMR. A general and abundant species representing the overall AMR situation, such as indicator E. coli, is also more relevant than less abundant zoonotic species.
The availability of more detailed data on AMC in food‐producing animals at the species or production level in the coming years may allow for possible further study and more detailed analyses.
In order to supplement the analysis of AMC and the proportion of complete susceptibility in E. coli from food‐producing animals with a similar analysis based on human data, the proportion of E. coli susceptible to a defined panel of antimicrobials groups were calculated based on data reported to EARS‐Net. Due to differences in sampling frameworks, data are not directly comparable across sectors. While isolates from food‐producing animals originate from healthy animals and are tested to a predefined antimicrobial panel, human isolates originate from severely ill patients and routine AST data from local clinical microbiology laboratories. Nevertheless, the consistency of results across sectors highlights the relationship between low AMC and susceptibility of bacterial populations to broad panels of antimicrobial treatments.
15.11. Trends in the association of antimicrobial consumption and resistance in humans and food‐producing animals
In this report, for the first time, trends in the association of AMC and AMR in humans and food‐producing animals were investigated. For reasons stated above, resistance in E. coli was used for these analyses. Data from 8 years (2014–2021) were available.
Overall, the odds ratios observed in the univariate and multivariate analyses in the individual years and 2‐year periods were constant over time and therefore, no specific analyses were carried out investigating the trends in these odds ratios. Instead, an approach was chosen that incorporated time into the statistical models.
A wide range of different trend combinations was observed between the sectors and the different antimicrobials including combinations of significant positive and negative trends and findings of no significant trend at all. In both sectors, a concurrent negative trend in both AMC and AMR was far more frequent than a combined positive trend or opposite trends (i.e. reduction in AMC and increase in AMR and vice versa), indicating that overall the included countries are on the right track with respect to reducing AMC and AMR. Moreover, the results indicate that a reduction in AMC is often followed by an associated reduction in AMR. However, trends were not always significant, underlining that a reduction in AMC is not always followed by a reduction in AMR and in a few cases even the opposite may be seen. This underlines on the one hand the association of AMC and AMR and on the other hand, the complexity of this association, which may be affected by many other factors that require a more detailed analysis. This, however, is beyond the scope of this report.
15.12. Limitations
15.12.1. Inherent characteristics of analysed data
The data analysed in this report were obtained from a number of EU initiatives and networks. These data were collected for purposes other than the main objective of this study, which was to investigate potential relationships between AMC and AMR. The level of granularity 4 of the data available for analysis is a limitation that may impact the results obtained. With more refined data on the target population and AMC in different animal species and production, more refined analyses could have been made. Nevertheless, despite the limitations, the analyses performed provide an overview and are considered useful for describing the overall impact of AMC in humans and food‐producing animals and its effect on AMR in bacteria from humans and in food‐producing animals.
15.12.2. Uncertainty and imprecision of measurements
15.12.2.1. Antimicrobial consumption data
Although based on the best data currently available for the EU/EEA, AMC expressed in mg per kg of estimated biomass and per year for humans and food‐producing animals is a technically derived estimate that must be interpreted with caution because it does not account for differences in dosing between antimicrobial substances and pharmaceutical formulations.
Moreover, it has to be kept in mind that the denominators, although both build on biomass, differ from each other, when comparing the level of consumption between humans and food‐producing animals. This does not affect the analyses on potential associations. As challenges with denominators are constant over time, the analysis of trends in AMC at the national level, as presented in this report, is valid even if the technically derived estimate may be an over‐ or underestimation of the true consumption. At the European level, completeness of data reporting has improved over time which may partially mask reductions in consumption.
The denominator kilogram of biomass used for AMC in humans may be an overestimate, as data on the weights of humans are uncertain and the ages at risk through treatment (children and the elderly being more frequently treated than other age groups) were not taken into account (Blix et al., 2007; ECDC, n.d). For AMC in food‐producing animals, the denominator is a sum of the mass of different animal species and does not account for differences in the relative composition of the total national animal populations, as AMC may differ markedly between the various animal populations (i.e. production sectors) and by age category (age at risk) of a given animal species. Nevertheless, there is a good correlation between AMC in humans expressed as DDD per 1000 inhabitants and per day and in mg per kg of estimated biomass and per year, both at the overall level and for each antimicrobial group (ECDC, EFSA and EMA, 2015).
Data coverage of AMC in humans was not 100% in all those countries included. Countries with less than 100% data coverage of community AMC in 2021 were Germany (88%), the Netherlands (93%) and Luxembourg (90%). Additionally, Luxembourg reported a 95% coverage rate for reported hospital AMC data. Human AMC rates were calculated using the reported population under surveillance.
Data on AMC in food‐producing animals are currently only available as total sales (i.e. for all food‐producing animal species). Total antimicrobial sales data do not allow the assessment of AMC by animal species as many of the antimicrobial veterinary medicinal products (VMP) are authorised with indications for use in more than one animal species – e.g. pigs, poultry, sheep and goats. Therefore, it is not possible to determine from sales data how much the antimicrobial VMP is used for treatment of each animal per species for which a VMP is authorised. In order to enable analysis of the occurrence of AMR in bacteria from pigs and poultry together with consumption data, sales data were used to obtain technically derived estimates of AMC in these species (see Annex 2.3 of the JIACRA 3 report [ECDC, EFSA and EMA, 2021]). This estimation methodology is based on the animal species the VMP is authorised for (i.e. the proportion of sales of a VMP for a certain species is calculated by weighting the total sales by the estimated biomass of the various animal species for which the antimicrobial VMP is authorised). However, if, for example, product A is authorised for cattle, pigs, horses and poultry but in real life this product is almost solely used for pigs, the estimates for sales of product A are underestimated for pigs and overestimated for poultry. Therefore, the limitations of the technically derived estimates of AMC for pigs and poultry must be borne in mind when interpreting the results of analyses including such data.
Other limitations that may hamper the comparison of AMC in humans and in food‐producing animals were discussed in the first JIACRA report (ECDC, EFSA and EMA, 2015).
15.12.2.2. Antimicrobial resistance data
In food‐producing animals, the representative nature of the sampling performed and the adoption of identical AST methodologies facilitated the standardised investigation of associations between AMC and AMR in different reporting countries. At the same time, the Commission Implementing Decision 2013/652/EU and the subsequent Commission Implementing Decision (EU) 2020/1729 only target the main food‐producing animal populations every other year (i.e. monitoring is performed on a rotating basis, targeting fattening pigs and bovine animals under 1 year of age and meat derived thereof in odd years and poultry populations – broilers, laying hens, fattening turkeys – and derived meat in even years, as specified by the legislation); therefore, some bacteria/animal population combinations not specified in the legislation at all or for the specific year are tested and reported on a voluntary basis. In many instances, this means that data are only available for certain countries and therefore meaningful associations cannot be established with the approach chosen for this report. Moreover, for Salmonella spp. in particular, limited prevalence in the animal population leads to a lack of isolates available for resistance testing. This limits the number of countries where sufficient data are available (i.e. the number of data pairs available for the correlation analysis).
Some populations, such as companion animals, sheep and dairy cows, are not covered by the statutory monitoring of AMR in animals. Companion animals may exchange bacteria with family members and others as they are in close contact with people (Walther et al., 2012). Moreover, regulations 5 on use, which preclude use of any antimicrobials that do not have a maximum residue limit in food‐producing animals, permit exceptional use of antimicrobials outside the terms of the marketing authorisation in companion animals. Food‐producing animals not covered by the resistance monitoring are still included in the AMC (sales) data, which may have an impact on the associations studied between AMC and AMR in animals. In some instances, this effect should not be underestimated – e.g. with respect to use of third‐ and fourth‐generation cephalosporins which is frequent in dairy cows in many countries.
Furthermore, genetic linkage of AMR genes conferring resistance to antimicrobials from the same or different groups (co‐resistance) as well as resistance to some or all antimicrobials belonging to the same group due to a single mechanism (cross‐resistance) are factors that increase the complexity of this type of analysis. Consequently, the analysis did not attempt to evaluate AMC and AMR in humans and food‐producing animals for all available combinations of antimicrobials and bacteria, but focused on certain combinations of interest for which sufficient data were available.
Available data on AMR in bacteria from meat were disregarded in the context of this report. Testing of meat is only mandatory for some bacteria. The data were therefore considered insufficient to perform meaningful analyses. Unlike bacterial isolates sampled from the intestinal flora of healthy animals at slaughter, the bacteria present on meat may additionally be influenced by production processes which influence bacterial survival and therefore, the bacterial load on food items. Furthermore, the sources of bacteria on meat include not only the food‐producing animals from which the meat was derived, but also the people involved in meat production, as well as the environment in which meat was prepared or stored. Cross‐contamination between meats originating from different national sources might also occur. Meat samples may represent domestic production and/or meat originating from other Member States or imports from third countries. Therefore, it is essential to distinguish between these sources for a meaningful analysis of AMR in bacteria from meat in relation to AMC in food‐producing animals, because there may be differences in exposure to antimicrobials in the countries.
The comparisons between AMR in relevant bacteria from humans and food‐producing animals may be hampered by the difference in sampling for the two sectors. AMR data from humans were based on the testing of clinical isolates. These isolates are primarily tested to guide treatment and the selection of isolates is heavily influenced by the test strategy. Minimum inhibitory concentrations are evaluated based on clinical breakpoints. For this report, this was applicable to invasive E. coli isolates from humans. For Salmonella spp. and Campylobacter spp., AST results are interpreted using ECOFFs, or aligned closely with the ECOFF for data already interpreted. In food‐producing animals a unified sampling scheme is applied, based on EU legislation and the interpretation of resistance using ECOFFs. Samples and isolates do not originate from clinical cases but from randomly chosen presumably healthy food‐producing animals and populations.
AMR data for Salmonella spp. and Campylobacter spp. were, in general, directly comparable between both sectors as evaluation criteria were similar (Figures 3 and 4). In contrast, findings on E. coli were less so, with a difference of one to four dilution steps, depending on the antimicrobial, between the ECOFFs and clinical breakpoints used in the sectors (Figure 2). Furthermore, E. coli from humans and food‐producing animals originated from different types of bacterial populations under surveillance. AMR in invasive E. coli isolates from human bloodstream infections was compared to AMR in primarily non‐pathogenic indicator commensal E. coli isolates from healthy food‐producing animals. Differences in AMR exhibited by clinical and non‐clinical isolates from food‐producing animals have been identified in E. coli from poultry and cattle. However, these differences are not systematic–i.e. for certain animal/antimicrobial substance/bacterial combinations resistance was higher in non‐clinical isolates while in others taken from the same populations the opposite applied (Mesa‐Varona et al., 2020; Tenhagen et al., 2020). Without characterisation of the bacteria from the two populations, involving both ‘traditional’ methods (e.g. serotyping) and molecular characterisation of resistance genes, for example, any apparent associations between the two populations in relation to AMR are difficult to assess.
About 70%–85% of the data from human Salmonella spp. and Campylobacter spp. isolates were from the national public health reference laboratories (NPHRLs). These data may not always constitute a representative selection of the Salmonella and Campylobacter infections in the countries as only a few countries submit all isolates for testing at the central reference laboratory level. Due to the role of the NPHRLs, there is a risk of overrepresentation of isolates that are difficult to type or of strains from outbreaks (although this has less impact for Campylobacter spp. where outbreaks are rare or more difficult to detect than for Salmonella spp.) A couple of NPHRLs receive a higher proportion of isolates with resistance to first‐line antimicrobials to determine susceptibility to a larger panel, which of course bias the data towards higher resistance.
When comparing the results of this report to those of JIACRA I, II and III, changes in the data collection need to be considered. For human data on Salmonella and Campylobacter, the proportion of quantitative data has increased over time, making it possible to apply the same breakpoints on these data for better comparability between countries and with AMR data from food‐producing animals. For the animal data, changes were mainly made between 2013 and 2014, when Commission Implementing Decision 2013/652/EU became effective. In 2021 the new Commission Implementing Decision (EU) 2020/1729 was introduced, requiring countries to sample imported fresh meat at border control posts for E. coli. New substances were also added in the harmonised antimicrobial panels, including amikacin for Salmonella and E. coli, and chloramphenicol and ertapenem for Campylobacter spp. Also from 2021, whole genome sequencing (WGS) was authorised as an alternative method to supplementary (panel 2) phenotypic testing of Salmonella and E. coli isolates with resistance to extended‐spectrum cephalosporins and carbapenems.
Finally, in order to include as many data points as possible, particularly for Salmonella spp. and the respective serovars, a minimum of ten isolates tested for the bacteria and drug combination per country and year was set. Such a low cut‐off is sensitive to random variation, which may have resulted in large variations in the proportion of non‐susceptible isolates.
15.12.3. Ecological data and ecological analysis
This report provides an integrated multivariate ecological study of available data on AMC and AMR in bacteria from humans and food‐producing animals, provided by the EU‐wide surveillance/monitoring programmes. The report investigated, in an exploratory manner, the impact of the consumption of antimicrobials in both human and animal sectors on the occurrence of AMR in selected pathogenic and non‐pathogenic bacteria in these sectors in three time periods between 2018 and 2021. At the same time, it used the data generated to investigate AMR in humans in relation to AMC in the food‐producing animals. Both AMC and the occurrence of AMR were considered at the population level, whether animal or human, in each country and then compared across countries.
The potential direct relationships between AMC in humans and AMR in bacteria from food‐producing animals were not addressed in this report. Investigation of this relationship would ideally require data relating to a bacterium occurring in humans where the bacterium is exposed to AMC, with the additional condition that this bacterium is relatively frequently acquired by food‐producing animals from humans. Since data relevant to such situations are not currently available, this analysis was not performed.
Although ecological studies are particularly useful for generating hypotheses, they cannot establish causation, no matter how strong the associations discerned, since traditional criteria for causality are not met. The findings of ecological analyses, such as those presented in this report, are not causal assessments. Therefore, it cannot be excluded that, while detecting a statistically significant association, concomitant phenomena were observed without any causal relationship. It is important to take this into account when interpreting the results of the analyses presented in this report.
The statistical units of the ecological analyses were countries, limiting the size of the data sets to a maximum of 30 units. Outliers – i.e. country data that were characterised by extraordinarily high or low AMC or AMR – were observed throughout the analyses. These might have an impact on the results i.e. significance of associations, as logistic regression may be sensitive to such outliers. Outlier assessments were performed when deemed appropriate. The distribution of countries in graphs of consumption vs resistance do not provide details of the epidemiology or underlying reasons for observed differences, but they provide a starting point which might be useful as a tool in stimulating relevant investigations.
15.12.4. Inherent characteristics of the statistical methods used
15.12.4.1. Partial least squares path modelling (PLS‐PM)
The data sets analysed in the univariate and the multivariate analysis were not exactly the same. The multivariate analysis included data on AMR in bacteria from food‐producing animals for 2020 and 2021, and corresponding pooled or averaged data on AMR in bacteria from humans. In contrast to the results of the univariate analyses, those for the multivariate models cannot be expressed as odds ratios, since PLS‐PM is based on a linear assessment of the relationship between the latent variables.
PLS‐PM was elected to perform multivariate analyses, as it allows presenting and accounting for the biological knowledge of the complex relationships between AMC and AMR data, as represented in Figure 1. For AMR in bacteria from humans, AMC in food‐producing animals could be considered as either a direct or an indirect independent variable – in the latter case, through impact on AMR in bacteria from food‐producing animals, possibly subsequently transmitted to humans. PLS‐PM is also particularly suitable when there is multicollinearity between independent variables and few observations in relation to the number of independent variables. Although PLS‐PM does not impose sample size assumption, a minimum of twenty observations are frequently mentioned in the literature as required. Within the framework of this report, given the strength of the relationships, the small number of independent variables and the low complexity of the relationship network, some models were still computed by including between 10 and 20 observations. In such cases, no bootstrap was performed to estimate confidence intervals. The limited number of observations should be kept in mind when interpreting the results of multivariate analysis.
The multivariate analysis should be considered as both structural representation and assessment of the relationships that could be explored between all data available, still summarising data components (data measured in different animal species or in different settings) through latent variables. The multivariate models determined both the significance and the magnitude of the relationships between AMR in bacteria from humans and (i) AMC in humans (as a combination of consumption in the community and in hospitals) and (ii) AMR in bacteria from food‐producing animals (as a combination of AMR data on pigs and poultry), while considering the impact of AMC in food‐producing animals (as a combination of AMC data in pigs and poultry). Not all the potential relationships were addressed independently in a two‐by‐two assessment at the food‐producing animal/species level as in the univariate analysis, but they were addressed simultaneously.
The PLS‐PM models assessed the relationships between AMR in bacteria from humans and corresponding AMC and AMR in bacteria from pigs and poultry only (and AMR in bacteria from poultry only for C. jejuni models). As AMC and AMR in other animal species, as well as AMR in other reservoirs, could also play a role, the results of PLS‐PM models were an attempt to estimate the relative influence of the parameters addressed in the analysis. They should therefore not be interpreted as a comprehensive overview of the determinants of AMR in bacteria from humans.
15.12.5. Other factors influencing interpretation of results
Antimicrobial consumption
The use of antimicrobials for humans and food‐producing animals differs considerably. In humans in the community, oral medication of individuals is by far the most common. In contrast, the most common method for medicating food‐producing animals is giving oral medication to groups of food‐producing animals. Such groups can be small, such as a pen of piglets, or large – all the food‐producing animals in a stable. Children, elderly people and young animals are more likely to need antimicrobial treatment than adult individuals. Furthermore, the lifespan of animals reared for slaughter is mostly short.
Occurrence of the target bacterium
The analyses performed in this report used available data from the EU/EEA countries and other reporting countries. The associations detected for E. coli, as well as for C. jejuni and related antimicrobials in poultry, were usually much stronger than for Salmonella spp., where statistically significant associations were much less frequently detected. The prevalence of Salmonella spp. and specific serovars varies greatly between countries and populations. In most countries, Salmonella spp. is not ubiquitous, whereas E. coli is ubiquitous and C. jejuni is very common in the species of poultry studied. Thus, there may be countries with high or low AMC in a sector, but a lack of general exposure to the target bacteria because of its limited occurrence. The first JIACRA report commented in detail on these aspects and in particular, the role of clonal spread of resistant bacteria, which is often significant in Salmonella spp. The investigation of associations between AMC and AMR for bacteria such as Salmonella spp., which are not ubiquitous, probably needs to be studied in more detail.
Clonal spread
Successful global dissemination of specific clones/lineages with AMR genes has been described in E. coli responsible for intestinal and extraintestinal infections, both in humans and food‐producing animals (Denamur et al., 2020). Escherichia coli multilocus sequence type (MLST) ST131 is the most prevalent pandemic extraenteric pathogenic clone found in the human sector (causing community and healthcare‐acquired infections), companion animals, poultry and occasionally in other food‐producing animals (Denamur et al., 2020; Platell et al., 2011). One of the characteristics of this lineage is acquisition of AMR, mainly to the extended‐spectrum cephalosporins, typically by production of CTX‐M beta lactamases, and frequently to the fluoroquinolones (Denamur et al., 2020; Yair & Gophna, 2018). Recently, carbapenem and colistin resistance has been found in E. coli ST131 (Saidenberg et al., 2020; Welker et al., 2020). Other prevalent E. coli clonal complexes include STc12, STc14, ST410 with varying percentages of AMR (Denamur et al., 2020).
In Salmonella, clonal spread is common and antimicrobial use in animal husbandry and possibly also in humans seems to facilitate the dissemination of particularly resistant clones. Some examples of clonal lineages with AMR patterns of concern are monophasic S. Typhimurium DT193 with resistance patter ASSuT (García et al., 2016), highly ciprofloxacin‐resistant and MDR S. Kentucky ST198 (Hawkey et al., 2019) and ESBL‐producing S. Infantis (Franco et al., 2015). While the former is primarily associated with pigs, the latter two are poultry‐related, all three being among the top serovars in human Salmonella infections in the EU/EEA.
For Campylobacter, clonal spread was previously not considered an issue, but this may rather reflect the absence of typing methods able to differentiate between Campylobacter bacteria. With the introduction of genome sequencing, a large genetic diversity has been revealed in Campylobacter, although some sequence types or clonal complexes have also been found to be more common in certain areas in both humans and food‐producing animals (primarily poultry) or in the environment (French et al., 2019; Kovač et al., 2014; SSI, 2020). However, the cross‐border spread of such types still needs to be explored.
Clonal spread of resistant bacteria could interfere in the analysis of the association between AMC and AMR in ecological studies, such as those conducted in this JIACRA report. This is particularly the case for analyses involving Salmonella. However, this is complex and, in the case of successful pandemic E. coli clones including the ST131, global spread can be attributed to many factors, including their resistance to antimicrobials to which most humans and food‐producing animals are exposed (Denamur et al., 2020; Yair & Gophna, 2018).
16. CONCLUSIONS
The results from JIACRA IV were mostly consistent with results from previous JIACRA reports, stressing that AMR requires joint efforts taken in a ‘One Health’ approach across the human and food‐producing animal sectors. AMR is a cross‐cutting and cross‐border issue that warrants a strong and coordinated response. To ensure the success of this response, prudent and appropriate antimicrobial use, along with reinforcement of infection prevention and control and cooperation across sectors and countries, remain of key importance. Surveillance and monitoring are needed to evaluate, support and continuously validate the measures taken as well as to identify emerging areas of concern. This is the basis to preserve the effectiveness of existing antimicrobials and needs to be supplemented with the development of new antimicrobials.
A statistically significant decrease in AMC has been observed in food‐producing animals, suggesting that the measures taken at the country level to reduce the use of antimicrobials in food‐producing animals have been effective. Measures to ensure that these reductions are sustained, paired with similar efforts to reduce any unnecessary AMC in the human sector, are clearly needed.
In both humans and food‐producing animals, associations were observed between the consumption of an antimicrobial group and bacterial resistance to the antimicrobials belonging to this group in the same population. This highlights the need for increased focus on preventive measures to keep humans and food‐producing animals healthy, thereby reducing the occurrence of disease and the need for antimicrobial treatments. Antimicrobial stewardship can reduce the selective pressure on bacteria which, in turn, will decrease the burden of AMR in the EU/EEA.
For some analyses, resistance in bacteria from humans was associated with resistance in bacteria from food‐producing animals. The most consistent positive association was found for Campylobacter spp. Campylobacter infections in humans are mostly food‐borne and hence the bacteria causing human infections originate from food‐producing animals and may carry resistance traits acquired in food‐producing animals. As Campylobacter spp. is not part of the normal human intestinal flora, it is not exposed to antimicrobial treatments targeting other bacterial infections in humans. In contrast, in E. coli the association between consumption and resistance in animals and resistance in humans was only observed in the multivariate model for aminopenicillins, but not for the other substances.
In those countries recording a statistically significant trend in reduction of consumption of third‐ and fourth‐generation cephalosporins, quinolones, polymyxins, aminopenicillins and tetracyclines in animals over the period from 2014 to 2021, this has mostly been accompanied by a significant trend in reduction of resistance to the respective antimicrobial groups in indicator E. coli isolates from animals.
The findings of ecological analyses that make use of aggregated data at the national level, as included in this report, should be considered as hypotheses for subsequent targeted research to confirm the observed associations and provide causal explanations where these are lacking. The availability of more detailed and comprehensive data on AMC in food‐producing animals from 2023 onwards will allow for more refined analyses. Although the various surveillance and monitoring systems for AMC and AMR serve different primary purposes, the EU agencies continue to work on further harmonisation and integration of surveillance across sectors, to better understand the relationship between AMC and AMR within and across sectors.
By taking a ‘One Health’ approach, the JIACRA report collates surveillance data on AMC and AMR both in humans and food‐producing animals in a unique manner, putting them into perspective and bringing to light the progress registered so far. JIACRA outputs also provide highly relevant information for use in the classification of antimicrobials according to their impact on public and animal health.
Overall, the findings suggest that further interventions to reduce AMC will have a beneficial impact on the occurrence of AMR. Reducing use in food‐producing animals is likely to have additional benefits for human health, most obviously regarding resistance in food‐borne pathogens such as Campylobacter. The high levels of AMC and AMR still being reported in both humans and food‐producing animals in several EU/EEA countries is an indication that these interventions should be reinforced in these countries.
ABBREVIATIONS
- AIC
Akaike's information criterion
- AMC
antimicrobial consumption
- AMEG
Antimicrobial Advice ad hoc Expert Group (EMA)
- AmpC
a group of enzymes that degrade beta‐lactam antimicrobials
- AMR
antimicrobial resistance
- AMU
Antimicrobial Use
- AST
antimicrobial susceptibility testing
- ATC
Anatomical Therapeutic Chemical classification system
- ATCvet
Anatomical Therapeutic Chemical classification system for veterinary medicinal products
- BIOHAZ
Panel on Biological Hazards (EFSA)
- BSI
bloodstream infections
- CIA
critically important antimicrobial
- CCRE
colistin‐ and carbapenem‐resistant Enterobacterales
- CHMP
Committee for Medicinal Products for Human Use (EMA)
- CI
confidence interval
- CLSI
Clinical and Laboratory Standards Institute (USA)
- CPE
carbapenemase‐producing Enterobacterales
- CRE
carbapenem‐resistant Enterobacterales
- CSS
caecal samples from healthy food‐producing animals at slaughter
- CTX‐M
Cefotaximase‐Munich
- CVMP
Committee for Veterinary Medicinal Products (EMA)
- DALY
disability‐adjusted life years
- DDD
defined daily dose
- DDDvet
defined daily dose for animals (by animal species/type of animal)
- EARS‐Net
European Antimicrobial Resistance Surveillance Network (ECDC)
- ECDC
European Centre for Disease Prevention and Control
- ECOFF
epidemiological cut‐off value
- EEA
European Economic Area
- EMA
European Medicines Agency
- ESAC‐Net
European Surveillance of Antimicrobial Consumption Network (ECDC)
- ESBL
extended‐spectrum beta‐lactamase
- ESVAC
European Surveillance of Veterinary Antimicrobial Consumption (EMA)
- EUCAST
European Committee on Antimicrobial Susceptibility Testing
- FAO
Food and Agriculture Organization
- FPA
food‐producing animals
- FWD‐Net
Food‐ and Waterborne Diseases and Zoonoses Network (ECDC)
- HIA
highly important antimicrobial
- HPCIA
Highest Priority Critically Important Antimicrobials
- IPC
infection prevention and control
- JIACRA
Joint Inter‐agency Antimicrobial Consumption and Resistance Analysis
- MAH
marketing authorisation holder
- MDR
multidrug‐resistant
- MIC
minimum inhibitory concentration
- MRL
maximum residue limit
- MRSA
methicillin‐resistant Staphylococcus aureus
- NPHRL
national public health reference laboratory
- OR
odds ratio
- PCU
population correction unit
- PHC
process hygiene criteria
- PL CI
profile likelihood confidence interval
- PLS‐PM
Partial Least Squares Path Modelling
- SIMR
summary indicator of microbiological resistance
- SPC
Summary of Product Characteristics
- spp.
species (plural)
- TESSy
The European Surveillance System (ECDC)
- VMP
veterinary medicinal product
- VHIA
Veterinary Highly Important Antimicrobial Agents
- VCIA
Veterinary Critically Important Antimicrobial Agents
- WGS
whole genome sequencing
- WHO
World Health Organization
- WHO CC
World Health Organization Collaborating Centre for Drug Statistics Methodology
- WOAH
World Organisation for Animal Health (formerly OIE)
LIST OF COUNTRIES 6
- Austria
AT
- Belgium
BE
- Bulgaria
BG
- Croatia
HR
- Cyprus
CY
- Czechia
CZ
- Denmark
DK
- Estonia
EE
- Finland
FI
- France
FR
- Germany
DE
- Greece
EL
- Hungary
HU
- Iceland
IS
- Ireland
IE
- Italy
IT
- Latvia
LV
- Lithuania
LT
- Luxembourg
LU
- Malta
MT
- Netherlands
NL
- Norway
NO
- Poland
PL
- Portugal
PT
- Romania
RO
- Slovakia
SK
- Slovenia
SI
- Spain
ES
- Sweden
SE
- Switzerland
CH
CONFLICT OF INTEREST
If you wish to access the declaration of interests of any expert contributing to an EFSA scientific assessment, please contact interestmanagement@efsa.europa.eu.
REQUESTOR
European Commission
QUESTION NUMBER
EFSA‐Q‐2022‐00101
COPYRIGHT FOR NON‐EFSA CONTENT
EFSA may include images or other content for which it does not hold copyright. In such cases, EFSA indicates the copyright holder and users should seek permission to reproduce the content from the original source.
NOTE
Procedures for adoption of the report. Representatives of the different surveillance/monitoring networks of the countries, who are in charge of providing the data have been consulted during the preparation of the joint report. ECDC, EFSA and EMA have each established their own procedure for endorsement or adoption of the joint report according to their internal rules. ECDC adopted the report on 5 January 2024, after consultation with the European Antimicrobial Resistance Surveillance Network (EARS‐Net), the European Surveillance Antimicrobial Consumption Network (ESAC‐Net), the Food and Waterborne Diseases and Zoonoses Network (FWD‐Net) and the ECDC Advisory Forum. EFSA approved the report on 25 January 2024, after consultation with its Scientific Network for Zoonosis Monitoring Data. EMA adopted the report on 25 January 2024. Before endorsement, the report was circulated for consultation to the European Surveillance of Veterinary Antimicrobial Consumption (ESVAC) network.
ACKNOWLEDGEMENTS
We would like to thank the representatives of the countries and other members of the different networks who provided data for the surveillance networks: EARS‐Net, ESAC‐Net and FWD‐Net (ECDC), Scientific Network for Zoonosis Monitoring Data (EFSA) and ESVAC Network Sales (EMA). This joint report is based on data provided by the above‐mentioned networks and major contributions from the following experts: Liselotte Diaz Högberg, Joana Gomes Dias, Elias Iosifidis, Vivian Leung, Gaetano Marrone, Dominique Monnet, Cèlia Ventura‐Gabarro, Vera Vlahović‐Palčevski and Therese Westrell (ECDC); Marc Aerts, Pierre‐Alexandre Beloeil, Ernesto Liebana, Valentina Rizzi and Bernd‐Alois Tenhagen (Chair) (EFSA), and Claire Chauvin, Barbara Freischem, Hector Gonzalez Dorta, Helen Jukes, Zoltan Kunsagi, Filipa Mendes Oliveira, Oskar Nilsson, Cristina Ribeiro‐Silva, Chantal Quinten and Engeline van Duijkeren (EMA). Special thanks go to Bernd‐Alois Tenhagen for chairing the working group.
ANNEX A. Multivariate analyses across years
A.1.
Models obtained considering antimicrobial consumption and resistance data from Escherichia coli in both humans and food‐producing animals for the seven time intervals since 2014, 7 are summarised in Tables A.1, A.2, A.3. Only significant paths (at least for one time interval) are reported in the tables, following notations represented in Figure A.1.
FIGURE A.1.

Diagram showing the notations followed in the multivariate analyses between 2014 and 2021 considering antimicrobial consumption and resistance data from Escherichia coli in both humans and food‐producing animals.
A.1. Third‐ and fourth‐generation cephalosporins
TABLE A.1.
Multivariate analyses between 2014 and 2021 performed for third‐ and fourth‐generation cephalosporins considering antimicrobial consumption and resistance data from Escherichia coli in both humans and food‐producing animals.
| Years | Countries | Beta AMChuman → AMRhuman | R 2 AMRhuman |
|---|---|---|---|
| 2014–2015 | AT, BE, BG, CY a , CZ a , DE a , DK, EE, EL, ES, FI, FR, HR, HU, IE, IT, LT, LV, MT, NL, NO, PL, PT, RO, SE, SI, SK (n = 27) |
0.83 [0.71–0.93] p < 0.0001 |
0.69 [0.50–0.87] |
| 2015–2016 | AT, BE, BG, CY a , CZ a , DE a , DK, EE, EL, ES, FI, FR, HR, HU, IE, IT, LT, LV, MT, NL, NO, PL, PT, RO, SE, SI, SK (n = 27) |
0.83 [0.60–0.93] p < 0.0001 |
0.69 [0.36–0.87] |
| 2016–2017 | AT, BE, BG, CY a , DE a , DK, EE, EL, ES, FI, FR, HR, HU, IE, IS a , IT, LT, LV, MT, NL, NO, PL, PT, RO, SE, SI, SK (n = 27) |
0.78 [0.56–0.94] p < 0.0001 |
0.61 [0.32–0.88] |
| 2017–2018 | AT, BE, BG, CY a , DE a , DK, EE, EL, ES, FI, FR, HR, HU, IE, IS a , IT, LT, LV, MT, NL, NO, PL, PT, RO, SE, SI, SK (n = 27) |
0.80 [0.62–0.95] p < 0.0001 |
0.65 [0.39–0.90] |
| 2018–2019 | AT, BE, BG, CY a , DE a , DK, EE, EL, ES, FI, FR, HR, HU, IE, IS a , IT, LT, LV, MT, NL, NO, PL, PT, RO, SE, SI, SK (n = 27) |
0.85 [0.69–0.96] p < 0.0001 |
0.73 [0.47–0.93] |
| 2019–2020 | AT, BE, BG, CY a , CZ a , DE a , DK, EE, EL, ES, FI, FR, HR, HU, IE, IS a , IT, LT, LV, NL, NO, PL, PT, RO, SE, SI, SK (n = 27) |
0.84 [0.70–0.94] p < 0.0001 |
0.72 [0.48–0.88] |
| 2020–2021 | AT, BE, BG, CY a , CZ a , DE a , DK, EE, EL, ES, FI, FR, HR, HU, IE, IS a , IT, LT, LV, NL, NO, PL, PT, RO, SE, SI, SK (n = 27) |
0.86 [0.63–0.96] p < 0.0001 |
0.74 [0.403–0.92] |
For these countries, data on human consumption in the hospital sector were not available, and hospital consumption was estimated from the proportion reported by the other countries for the same year.
A.2. Quinolones
TABLE A.2.
Multivariate analyses between 2014 and 2021 performed for quinolones considering antimicrobial consumption and resistance data from Escherichia coli in both humans and food‐producing animals.
| Time intervals | Countries | Beta AMCanimal → AMRanimal | Beta AMRanimal → AMRhuman | Beta AMChuman → AMRhuman | R 2 AMRanimal | R 2 AMRhuman |
|---|---|---|---|---|---|---|
| 2014–2015 | AT, BE, BG, CYa, CZ, DEa, DK, EE, ES, FI, FR, HR, HU, IE, IT, LT, LV, NL, NO, PL, PT, ROa, SE, SI, SK (n = 25) |
0.69 [0.50–0.96] p = 0.0001 |
0.36 [0.07–0.75] p = 0.04 |
0.56 [0.14–0.84] p = 0.003 |
0.48 [0.26–0.93] | 0.73 [0.52–0.91] |
| 2015–2016 | AT, BE, BG, CYa, CZ, DEa, DK, EE, EL, ES, FI, FR, HR, HU, IE, IT, LT, LV, NL, NO, PL, PT, ROa, SE, SI, SK (n = 26) |
0.78 [0.64–0.94] p < 0.0001 |
0.34 [0.03–0.71] p = 0.04 |
0.59 [0.28–0.84] p = 0.008 |
0.60 [0.41–0.88] | 0.75 [0.55–0.88] |
| 2016–2017 | AT, BE, BG, CYa, DEa, DK, EE, EL, ES, FI, FR, HR, HU, IE, IS, IT, LT, LV, NL, NO, PL, PT, ROa, SE, SI, SK (n = 26) |
0.82 [0.71–0.92] p < 0.0001 |
0.40 [0.11–0.66] p = 0.01 |
0.54 [0.26–0.79] p = 0.001 |
0.68 [0.51–0.84] | 0.72 [0.60–0.89] |
| 2017–2018 | AT, BE, BG, CY, DEa, DK, EE, EL, ES, FI, FR, HR, HU, IE, IS, IT, LT, LV, MT, NL, NO, PL, PT, RO, SE, SI, SK (n = 27) |
0.75 [0.62–0.90] p < 0.0001 |
NS |
0.79 [0.71–0.90] p < 0.0001 |
0.60 [0.39–0.80] | 0.65 [0.50–0.81] |
| 2018–2019 | AT, BE, BG, CYa, CZa, DEa, DK, EE, EL, ES, FI, FR, HR, HU, IE, IS, IT, LT, LV, MT, NL, NO, PL, PT, RO, SE, SI, SK (n = 28) |
0.86 [0.78–0.93] p < 0.0001 |
NS |
0.78 [0.71–0.89] p < 0.0001 |
0.61 [0.50–0.80] | 0.75 [0.61–0.87] |
| 2019–2020 | AT, BE, BG, CYa, CZa, DEa, DK, EE, EL, ES, FI, FR, HR, HU, IE, IS, IT, LT, LV, NL, NO, PL, PT, RO, SE, SI, SK (n = 27) |
0.84 [0.75–0.93] p < 0.0001 |
0.35 [−0.02–0.62] p = 0.02 |
0.60 [0.32–0.83] p = 0.0002 |
0.70 [0.56–0.87] | 0.72 [0.58–0.90] |
| 2020–2021 | AT, BE, BG, CY, CZ, DEa, DK, EE, EL, ES, FI, FR, HR, HU, IE, IS, IT, LT, LV, NL, NO, PL, PT, RO, SE, SI, SK (n = 27) |
0.84 [0.74–0.96] p < 0.001 |
NS |
0.80 [0.65–0.92] p < 0.001 |
0.70 [0.54–0.93] | 0.64 [0.42–0.84] |
Abbreviation: NS, path not significant.
For these countries, data on human consumption in the hospital sector were not available, and hospital consumption was estimated from the proportion reported by the other countries for the same year.
A.3. Aminopenicillins
TABLE A.3.
Multivariate analyses between 2014 and 2021 performed for aminopenicillins considering antimicrobial consumption and resistance data from Escherichia coli in both humans and food‐producing animals.
| Time intervals | Countries | Beta AMCanimal → AMRanimal | Beta AMRanimal → AMRhuman | R 2 AMRanimal | R 2 AMRhuman |
|---|---|---|---|---|---|
| 2014–2015 | AT, BE, BG, CY a , CZ, DE a , DK, EE, ES, FI, FR, HR, HU, IE, IT, LT, LV, NL, NO, PL, PT, RO a , SI, SK (n = 24) |
0.65 [−0.63–0.84] p = 0.0005 |
0.79 [0.58–0.91] p < 0.0001 |
0.43 [0.27–0.71] | 0.62 [0.34–0.83] |
| 2015–2016 | AT a , BE, BG, CY a , CZ, DE a , DK, EE, EL, ES, FI, FR, HR, HU, IE, IT, LT, LV, NL, NO, PL, PT, RO a , SI, SK (n = 25) |
0.67 [−0.71–0.87] p = 0.0003 |
0.74 [0.48–0.89] p < 0.0001 |
0.44 [0.31–0.78] | 0.55 [0.23–0.79] |
| 2016–2017 | AT a , BE, BG, CY a , DE a , DK, EE, EL, ES, FI, FR, HR, HU, IE, IS, IT, LT, LV, NL, NO, PL, PT, RO a , SI, SK (n = 25) |
0.75 [−0.83–0.89] p < 0.0001 |
0.80 [0.60–0.89] p < 0.0001 |
0.57 [0.46–0.80] | 0.63 [0.36–0.80] |
| 2017–2018 | AT a , BE, BG, CY, DE a , DK, EE, EL, ES, FI, FR, HR, HU, IE, IT, LT, LV, MT, NL, NO, PL, PT, RO a , SI, SK (n = 25) |
0.75 [0.65–0.87] p < 0.0001 |
0.70 [0.38–0.87] p = 0.0001 |
0.56 [0.42–0.76] | 0.48 [0.15–0.76] |
| 2018–2019 | AT, BE, BG, CY a , CZ a , DE a , DK, EE, EL, ES, FI, FR, HR, HU, IE, IT, LT, LV, MT, NL, NO, PL, PT, RO, SI, SK (n = 26) |
0.66 [0.54–0.83] p = 0.0003 |
0.71 [0.45–0.87] p < 0.0001 |
0.43 [0.28–0.71] | 0.51 [0.21–0.75] |
| 2019–2020 | AT, BE, BG, CY a , CZ a , DE a , DK, EE, EL, ES, FI, FR, HR, HU, IE, IT, LT, LV, NL, NO, PL, PT, RO, SI, SK (n = 25) |
0.68 [0.47–0.86] p < 0.0001 |
0.80 [0.59–0.92] p = 0.0002 |
0.46 [0.24–0.73] | 0.65 [0.35–0.84] |
| 2020–2021 | AT, BE, BG, CY, CZ, DE a , DK, EE, EL, ES, FI, FR, HR, HU, IE, IS, IT, LT, LV, NL, NO, PL, PT, RO, SE, SI, SK (n = 26) |
0.72 [0.58–0.87] p < 0.0001 |
0.81 [0.61–0.90] p < 0.001 |
0.52 [0.33–0.76] | 0.65 [0.37–0.81] |
For these countries, data on human consumption in the hospital sector were not available, and hospital consumption was estimated from the proportion reported by the other countries for the same year.
ANNEX B. Salmonella spp. analyses
B.1. Introduction
Associations with Salmonella spp. are more challenging to assess compared to other bacteria addressed in this report. Previous JIACRA reports have considered Salmonella spp. due to its relevance as a food‐borne zoonotic pathogen. The experience has however revealed the AMC/AMU associations for Salmonella were not seen in the same way as for E. coli or Campylobacter spp. due to differences in epidemiology and occurrence between these bacteria. For this report, it was therefore decided to consolidate all Salmonella analyses in one annex, while focusing on E. coli and Campylobacter spp. in the main body of the report.
The Salmonella data set is characterised by the relatively low number of isolates per serovar included in the analyses, particularly from the monitoring in food‐producing animals. Salmonella serovars differ in their prevalence in different animal species. At the same time, there is an association between the serovar and the likelihood of resistance to certain antimicrobials. The limited prevalence of Salmonella in many farm animal populations in Europe results in a scarcity of isolates available from active monitoring conducted under Commission Implementing Decision (EU) 2020/1729 and its predecessor, CID 2013/652/EU. In order to obtain the requested 170 isolates required for statistical purposes, an excessively high number of samples would need to be tested. Furthermore, the small number of isolates is spread across multiple serovars, posing challenges for a valid analysis of serovar‐level data. Therefore, when comparing E. coli and Salmonella, the former is ubiquitous in farm animal species and all animals from all herds will therefore yield isolates for inclusion in a JIACRA type analysis. This means that all herds/flocks with their differing patterns of antimicrobial use are included for E. coli. For Salmonella, only some herds/flocks may yield isolates and so we have a subset of herds/flocks included in the analyses.
The low prevalence of Salmonella spp. in farm animals is largely attributed to successful control programmes implemented at either the European level, as in this case of chicken and turkeys under Regulation (EC) 2160/2003, or at the national level, as observed in pigs and cattle in numerous countries. Consequently, the availability of sufficient data is limited to a small number of countries.
The number of individuals who contract Salmonella‐related food‐borne illnesses remains high in Europe despite a substantial decrease of cases observed in the last 15 years, with approximately 90,000 laboratory‐confirmed cases reported annually. Consequently, there is no issue regarding access to isolates from humans. Instead, for isolates from humans the representativeness of the data is sometimes problematic. The AMR data obtained from human Salmonella isolates are often derived from testing conducted at the national public health reference laboratories (NPHRLs). However, the isolates submitted to the NPHRLs may not always constitute a representative selection of the salmonella infections in the countries as only a few countries submit all isolates for testing at the central reference laboratory level. Due to the role of NPHRLs, there is a risk of an overrepresentation of isolates that are challenging to type, particularly those that are resistant or of strains from outbreaks. Additionally, the distribution of the isolates across different serovars may not always accurately reflect the true prevalence in various countries.
Since certain serovars are predominantly found in specific animal species, analysing the associations between resistance in a particular animal type and in humans would preferably be conducted at the serovar level to exclude infections resulting from consuming meat from other food‐producing animals. As described above, this was in many cases not feasible due to the limited number of isolates available from food‐producing animals per serovar, resulting in only a few remaining countries in the analysis and low power of the tests. Therefore, the SIMR, which is a summary indicator of microbiological resistance calculated at the national level as the weighted mean of the proportion of AMR in broilers, turkeys, pigs and calves (bovines under 1 year) at slaughter, was used to analyse the associations between resistance in Salmonella spp. from humans and food‐producing animals.
The lack of statistical power combined with the inconsistent associations observed over time for Salmonella spp. is further compounded by a high number of statistical outliers that can significantly influence the presence or absence of an observed association. In combination with the heterogeneity of serovars included each year, interpretation of the analyses is challenging. There is considerable variation in the resistance profiles between Salmonella serovars. The level of resistance to specific antimicrobials varies significantly between different animal species and across EU countries. Many serovars are multidrug resistant and the resistance determinants are often present on mobile genetic elements, which carry multiple resistance genes against various groups of antimicrobials. The use of one of these antimicrobials automatically also selects for resistance to other antimicrobials. For instance, the most prominent resistance pattern of the monophasic S. Typhimurium variant is resistance to ampicillin, streptomycin, sulfonamides and tetracyclines (ASSuT). Therefore, exposure to tetracyclines will also select for resistance to streptomycin, ampicillin and sulfonamides, even if these antimicrobials were not used. This complicates the analysis. In addition, certain clones have spread across Europe's animal production systems, and an overrepresentation of these clones will hamper the analyses. ‘Core patterns’ of resistance are associated with certain clones of Salmonella; the resistance is often rather stable and frequently located on the bacterial chromosome. These resistances (since associated with the clone) will confer a selective advantage to the Salmonella in the face of antimicrobial treatment, but also can travel independently of AMU because they can be stably associated with a particular Salmonella clone. Other resistances may not be stably associated with the clone; therefore, there may expected to be differences in the associations between AMU and AMR for different antimicrobials for the same strain of Salmonella.
Salmonella infections are primarily transmitted through food and Salmonella is not a permanent coloniser of the human gut. Salmonella bacteria are commonly not exposed to antimicrobials that are consumed by humans, except during the infection itself. Additionally, most infections in humans are not treated with antimicrobials. Consequently, it is not expected to find associations between the consumption of certain antimicrobial groups in humans and resistance to these antimicrobial groups in humans.
B.2. Third‐ and fourth‐generation cephalosporins
B.2.1. Consumption in humans and resistance in Salmonella spp. isolates from humans
The association between the consumption of third‐ and fourth‐generation cephalosporins in humans and the occurrence of resistance to third‐generation cephalosporins of Salmonella spp. was statistically significant for 2019 and 2020 and borderline significant for 2021 (Table B.1, Figure B.1).
TABLE B.1.
Consumption of third‐ and fourth‐generation cephalosporins in humans, expressed as DDD per 1000 inhabitants and per day, and the probability of resistance to third‐generation cephalosporins in Salmonella spp. from humans, EU/EEA, 2019–2021 (logistic regression, see Figure B.1).
| Year | Countries | Model | OR | p‐value | 95% CI |
|---|---|---|---|---|---|
| 2019 | AT, BE, CY, DE, DK, EE, EL, ES, FI, FR, IE, IS, IT, LT, LU, LV, MT, NL, NO, PL, PT, RO, SE, SI, SK (n = 25) | log | 1.29 | 0.025 | 1.03–1.61 |
| 2020 | AT, BE, CY, DE, DK, EE, EL, ES, FI, FR, HU, IE, IS, IT, LU, MT, NL, NO, PT, RO, SE, SI, SK (n = 23) | log | 1.23 | 0.020 | 1.03–1.47 |
| 2021 | AT, BE, CY, DE, DK, EE, EL, ES, FI, FR, HU, IT, LT, LU, MT, NL, NO, PL, PT, RO, SE, SI, SK (n = 23) | log | 1.35 | 0.081 | 0.96–1.88 |
Abbreviations: CI, confidence interval; OR, odds ratio.
Note: OR varies from 0 to infinity. When OR equals 1 and CI includes 1, the association is not considered statistically significant.
FIGURE B.1.

Consumption of third‐ and fourth‐generation cephalosporins in humans and the probability of resistance to third‐generation cephalosporins in Salmonella spp., EU/EEA, 2019–2021 (see Table B.1). The figure displays results of logistic regression analyses. Bubbles represent the countries included in the analysis. The size of the bubbles indicates the amount of available resistance data per country. A solid trend line indicates significance at a 5% level, whereas a dashed trend line represents significance at a 10% level.
Using a systematic approach to outlier assessment, one outlier per year was found for 2020 and 2021. Removal of the outlier in 2020 changed significant association to non‐significant and removal of the outlier in 2021 changed borderline significant association to significant.
B.2.2. Consumption in food‐producing animals and resistance in Salmonella spp. isolates from food‐producing animals
B.2.2.1. Salmonella spp. isolates from food‐producing animals
In order to investigate possible relationships between the consumption of third‐ and fourth‐generation cephalosporins and cephalosporin resistance, the SIMR to cefotaxime in Salmonella spp. from food‐producing animals (broilers, turkeys, pigs and calves, sampled at slaughter) was compared with the consumption of third‐ and fourth‐generation cephalosporins in all food‐producing animals (expressed in mg per kg of estimated biomass) for the 2‐year intervals 2018–2019, 2019–2020 and 2020–2021 (mean consumption over the respective years) at the national level. There was no significant association for all three periods (Table B.2).
TABLE B.2.
Consumption of third‐ and fourth‐generation cephalosporins by food‐producing animals, expressed in mg per kg of estimated biomass/year, and the probability of resistance to cefotaxime in Salmonella spp. from food‐producing animals, EU/EEA, 2018–2021 (logistic regression).
| Year | Countries | Model | OR | p‐value | 95% CI |
|---|---|---|---|---|---|
| 2018–2019 | AT, BE, CY, CZ, DE, DK, EL, ES, FR, HR, HU, IE, IT, MT, PL, PT, RO, SI, SK (n = 19) | log | 1.58 | 0.562 | 0.34–7.32 |
| 2019–2020 | AT, BE, CY, CZ, DE, DK, EL, ES, FR, HR, HU, IE, IS, IT, LV, MT, NL, PL, PT, RO, SI, SK (n = 22) | log | 0.95 | 0.815 | 0.65–1.41 |
| 2020–2021 | AT, BE, BG, CY, CZ, DE, DK, EE, EL, ES, FR, HR, HU, IE, IS, IT, LT, LU, LV, MT, NL, PL, PT, RO, SI, SK (n = 26) | log | 1.25 | 0.392 | 0.75–2.07 |
Abbreviations: CI, confidence interval; OR, odds ratio.
Note: OR varies from 0 to infinity. When OR equals 1 and CI includes 1, the association is not considered statistically significant.
B.2.2.2. Salmonella spp. from pigs
A statistically significant positive association was observed between the consumption of third‐ and fourth‐generation cephalosporins in pigs and the resistance of Salmonella spp. in pigs for 2021, while it was not observed for 2019 (Table B.3, Figure B.2). In 2019, isolates were obtained from carcases of pigs while in 2021, isolates were obtained from caecal content.
TABLE B.3.
Consumption of third‐ and fourth‐generation cephalosporins in pigs, expressed as DDDvet/kg of estimated biomass/year, and the probability of resistance to cefotaxime in Salmonella spp. from pigs, EU/EEA, 2019 and 2021 (logistic regression, see Figure B.2).
| Year | Country | Model | OR | p‐value | 95% CI |
|---|---|---|---|---|---|
| 2019 | BE, DE, DK, ES, FR, HR, HU, IE, IS, IT, MT, NL, PL, PT (n = 14) | log | 1.73 | 0.188 | 0.76–3.91 |
| 2021 | AT, BE, BG, CY, DE, DK, EE, ES, FR, HR, HU, IE, IS, IT, LT, LU, LV, MT, NL, PL, PT, RO, SI, SK (n = 24) | log | 2.73 | 0.001 | 1.48–5.04 |
Abbreviations: CI, confidence interval; OR, odds ratio.
Note: OR varies from 0 to infinity. When OR equals 1 and CI includes 1, the association is not considered statistically significant.
FIGURE B.2.

Consumption of third‐ and fourth‐generation cephalosporins in pigs and the probability of resistance to third‐generation cephalosporins in Salmonella spp. from pigs, EU/EEA, 2021 (see Table B.1). The figure displays results of logistic regression analyses. Bubbles represent the countries included in the analysis. The size of the bubbles indicates the amount of available resistance data per country.
B.2.3. Resistance in Salmonella isolates from humans and food‐producing animals
B.2.3.1. Salmonella spp. from humans and Salmonella SIMR
A statistically significant positive association between the resistance of Salmonella spp. in humans and in food‐producing animals was found for 2020 and 2021, while it was not observed for 2019 (Table B.4, Figure B.3). However, in 2020 and 2021, one country (the same in both years) appears as an outlier and removal of this data from the analysis renders the association insignificant.
TABLE B.4.
Probability of resistance to third‐generation cephalosporins in Salmonella SIMR from food‐producing animals and from humans, EU/EEA, 2019–2021 (logistic regression, see Figure B.3).
| Year | Countries | Model | OR | p‐value | 95% CI |
|---|---|---|---|---|---|
| 2019 | AT, BE, CY, DE, DK, EL, ES, FR, IE, IT, MT, PL, PT, RO, SI, SK (n = 16) | log | 1.06 | 0.507 | 0.89–1.25 |
| 2020 | AT, BE, CY, DE, DK, EL, ES, FR, HU, IE, IS, IT, MT, NL, PT, RO, SI, SK (n = 18) | log | 1.17 | 0.003 | 1.05–1.31 |
| 2021 | AT, BE, CY, DE, DK, EE, EL, ES, FR, HU, IT, LT, LU, MT, NL, PL, PT, RO, SI, SK (n = 20) | log | 1.28 | 0.005 | 1.08–1.53 |
Abbreviations: CI, confidence interval; OR, odds ratio; SIMR, summary indicator of microbiological resistance.
Note: OR varies from 0 to infinity. When OR equals 1 and CI includes 1, the association is not considered statistically significant.
FIGURE B.3.

Probability of resistance to third‐generation cephalosporins in Salmonella SIMR from food‐producing animals and humans, EU/EEA, 2019–2021 (see Table B.4).
B.2.3.2. Resistance to third‐generation cephalosporins in isolates of Salmonella from humans and from food‐producing animals
Resistance to third‐generation cephalosporins in Salmonella spp. from humans had a statistically significant positive association with the level of resistance to third‐generation cephalosporins of Salmonella spp. from broilers and turkeys in 2020 and in pigs in 2021, but not in 2019 (Table B.5, Figure B.4). Removal of one outlier for 2020 in broilers changed the significant association to non‐significant.
TABLE B.5.
Probability of resistance to third‐generation cephalosporins in Salmonella spp. from food‐producing animals and from humans, 2019–2021 (logistic regression, see Figure B.4).
| FPA | Year | Countries | Model | OR | p‐value | 95% CI |
|---|---|---|---|---|---|---|
| Pigs | 2019 | BE, DE, DK, ES, FR, IE, IS, IT, MT, NL, PL, PT (n = 12) | log | 0.93 | 0.473 | 0.77–1.13 |
| 2021 | AT, BE, CY, DE, DK, EE, EL, ES, FR, HU, IT, LT, LU, MT, NL, PL, PT, RO, SI, SK (n = 20) | log | 1.37 | < 0.001 | 1.16–1.62 | |
| Broilers | 2020 | AT, BE, CY, DE, DK, EL, ES, FI, FR, HU, IE, IS, IT, MT, NO, PT, RO, SI, SK (n = 19) | log | 1.17 | 0.001 | 1.07–1.28 |
| Turkeys | 2020 | AT, BE, CY, DE, ES, FR, HU, IE, IT, PT, RO, SI, SK (n = 13) | log | 1.42 | < 0.001 | 1.21–1.68 |
Abbreviations: CI, confidence interval; FPA, food‐producing animals; OR, odds ratio.
Note: OR varies from 0 to infinity. When OR equals 1 and CI includes 1, the association is not considered statistically significant.
FIGURE B.4.

Probability of resistance to third‐generation cephalosporins in Salmonella spp. from humans and pig carcasses, 2019 and 2021, and broilers and turkeys, 2020, EU/EEA (see Table B.5). The figure displays results of logistic regression analyses. Bubbles represent the countries included in the analysis. The size of the bubbles indicates the amount of available resistance data per country.
B.2.4. Consumption in food‐producing animals and resistance of Salmonella spp. from humans
No statistically significant association was found between consumption of third‐ and fourth‐generation cephalosporins in food‐producing animals and resistance to third‐generation cephalosporins in Salmonella spp. isolates from humans for all 3 years (Table B.6).
TABLE B.6.
Consumption of third‐ and fourth‐generation cephalosporins in food‐producing animals, expressed in mg/PCU, and the probability of resistance to third‐generation cephalosporins in Salmonella spp. from humans, EU/EEA, 2019–2021 (logistic regression).
| Year | Countries | Model | OR | p‐value | 95% CI |
|---|---|---|---|---|---|
| 2019 | AT, BE, CY, DE, DK, EE, EL, ES, FI, FR, IE, IS, IT, LT, LU, LV, MT, NL, NO, PL, PT, RO, SE, SI, SK (n = 25) | log | 1.04 | 0.541 | 0.91–1.20 |
| 2020 | AT, BE, CY, DE, DK, EE, EL, ES, FI, FR, HU, IE, IS, IT, LU, MT, NL, NO, PT, RO, SE, SI, SK (n = 23) | log | 1.00 | 0.986 | 0.90–1.11 |
| 2021 | AT, BE, CY, DE, DK, EE, EL, ES, FI, FR, HU, IT, LT, LU, MT, NL, NO, PL, PT, RO, SE, SI, SK (n = 23) | log | 1.04 | 0.681 | 0.86–1.25 |
Abbreviations: CI, confidence interval; OR, odds ratio.
Note: OR varies from 0 to infinity. When OR equals 1 and CI includes 1, the association is not considered statistically significant.
B.2.5. Multivariate analysis
No statistically significant path could be identified in a multivariate analysis including 13 countries.
B.3. Fluoroquinolones and other quinolones
B.3.1. Consumption in humans and resistance in Salmonella spp. isolates from humans
The association between the consumption of fluoroquinolones and other quinolones in humans and the occurrence of resistance to fluoroquinolones and other quinolones of Salmonella spp. was not significant for any of the years 2019–2021 (Table B.7). One outlier was identified for 2020 and when it was excluded, the association was significant (p = 0.043).
TABLE B.7.
Consumption of fluoroquinolones and other quinolones in humans, expressed as DDD per 1000 inhabitants and per day, and the probability of resistance to fluoroquinolones and other quinolones in Salmonella spp. from humans, EU/EEA, 2019–2021 (logistic regression).
| Year | Countries | Model | OR | p‐value | 95% CI |
|---|---|---|---|---|---|
| 2019 | AT, BE, CY, DE, DK, EE, EL, ES, FI, FR, IE, IS, IT, LT, LU, LV, MT, NL, NO, PL, PT, RO, SE, SI, SK (n = 25) | log | 0.97 | 0.801 | 0.74–1.25 |
| 2020 | AT, BE, CY, DE, DK, EE, EL, ES, FI, FR, HU, IE, IS, IT, LU, LV, MT, NL, NO, PT, RO, SE, SI, SK (n = 24) | log | 1.22 | 0.116 | 0.95–1.57 |
| 2021 | AT, BE, CY, DE, DK, EE, EL, ES, FI, FR, HU, IS, IT, LT, LU, LV, MT, NL, NO, PL, PT, RO, SE, SI, SK (n = 25) | log | 1.19 | 0.439 | 0.77–1.85 |
Abbreviations: CI, confidence interval; OR, odds ratio.
Note: OR varies from 0 to infinity. When OR equals 1 and CI includes 1, the association is not considered statistically significant.
B.3.2. Consumption and resistance of Salmonella spp., in food‐producing animals
B.3.2.1. Salmonella spp. isolates from food‐producing animals
The SIMR to ciprofloxacin in Salmonella was also used to assess the possible relationships between the consumption of fluoroquinolones and other quinolones in food‐producing animals and fluoroquinolone resistance in Salmonella from food‐producing animals. The category ‘food‐producing animals’ in the SIMR includes broilers, turkeys, pigs and calves. Statistically significant positive associations between ciprofloxacin resistance in Salmonella spp. and fluoroquinolones and other quinolones consumption in food‐producing animals were observed in 2019–2020 and 2020–2021 but not in 2018–2019 (Table B.8, Figure B.5). When analysing for outliers however, the association in 2018–2019 became significant when the two outliers were excluded.
TABLE B.8.
Consumption of fluoroquinolones and other quinolones by food‐producing animals (expressed in mg per kg of estimated biomass/year) and the probability of resistance to ciprofloxacin in indicator Salmonella spp. from food‐producing animals, EU/EEA, 2019–2021 (logistic regression, see Figure B.5).
| Year | Countries | Model | OR | p‐value | 95% CI |
|---|---|---|---|---|---|
| 2018–2019 | AT, BE, CY, CZ, DE, DK, EL, ES, FR, HR, HU, IE, IT, MT, PL, PT, RO, SI, SK (n = 19) | log | 1.39 | 0.101 | 0.94–2.05 |
| 2019–2020 | AT, BE, CY, CZ, DE, DK, EL, ES, FR, HR, HU, IE, IS, IT, LV, MT, NL, PL, PT, RO, SI, SK (n = 22) | log | 1.42 | 0.024 | 1.05–1.93 |
| 2020–2021 | AT, BE, BG, CY, CZ, DE, DK, EE, EL, ES, FR, HR, HU, IE, IS, IT, LT, LU, LV, MT, NL, PL, PT, RO, SI, SK (n = 26) | log | 1.34 | 0.021 | 1.05–1.82 |
Abbreviations: CI, confidence interval; OR, odds ratio.
Note: OR varies from 0 to infinity. When OR equals 1 or CI includes 1, the association is not considered statistically significant.
FIGURE B.5.

Consumption of fluoroquinolones and other quinolones in food‐producing animals and the probability of resistance to fluoroquinolones in indicator Salmonella spp., EU/EEA, 2019–2021 (see Table B.8). The figure displays results of logistic regression analyses. Bubbles represent the countries included in the analysis. The size of the bubbles indicates the amount of available resistance data per country.
B.3.2.2. Salmonella spp. isolates from poultry and pigs
The estimated consumption of fluoroquinolones and other quinolones in poultry and in pigs, expressed as DDDvet/kg of estimated biomass, were compared with resistance to ciprofloxacin in Salmonella spp. from poultry (broilers and turkeys) for 2020 and from pigs for 2019 and 2021. A significant association was only found for pigs for 2019 (Table B.9).
TABLE B.9.
Consumption of fluoroquinolones and other quinolones in poultry and pigs expressed as DDDvet/kg of estimated biomass/year, and the probability of resistance to fluoroquinolones in bacteria from poultry and pigs respectively, EU/EEA, 2019–2021 (logistic regression).
| FPA | Year | Countries | Model | OR | p‐value | 95% CI |
|---|---|---|---|---|---|---|
| Poultry | 2020 | AT, BE, CY, CZ, DE, EL, ES, FR, HR, HU, IT, MT, PL, PT, RO, SI, SK (n = 17) | log | 1.14 | 0.316 | 0.89–1.46 |
| Pigs | 2019 | BE, DE, DK, ES, FR, HR, HU, IE, IS, IT, MT, NL, PL, PT (n = 14) | log | 1.33 | 0.053 | 1.00–1.76 |
| Pigs | 2021 | AT, BE, BG, CY, DE, DK, EE, ES, FR, HR, HU, IE, IS, IT, LT, LU, LV, MT, NL, PL, PT, RO, SI, SK (n = 24) | log | 1.17 | 0.181 | 0.93–1.46 |
Abbreviations: CI, confidence interval; FPA, food‐producing animals; OR, odds ratio.
Note: OR varies from 0 to infinity. When OR equals 1 or CI includes 1, the association is not considered statistically significant.
B.3.3. Resistance in Salmonella spp. from humans and food‐producing animals
B.3.3.1. Salmonella spp. from humans and Salmonella SIMR
A significantly positive association was found between the SIMR of food‐producing animals and resistance in Salmonella from humans to fluoroquinolones in 2020, and for 2021 the positive association was borderline significant (Table B.10, Figure B.6). For 2019, no significant association was observed. Thirteen outliers were observed for 2020 and when removing them individually, the association became non‐significant. For 2021, the association was significant.
TABLE B.10.
Probability of resistance to fluoroquinolones and other quinolones in Salmonella SIMR and from humans, EU/EEA, 2019–2021 (logistic regression, see Figure B.6).
| Year | Countries | Model | OR | p‐value | 95% CI |
|---|---|---|---|---|---|
| 2019 | AT, BE, CY, DE, DK, EL, ES, FR, IE, IT, MT, PL, PT, RO, SI, SK (n = 16) | Linear | 1.79 | 0.168 | 0.78–4.08 |
| 2020 | AT, BE, CY, DE, DK, EL, ES, FR, HU, IE, IS, IT, LV, MT, NL, PT, RO, SI, SK (n = 19) | Linear | 2.95 | 0.049 | 1.00–8.65 |
| 2021 | AT, BE, CY, DE, DK, EE, EL, ES, FR, HU, IS, IT, LT, LU, LV, MT, NL, PL, PT, RO, SI, SK (n = 22) | Linear | 8.34 | 0.032 | 1.19–58.27 |
Abbreviations: CI, confidence interval; OR, odds ratio; SIMR, summary indicator of microbiological resistance.
Note: OR varies from 0 to infinity. When OR equals 1 or CI includes 1, the association is not considered statistically significant.
FIGURE B.6.

Probability of resistance to fluoroquinolones and other quinolones in Salmonella SIMR from humans and food‐producing animals, EU/EEA, 2019–2021 (see Table B.10). The figure displays results of logistic regression analyses. Bubbles represent the countries included in the analysis. The size of the bubbles indicates the amount of available resistance data per country.
B.3.3.2. Resistance to fluoroquinolones in isolates of Salmonella from humans and from food‐producing animals
Data on the occurrence of fluoroquinolone resistance in Salmonella from humans (2019–2021) were compared with the occurrence of fluoroquinolone resistance in Salmonella from broilers and turkeys (2020) and from pigs (2019 and 2021). No evidence of a statistically significant association was found for the tested combinations in pigs and turkeys (Table B.11). When two outliers were removed individually from 2019 and from 2021, the association between resistance in pigs and in humans became significant in both years. A significant association was found for broilers in 2020.
TABLE B.11.
Resistance to fluoroquinolones and other quinolones in Salmonella spp. from food‐producing animals and from humans, EU/EEA, 2019–2021 (logistic regression).
| FPA | Year | Countries | Model | OR | p‐value | 95% CI |
|---|---|---|---|---|---|---|
| Pigs | 2019 | BE, DE, DK, ES, FR, IE, IS, IT, MT, NL, PL, PT (n = 12) | log | 1.08 | 0.106 | 0.98–1.19 |
| 2021 | AT, BE, CY, DE, DK, EE, EL, ES, FR, HU, IS, IT, LT, LU, LV, MT, NL, PL, PT, RO, SI, SK (n = 22) | log | 1.14 | 0.060 | 0.99–1.31 | |
| Broilers | 2020 | AT, BE, CY, DE, DK, EL, ES, FI, FR, HU, IE, IS, IT, LV, MT, NO, PT, RO, SI, SK (n = 20) | log | 1.10 | 0.035 | 1.01–1.19 |
| Turkeys | 2020 | AT, BE, CY, DE, ES, FR, HU, IE, IT, PT, RO, SI, SK (n = 13) | linear | 1.63 | 0.341 | 0.60–4.46 |
Abbreviations: CI, confidence interval; FPA, food‐producing animals; OR, odds ratio.
Note: OR varies from 0 to infinity. When OR equals 1 or CI includes 1, the association is not considered statistically significant.

FIGURE B.7 Probability of resistance to fluoroquinolones and other quinolones in Salmonella spp. from humans and broilers, EU/EEA, 2020 (see Table B.11). The figure displays results of logistic regression analyses. Bubbles represent the countries included in the analysis. The size of the bubbles indicates the amount of available resistance data per country.
B.3.4. Consumption in food‐producing animals and resistance of Salmonella spp. from humans
The association between the total consumption of fluoroquinolones and other quinolones in food‐producing animals and fluoroquinolone and other quinolone resistance in Salmonella isolates from humans was only significant for 2021 (Table B.12 and Figure B.8). For 2021 removal of data from one country rendered the association insignificant.
TABLE B.12.
Consumption of fluoroquinolones and other quinolones in food‐producing animals, expressed in mg/kg estimated biomass, and the probability of resistance to fluoroquinolones and other quinolones in Salmonella spp. from humans, EU/EEA, 2019–2021 (logistic regression, see Figure B.8).
| Year | Countries | Model | OR | p‐value | 95% CI |
|---|---|---|---|---|---|
| 2019 | AT, BE, CY, DE, DK, EE, EL, ES, FI, FR, IE, IS, IT, LT, LU, LV, MT, NL, NO, PL, PT, RO, SE, SI, SK (n = 25) | Quadratic | 1.002 | 0.623 | 0.995–1.008 |
| 2020 | AT, BE, CY, DE, DK, EE, EL, ES, FI, FR, HU, IE, IS, IT, LU, LV, MT, NL, NO, PT, RO, SE, SI, SK (n = 24) | Quadratic | 1.004 | 0.349 | 0.995–1.014 |
| 2021 | AT, BE, CY, DE, DK, EE, EL, ES, FI, FR, HU, IS, IT, LT, LU, LV, MT, NL, NO, PL, PT, RO, SE, SI, SK (n = 25) | Quadratic | 1.007 | 0.007 | 1.002–1.012 |
Abbreviations: CI, confidence interval; OR, odds ratio.
Note: OR varies from 0 to infinity. When OR equals 1 or CI includes 1, the association is not considered statistically significant.
FIGURE B.8.

Consumption of fluoroquinolones and other quinolones in food‐producing animals and the probability of resistance to fluoroquinolones in Salmonella spp. from humans, EU/EEA, 2019–2021 (see Table B.12). The figure displays the results of logistic regression analyses. Bubbles represent the countries included in the analysis. The size of the bubbles indicates the amount of available resistance data per country.
B.3.5. Multivariate analysis
Multivariate analysis involved 14 countries for which all necessary data were available.
The goodness‐of‐fit of the model is low (0.492) and paths confidence intervals are wide. Significant relationships retained in the final PLS‐PM model (Figure B.9) related to the effect of fluoroquinolones and other quinolone consumption in food‐producing animals (poultry and pigs) on resistance in food‐producing animals and to the effect of resistance in food‐producing animals on resistance in humans. According to R 2, 47% of the variance of the resistance in food‐producing animals is explained by the corresponding latent variable consumption of fluoroquinolones and other quinolones in food‐producing animals. Only 32% of the variance of the resistance in humans is explained by the latent variable resistance in food‐producing animals.
FIGURE B.9.

Diagram of the PLS‐PM model of resistance to fluoroquinolones in Salmonella spp. from humans (in 2020 and 2021), considering resistance to fluoroquinolones in Salmonella spp. from food‐producing animals (poultry in 2020 and pigs in 2021) and consumption of fluoroquinolones and other quinolones in humans (2020–2021) mean, expressed as DDD per 1000 inhabitants and per day) in food‐producing animals (in poultry for 2020 and in pigs for 2021, expressed as DDDvet/kg of estimated biomass), EU/EEA. 14 countries: BE, DE*, EL, ES, FR, HU, IT, LV, MT, PL, PT, RO, SI, SK. *For this country, data on human consumption in the hospital sector were not available, and hospital consumption was estimated from the proportion reported by the other countries for the same year. (Goodness‐of‐fit = 0.492).
B.4. Polymyxins
B.4.1. Consumption and resistance of Salmonella spp., in food‐producing animals
B.4.1.1. Salmonella spp. isolates from food‐producing animals (SIMR)
No significant association was shown between the consumption of polymyxins in food‐producing animals and resistance to colistin in Salmonella spp. from food‐producing animals for any of the time periods (2018–2019, 2019–2020 and 2020–2021) (Table B.13). Overall, colistin resistance in Salmonella isolates is at low levels in food‐producing species except in calves. Across all animal groups, most individual countries report no or very low levels of resistance to colistin in Salmonella spp.
TABLE B.13.
Consumption of polymyxins by food‐producing animals, expressed in mg per kg of estimated biomass/year, and the probability of resistance to polymyxins in Salmonella spp. from food‐producing animals, EU/EEA, 2019–2021 (logistic regression).
| Year | Countries | Model | OR | p‐value | 95% CI |
|---|---|---|---|---|---|
| 2018–2019 | AT, BE, CY, CZ, DE, DK, EL, ES, FR, HR, HU, IE, IT, MT, PL, PT, RO, SI, SK (n = 19) | log | 1.17 | 0.339 | 0.85–1.61 |
| 2019–2020 | AT, BE, CY, CZ, DE, DK, EL, ES, FR, HR, HU, IE, IS, IT, LV, MT, NL, PL, PT, RO, SI, SK (n = 22) | log | 1.20 | 0.109 | 0.96–1.51 |
| 2020–2021 | AT, BE, BG, CY, CZ, DE, DK, EE, EL, ES, FR, HR, HU, IE, IS, IT, LT, LU, LV, MT, NL, PL, PT, RO, SI, SK (n = 26) | log | 1.14 | 0.206 | 0.93–1.40 |
Abbreviations: CI, confidence interval; OR, odds ratio.
Note: OR varies from 0 to infinity. When odds ratio equals 1 or CI includes 1, the association is not considered statistically significant. The category ‘food‐producing animals’ includes broilers, turkeys, pigs and calves.
B.4.1.2. Salmonella spp. isolates from pigs and poultry
No significant association was shown between the consumption of polymyxins and resistance to colistin in Salmonella spp. from pigs (2019, 2021) or poultry (2020) (Table B.14).
TABLE B.14.
Consumption of polymyxins by pigs and poultry and the probability of resistance to polymyxins in Salmonella spp. isolates from pigs and poultry, EU/EEA, 2019–2021 (logistic regression).
| FPA | Year | Country | Model | OR | p‐value | 95% CI |
|---|---|---|---|---|---|---|
| Pigs | 2019 | BE, DE, DK, ES, FR, HR, HU, IE, IS, IT, MT, NL, PL, PT (n = 14) | log | 1.17 | 0.159 | 0.94–1.44 |
| Pigs | 2021 | AT, BE, BG, CY, DE, DK, EE, ES, FR, HR, HU, IE, IS, IT, LT, LU, LV, MT, NL, PL, PT, RO, SI, SK (n = 24) | log | 0.97 | 0.681 | 0.81–1.14 |
| Poultry | 2020 | AT, BE, CY, CZ, DE, EL, ES, FR, HR, HU, IT, MT, PL, PT, RO, SI, SK (n = 17) | Quadratic | 1.06 | 0.148 | 0.98–1.16 |
Abbreviations: CI, confidence interval; FPA, food‐producing animals; OR, odds ratio.
Note: OR varies from 0 to infinity. When OR equals 1 or CI includes 1, the association is not considered statistically significant.
B.5. Aminopenicillins
B.5.1. Consumption in humans and resistance in Salmonella spp. isolates from humans
There was no statistically significant association between the consumption of aminopenicillins and aminopenicillin resistance in Salmonella spp. from humans for 2019, 2020 and 2021 (Table B.15).
TABLE B.15.
Consumption of aminopenicillins in humans, expressed as DDD per 1000 inhabitants per day, and the probability of resistance to aminopenicillins in Salmonella from humans, EU/EEA, 2019–2021 (logistic regression).
| Year | Countries | Model | OR | p‐value | 95% CI |
|---|---|---|---|---|---|
| 2019 | AT, BE, CY, DE, DK, EE, EL, ES, FI, FR, IE, IS, IT, LT, LU, LV, MT, NL, NO, PL, PT, RO, SE, SI, SK (n = 25) | log | 1.06 | 0.525 | 0.88–1.29 |
| 2020 | AT, BE, CY, DE, DK, EE, EL, ES, FI, FR, HU, IE, IS, IT, LU, LV, MT, NL, NO, PT, RO, SE, SI, SK (n = 24) | log | 1.14 | 0.311 | 0.88–1.49 |
| 2021 | AT, BE, BG, CY, DE, DK, EE, EL, ES, FI, FR, HU, IS, IT, LT, LU, LV MT, NL, NO, PL, PT, RO, SE, SI, SK (n = 26) | log | 1.11 | 0.358 | 0.88–1.40 |
Abbreviations: CI, confidence interval; OR, odds ratio.
Note: OR varies from 0 to infinity. When OR equals 1 or CI includes 1, the association is not considered statistically significant.
B.5.2. Consumption and resistance of Salmonella spp., in food‐producing animals
B.5.2.1. Salmonella spp. isolates from food‐producing animals
There was no statistically significant association between the consumption of aminopenicillins in food‐producing animals and the resistance of Salmonella spp. isolates from food‐producing animals to ampicillin. In the period 2020–2021 the association was borderline significant (Table B.16).
TABLE B.16.
Consumption of aminopenicillins by food‐producing animals, expressed in mg per kg of estimated biomass/year, and the probability of resistance to aminopenicillins in Salmonella spp. from food‐producing animals, EU/EEA, 2019–2021 (logistic regression).
| Year | Countries | Model | OR | p‐value | 95% CI |
|---|---|---|---|---|---|
| 2018–2019 | AT, BE, CY, CZ, DE, DK, EL, ES, FR, HR, HU, IE, IT, MT, PL, PT, RO, SI, SK (n = 19) | log | 1.22 | 0.142 | 0.94–1.60 |
| 2019–2020 | AT, BE, CY, CZ, DE, DK, EL, ES, FR, HR, HU, IE, IS, IT, LV, MT, NL, PL, PT, RO, SI, SK (n = 22) | log | 1.18 | 0.128 | 0.95–1.46 |
| 2020–2021 | AT, BE, BG, CY, CZ, DE, DK, EE, EL, ES, FR, HR, HU, IE, IS, IT, LT, LU, LV, MT, NL, PL, PT, RO, SI, SK (n = 26) | log | 1.22 | 0.063 | 0.99–1.52 |
Abbreviations: CI, confidence interval; OR, odds ratio.
Note: OR varies from 0 to infinity. When OR equals 1 or CI includes 1, the association is not considered statistically significant.
B.5.2.2. Salmonella spp. isolates from poultry and pigs
There was no statistically significant association between the consumption of aminopenicillins in poultry and pigs and the resistance of Salmonella spp. isolates from these species to aminopenicillin (Table B.17).
TABLE B.17.
Consumption of aminopenicillins by poultry and pigs, expressed in mg per kg of estimated biomass/year, and the probability of resistance to aminopenicillins in Salmonella spp. from poultry for 2020 and pigs for 2019 and 2021, EU/EEA (logistic regression).
| FPA | Year | Country | Model | OR | p‐value | 95% CI |
|---|---|---|---|---|---|---|
| Poultry | 2020 | AT, BE, CY, CZ, DE, EL, ES, FR, HR, HU, IT, MT, PL, PT, RO, SI, SK (n = 17) | Linear | 1.05 | 0.663 | 0.83–1.34 |
| Pigs | 2019 | BE, DE, DK, ES, FR, HR, HU, IE, IS, IT, MT, NL, PL, PT (n = 14) | Quadratic | 1.01 | 0.535 | 0.98–1.04 |
| Pigs | 2021 | AT, BE, BG, CY, DE, DK, EE, ES, FR, HR, HU, IE, IS, IT, LT, LU, LV, MT, NL, PL, PT, RO, SI, SK (n = 24) | Quadratic | 0.98 | 0.059 | 0.95–1.00 |
Abbreviations: CI, confidence interval; FPA, food‐producing animals; OR, odds ratio.
Note: OR varies from 0 to infinity. When OR equals 1 or CI includes 1, the association is not considered statistically significant.
B.5.3. Resistance in Salmonella spp. from humans and food‐producing animals
B.5.3.1. Salmonella spp. from humans and Salmonella SIMR
A significant association was found between the SIMR for Salmonella spp. from food‐producing animals and Salmonella isolates from humans in 2019, but not in the other 2 years (Table B.18, Figure B.10).
TABLE B.18.
Probability of resistance to aminopenicillins in Salmonella SIMR from food‐producing animals and from humans, EU/EEA, 2019–2021 (logistic regression, see Figure B.10).
| Year | Countries | Model | OR | p‐value | 95% CI |
|---|---|---|---|---|---|
| 2019 | AT, BE, CY, DE, DK, EL, ES, FR, IE, IT, MT, PL, PT, RO, SI, SK (n = 16) | log | 1.32 | 0.008 | 1.08–1.61 |
| 2020 | AT, BE, CY, DE, DK, EL, ES, FR, HU, IE, IS, IT, LV, MT, NL, PT, RO, SI, SK (n = 19) | log | 1.19 | 0.166 | 0.93–1.53 |
| 2021 | AT, BE, BG, CY, DE, DK, EE, EL, ES, FR, HU, IS, IT, LT, LU, LV, MT, NL, PL, PT, RO, SI, SK (n = 23) | log | 1.11 | 0.445 | 0.85–1.45 |
Abbreviations: CI, confidence interval; OR, odds ratio; SIMR, summary indicator of microbiological resistance.
Note: OR varies from 0 to infinity. When OR equals 1 or CI includes 1, the association is not considered statistically significant.
FIGURE B.10.

Probability of resistance to aminopenicillins in Salmonella SIMR from humans and food‐producing animals, EU/EEA, 2019–2021 (see Table B.18). The figure displays the results of logistic regression analyses. Bubbles represent the countries included in the analysis. The size of the bubbles indicates the amount of available resistance data per country.
B.5.3.2. Resistance to aminopenicillins in isolates of Salmonella from humans and from food‐producing animals
Only a borderline significant association was found between the resistance of Salmonella spp. isolates from turkeys to aminopenicillin in 2020 and isolates from humans. All other associations were non‐significant. In 2020, for turkeys the removal of one outlier made the association significant (Table B.19).
TABLE B.19.
Probability of resistance to aminopenicillins in Salmonella spp. from food‐producing animals and from humans, EU/EEA, 2019–2021 (logistic regression).
| FPA | Year | Countries | Model | OR | p‐value | 95% CI |
|---|---|---|---|---|---|---|
| Pigs | 2019 | BE, DE, DK, ES, FR, IE, IS, IT, MT, NL, PL, PT (n = 12) | Quadratic | 0.84 | 0.824 | 0.19–3.76 |
| 2021 | AT, BE, BG, CY, DE, DK, EE, EL, ES, FR, HU, IS, IT, LT, LU, LV, MT, NL, PL, PT, RO, SI, SK (n = 23) | Quadratic | 0.74 | 0.651 | 0.21–2.68 | |
| Broilers | 2020 | AT, BE, CY, DE, DK, EL, ES, FI, FR, HU, IE, IS, IT, LV, MT, NO, PT, RO, SI, SK (n = 20) | log | 1.07 | 0.226 | 0.96–1.20 |
| Turkeys | 2020 | AT, BE, CY, DE, ES, FR, HU, IE, IT, PT, RO, SI, SK (n = 13) | log | 1.12 | 0.090 | 0.98–1.28 |
Abbreviations: CI, confidence interval; FPA, food‐producing animals; OR, odds ratio.
Note: OR varies from 0 to infinity. When OR equals 1 or CI includes 1, the association is not considered statistically significant.
B.5.4. Consumption in food‐producing animals and resistance of Salmonella spp. in humans
A statistically significant association was found between consumption of aminopenicillins in food‐producing animals and resistance to aminopenicillins in Salmonella spp. isolates from humans for 2019 and 2020. The association was borderline significant for 2021.
Removal of one outlier in 2019 made the association non‐significant, removal of two outliers in 2020 made the association borderline significant (Table B.20, Figure B.11).
TABLE B.20.
Consumption of aminopenicillins in food‐producing animals, expressed in mg/PCU, and the probability of resistance to aminopenicillins in Salmonella spp. from humans, EU/EEA, 2019–2021 (logistic regression, see Figure B.11).
| Year | Countries | Model | OR | p‐value | 95% CI |
|---|---|---|---|---|---|
| 2019 | AT, BE, CY, DE, DK, EE, EL, ES, FI, FR, IE, IS, IT, LT, LU, LV, MT, NL, NO, PL, PT, RO, SE, SI, SK (n = 25) | Linear | 1.01 | 0.025 | 1.00–1.02 |
| 2020 | AT, BE, CY, DE, DK, EE, EL, ES, FI, FR, HU, IE, IS, IT, LU, LV, MT, NL, NO, PT, RO, SE, SI, SK (n = 24) | Linear | 1.01 | 0.021 | 1.00–1.03 |
| 2021 | AT, BE, BG, CY, DE, DK, EE, EL, ES, FI, FR, HU, IS, IT, LT, LU, LV, MT, NL, NO, PL, PT, RO, SE, SI, SK (n = 26) | Linear | 1.01 | 0.053 | 1.00–1.02 |
Abbreviations: CI, confidence interval; OR, odds ratio.
Note: OR varies from 0 to infinity. When OR equals 1 and CI includes 1, the association is not considered statistically significant.
FIGURE B.11.

Consumption of aminopenicillins in food‐producing animals and the probability of resistance to aminopenicillins in Salmonella spp. from humans, EU/EEA, 2019–2021 (see Table B.20). The figure displays results of logistic regression analyses. Bubbles represent the countries included in the analysis. The size of the bubbles indicates the amount of available resistance data per country. A solid trend line indicates significance at a 5% level, whereas a dashed trend line represents significance at a 10% level.
B.5.5. Multivariate analysis
Multivariate analysis involved 14 countries for which all data were available. No significant relationship could be assessed.
B.6. Tetracyclines
B.6.1. Consumption in humans and resistance in Salmonella spp. isolates from humans
No evidence of a statistically significant association was found between total (community and hospital) consumption of tetracyclines and the occurrence of tetracycline resistance of Salmonella spp. isolates from humans for 2019–2021 (Table B.21).
TABLE B.21.
Consumption of tetracyclines in humans, expressed as DDD per 1000 inhabitants per day, and the probability of resistance to tetracyclines in Salmonella spp. from humans, EU/EEA, 2019–2021 (logistic regression).
| Year | Countries | Model | OR | p‐value | 95% CI |
|---|---|---|---|---|---|
| 2019 | AT, BE, DE, DK, EE, EL, ES, FI, FR, IE, IT, LU, NL, NO, PL, PT, RO, SE, SI, SK (n = 20) | Quadratic | 0.95 | 0.175 | 0.89–1.02 |
| 2020 | AT, BE, DK, EE, EL, ES, FI, FR, HU, IE, IT, LU, NL, NO, PT, RO, SE, SI, SK (n = 19) | Quadratic | 0.89 | 0.050 | 0.80–1.00 |
| 2021 | AT, BE, DE, DK, EE, EL, ES, FI, FR, HU, IT, LU, NL, NO, PL, PT, RO, SE, SI, SK (n = 20) | Quadratic | 0.91 | 0.067 | 0.81–1.01 |
Abbreviations: CI, confidence interval; OR, odds ratio.
Note: OR varies from 0 to infinity. When OR equals 1 or CI includes 1, the association is not considered statistically significant.
B.6.2. Consumption and resistance of Salmonella spp. in food‐producing animals
B.6.2.1. Salmonella spp. isolates from food‐producing animals (SIMR)
To investigate possible relationships between the consumption of tetracyclines and tetracycline resistance, the SIMR to tetracyclines in Salmonella spp. from food‐producing animals, was compared with the consumption of tetracyclines in food‐producing animals (expressed in mg per kg of estimated biomass) for the 2‐year intervals 2018–2019, 2019–2020 and 2020–2021 (mean consumption over the respective years) at the national level (Table B.22, Figure B.12). The category ‘resistance in food‐producing animals’ includes broilers, turkeys, pigs and calves.
TABLE B.22.
Consumption of tetracyclines by food‐producing animals, expressed in mg per kg of estimated biomass/year, and the probability of resistance to tetracyclines in Salmonella spp. from food‐producing animals, EU/EEA, 2018–2021 (logistic regression, see Figure B.13).
| Year | Countries | Model | OR | p‐value | 95% CI |
|---|---|---|---|---|---|
| 2018–2019 | AT, BE, CY, CZ, DE, DK, EL, ES, FR, HR, HU, IE, IT, MT, PL, PT, RO, SI, SK (n = 19) | Quadratic | 1.00015 | 0.037 | 1.00001–1.00028 |
| 2019–2020 | AT, BE, CY, CZ, DE, DK, EL, ES, FR, HR, HU, IE, IS, IT, LV, MT, NL, PL, PT, RO, SI, SK (n = 22) | Quadratic | 1.00027 | 0.019 | 1.00004–1.00049 |
| 2020–2021 | AT, BE, BG, CY, CZ, DE, DK, EE, EL, ES, FR, HR, HU, IE, IS, IT, LT, LU, LV, MT, NL, PL, PT, RO, SI, SK (n = 26) | Quadratic | 1.00023 | 0.017 | 1.00004–1.00046 |
Abbreviations: CI, confidence interval; OR, odds ratio.
Note: OR varies from 0 to infinity. When odds ratio equals 1 or CI includes 1, the association is not considered statistically significant. The category ‘food‐producing animals’ includes broilers, turkeys, pigs and calves.
FIGURE B.12.

Consumption of tetracyclines in food‐producing animals and the probability of resistance to tetracyclines in indicator Salmonella spp. from food‐producing animals, EU/EEA, 2019–2021 (see Table B.22). The figure displays the results of logistic regression analyses. Bubbles represent the countries included in the analysis. The size of the bubbles indicates the amount of available resistance data per country. Category ‘food‐producing animals’ includes broilers, turkeys, pigs and calves for all three time considered intervals.
Statistically significant positive associations between tetracycline resistance in Salmonella and tetracycline consumption in food‐producing animals were observed in all the 2‐year intervals considered. Although positive associations were statistically significant, it is noteworthy that the significance of the effect of consumption disappears when one outlying country is excluded from the analysis. Although the country follows the expected pattern of a higher consumption associated with a higher resistance, both consumption and proportion of resistance are exceptionally high. For the three time intervals considered, without the outlier data, the clouds are very scattered, and no clear pattern can be identified.
B.6.2.2. Salmonella spp. from pigs and poultry
No significant association was shown between the consumption of tetracyclines and resistance to tetracyclines in Salmonella spp. from pigs (2019, 2021) or poultry (2020) (Table B.23).
TABLE B.23.
Consumption of tetracyclines by pigs and poultry and the probability of resistance to tetracyclines in Salmonella spp. isolates from pigs and poultry, EU/EEA, 2019–2021 (logistic regression).
| FPA | Year | Country | Model | OR | p‐value | 95% CI |
|---|---|---|---|---|---|---|
| Pigs | 2019 | BE, DE, DK, ES, FR, HR, HU, IE, IS, IT, MT, NL, PL, PT (n = 14) | Quadratic | 1.00 | 0.931 | 0.98–1.02 |
| Pigs | 2021 | AT, BE, BG, CY, DE, DK, EE, ES, FR, HR, HU, IE, IS, IT, LT, LU, LV, MT, NL, PL, PT, RO, SI, SK (n = 24) | Quadratic | 1.00 | 0.214 | 0.97–1.01 |
| Poultry | 2020 | AT, BE, CY, CZ, DE, EL, ES, FR, HR, HU, IT, MT, PL, PT, RO, SI, SK (n = 17) | log | 1.33 | 0.244 | 0.82–2.13 |
Abbreviations: CI, confidence interval; FPA, food‐producing animals; OR, odds ratio.
Note: OR varies from 0 to infinity. When OR equals 1 or CI includes 1, the association is not considered statistically significant.
B.6.3. Resistance of Salmonella spp. from humans and food‐producing animals
B.6.3.1. Salmonella spp. from humans and Salmonella SIMR
A borderline significant association was found between the SIMR for Salmonella spp. from food‐producing animals and Salmonella isolates from humans in 2019, but in the other 2 years no significant association was observed (Table B.24).
TABLE B.24.
Probability of resistance to tetracyclines in Salmonella spp. from humans and food‐producing animals, EU/EEA, 2019–2021 (logistic regression).
| Year | Countries | Model | OR | p‐value | 95% CI |
|---|---|---|---|---|---|
| 2019 | AT, BE, DE, DK, EL, ES, FR, IE, IT, PL, PT, RO, SI, SK (n = 14) | log | 1.83 | 0.076 | 0.939–3.57 |
| 2020 | AT, BE, DK, EL, ES, FR, HU, IE, IT, NL, PT, RO, SI, SK (n = 14) | log | 1.44 | 0.511 | 0.488–4.22 |
| 2021 | AT, BE, DE, DK, EE, EL, ES, FR, HU, IT, LU, NL, PL, PT, RO, SI, SK (n = 17) | log | 1.06 | 0.801 | 0.687–1.63 |
Abbreviations: CI, confidence interval; OR, odds ratio.
Note: OR varies from 0 to infinity. When OR equals 1 or CI includes 1, the association is not considered statistically significant.
B.6.3.2. Resistance to tetracyclines in isolates of salmonella from humans and from food‐producing animals
Data on the occurrence of tetracycline resistance of Salmonella spp. from humans (2019–2021) were compared with the occurrence of tetracycline resistance of Salmonella spp. from broilers and turkeys (2020), as well as from pigs (2019 and 2021). No evidence of a statistically significant association was found for all tested combinations (Table B.25).
TABLE B.25.
Probability of resistance to tetracyclines in Salmonella spp. from humans and food‐producing animals, EU/EEA, 2019–2021 (logistic regression).
| Year | Country | Model | OR | p‐value | 95% CI | |
|---|---|---|---|---|---|---|
| 2019 | Pigs | BE, DE, DK, ES, FR, IE, IT, NL, PL, PT (n = 10) | log | 1.29 | 0.405 | 0.71–2.37 |
| 2021 | Pigs | AT, BE, DE, DK, EE, EL, ES, FR, HU, IT, LU, NL, PL, PT, RO, SI, SK (n = 17) | log | 0.96 | 0.830 | 0.65–1.42 |
| 2020 | Broilers | AT, BE, DK, EL, ES, FI, FR, HU, IE, IT, NO, PT, RO, SI, SK (n = 15) | log | 1.08 | 0.208 | 0.96–1.23 |
| 2020 | Turkey | AT, BE, ES, FR, HU, IE, IT, PT, RO, SI, SK (n = 11) | log | 1.13 | 0.116 | 0.97–1.32 |
Abbreviations: CI, confidence interval; OR, odds ratio.
Note: OR varies from 0 to infinity. When OR equals 1 or CI includes 1, the association is not considered statistically significant.
B.6.4. Consumption in food‐producing animals and resistance of Salmonella spp. from humans
A significant positive association between the consumption of tetracyclines in food‐producing animals and resistance of human Salmonella isolates was only observed in 2020, but not in 2019 and 2021. However, removal of one influential point in 2020 turned the association insignificant and removal of an influential point in 2021 turned that association significantly positive (Table B.26, Figure B.13).
TABLE B.26.
Consumption of tetracyclines in food‐producing animals, expressed in mg/kg estimated biomass, and the probability of resistance to tetracyclines in Salmonella spp. isolated from humans, EU/EEA, 2019–2021 (logistic regression, see Figure B.13).
| Year | Countries | Model | OR | p‐value | 95% CI |
|---|---|---|---|---|---|
| 2019 | AT, BE, DE, DK, EE, EL, ES, FI, FR, IE, IT, LU, NL, NO, PL, PT, RO, SE, SI, SK (n = 20) | Quadratic | 1.0001 | 0.547 | 0.9998–1.0004 |
| 2020 | AT, BE, DK, EE, EL, ES, FI, FR, HU, IE, IT, LU, NL, NO, PT, RO, SE, SI, SK (n = 19) | Quadratic | 1.0003 | 0.004 | 1.0001–1.0006 |
| 2021 | AT, BE, DE, DK, EE, EL, ES, FI, FR, HU, IT, LU, NL, NO, PL, PT, RO, SE, SI, SK (n = 20) | Quadratic | 1.0001 | 0.518 | 0.9998–1.0004 |
Abbreviations: CI, confidence interval; OR, odds ratio.
Note: OR varies from 0 to infinity. When OR equals 1 or CI includes 1, the association is not considered statistically significant.
FIGURE B.13.

Consumption of tetracyclines in food‐producing animals and the probability of resistance to tetracyclines in Salmonella spp. from humans, EU/EEA, 2019–2021 (see Table B.26). The figure displays the results of logistic regression analyses. Bubbles represent the countries included in the analysis. The size of the bubbles indicates the amount of available resistance data per country.
B.6.5. Multivariate analysis
The analysis involved 12 countries for which all data were available. No significant relationship could be assessed.
ECDC, EFSA and EMA (European Centre for Disease Prevention and Control, European Food Safety Authority and European Medicines Agency) , (2024). Antimicrobial consumption and resistance in bacteria from humans and food‐producing animals. EFSA Journal, 22(2), e8589. 10.2903/j.efsa.2024.8589
Approved: 26 January 2024
This article was originally published on the EFSA website http://www.efsa.europa.eu on 21 February 2024 as part of EFSA's publication procedures
Note: A simplified summary of this scientific report is available at https://efsa.onlinelibrary.wiley.com/doi/10.2903/j.efsa.2024.p220201
Notes
In the univariate analysis, a statistically significant positive association was also found between consumption of third‐ and fourth‐generation cephalosporins in food‐producing animals and resistance to third‐generation cephalosporins in invasive E. coli isolates from humans but not confirmed in the multivariate analysis.
Univariate analyses of data from both humans and food‐producing animals also showed a statistically significant positive association between consumption of fluoroquinolones and other quinolones in food‐producing animals and fluoroquinolone resistance in invasive E. coli isolates from humans. Fluoroquinolone resistance in indicator E. coli isolates from the different food‐producing animal species was also associated with resistance in invasive E. coli isolates from humans for all years (2019–2021). However, these associations were not retained in the final multivariate model.
The maximum residue limit (MRL) is the maximum allowed concentration of a residue in a food product obtained from an animal that has received a veterinary medicine or that has been exposed to a biocidal product for use in animal husbandry. Substances used in food‐producing animals must be included in Table 1 in the annex to Commission Regulation (EU) No 37/2010 of 22 December 2009 on pharmacologically active substances and their classification regarding maximum residue limits in foodstuffs of animal origin https://eur‐lex.europa.eu/legal‐content/EN/TXT/?uri=celex%3A32010R0037
The term granularity reflects here whether the AMC and AMR data relate to an individual farm or hospital, or a region or a country and how representative the measurements of AMC and AMR are in relation to the corresponding population.
Regulation (EU) 2019/6, Article 112.
According to ISO 3166 — Codes for the representation of names of countries and their subdivisions.
Values can differ from those published in previous JIACRA reports due to amendments to data or countries included.
Contributor Information
European Centre for Disease Prevention and Control (ECDC), Email: arhai@ecdc.europa.eu.
European Food Safety Authority (EFSA), Email: zoonoses@efsa.europa.eu.
REFERENCES
- AbuOun, M. , Stubberfield, E. J. , Duggett, N. A. , Kirchner, M. , Dormer, L. , Nunez‐Garcia, J. , Randall, L. P. , Lemma, F. , Crook, D. W. , Teale, C. , Smith, R. P. , & Anjum, M. F. (2017). Mcr‐1 and mcr‐2 variant genes identified in Moraxella species isolated from pigs in Great Britain from 2014 to 2015. Journal of Antimicrobial Chemotherapy, 72(10), 2745–2749. [DOI] [PMC free article] [PubMed] [Google Scholar]
- Akaike, H. (1983). Information measures and model selection. Bulletin de Institute Statistique Institute, 50, 277–290. [Google Scholar]
- AMEG (European Medicines Agency and Antimicrobial Advice Ad Hoc Expert Group) . (2016). Updated advice on the use of colistin products in animals within the European Union: development of resistance and possible impact on human and animal health (EMA/CVMP/CHMP/231573/2016). https://www.ema.europa.eu/documents/scientific‐guideline/updated‐advice‐use‐colistin‐products‐animals‐within‐european‐union‐development‐resistance‐possible_en‐0.pdf
- AMEG (European Medicines Agency and Antimicrobial Advice Ad Hoc Expert Group) . (2019). Categorisation of antibiotics in the European Union (EMA/CVMP/CHMP/682198/2017). https://www.ema.europa.eu/en/documents/report/categorisation‐antibiotics‐european‐union‐answer‐request‐european‐commission‐updating‐scientific_en.pdf
- ANSES (The French Agency for Food Environmental and Occupational Health & Safety) . (2018). Sales survey of veterinary medicinal products containing antimicrobials in France in 2017. Annual Report.
- Blix, H. S. , Engeland, A. , Litleskare, I. , & Rønning, M. (2007). Age‐and gender‐specific antibacterial prescribing in Norway. Journal of Antimicrobial Chemotherapy, 59(5), 971–976. [DOI] [PubMed] [Google Scholar]
- Borowiak, M. , Fischer, J. , Hammerl, J. A. , Hendriksen, R. S. , Szabo, I. , & Malorny, B. (2017). Identification of a novel transposon‐associated phosphoethanolamine transferase gene, mcr‐5, conferring colistin resistance in d‐tartrate fermenting salmonella enterica subsp. enterica serovar Paratyphi B. Journal of Antimicrobial Chemotherapy, 72(12), 3317–3324. [DOI] [PubMed] [Google Scholar]
- Carattoli, A. , Villa, L. , Feudi, C. , Curcio, L. , Orsini, S. , Luppi, A. , Pezzotti, G. , & Magistrali, C. F. (2017). Novel plasmid‐mediated colistin resistance mcr‐4 gene in salmonella and Escherichia coli, Italy 2013, Spain and Belgium, 2015 to 2016. Eurosurveillance, 22(31), 1–5. [DOI] [PMC free article] [PubMed] [Google Scholar]
- Carfora, V. , Diaconu, E. L. , Ianzano, A. , di Matteo, P. , Amoruso, R. , Dell'Aira, E. , Sorbara, L. , Bottoni, F. , Guarneri, F. , Campana, L. , Franco, A. , Alba, P. , & Battisti, A. (2022). The hazard of carbapenemase (OXA‐181)‐producing Escherichia coli spreading in pig and veal calf holdings in Italy in the genomics era: Risk of spill over and spill back between humans and animals. Frontiers in Microbiology, 13, 1016895. [DOI] [PMC free article] [PubMed] [Google Scholar]
- Carroll, L. M. , Gaballa, A. , Guldimann, C. , Sullivan, G. , Henderson, L. O. , Wiedmann, M. , Siragusa, G. , & White, D. (2019). Identification of novel mobilized colistin resistance gene mcr‐9 in a multidrug‐resistant, colistin‐susceptible salmonella enterica serotype Typhimurium isolate. MBio, 10(3), e00853‐19. [DOI] [PMC free article] [PubMed] [Google Scholar]
- Chantziaras, I. , Boyen, F. , Callens, B. , & Dewulf, J. (2014). Correlation between veterinary antimicrobial use and antimicrobial resistance in food‐producing animals: A report on seven countries. Journal of Antimicrobial Chemotherapy, 69(3), 827–834. [DOI] [PubMed] [Google Scholar]
- Cody, A. J. , Maiden, M. C. J. , Strachan, N. J. C. , & McCarthy, N. D. (2019). A systematic review of source attribution of human campylobacteriosis using multilocus sequence typing. Eurosurveillance, 24(43), 1800696. [DOI] [PMC free article] [PubMed] [Google Scholar]
- Darphorn, T. S. , Bel, K. , Koenders‐van Sint Anneland, B. B. , Brul, S. , & ter Kuile, B. H. (2021). Antibiotic resistance plasmid composition and architecture in Escherichia coli isolates from meat. Scientific Reports, 11(1), 1–13. [DOI] [PMC free article] [PubMed] [Google Scholar]
- Denamur, E. , Clermont, O. , Bonacorsi, S. , & Gordon, D. (2020). The population genetics of pathogenic Escherichia coli. Nature Reviews Microbiology, 19, 1–18. [DOI] [PubMed] [Google Scholar]
- Durham, L. , Ge, M. , Cuccia, A. J. , & Quinn, J. P. (2010). Modeling antibiotic resistance to project future rates: quinolone resistance in Escherichia coli. European Journal of Clinical Microbiology & Infectious Diseases, 29(3), 353–356. [DOI] [PubMed] [Google Scholar]
- ECDC (European Centre for Disease Prevention and Control) . (2014). Systematic review of the effectiveness of infection control measures to prevent the transmission of extended‐spectrum beta‐lactamase‐producing Enterobacteriaceae through cross‐border transfer of patients. https://www.ecdc.europa.eu/en/publications‐data/systematic‐review‐effectiveness‐infection‐control‐measures‐prevent‐transmission‐0
- ECDC (European Centre for Disease Prevention and Control) . (2015). European food safety authority, and European medicines agency, first joint report on the integrated analysis of the consumption of antimicrobial agents and occurrence of antimicrobial resistance in bacteria from humans and food‐producing animals (JIACRA). EFSA Journal, 13(1), 4006. [Google Scholar]
- ECDC (European Centre for Disease Prevention and Control) . (2016). Rapid risk assessment: Carbapenem‐resistant Enterobacteriaceae – 14 April 2016. https://www.ecdc.europa.eu/en/publications‐data/rapid‐risk‐assessment‐carbapenem‐resistant‐enterobacteriaceae‐14‐april‐2016
- ECDC (European Centre for Disease Prevention and Control) . (2017c). Surveillance of antimicrobial resistance in Europe 2016. Annual report of the European antimicrobial resistance surveillance network (EARS‐net). Stockholm. https://www.ecdc.europa.eu/en/publications‐data/antimicrobial‐resistance‐surveillance‐europe‐2016
- ECDC (European Centre for Disease Prevention and Control) . (2018a). Surveillance of antimicrobial resistance in Europe – Annual report of the European antimicrobial resistance. Surveillance network (EARS‐net) 2017. Stockholm. https://www.ecdc.europa.eu/en/publications‐data/surveillance‐antimicrobial‐resistance‐europe‐2017
- ECDC (European Centre for Disease Prevention and Control) . (2018b). Rapid risk assessment: Carbapenem‐resistant Enterobacteriaceae ‐ first update 4 June 2018. https://www.ecdc.europa.eu/en/publications‐data/rapid‐risk‐assessment‐carbapenem‐resistant‐enterobacteriaceae‐first‐update
- ECDC (European Centre for Disease Prevention and Control) . (2018). ECDC study protocol for genomic‐based surveillance of carbapenem‐resistant and/or colistin‐resistant Enterobacteriaceae at the EU level. Version 2.0. Stockholm: ECDC. https://www.ecdc.europa.eu/en/publications‐data/ecdc‐study‐protocol‐genomic‐based‐surveillance‐carbapenem‐resistant‐andor
- ECDC (European Centre for Disease Prevention and Control) . (2019a). Antimicrobial consumption ‐ Annual Epidemiological Report for 2018. https://www.ecdc.europa.eu/en/publications‐data/surveillance‐antimicrobial‐consumption‐europe‐2018
- ECDC (European Centre for Disease Prevention and Control) . (2019b). Surveillance of antimicrobial resistance in Europe 2018. Stockholm: ECDC. https://www.ecdc.europa.eu/en/publications‐data/surveillance‐antimicrobial‐resistance‐europe‐2018
- ECDC (European Centre for Disease Prevention and Control) . (2021). European Surveillance of Antimicrobial Consumption Network (ESAC‐Net). Stockholm: ECDC. https://www.ecdc.europa.eu/en/about‐us/partnerships‐and‐networks/disease‐and‐laboratory‐networks/esac‐net
- ECDC (European Centre for Disease Prevention and Control) . (2022a). Antimicrobial consumption in the EU/EEA (ESAC‐Net) ‐ Annual Epidemiological Report 2021 . https://www.ecdc.europa.eu/sites/default/files/documents/ESAC‐Net_AER_2021_final‐rev.pdf
- ECDC (European Centre for Disease Prevention and Control) . (2022b). Antimicrobial resistance in the EU/EEA (EARS‐Net) ‐ Annual Epidemiological Report 2021 . https://www.ecdc.europa.eu/en/publications‐data/surveillance‐antimicrobial‐resistance‐europe‐2021
- ECDC (European Centre for Disease Prevention and Control) . (2022c). Assessing the health burden of infections with antibiotic‐resistant bacteria in the EU/EEA, 2016–2020 . https://www.ecdc.europa.eu/en/publications‐data/health‐burden‐infections‐antibiotic‐resistant‐bacteria‐2016‐2020
- ECDC (European Centre for Disease Prevention and Control) . (2023). Antimicrobial consumption dashboard. https://qap.ecdc.europa.eu/public/extensions/AMC2_Dashboard/AMC2_Dashboard.html
- ECDC (European Centre for Disease Prevention and Control). Surveillance Atlas of Infectious Diseases . https://www.ecdc.europa.eu/en/surveillance‐atlas‐infectious‐diseases
- ECDC, EFSA and EMA (European Centre for Disease Prevention and Control) . (2017a). European food safety authority, and European medicines agency, joint scientific opinion on a list of outcome indicators as regards surveillance of antimicrobial resistance and antimicrobial consumption in humans and food‐producing animals . EFSA Journal, 15(10), 5017. [DOI] [PMC free article] [PubMed] [Google Scholar]
- ECDC, EFSA and EMA (European Centre for Disease Prevention and Control) . (2017b). European food safety authority, and European medicines agency, second joint report on the integrated analysis of the consumption of antimicrobial agents and occurrence of antimicrobial resistance in bacteria from humans and food‐producing animals (JIACRA II) . EFSA Journal, 15(7), 4872. [DOI] [PMC free article] [PubMed] [Google Scholar]
- ECDC, EFSA and EMA (European Centre for Disease Prevention and Control, European Food Safety Authority, and European Medicines Agency) . (2021). Third joint inter‐agency report on integrated analysis of antimicrobial agent consumption and occurrence of antimicrobial resistance in bacteria from humans and food‐producing animals in the EU/EEA, JIACRA III. 2016–2018 . https://www.ecdc.europa.eu/sites/default/files/documents/JIACRA‐III‐Antimicrobial‐Consumption‐and‐Resistance‐in‐Bacteria‐from‐Humans‐and‐Animals.pdf
- Effelsberg, N. , Kobusch, I. , Linnemann, S. , Hofmann, F. , Schollenbruch, H. , Mellmann, A. , Boelhauve, M. , Köck, R. , & Cuny, C. (2021). Prevalence and zoonotic transmission of colistin‐resistant and carbapenemase‐producing Enterobacterales on German pig farms. One Health, 13, 100354. [DOI] [PMC free article] [PubMed] [Google Scholar]
- EFSA (European Food Safety Authority) . (2007). Report of the Task Force on Zoonoses Data Collection including a proposal for a harmonized monitoring scheme of antimicrobial resistance in Salmonella in fowl (Gallus gallus), turkeys and pigs and Campylobacter jejuni and C. coli in broilers. EFSA Journal , 96. http://www.efsa.europa.eu/en/efsajournal/pub/96r.htm
- EFSA (European Food Safety Authority) . (2008). Report from the Task Force on Zoonoses Data Collection including guidance for harmonized monitoring and reporting of antimicrobial resistance in commensal Escherichia coli and Enterococcus spp. from food animals. EFSA Journal , 141. http://www.efsa.europa.eu/en/efsajournal/pub/141r.htm
- EFSA (European Food Safety Authority) . (2017). Risk for the development of antimicrobial resistance (AMR) due to feeding of calves with milk containing residues of antibiotics. EFSA Journal, 15(1), e04665. 10.2903/j.efsa.2017.4665 [DOI] [PMC free article] [PubMed] [Google Scholar]
- EFSA and ECDC (European Food Safety Authority and European Centre for Disease Prevention and Control) . (2015). EU summary report on antimicrobial resistance in zoonotic and indicator bacteria from humans, animals and food in 2013. EFSA Journal, 13(2), 4036. [DOI] [PMC free article] [PubMed] [Google Scholar]
- EFSA and ECDC (European Food Safety Authority and European Centre for Disease Prevention and Control) . (2016). The European Union summary report on antimicrobial resistance in zoonotic and indicator bacteria from humans, animals and food in 2014. EFSA Journal, 14(2), 4380. [DOI] [PMC free article] [PubMed] [Google Scholar]
- EFSA and ECDC (European Food Safety Authority and European Centre for Disease Prevention and Control) . (2017). The European Union summary report on antimicrobial resistance in zoonotic and indicator bacteria from humans, animals and food in 2015. EFSA Journal, 15(2), 4694. [DOI] [PMC free article] [PubMed] [Google Scholar]
- EFSA and ECDC (European Food Safety Authority and European Centre for Disease Prevention and Control) . (2020). The European Union Summary Report on Antimicrobial Resistance in zoonotic and indicator bacteria from humans, animals and food in 2017/2018. EFSA Journal, 18(3), 6007. [DOI] [PMC free article] [PubMed] [Google Scholar]
- EFSA and ECDC (European Food Safety Authority and European Centre for Disease Prevention and Control) . (2023). The European Union summary report on antimicrobial resistance in zoonotic and indicator bacteria from humans, animals and food in 2020/2021. EFSA Journal, 21(3), 1–232. [DOI] [PMC free article] [PubMed] [Google Scholar]
- EFSA BIOHAZ Panel (EFSA Panel on Biological Hazards) . (2011). Scientific opinion on the public health risks of bacterial strains producing extended‐spectrum β‐lactamases and/or AmpC β‐lactamases in food and food‐producing animals. EFSA Journal, 9(8), 2322. [Google Scholar]
- EMA (European Medicines Agency) . (2023). Fluoroquinolone antibiotics: reminder of measures to reduce the risk of long‐lasting, disabling and potentially irreversible side effects . https://www.ema.europa.eu/en/news/fluoroquinolone‐antibiotics‐reminder‐measures‐reduce‐risk‐long‐lasting‐disabling‐potentially
- EMA and CVMP (European Medicines Agency and Committee for Medicinal Products for Veterinary Use) . (1999). Ceftiofur. Summary Report (2). EMEA/MRL/498/98‐FINAL . https://www.ema.europa.eu/en/documents/mrl‐report/ceftiofur‐summary‐report‐2‐committee‐veterinary‐medicinal‐products_en.pdf
- EMA and CVMP (European Medicines Agency and Committee for Medicinal Products for Veterinary Use) . (2012). Opinion following an Article 35 referral for all veterinary medicinal products containing systemically administered (parenteral and oral) 3rd and 4th generation cephalosporins intended for use in food producing species . https://www.ema.europa.eu/en/documents/referral/opinion‐following‐article‐35‐referral‐all‐veterinary‐medicinal‐products‐containing‐systemically_en.pdf
- EMA, CVMP and SAGAM (European Medicines Agency, Committee for Medicinal Products for Veterinary Use, and Scientific Advisory Group on Antimicrobials) . (2009). Revised reflection paper on the use of 3rd and 4th generation cephalosporins in food producing animals in the European Union: development of resistance and impact on human and animal health (EMEA/CVMP/SAGAM/81730/2006‐Rev.1) . https://www.ema.europa.eu/documents/scientific‐guideline/revised‐reflection‐paper‐use‐third‐fourth‐generation‐cephalosporins‐food‐producing‐animals‐european_en.pdf
- ESVAC (European Medicines Agency and European Surveillance of Veterinary Antimicrobial Consumption) . (2011). Trends in the sales of veterinary antimicrobial agents in nine European countries. Reporting period: 2005–2009 (EMA/238630/2011) . https://www.ema.europa.eu/en/documents/report/trends‐sales‐veterinary‐antimicrobial‐agents‐nine‐european‐countries_en.pdf
- ESVAC (European Medicines Agency and European Surveillance of Veterinary Antimicrobial Consumption) . (2015). Principles on assignment of defined daily dose for animals (DDDvet) and defined course dose for animals (DCDvet) (EMA/710019/2014) . https://www.ema.europa.eu/en/documents/scientific‐guideline/principles‐assignment‐defined‐daily‐dose‐animals‐dddvet‐defined‐course‐dose‐animals‐dcdvet_en.pdf
- ESVAC (European Medicines Agency and European Surveillance of Veterinary Antimicrobial Consumption) . (2020). https://www.ema.europa.eu/en/veterinary‐regulatory/overview/antimicrobial‐resistance/european‐surveillance‐veterinary‐antimicrobial‐consumption‐esvac
- ESVAC (European Medicines Agency and European Surveillance of Veterinary Antimicrobial Consumption) . (2021). Sales of veterinary antimicrobial agents in 31 European countries in 2019 and 2020. Trends from 2010 to 2020. Eleventh ESVAC report (EMA/58183/2021). https://www.ema.europa.eu/system/files/documents/report/esvac_report_2019_2020_en_0.pdf
- ESVAC (European Medicines Agency and European Surveillance of Veterinary Antimicrobial Consumption) . (2022). Sales of veterinary antimicrobial agents in 31 European countries in 2021. Trends from 2010 to 2021. Twelfth ESVAC report (EMA/795956/2022) . https://www.ema.europa.eu/en/documents/report/sales‐veterinary‐antimicrobial‐agents‐31‐european‐countries‐2021‐trends‐2010‐2021‐twelfth‐esvac_en.pdf
- European Centre for Disease Prevention and Control and TESSy (The European Surveillance System) . (2023). Antimicrobial consumption (AMC) reporting protocol 2023 – European Surveillance of Antimicrobial Consumption Network (ESAC‐Net) surveillance data for 2022 . https://www.ecdc.europa.eu/sites/default/files/documents/ESACNet_protocol_2023.pdf
- European Commission . (2017). A European One Health Action Plan against Antimicrobial Resistance (AMR) . https://ec.europa.eu/health/sites/health/files/antimicrobial_resistance/docs/amr_2017_action‐plan.pdf
- Eurostat . (2023). Hospital days of in‐patients . https://ec.europa.eu/eurostat/databrowser/view/hlth_co_hosday/default/table?lang=en
- Flor, M. , et al. (2018). Beiträge Zur Evaluierung Der 16. AMG‐Novelle ‐Themenkomplex 1: Entwicklung der Antibiotikaabgabe ‐ und ‐verbrauchsmengen sowie der Therapiehäufigkeit .
- Franco, A. , Leekitcharoenphon, P. , Feltrin, F. , Alba, P. , Cordaro, G. , Iurescia, M. , Tolli, R. , D'Incau, M. , Staffolani, M. , di Giannatale, E. , Hendriksen, R. S. , & Battisti, A. (2015). Emergence of a clonal lineage of multidrug‐resistant ESBL‐producing salmonella Infantis transmitted from broilers and broiler meat to humans in Italy between 2011 and 2014. PLoS One, 10(12), e0144802. [DOI] [PMC free article] [PubMed] [Google Scholar]
- French, N. P. , Zhang, J. , Carter, G. P. , Midwinter, A. C. , Biggs, P. J. , Dyet, K. , Gilpin, B. J. , Ingle, D. J. , Mulqueen, K. , Rogers, L. E. , Wilkinson, D. A. , Greening, S. S. , Muellner, P. , Fayaz, A. , & Williamson, D. A. (2019). Genomic analysis of fluoroquinolone‐and tetracycline‐resistant campylobacter jejuni sequence type 6964 in humans and poultry, New Zealand, 2014–2016. Emerging Infectious Diseases, 25(12), 2226–2234. [DOI] [PMC free article] [PubMed] [Google Scholar]
- Gallini, A. , Degris, E. , Desplas, M. , Bourrel, R. , Archambaud, M. , Montastruc, J. L. , Lapeyre‐Mestre, M. , & Sommet, A. (2010). Influence of fluoroquinolone consumption in inpatients and outpatients on ciprofloxacin‐resistant Escherichia coli in a university hospital. Journal of Antimicrobial Chemotherapy, 65, 2650–2657. [DOI] [PubMed] [Google Scholar]
- García, P. , Malorny, B. , Rodicio, M. R. , Stephan, R. , Hachler, H. , Guerra, B. , & Lucarelli, P. (2016). Horizontal acquisition of a multidrug‐resistance module (R‐type ASSuT) is responsible for the monophasic phenotype in a widespread clone of salmonella serovar 4,[5], 12: i. Frontiers in Microbiology, 7, 680. [DOI] [PMC free article] [PubMed] [Google Scholar]
- Goyal, D. , Dean, N. , Neill, S. , Jones, P. , & Dascomb, K. (2019). Risk factors for community‐acquired extended‐spectrum beta‐lactamase–producing Enterobacteriaceae infections—A retrospective study of symptomatic urinary tract infections. In Open forum infectious diseases (Vol. 6). Oxford University Press, USA. [DOI] [PMC free article] [PubMed] [Google Scholar]
- Hammerum, A. M. , Larsen, J. , Andersen, V. D. , Lester, C. H. , Skovgaard Skytte, T. S. , Hansen, F. , Olsen, S. S. , Mordhorst, H. , Skov, R. L. , Aarestrup, F. M. , & Agersø, Y. (2014). Characterization of extended‐spectrum β‐lactamase (ESBL)‐producing Escherichia coli obtained from Danish pigs, pig farmers and their families from farms with high or no consumption of third‐or fourth‐generation cephalosporins. Journal of Antimicrobial Chemotherapy, 69(10), 2650–2657. [DOI] [PubMed] [Google Scholar]
- Haverkate, M. R. , Platteel, T. N. , Fluit, A. C. , Cohen Stuart, J. W. , Leverstein‐van Hall, M. A. , Thijsen, S. F. T. , Scharringa, J. , Kloosterman, R. C. , Bonten, M. J. M. , & Bootsma, M. C. J. (2017). Quantifying within‐household transmission of extended‐spectrum β‐lactamase‐producing bacteria. Clinical Microbiology and Infection, 23(1), 46.e1–46.e7. [DOI] [PubMed] [Google Scholar]
- Hawkey, J. , le Hello, S. , Doublet, B. , Granier, S. A. , Hendriksen, R. S. , Fricke, W. F. , Ceyssens, P. J. , Gomart, C. , Billman‐Jacobe, H. , Holt, K. E. , & Weill, F. X. (2019). Global phylogenomics of multidrug‐resistant salmonella enterica serotype Kentucky ST198. Microbial Genomics, 5(7), 1–12. [DOI] [PMC free article] [PubMed] [Google Scholar]
- Hesp, A. , Veldman, K. , van der Goot, J. , Mevis, D. , & van Schaik, G. (2019). Monitoring antimicrobial resistance trends in commensal Escherichia coli from livestock, The Netherlands, 1998 to 2016. Eurosurveillance, 24(25), 1800438. [DOI] [PMC free article] [PubMed] [Google Scholar]
- Heuer, O. E. , et al. (2014). Proportions of community‐associated and healthcare‐associated isolates in the EARS‐Net data vary depending on pathogen and antimicrobial combination – analysis of EARS‐Net data 2011–2012 (poster). in ECCMID 2014 .
- Högberg, L. D. , Vlahović‐Palčevski, V. , Pereira, C. , Weist, K. , Monnet, D. L. , & ESAC‐Net study group . (2021). Decrease in community antibiotic consumption during the COVID‐19 pandemic, EU/EEA, 2020. Eurosurveillance, 26(46), 2101020. [DOI] [PMC free article] [PubMed] [Google Scholar]
- Hur, B. A. , Hardefeldt, L. Y. , Verspoor, K. M. , Baldwin, T. , & Gilkerson, J. R. (2020). Describing the antimicrobial usage patterns of companion animal veterinary practices; free text analysis of more than 4.4 million consultation records. PLoS One, 15(3), e0230049. [DOI] [PMC free article] [PubMed] [Google Scholar]
- Irrgang, A. , Roschanski, N. , Tenhagen, B. A. , Grobbel, M. , Skladnikiewicz‐Ziemer, T. , Thomas, K. , Roesler, U. , & Käsbohrer, A. (2016). Prevalence of mcr‐1 in E. Coli from livestock and food in Germany, 2010–2015. PLoS One, 11(7), 1–10. [DOI] [PMC free article] [PubMed] [Google Scholar]
- Jansen, W. , van Hout, J. , Wiegel, J. , Iatridou, D. , Chantziaras, I. , & de Briyne, N. (2022). Colistin use in European livestock: Veterinary field data on trends and perspectives for further reduction. Veterinary Sciences, 9(11), 650. [DOI] [PMC free article] [PubMed] [Google Scholar]
- Jensen, U. S. , Muller, A. , Brandt, C. T. , Frimodt‐Moller, N. , Hammerum, A. M. , Monnet, D. L. , & DANRES study group . (2010). Effect of generics on price and consumption of ciprofloxacin in primary healthcare: The relationship to increasing resistance. Journal of Antimicrobial Chemotherapy, 65, 1286–1291. [DOI] [PubMed] [Google Scholar]
- Kovač, J. , Cadez, N. , Lusicky, M. , Nielsen, E. , Ocepek, M. , Raspor, P. , & Smole Mozia, S. (2014). The evidence for clonal spreading of quinolone resistance with a particular clonal complex of campylobacter jejuni. Epidemiology & Infection, 142(12), 2595–2603. [DOI] [PMC free article] [PubMed] [Google Scholar]
- Lima, T. , Domingues, S. , & Da Silva, G. J. (2019). Plasmid‐mediated colistin resistance in Salmonella enterica: a review. Microorganisms, 7(2), 55. [DOI] [PMC free article] [PubMed] [Google Scholar]
- Magiorakos, A. , Magiorakos, A. P. , Burns, K. , Rodríguez Baño, J. , Borg, M. , Daikos, G. , Dumpis, U. , Lucet, J. C. , Moro, M. L. , Tacconelli, E. , Skov Simonsen, G. , Szilágyi, E. , Voss, A. , & Weber, J. T. (2017). Infection prevention and control measures and tools for the prevention of entry of carbapenem‐resistant Enterobacteriaceae into healthcare settings: Guidance from the European Centre for Disease Prevention and Control. Antimicrobial Resistance & Infection Control, 6(1), 1–17. [DOI] [PMC free article] [PubMed] [Google Scholar]
- Marques, C. , Belas, A. , Franco, A. , Aboim, C. , Gama, L. T. , & Pomba, C. (2018). Increase in antimicrobial resistance and emergence of major international high‐risk clonal lineages in dogs and cats with urinary tract infection: 16 year retrospective study. Journal of Antimicrobial Chemotherapy, 73(2), 377–384. [DOI] [PMC free article] [PubMed] [Google Scholar]
- Mateus, A. , Brodbelt, D. C. , Barber, N. , & Stärk, K. D. C. (2011). Antimicrobial usage in dogs and cats in first opinion veterinary practices in the UK. Journal of Small Animal Practice, 52(10), 515–521. [DOI] [PubMed] [Google Scholar]
- Méndez, M. , & Moreno, M. A. (2020). Quantifying antimicrobial exposure in dogs from a longitudinal study. Frontiers in Veterinary Science, 7, 545. [DOI] [PMC free article] [PubMed] [Google Scholar]
- Menezes, J. , Moreira da Silva, J. , Frosini, S. M. , Loeffler, A. , Weese, S. , Perreten, V. , Schwarz, S. , Telo da Gama, L. , Amaral, A. J. , & Pomba, C. (2022). Mcr‐1 colistin resistance gene sharing between Escherichia coli from cohabiting dogs and humans, Lisbon, Portugal, 2018 to 2020. Eurosurveillance, 27(44), 2101144. [DOI] [PMC free article] [PubMed] [Google Scholar]
- Merle, R. , Hajek, P. , Käsbohrer, A. , Hegger‐Gravenhorst, C. , Mollenhauer, Y. , Robanus, M. , Ungemach, F. R. , & Kreienbrock, L. (2012). Monitoring of antibiotic consumption in livestock: A German feasibility study. Preventive Veterinary Medicine, 104(1–2), 34–43. [DOI] [PubMed] [Google Scholar]
- Mesa‐Varona, O. , Kaspar, H. , Grobbel, M. , & Tenhagen, B. A. (2020). Phenotypical antimicrobial resistance data of clinical and non‐clinical Escherichia coli from poultry in Germany between 2014 and 2017. PLoS One, 15(12), e0243772. [DOI] [PMC free article] [PubMed] [Google Scholar]
- Mezzatesta, M. , Gona, F. , Caio, C. , Petrolito, V. , Sciortino, D. , Sciacca, A. , Santangelo, C. , & Stefani, S. (2011). Outbreak of KPC‐3‐producing, and colistin‐resistant, Klebsiella pneumoniae infections in two Sicilian hospitals. Clinical Microbiology and Infection, 17(9), 1444–1447. [DOI] [PubMed] [Google Scholar]
- Molenberghs, G. , & Verbeke, G. (2005). Models for discrete longitudinal data. Springer‐Verlag. [Google Scholar]
- Monaco, M. , Giani, T. , Raffone, M. , Arena, F. , Garcia‐Fernandez, A. , Pollini, S. , Network EuSCAPE‐Italy , Grundmann, H. , Pantosti, A. , & Rossolini, G. M. (2014). Colistin resistance superimposed to endemic carbapenem‐resistant Klebsiella pneumoniae: A rapidly evolving problem in Italy, November 2013 to April 2014. Eurosurveillance, 19(42), 20939. [DOI] [PubMed] [Google Scholar]
- Mughini‐Gras, L. , Dorado‐García, A. , van Duijkeren, E. , van den Bunt, G. , Dierikx, C. M. , Bonten, M. J. M. , Bootsma, M. C. J. , Schmitt, H. , Hald, T. , Evers, E. G. , de Koeijer, A. , van Pelt, W. , Franz, E. , Mevius, D. J. , Heederik, D. J. J. , & ESBL Attribution Consortium . (2019). Attributable sources of community‐acquired carriage of Escherichia coli containing β‐lactam antibiotic resistance genes: A population‐based modelling study. The Lancet Planetary Health, 3(8), e357–e369. [DOI] [PubMed] [Google Scholar]
- Nordhoff, K. , Scharlach, M. , Effelsberg, N. , Knorr, C. , Rocker, D. , Claussen, K. , Egelkamp, R. , Mellmann, A. C. , Moss, A. , Müller, I. , Roth, S. A. , Werckenthin, C. , Wöhlke, A. , Ehlers, J. , & Köck, R. (2023). Epidemiology and zoonotic transmission of mcr‐positive and carbapenemase‐producing Enterobacterales on German Turkey farms. Frontiers in Microbiology, 14, 1183984. [DOI] [PMC free article] [PubMed] [Google Scholar]
- Official Journal of the European Union . (2002). Regulation (EC) No 178/2002 of the European Parliament and of the Council of 28 January 2002 laying down the general principles and requirements of food law, establishing the European Food Safety Authority and laying down procedures in matters of food safety. https://eur‐lex.europa.eu/legal‐content/EN/TXT/?qid=1418924147681&uri=CELEX:32002R0178
- Official Journal of the European Union . (2003). Directive 2003/99/EC of the European Parliament and of the Council of 17 November 2003 on the monitoring of zoonoses and zoonotic agents, amending Council Decision 90/424/EEC and repealing Council Directive 92/117/EEC. https://eur‐lex.europa.eu/legal‐content/EN/TXT/?uri=CELEX:32003L0099
- Official Journal of the European Union . (2004). Regulation (EC) No 851/2004 of the European Parliament and of the Council of 21 april 2004 establishing a European Centre for disease prevention and control. https://eur‐lex.europa.eu/legal‐content/EN/ALL/?uri=celex%3A32004R0851
- Official Journal of the European Union . (2019). Regulation (EU) 2019/5 of the European Parliament and of the Council of 11 December 2018 amending Regulation (EC) No 726/2004 laying down Community procedures for the authorisation and supervision of medicinal products for human and veterinary use and establishing a European Medicines Agency, Regulation (EC) No 1901/2006 on medicinal products for paediatric use and Directive 2001/83/EC on the Community code relating to medicinal products for human use. https://eur‐lex.europa.eu/legal‐content/EN/TXT/?uri=CELEX%3A32019R0005
- Official Journal of the European Union . (2020). Commission Implementing Decision (EU) 2020/1729 of 17 November 2020 on the monitoring and reporting of antimicrobial resistance in zoonotic and commensal bacteria and repealing Implementing Decision 2013/652/EU (notified under document C(2020) 7894). http://data.europa.eu/eli/dec_impl/2020/1729/oj
- Official Journal of the European Union . (2022a). Regulation (EU) 2022/2371 of the European Parliament and of the Council of 23 November 2022 on serious cross‐border threats to health and repealing Decision No 1082/2013/EU. https://eur‐lex.europa.eu/legal‐content/EN/TXT/?uri=CELEX%3A32022R2371
- Official Journal of the European Union . (2022b). Commission Implementing Regulation (EU) 2022/1255 of 19 July 2022 designating antimicrobials or groups of antimicrobials reserved for treatment of certain infections in humans, in accordance with Regulation (EU) 2019/6 of the European Parliament and of the Council. https://eur‐lex.europa.eu/legal‐content/EN/TXT/?uri=CELEX:32022R1255
- Parisi, S. G. , Bartolini, A. , Santacatterina, E. , Castellani, E. , Ghirardo, R. , Berto, A. , Franchin, E. , Menegotto, N. , de Canale, E. , Tommasini, T. , Rinaldi, R. , Basso, M. , Stefani, S. , & Palù, G. (2015). Prevalence of Klebsiella pneumoniae strains producing carbapenemases and increase of resistance to colistin in an Italian teaching hospital from January 2012 to December 2014. BMC Infectious Diseases, 15(1), 244. [DOI] [PMC free article] [PubMed] [Google Scholar]
- Peñalva, G. , Högberg, L. D. , Weist, K. , Vlahović‐Palčevski, V. , Heuer, O. , Monnet, D. L. , ESAC‐Net study group , & EARS‐Net study group . (2019). Decreasing and stabilising trends of antimicrobial consumption and resistance in Escherichia coli and Klebsiella pneumoniae in segmented regression analysis, European Union/European economic area, 2001 to 2018. Eurosurveillance, 24(46), 1900656. [DOI] [PMC free article] [PubMed] [Google Scholar]
- Platell, J. L. , Johnson, J. R. , Cobbold, R. N. , & Trott, D. J. (2011). Multidrug‐resistant extraintestinal pathogenic Escherichia coli of sequence type ST131 in animals and foods. Veterinary Microbiology, 153(1–2), 99–108. [DOI] [PubMed] [Google Scholar]
- Pomba, C. , Rantala, M. , Greko, C. , Baptiste, K. E. , Catry, B. , van Duijkeren, E. , Mateus, A. , Moreno, M. A. , Pyörälä, S. , Ružauskas, M. , Sanders, P. , Teale, C. , Threlfall, E. J. , Kunsagi, Z. , Torren‐Edo, J. , Jukes, H. , & Törneke, K. (2017). Public health risk of antimicrobial resistance transfer from companion animals. Journal of Antimicrobial Chemotherapy, 72(4), 957–968. [DOI] [PubMed] [Google Scholar]
- Rhouma, M. , Madec, J.‐Y. , & Laxminarayan, R. (2023). Colistin: From the shadows to a one health approach for addressing antimicrobial resistance. International Journal of Antimicrobial Agents, 61, 106713. [DOI] [PubMed] [Google Scholar]
- Rosner, B. M. , Schielke, A. , Didelot, X. , Kops, F. , Breidenbach, J. , Willirich, N. , Golz, G. , Alter, T. , Stingl, K. , Josenhans, C. , Suerbaum, S. , & Stark, K. (2017). A combined case‐control and molecular source attribution study of human campylobacter infections in Germany, 2011–2014. Scientific Reports, 7(1), 1–12. [DOI] [PMC free article] [PubMed] [Google Scholar]
- Roth, N. , Käsbohrer, A. , Mayrhofer, S. , Zitz, U. , Hofacre, C. , & Domig, K. J. (2019). The application of antibiotics in broiler production and the resulting antibiotic resistance in Escherichia coli: A global overview. Poultry Science, 98(4), 1791–1804. [DOI] [PMC free article] [PubMed] [Google Scholar]
- Saidenberg, A. B. S. , Stegger, M. , Price, L. B. , Johannesen, T. B. , Aziz, M. , Cunha, M. P. V. , Moreno, A. M. , & Knöbl, T. (2020). Mcr‐positive Escherichia coli ST131‐H22 from poultry in Brazil. Emerging Infectious Diseases, 26(8), 1951–1954. [DOI] [PMC free article] [PubMed] [Google Scholar]
- Sanchez, G. (2013). PLS path modeling with R, in Berkeley: Trowchez editions, 383. https://www.gastonsanchez.com/PLS_Path_Modeling_with_R.pdf [Google Scholar]
- Shafiq, M. , Huang, J. , ur Rahman, S. , Shah, J. M. , Chen, L. , Gao, Y. , Wang, M. , & Wang, L. (2019). High incidence of multidrug‐resistant Escherichia coli coharboring mcr‐1 and blaCTX‐M‐15 recovered from pigs. Infection and Drug Resistance, 12, 2135–2149. [DOI] [PMC free article] [PubMed] [Google Scholar]
- Skov, R. L. , & Monnet, D. L. (2016). Plasmid‐mediated colistin resistance (mcr‐1 gene): Three months later, the story unfolds. Euro surveillance: Bulletin europeen sur les maladies transmissibles =. European Communicable Disease Bulletin, 21(9), 30155. [DOI] [PubMed] [Google Scholar]
- SSI (Statens Serum Institut) . (2020). Campylobacter infections, 2018–19. Genetic monitoring of campylobacter infections. EPI‐NEWS No 6–2020. https://en.ssi.dk/news/epi‐news/2020/no‐6‐‐‐2020
- Sundqvist, M. (2014). Reversibility of antibiotic resistance. Upsala Journal of Medical Sciences, 119(2), 142–148. [DOI] [PMC free article] [PubMed] [Google Scholar]
- Tacconelli, E. , Górska, A. , de Angelis, G. , Lammens, C. , Restuccia, G. , Schrenzel, J. , Huson, D. H. , Carević, B. , Preoţescu, L. , Carmeli, Y. , Kazma, M. , Spanu, T. , Carrara, E. , Malhotra‐Kumar, S. , & Gladstone, B. P. (2020). Estimating the association between antibiotic exposure and colonization with extended‐spectrum β‐lactamase‐producing gram‐negative bacteria using machine learning methods: A multicentre, prospective cohort study. Clinical Microbiology and Infection, 26(1), 87–94. [DOI] [PubMed] [Google Scholar]
- Tenenhaus, M. , Vinzi, V. E. , Chatelin, Y. M. , & Lauro, C. (2005). PLS path modeling. Computational Statistics & Data Analysis, 48(1), 159–205. [Google Scholar]
- Tenhagen, B.‐A. , Käsbohrer, A. , Grobbel, M. , Hammerl, J. , & Kaspar, H. (2020). Antimicrobial resistance in E. Coli from different cattle populations in Germany. Tierarztliche Praxis. Ausgabe G, Grosstiere/Nutztiere, 48(4), 218–227. [DOI] [PMC free article] [PubMed] [Google Scholar]
- Theuretzbacher, U. (2014). Product information for parenteral colistin varies substantially across Europe. Journal of Antimicrobial Chemotherapy, 69, 1987–1992. [DOI] [PubMed] [Google Scholar]
- Van den Bunt, G. , Liakopoulos, A. , Mevius, D. J. , Geurts, Y. , Fluit, A. C. , Bonten, M. J. M. , Mughini‐Gras, L. , & van Pelt, W. (2016). ESBL/AmpC‐producing Enterobacteriaceae in households with children of preschool age: Prevalence, risk factors and co‐carriage. Journal of Antimicrobial Chemotherapy, 72, 589–595. [DOI] [PubMed] [Google Scholar]
- Verbeke, G. , & Molenberghs, G. (2011). Random Effects Models for Longitudinal Data. In Linear mixed models for longitudinal data. Springer. [Google Scholar]
- Walther, B. , Hermes, J. , Cuny, C. , Wieler, L. H. , Vincze, S. , Abou Elnaga, Y. , Stamm, I. , Kopp, P. A. , Kohn, B. , Witte, W. , Jansen, A. , Conraths, F. J. , Semmler, T. , Eckmanns, T. , & Lübke‐Becker, A. (2012). Sharing more than friendship—Nasal colonization with coagulase‐positive staphylococci (CPS) and co‐habitation aspects of dogs and their owners. PLoS One, 7(4), e35197. [DOI] [PMC free article] [PubMed] [Google Scholar]
- Wang, C. , Feng, Y. , Liu, L. , Wei, L. , Kang, M. , & Zong, Z. (2020). Identification of novel mobile colistin resistance gene mcr‐10. Emerging Microbes & Infections, 9(1), 508–516. [DOI] [PMC free article] [PubMed] [Google Scholar]
- Wang, X. , Wang, Y. , Zhou, Y. , Li, J. , Yin, W. , Wang, S. , Zhang, S. , Shen, J. , Shen, Z. , & Wang, Y. (2018). Emergence of a novel mobile colistin resistance gene, mcr‐8, in NDM‐producing Klebsiella pneumoniae. Emerging Microbes & Infections, 7(1), 1–9. [DOI] [PMC free article] [PubMed] [Google Scholar]
- Wang, Y. , Xu, C. , Zhang, R. , Chen, Y. , Shen, Y. , Hu, F. , Liu, D. , Lu, J. , Guo, Y. , Xia, X. , Jiang, J. , Wang, X. , Fu, Y. , Yang, L. , Wang, J. , Li, J. , Cai, C. , Yin, D. , Che, J. , … Shen, J. (2020). Changes in colistin resistance and mcr‐1 abundance in Escherichia coli of animal and human origins following the ban of colistin‐positive additives in China: An epidemiological comparative study. The Lancet Infectious Diseases, 20(10), 1126. [DOI] [PubMed] [Google Scholar]
- Welker, S. , Boutin, S. , Miethke, T. , Heeg, K. , & Nurjadi, D. (2020). Emergence of carbapenem‐resistant ST131 Escherichia coli carrying blaOXA‐244 in Germany, 2019 to 2020. Eurosurveillance, 25(46), 2001815. [DOI] [PMC free article] [PubMed] [Google Scholar]
- Weterings, V. , Zhou, K. , Rossen, J. W. , van Stenis, D. , Thewessen, E. , Kluytmans, J. , & Veenemans, J. (2015). An outbreak of colistin‐resistant Klebsiella pneumoniae carbapenemase‐producing Klebsiella pneumoniae in The Netherlands (July to December 2013), with inter‐institutional spread. European Journal of Clinical Microbiology & Infectious Diseases, 34(8), 1647–1655. [DOI] [PubMed] [Google Scholar]
- WHO (World Health Organization) . (2017). Guidelines for the prevention and control of carbapenem‐resistant Enterobacteriaceae, Acinetobacter baumannii and Pseudomonas aeruginosa in health care facilities. https://apps.who.int/iris/handle/10665/259462 [PubMed]
- WHO (World Health Organization) . (2019). Critically important antimicrobials for human medicine: 6th revision. https://www.who.int/publications/i/item/9789241515528
- WHO (World Health Organization) . (2021). WHO access, watch, reserve (AWaRe) classification of antibiotics for evaluation and monitoring of use. https://apps.who.int/iris/handle/10665/345555
- WHO (World Health Organization) . (2022). Collaborating Centre for Drug Statistics Methodology, ATC Index with DDDs . https://www.whocc.no/atc_ddd_index/
- Williams, D. A. (1982). Extra‐binomial variation in logistic linear models. Applied Statistics, 31, 144–148. [Google Scholar]
- WOAH (World Organisation for Animal Health) . (2021). OIE List Of Antimicrobial Agents Of Veterinary Importance. https://www.woah.org/app/uploads/2021/06/a‐oie‐list‐antimicrobials‐june2021.pdf
- Xavier, B. B. , Lammens, C. , Ruhal, R. , Kumar‐Singh, S. , Butaye, P. , Goossens, H. , & Malhotra‐Kumar, S. (2016). Identification of a novel plasmid‐mediated colistin‐resistance gene, mcr‐2, in Escherichia coli, Belgium, June 2016. EuroSurveillance Monthly, 21(27), 30280. [DOI] [PubMed] [Google Scholar]
- Yair, Y. , & Gophna, U. (2018). Pandemic Bacteremic Escherichia coli strains: Evolution and emergence of drug‐resistant pathogens. In Escherichia coli, a Versatile Pathogen (pp. 163–180). Springer. [DOI] [PubMed] [Google Scholar]
- Yang, Y.‐Q. , Li, Y. X. , Lei, C. W. , Zhang, A. Y. , & Wang, H. N. (2018). Novel plasmid‐mediated colistin resistance gene mcr‐7.1 in Klebsiella pneumoniae. Journal of Antimicrobial Chemotherapy, 73(7), 1791–1795. [DOI] [PubMed] [Google Scholar]
- Yin, W. , Li, H. , Shen, Y. , Liu, Z. , Wang, S. , Shen, Z. , Zhang, R. , Walsh, T. R. , Shen, J. , & Wang, Y. (2017). Novel plasmid‐mediated colistin resistance gene mcr‐3 in Escherichia coli. MBio, 8(3), e00543‐17. [DOI] [PMC free article] [PubMed] [Google Scholar]
- Zhang, P. , Wang, J. , Wang, X. , Bai, X. , Ma, J. , Dang, R. , Xiong, Y. , Fanning, S. , Bai, L. , & Yang, Z. (2019). Genome sequencing and characterization of five Escherichia coli co‐expressing ESBL and MCR‐1 resistance mechanisms, from different origins in China. Frontiers in Microbiology, 10, 1994. [DOI] [PMC free article] [PubMed] [Google Scholar]