

Abstract
Background
Adults should perform ≥150 minutes/week of moderate-intensity equivalent physical activity for substantial health benefits and >300 minutes/week for additional benefits. We analyzed 21 years of National Health Interview Survey data to better understand trends in aerobic physical activity participation among U.S. adults.
Methods
We estimated the annual prevalence (1998–2018) of self-reported leisure-time physical inactivity, insufficient activity, meeting only the minimal aerobic guideline, and meeting the high aerobic guideline overall and by selected characteristics. Prevalence differences between 1998 and 2018 were compared across subgroups and periods of significant change were identified using JoinPoint regression.
Results
The prevalence of inactivity decreased from 40.5% (1998) to 25.6% (2018) while the prevalence of meeting the high aerobic guideline increased from 26.0% to 37.4%. Increases in meeting the high guideline were similar across age groups, racial/ethnic groups, levels of education, and Census regions. Increases in insufficient activity and meeting the minimal guideline were statistically significant but of relatively small magnitude.
Conclusions
The prevalence of inactivity decreased and meeting the high aerobic guideline increased overall and for all subgroups from 1998 to 2018. Physical activity promotion strategies may aim to continue these trends while also narrowing persistent disparities in participation across subgroups.
Keywords: surveillance, NHIS, trends
Introduction
The Physical Activity Guidelines for Americans, 2nd edition1 provide evidence-based recommendations on the volume of aerobic physical activity needed for health. The Guidelines recommend adults move more and sit less throughout the day; any physical activity is better than none and adults who sit less and do any amount of moderate- to vigorous-intensity physical activity gain some health benefits. To obtain substantial health benefits, the Guidelines also recommend adults perform 150–300 minutes per week of moderate-intensity, or 75–150 minutes per week of vigorous-intensity aerobic physical activity, or an equivalent combination of moderate- and vigorous-intensity aerobic activity. For additional health benefits, the Guidelines recommend adults perform more than the equivalent of 300 minutes per week of moderate-intensity physical activity.1 The Guidelines also recommend twice-weekly muscle-strengthening activity targeting all major muscle groups,1 though this is not a focus of this paper.
Based on the Guidelines, four levels of physical activity can be considered important for public health surveillance. These levels include: (1) no aerobic physical activity (inactive); (2) some aerobic activity, but less than the aerobic guideline (insufficiently active); meeting the aerobic guideline, which can be further broken into (3) meeting only the minimal aerobic guideline of 150–300 minutes per week and (4) meeting the high aerobic guideline of >300 minutes per week. Reports of public health surveillance that include all of these levels can indicate if and how participation is changing among these levels. For example, increases in meeting the aerobic guideline2 have been well documented, but it is unclear if these increases are accompanied by decreases in inactivity, insufficient activity, or both. Because the health effects of physical activity differ at different levels of participation, understanding how activity is changing across levels can help inform the potential population health impacts of physical activity participation.
Several nationally representative surveillance systems in the U.S., including the National Health Interview Survey (NHIS), the National Health and Nutrition Examination Survey (NHANES), and the Behavioral Risk Factor Surveillance System (BRFSS)3 can be used to classify participants into the four levels of physical activity above. NHIS is unique because its physical activity assessment remained largely unchanged from 1998 to 2018.3,4 To date, no reports have examined trends across all levels of aerobic physical activity participation over the 21-year period of consistent assessment in NHIS. Such an analysis would allow us to identify significant periods of increasing or decreasing physical activity participation and potentially place these periods into a broader historical context.
Previous surveillance reports of leisure-time physical activity have demonstrated clear differences in participation across demographic and geographic subgroups and by weight status.5–9 For example, in analyses of 2017 NHIS data, the National Center for Health Statistics (NCHS) reported considerable disparities in meeting the aerobic physical activity guideline in leisure time by sex (men: 58.7% met the aerobic guideline, women: 49.8%), age (18–24 years: 61.6%; ≥65 years: 39.1%), racial and ethnic groups (non-Hispanic whites: 58.6%, non-Hispanic blacks: 44.6%, Hispanics: 45.0%), and Census region of residence (West: 58.7%, South: 50.8%).9 Other analyses of NHIS data suggest similar disparities by body mass index (BMI, adults with obesity: 36.8%, adults of normal weight: 51.1%).8 Understanding how activity participation has changed among these groups can indicate if disparities are widening, narrowing, or remaining unchanged over time.
The purpose of this paper is to offer a more complete understanding of trends in aerobic physical activity participation by answering three questions. First, how has the prevalence of each level of leisure-time aerobic activity changed over 21 years of consistent assessment in NHIS? Second, during this period, have changes in aerobic activity been concentrated in certain periods or years? Third, how have changes differed across categories of selected demographic, geographic, and physical characteristics?
Methods
Data Source
The NHIS is an annual survey conducted continuously throughout the year by the Centers for Disease Control and Prevention’s (CDC) NCHS.4 The survey uses a multistage probability sample of U.S. households designed to be representative of the civilian, noninstitutionalized U.S. population. While basic health and demographic data are collected from all family members, this analysis used comprehensive health assessments administered to a randomly selected adult in each family within the household (age ≥18 years). Publicly-available data from 1998 to 2018 were downloaded from the NHIS website (https://www.cdc.gov/nchs/nhis/). The sample sizes ranged from a low of 21,781 in 2008 to a high of 36,697 in 2014 (total n=635,580); the response rates ranged from a low of 53.0% in 2017 to a high of 74.3% in 2002. Additional details about NHIS methods and procedures is available from the National Center for Health Statistics.10 The Research Ethics Review Board of NCHS has approved all NHIS survey content and methods.
Physical Activity Assessment
Adult respondents were prompted to report aerobic activities that occurred in leisure time, including “exercise, sports, [and] physically active hobbies…”. Respondents could report separately the frequency and duration of vigorous and light- or moderate-intensity leisure-time physical activity (Table 1). The total volume of physical activity at each intensity level was then calculated as the reported frequency (occurrences per week) times the reported duration (minutes per occurrence). Those who reported being unable to do activities at an intensity level were classified as having no participation in that intensity level. To match the intensity-specific recommendations in the Guidelines1, the total minutes of vigorous intensity activity per week were doubled and added to the minutes of light- to moderate-intensity activity (moderate-intensity equivalent minutes per week). Participants were classified into four levels of aerobic activity: inactive (no light- to moderate or vigorous-intensity aerobic activity for at least 10 minutes), insufficiently active (some aerobic activity, but less than 150 moderate-intensity equivalent minutes per week), meeting only the minimal guideline (150–300 moderate-intensity equivalent minutes per week), and meeting the high guideline (greater than 300 moderate-intensity equivalent minutes per week). Additionally, the two final categories were combined to provide a summary estimate of the total proportion meeting and exceeding the minimal aerobic guideline.
Table 1:
Leisure-time aerobic physical activity assessment text in the National Health Interview Survey, 1998–2018
| Section | Text | Units |
|---|---|---|
| Introduction Prompt | The next questions are about physical activities (exercise, sports, physically active hobbies…) that you may do in your LEISURE time. | n/a |
| Vigorous-intensity frequency | How often do you do VIGOROUS leisure-time physical activities* for AT LEAST 10 MINUTES that cause HEAVY sweating or LARGE increases in breathing or heart rate? | Times per day, week, month, or year |
| Vigorous-intensity duration† | About how long do you do these vigorous leisure-time activities each time? | Number of minutes or hours per occasion |
| Moderate-intensity frequency | How often do you do LIGHT OR MODERATE LEISURE-TIME physical activities* for AT LEAST 10 MINUTES that cause ONLY LIGHT sweating or a SLIGHT to MODERATE increase in breathing or heart rate? | Times per day, week, month, or year |
| Moderate-intensity duration† | About how long do you do these light or moderate leisure-time physical activities* each time? | Number of minutes or hours per occasion |
Capitalization emphasis is included in the National Health Interview Survey questionnaire
The phrase “leisure time physical activities” replaced the single word “activities” in these locations beginning in 2004
Duration was asked only when reported frequency was >0 days
Covariates
Respondents self-reported sex (categorized as male or female), age (categorized as: 18–24, 25–34, 35–44, 45–64, and ≥65 years), and highest level of education attained (categorized as: less than high school, high school graduate or equivalent, some college, and college graduate or higher). For race and ethnicity, respondents were first asked to identify whether they consider themselves Hispanic or Latino. Next, all respondents selected what race or races they consider themselves from a list; for persons who choose more than one race, a question was asked about the single race that “best” describes them. Adults were classified into 4 race and ethnicity groups (i.e., white, non-Hispanic; black, non-Hispanic; Hispanic; and other, non-Hispanic). Census region of residence was determined based on residential address (Northeast, Midwest, South, and West). Body mass index (BMI) was estimated from self-reported height and weight and categorized as underweight/normal (<25 kg/m2); overweight (25-<30 kg/m2); and obesity (≥30 kg/m2).11
Analytic Sample
Of the 635,580 total participants in the 1998–2018 NHIS adult sample, 16,768 (2.6%) did not provide sufficient information on aerobic activity to be classified into the 4 levels above, resulting in physical activity estimates for 618,812 adults. An additional 4,116 participants (0.7%) were missing data on educational attainment and 20,542 (3.3%) were missing data on BMI and were excluded from estimates stratified by these variables (analytic samples: 614,696 and 598,270, respectively).
Statistical Analyses
We estimated the annual prevalence of each level of aerobic physical activity participation, stratified by sex, age group, race and ethnicity, education, region, and BMI category. Estimates were age-standardized to the 2000 U.S. adult population.12 The overall change in prevalence was estimated by subtracting the prevalence in 1998 from the prevalence in 2018 expressed in percentage points; difference from zero was tested using adjusted Wald tests. We tested differences in overall change across levels of a single covariate (difference in difference analysis, e.g., did one age group change more than another?) using pairwise adjusted Wald tests with a Bonferroni correction.
To determine the presence of linear and higher-order trends (quadratic and/or cubic), we created an age-adjusted logistic regression model for each subgroup including year as a factor variable and tested for linear and higher-order trends across years using orthogonal polynomial contrasts. When linear and higher-order trends were both present, we describe the trend as nonmonotonic. For each physical activity variable with higher-order trends across most subgroups, we used JoinPoint 4.5 piecewise-linear regression software (National Cancer Institute, Bethesda, MD) to identify the best-fitting trend lines with up to 3 join points (4 segments). All analyses than those conducted in JoinPoint were conducted using survey commands in Stata 13.1 (Stata Corporation, College Station, TX) and accounted for the complex and changing design of NHIS; all NHIS analytic guidelines were followed.10
Results
From 1998 to 2018, the prevalence of physical inactivity in leisure time decreased nonmonotonically from 40.5% to 25.6% and exhibited significant linear and higher order trends (Figure 1). Over the 21-year period, the prevalence of insufficient activity increased nonmonotonically with linear and higher-order trends and meeting only the minimal guideline increased linearly, however, changes in insufficient activity and meeting the minimal guideline were of smaller magnitude than changes in the other activity categories. The prevalence of meeting the high aerobic guideline increased nonmonotonically from 26.0% in 1998 to 37.4% in 2018 and also exhibited significant linear and higher order trends. Throughout the 21-year period, year-to year changes in meeting the high guideline tended to be of similar magnitude to but in the opposite direction of changes in inactivity. When the groups meeting only the minimal and high guideline were combined, the overall prevalence of meeting and exceeding the minimal aerobic guideline increased nonmonotonically from 40.1% to 50.2%, with significant linear and higher-order trends (not shown).
Figure 1:
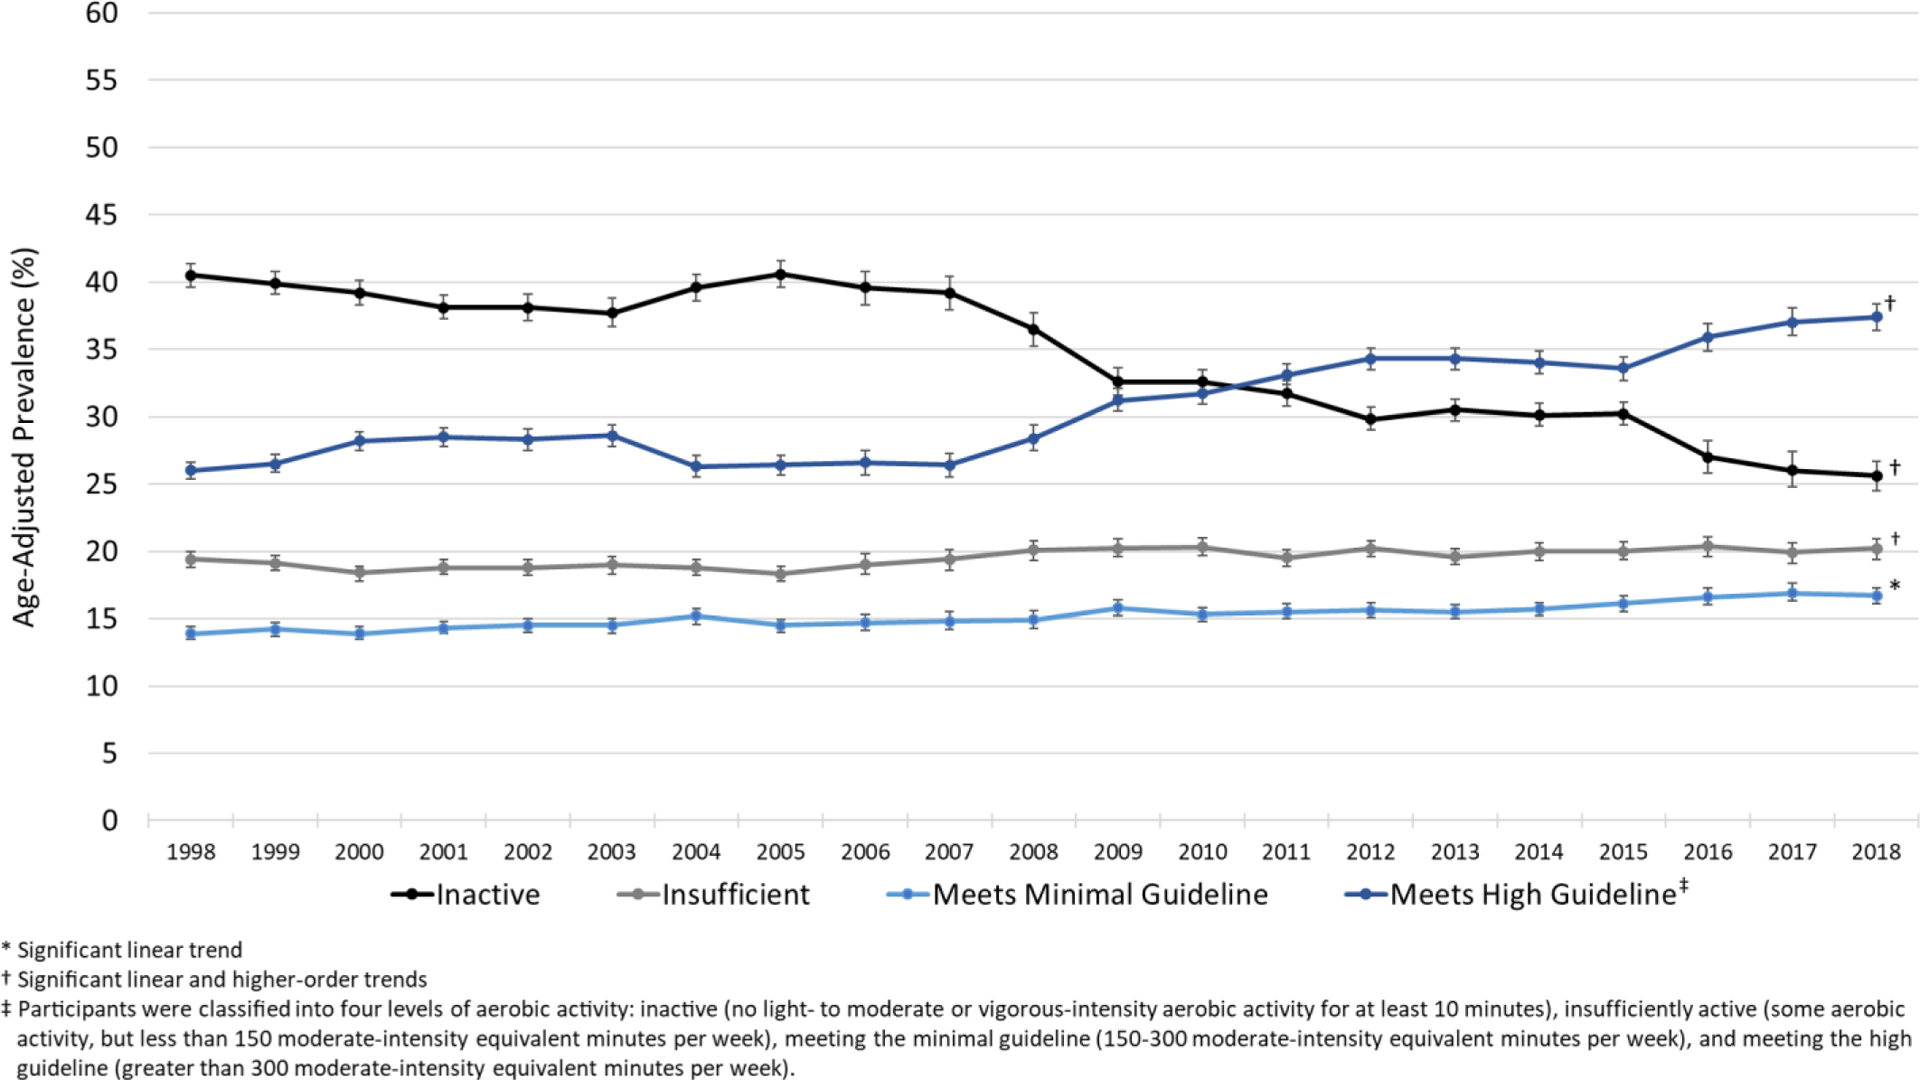
Age-adjusted prevalence of four levels of aerobic leisure-time physical activity among adults, National Health Interview Survey 1998–2018
Across all subgroups, the prevalence of physical inactivity was significantly lower in 2018 compared to 1998 (Table 2). There were differences in the magnitude of difference between 2018 and 1998 by age group, race and ethnicity, and education: adults aged 65 years or older reported larger decreases than adults aged 35–44, Hispanics reported larger decreases than did non-Hispanic whites, and decreases tended to be larger with lower educational attainment, though the difference between adults with a college education and with a high school education was not significant. There were no significant differences in the magnitude of change in inactivity by sex, region or BMI category.
Table 2:
Age-adjusted prevalence of physical inactivity in leisure time among adults for selected years, National Health Interview Survey 1998–2018
| Characteristic | 1998 | 2003 | 2008 | 2013 | 2018 | 21-year change | |||||||
|---|---|---|---|---|---|---|---|---|---|---|---|---|---|
| % | 95% CI | % | 95% CI | % | 95% CI | % | 95% CI | % | 95% CI | PP* | D in D test† | Tests of Trend‡ | |
| Overall | 40.5 | 39.6–41.4 | 37.7 | 36.7–38.8 | 36.5 | 35.2–37.7 | 30.5 | 29.7–31.3 | 25.6 | 24.5–26.7 | −14.9 | -- | L, Q, C |
| Sex | |||||||||||||
| Male | 37.7 | 36.6–38.9 | 35.5 | 34.3–36.7 | 34.2 | 32.6–35.9 | 28.5 | 27.5–29.6 | 23.2 | 22.0–24.5 | −14.5 | A | L, Q, C |
| Female | 43.0 | 42.0–44.0 | 39.7 | 38.5–40.9 | 38.4 | 37.1–39.6 | 32.3 | 31.2–33.3 | 27.8 | 26.5–29.2 | −15.2 | A | L, Q, C |
| Age group (years) | |||||||||||||
| 18–24 | 32.9 | 30.7–35.1 | 29.7 | 27.5–32.0 | 28.8 | 26.1–31.6 | 23.7 | 21.7–25.7 | 17.5 | 15.3–19.9 | −15.4 | AB | L, Q, C |
| 25–34 | 34.0 | 32.5–35.5 | 34.1 | 32.4–35.9 | 30.6 | 28.5–32.8 | 24.1 | 22.6–25.6 | 19.6 | 17.8–21.6 | −14.4 | AB | L, Q, C |
| 35–44 | 37.6 | 36.1–39.2 | 34.1 | 32.5–35.7 | 33.3 | 31.1–35.5 | 27.2 | 25.8–28.7 | 24.5 | 22.7–26.5 | −13.1 | B | L, Q, C |
| 45–64 | 41.4 | 40.0–42.7 | 38.3 | 36.9–39.7 | 37.5 | 35.8–39.2 | 32.8 | 31.6–34.1 | 26.8 | 25.3–28.3 | −14.6 | AB | L, Q |
| 65+ | 55.5 | 53.9–57.1 | 51.4 | 49.7–53.1 | 50.8 | 48.8–52.7 | 42.6 | 41.0–44.2 | 37.6 | 36.0–39.2 | −17.9 | A | L, Q, C |
| Race and ethnicity | |||||||||||||
| White, non-Hispanic | 36.7 | 35.7–37.7 | 33.5 | 32.4–34.7 | 32.2 | 30.8–33.6 | 26.9 | 25.9–27.9 | 21.9 | 20.7–23.1 | −14.8 | A | L, Q |
| Black, non-Hispanic | 52.1 | 50.2–54.0 | 48.0 | 45.7–50.3 | 47.4 | 45.0–49.8 | 38.5 | 36.7–40.3 | 34.3 | 31.7–37.1 | −17.8 | AB | L, Q, C |
| Hispanic | 55.7 | 53.6–57.7 | 51.6 | 49.7–53.6 | 47.6 | 45.0–50.1 | 39.7 | 38.0–41.4 | 34.3 | 31.8–36.9 | −21.4 | B | L, Q, C |
| Other, non-Hispanic | 41.7 | 37.6–45.8 | 37.9 | 34.3–41.6 | 35.0 | 31.6–38.5 | 29.7 | 27.3–32.3 | 22.2 | 19.4–25.3 | −19.5 | AB | L, Q |
| Education | |||||||||||||
| <High school | 62.5 | 60.8–64.1 | 59.5 | 57.9–61.2 | 57.4 | 55.1–59.7 | 49.9 | 48.0–51.9 | 45.4 | 42.6–48.2 | −17.1 | A | L, Q, C |
| High school graduate | 46.6 | 45.2–48.0 | 43.8 | 42.1–45.5 | 45.9 | 43.9–47.9 | 39.0 | 37.4–40.5 | 34.1 | 32.3–36.0 | −12.5 | AB | L, Q |
| Some college | 33.7 | 32.4–35.1 | 32.2 | 30.7–33.6 | 31.7 | 30.1–33.3 | 28.3 | 27.1–29.6 | 25.0 | 23.6–26.4 | −8.8 | C | L, Q |
| College graduate or higher | 23.2 | 21.9–24.6 | 20.9 | 19.6–22.2 | 20.1 | 18.6–21.6 | 16.6 | 15.6–17.7 | 13.9 | 12.7–15.1 | −9.3 | BC | L, Q, C |
| Region | |||||||||||||
| Northeast | 39.3 | 37.9–40.8 | 34.7 | 32.8–36.6 | 37.2 | 34.7–39.8 | 32.9 | 30.9–35.0 | 25.3 | 22.9–27.9 | −14.0 | A | L, Q, C |
| Midwest | 37.3 | 35.7–39.0 | 34.7 | 32.8–36.7 | 32.7 | 30.3–35.1 | 29.0 | 27.5–30.6 | 24.2 | 22.2–26.3 | −13.2 | A | L, Q |
| South | 46.9 | 45.2–48.5 | 42.6 | 40.8–44.5 | 41.2 | 39.0–43.5 | 33.0 | 31.5–34.6 | 29.9 | 27.9–31.9 | −17.0 | A | L, Q, C |
| West | 34.0 | 31.9–36.2 | 35.1 | 33.1–37.0 | 32.5 | 30.1–35.0 | 26.0 | 24.5–27.5 | 20.6 | 18.5–23.0 | −13.4 | A | L, Q, C |
| BMI Category § | |||||||||||||
| Normal/Underweight | 37.3 | 36.2–38.5 | 35.1 | 33.8–36.4 | 33.1 | 31.6–34.5 | 27.7 | 26.6–28.9 | 22.0 | 20.7–23.3 | −15.4 | A | L, Q, C |
| Overweight | 39.5 | 38.3–40.7 | 35.0 | 33.7–36.4 | 34.2 | 32.5–35.9 | 28.0 | 26.7–29.3 | 23.7 | 22.2–25.3 | −15.8 | A | L, Q, C |
| Obesity | 46.9 | 45.2–48.5 | 43.3 | 41.8–44.9 | 41.7 | 39.7–43.6 | 35.8 | 34.4–37.2 | 30.1 | 28.5–31.7 | −16.8 | A | L, Q |
PP: percentage point change (2018 – 1998). All differences significantly different from 0, p<0.001
D in D: Tests for difference in difference; across levels of a covariate, values that share a letter are not significantly different (Bonferroni-adjusted p-value <0.05)
L: linear; Q: quadratic; C: cubic
BMI based on self-reported height and weight and equal to (weight [kg])÷(height [m])2; underweight: BMI<18.5, normal weight: 18.5 ≤ BMI ≤ 24.9; overweight: 25.0 ≤ BMI ≤ 29.9; obesity: BMI ≥ 30
All subgroups demonstrated statistically significant linear and higher-order trends in the prevalence of physical inactivity from 1998 to 2018. JoinPoint analyses revealed four distinct periods of change for the overall sample of adults: a non-significant average annual decrease from 1998 to 2002, a non-significant increase from 2002 to 2006, another non-significant decrease from 2006 to 2009, and a statistically significant decrease from 2009 to 2018 (Figure 2). Most subgroups exhibited at least two distinct periods of change and most statistically significant periods of decrease occurred in the second decade of monitoring.
Figure 2:
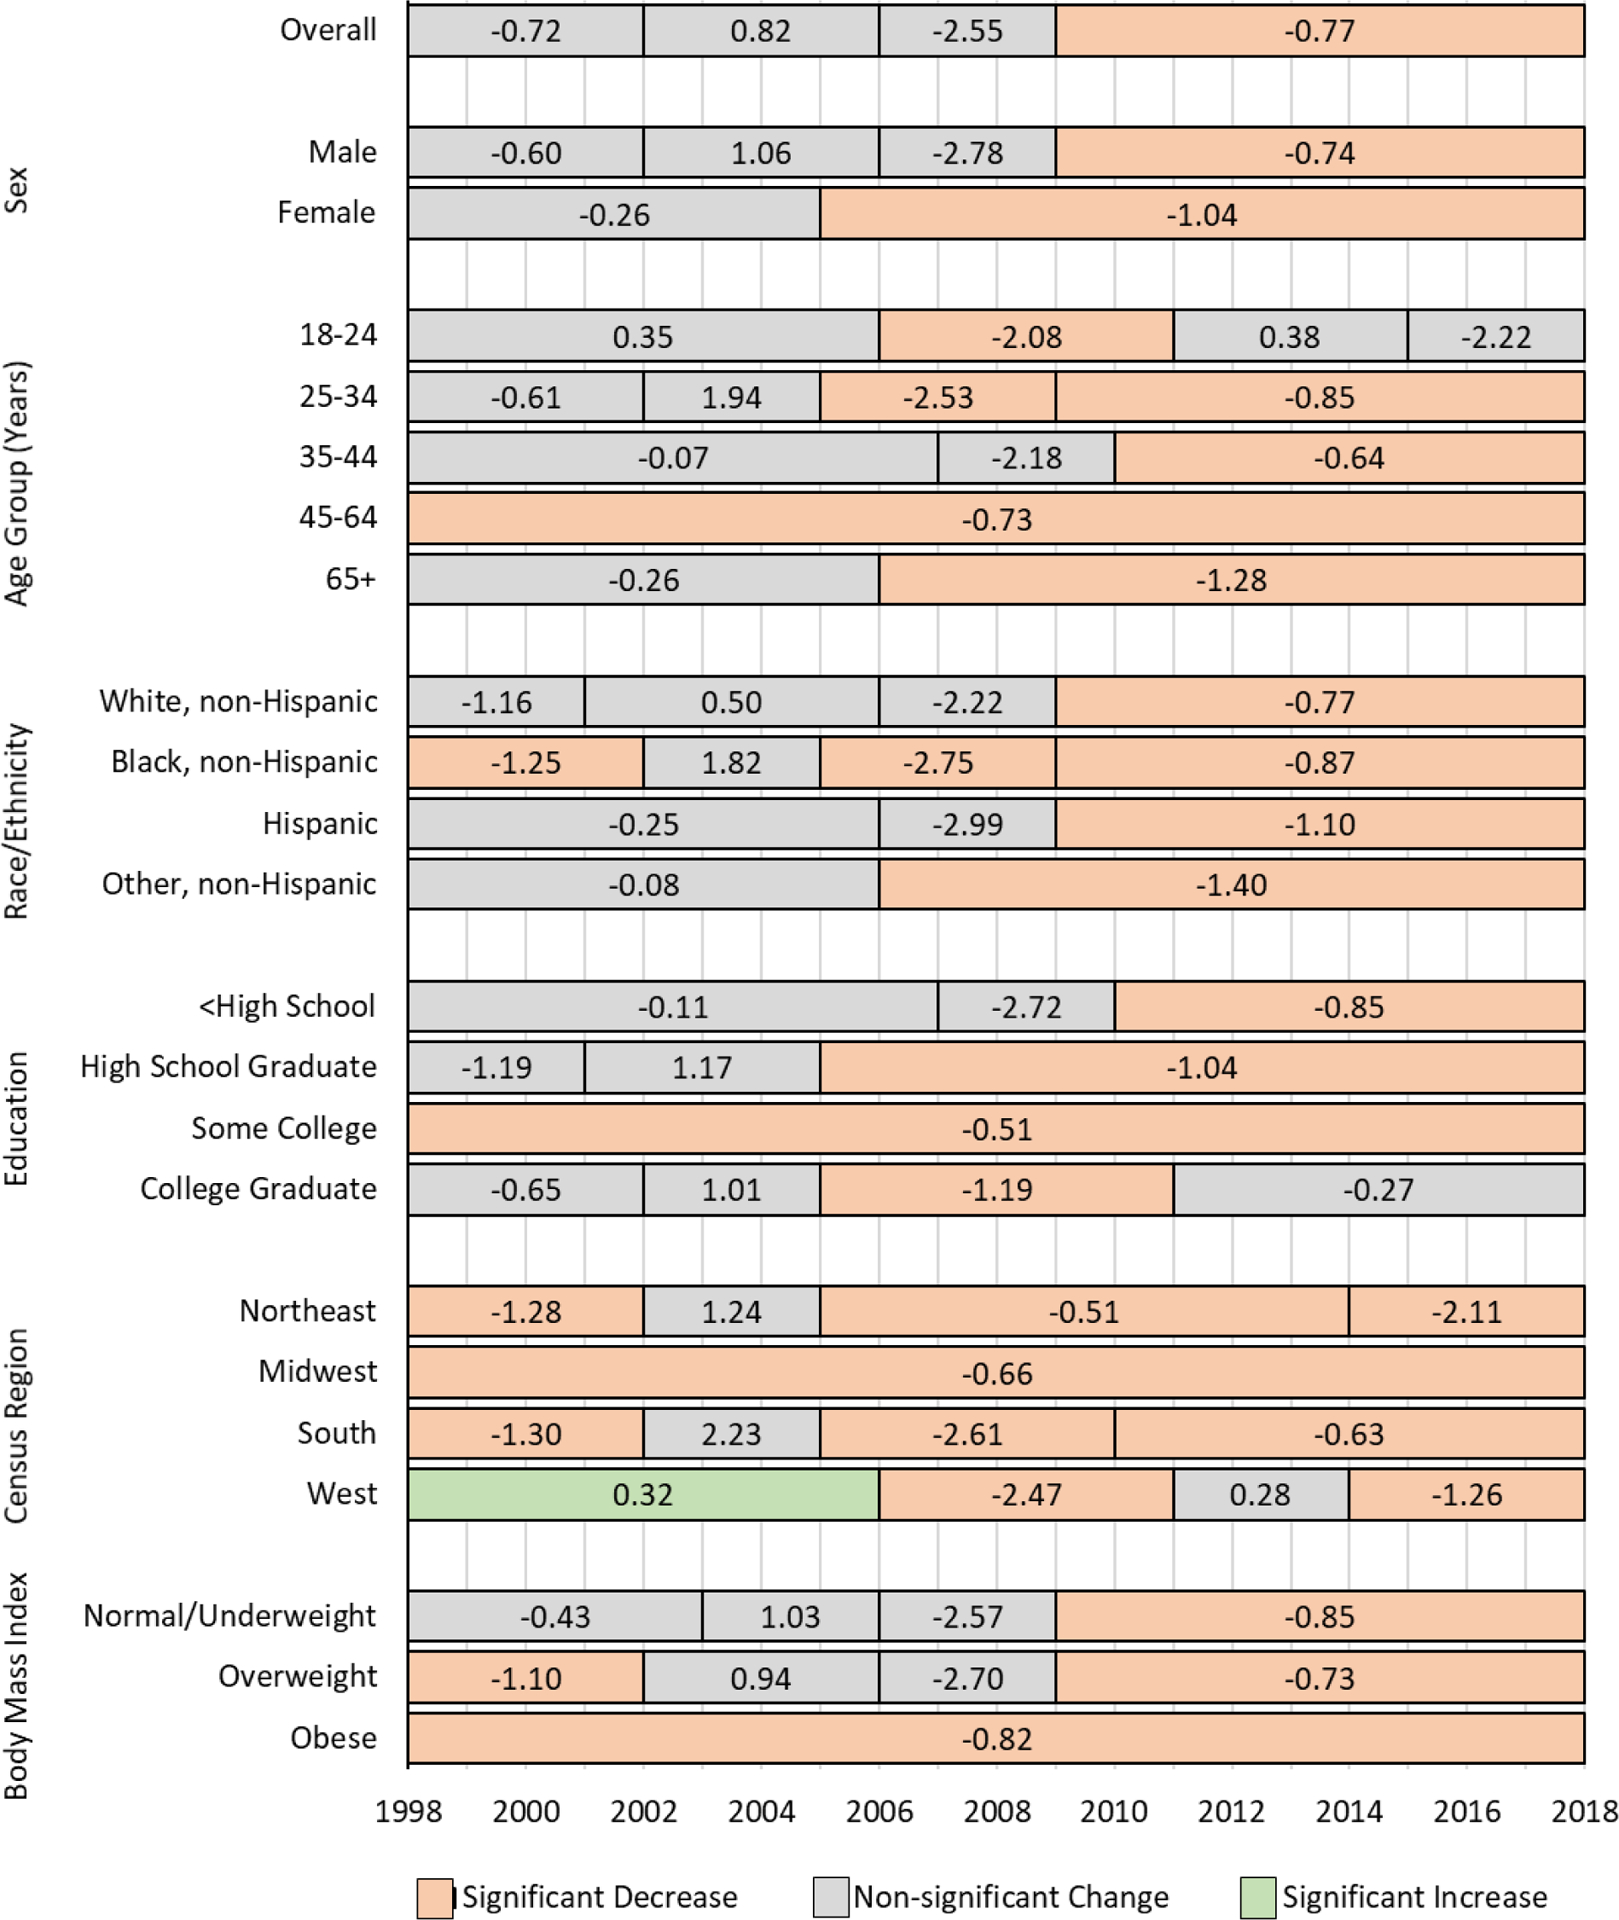
Average annual percentage-point change in reported leisure-time physical inactivity by year, adults, National Health Interview Survey 1998–2018
The prevalence of insufficient activity was not significantly different in 2018 compared to 1998 for most subgroups (Table 3), with exceptions of increases among men, adults aged 65 years or older, adults of Hispanic origin, adults with less than a high school education, adults in the Midwest or South Census regions, and adults with obesity, and a decrease among adults with a college degree or higher. When the magnitude of change in insufficient activity from 1998 to 2018 was compared across subgroups, there were few significant differences across age groups and none across racial and ethnic groups. Across categories of education, insufficient activity increased more among adults with less than a high school education than among adults with at least some college. The change from 1998 to 2018 was higher among adults residing in the Midwest or South compared to the Northeast, and higher among adults with obesity compared to adults without obesity. Most subgroups demonstrated statistically significant linear trends, but only one-third of examined subgroups exhibited higher-order trends.
Table 3:
Age-adjusted prevalence of insufficient aerobic activity in leisure time among adults for selected years, National Health Interview Survey 1998–2018
| Characteristic | 1998 | 2003 | 2008 | 2013 | 2018 | 21-year change | |||||||
|---|---|---|---|---|---|---|---|---|---|---|---|---|---|
| % | 95% CI | % | 95% CI | % | 95% CI | % | 95% CI | % | 95% CI | PP* | D in D test‡ | Tests of Trend§ | |
| Overall | 19.4 | 18.8–20.0 | 19.0 | 18.3–19.6 | 20.1 | 19.3–20.8 | 19.6 | 19.0–20.2 | 20.2 | 19.4–20.9 | 0.8 | -- | L, C |
| Sex | |||||||||||||
| Male | 16.7 | 15.9–17.5 | 16.7 | 15.8–17.6 | 18.3 | 17.4–19.3 | 17.4 | 16.5–18.3 | 18.6 | 17.7–19.7 | 1.8† | A | L, C |
| Female | 21.9 | 21.2–22.7 | 21.2 | 20.4–22.0 | 21.7 | 20.7–22.7 | 21.7 | 20.9–22.5 | 21.6 | 20.6–22.5 | −0.4 | B | L, C |
| Age group (years) | |||||||||||||
| 18–24 | 17.8 | 16.3–19.4 | 16.6 | 15.1–18.1 | 18.8 | 16.8–21.0 | 14.9 | 13.2–16.6 | 17.7 | 15.6–20.1 | −0.1 | AB | |
| 25–34 | 19.3 | 18.1–20.5 | 17.9 | 16.8–19.1 | 19.1 | 17.6–20.8 | 18.7 | 17.2–20.2 | 19.6 | 18.1–21.3 | 0.3 | AB | |
| 35–44 | 19.6 | 18.5–20.8 | 20.2 | 19.1–21.4 | 21.4 | 19.9–22.9 | 19.9 | 18.6–21.2 | 18.7 | 17.2–20.3 | −0.9 | A | Q |
| 45–64 | 20.5 | 19.5–21.5 | 20.4 | 19.4–21.5 | 20.9 | 19.8–22.1 | 20.8 | 19.7–21.9 | 21.6 | 20.4–22.8 | 1.2 | AB | L |
| 65+ | 18.6 | 17.4–19.7 | 17.7 | 16.6–19.0 | 18.8 | 17.4–20.3 | 21.7 | 20.4–23.0 | 21.9 | 20.6–23.2 | 3.3† | B | L, Q, C |
| Race and ethnicity | |||||||||||||
| White, non-Hispanic | 20.0 | 19.4–20.7 | 19.6 | 18.8–20.4 | 20.2 | 19.3–21.1 | 19.7 | 19.0–20.6 | 20.4 | 19.6–21.3 | 0.4 | A | L, C |
| Black, non-Hispanic | 17.5 | 16.2–18.9 | 17.6 | 16.3–18.9 | 18.7 | 17.0–20.5 | 19.9 | 18.3–21.6 | 18.8 | 17.1–20.6 | 1.3 | A | L |
| Hispanic | 15.3 | 14.0–16.6 | 15.2 | 13.9–16.6 | 19.0 | 17.4–20.8 | 17.6 | 16.4–19.0 | 18.0 | 16.0–20.1 | 2.7† | A | L, C |
| Other, non-Hispanic | 21.9 | 19.2–24.9 | 21.0 | 18.2–24.1 | 23.1 | 20.5–26.1 | 20.4 | 18.3–22.6 | 23.9 | 21.4–26.6 | 2.0 | A | |
| Education | |||||||||||||
| <High school | 13.9 | 12.8–15.0 | 13.6 | 12.4–14.8 | 17.0 | 15.4–18.8 | 16.9 | 15.5–18.4 | 17.8 | 15.8–19.9 | 3.9† | A | L |
| High school graduate | 19.7 | 18.7–20.7 | 18.2 | 17.2–19.3 | 18.5 | 17.2–20.0 | 19.2 | 18.1–20.4 | 21.2 | 19.7–22.7 | 1.5 | AB | L, Q |
| Some college | 21.2 | 20.2–22.3 | 20.0 | 19.0–21.1 | 22.7 | 21.5–23.9 | 19.9 | 18.9–21.0 | 21.0 | 19.8–22.2 | −0.2 | B | L |
| College graduate or higher | 21.2 | 20.0–22.5 | 22.3 | 21.0–23.7 | 20.9 | 19.4–22.6 | 20.4 | 19.3–21.6 | 19.4 | 18.3–20.6 | −1.7† | B | L |
| Region | |||||||||||||
| Northeast | 20.9 | 19.8–22.1 | 19.4 | 18.0–20.9 | 20.6 | 18.9–22.5 | 18.2 | 16.6–19.8 | 19.1 | 17.5–20.8 | −1.8 | A | |
| Midwest | 20.6 | 19.4–21.9 | 21.3 | 19.9–22.8 | 22.0 | 20.4–23.8 | 21.3 | 20.1–22.5 | 22.7 | 21.2–24.2 | 2.1† | B | L |
| South | 17.7 | 16.8–18.8 | 17.5 | 16.5–18.5 | 18.4 | 17.3–19.7 | 19.8 | 18.7–20.9 | 19.7 | 18.4–21.0 | 1.9† | B | L, C |
| West | 19.2 | 18.1–20.5 | 18.4 | 17.1–19.7 | 20.1 | 18.7–21.6 | 18.7 | 17.6–19.9 | 19.5 | 17.9–21.1 | 0.2 | AB | L |
| BMI Category ** | |||||||||||||
| Normal/Underweight | 19.5 | 18.7–20.4 | 18.5 | 17.7–19.4 | 19.2 | 18.1–20.3 | 18.7 | 17.7–19.6 | 18.4 | 17.3–19.5 | −1.2 | A | |
| Overweight | 18.5 | 17.6–19.4 | 18.8 | 17.8–19.9 | 19.7 | 18.6–20.8 | 18.8 | 17.8–19.8 | 18.7 | 17.6–19.8 | 0.2 | A | L |
| Obesity | 20.2 | 18.9–21.5 | 20.2 | 19.0–21.5 | 21.9 | 20.4–23.4 | 21.6 | 20.3–22.9 | 23.7 | 22.3–25.3 | 3.8† | B | L |
PP: percentage point change (2018 – 1998).
1998 vs 2018 significantly different from 0, p<0.001
D in D: Tests for difference in difference; across levels of a covariate, values that share a letter are not significantly different (Bonferroni-adjusted p-value <0.05)
L: linear; Q: quadratic; C: cubic
BMI based on self-reported height and weight and equal to (weight [kg])÷(height [m])2; underweight: BMI<18.5, normal weight: 18.5 ≤ BMI ≤ 24.9; overweight: 25.0 ≤ BMI ≤ 29.9; obesity: BMI ≥ 30
For most subgroups, the prevalence of meeting only the minimal aerobic guideline was higher in 2018 than in 1998 (Table 4). Exceptions include non-significant changes among adults aged 18–34 years, adults with some college education, and adults residing in the Northeast or Midwest Census regions. The difference between 1998 and 2018 did not vary significantly by sex, age, racial/ethnic group, or BMI category, but was significantly higher among adults with less than a high school education compared to adults with some college education, and higher among adults residing in the South versus the Midwest Census region. All subgroups except adults residing in the Northeast exhibited a significant linear trend for increasing prevalence; only three examined subgroups exhibited higher-order trends.
Table 4:
Age-adjusted prevalence of meeting the minimal aerobic guideline in leisure time among adults for selected years, National Health Interview Survey 1998–2018
| Characteristic | 1998 | 2003 | 2008 | 2013 | 2018 | 21-year change | |||||||
|---|---|---|---|---|---|---|---|---|---|---|---|---|---|
| % | 95% CI | % | 95% CI | % | 95% CI | % | 95% CI | % | 95% CI | PP* | D in D test‡ | Tests of Trend§ | |
| Overall | 13.9 | 13.5–14.4 | 14.5 | 13.9–15.0 | 14.9 | 14.3–15.6 | 15.5 | 15.0–16.0 | 16.7 | 16.1–17.3 | 2.7† | -- | L |
| Sex | |||||||||||||
| Male | 13.6 | 13.0–14.2 | 14.3 | 13.6–15.1 | 14.3 | 13.4–15.3 | 14.9 | 14.2–15.7 | 16.0 | 15.2–16.8 | 2.4† | A | L |
| Female | 14.3 | 13.6–15.0 | 14.6 | 13.9–15.3 | 15.5 | 14.8–16.3 | 16.0 | 15.3–16.7 | 17.4 | 16.6–18.2 | 3.1† | A | L |
| Age group (years) | |||||||||||||
| 18–24 | 13.9 | 12.5–15.5 | 14.0 | 12.5–15.6 | 16.1 | 14.1–18.3 | 15.7 | 14.0–17.6 | 16.2 | 14.2–18.5 | 2.3 | A | L |
| 25–34 | 16.3 | 15.3–17.4 | 15.8 | 14.5–17.2 | 15.9 | 14.5–17.3 | 15.6 | 14.4–16.7 | 17.9 | 16.6–19.3 | 1.6 | A | L, Q |
| 35–44 | 14.5 | 13.5–15.6 | 15.3 | 14.2–16.4 | 16.4 | 15.0–17.9 | 17.5 | 16.3–18.8 | 17.9 | 16.5–19.3 | 3.4† | A | L |
| 45–64 | 14.3 | 13.5–15.2 | 14.7 | 13.8–15.7 | 14.6 | 13.6–15.7 | 15.6 | 14.6–16.5 | 16.6 | 15.6–17.7 | 2.3† | A | L |
| 65+ | 10.0 | 9.2–10.8 | 11.9 | 10.9–13.0 | 11.6 | 10.4–12.9 | 12.5 | 11.5–13.5 | 14.2 | 13.3–15.2 | 4.3† | A | L |
| Race and ethnicity | |||||||||||||
| White, non-Hispanic | 15.0 | 14.5–15.6 | 15.3 | 14.7–16.0 | 16.0 | 15.2–16.8 | 16.0 | 15.3–16.7 | 17.7 | 16.9–18.5 | 2.6† | A | L, C |
| Black, non-Hispanic | 10.5 | 9.5–11.7 | 11.9 | 10.7–13.2 | 12.5 | 11.2–13.9 | 14.2 | 12.9–15.7 | 14.0 | 12.5–15.7 | 3.5† | A | L |
| Hispanic | 9.9 | 8.8–11.0 | 11.5 | 10.4–12.6 | 12.3 | 10.9–13.8 | 13.1 | 12.1–14.1 | 14.0 | 12.5–15.6 | 4.1† | A | L |
| Other, non-Hispanic | 13.6 | 11.2–16.4 | 14.8 | 12.5–17.5 | 14.9 | 12.8–17.3 | 18.8 | 17.1–20.7 | 19.3 | 17.3–21.6 | 5.7† | A | L |
| Education | |||||||||||||
| <High school | 7.3 | 6.6–8.2 | 8.5 | 7.6–9.4 | 9.1 | 7.9–10.5 | 11.3 | 10.2–12.5 | 11.9 | 10.4–13.7 | 4.6† | A | L |
| High school graduate | 11.6 | 10.8–12.3 | 13.1 | 12.2–14.0 | 11.9 | 10.9–13.0 | 12.6 | 11.6–13.6 | 13.7 | 12.5–14.9 | 2.1† | AB | L |
| Some college | 15.9 | 15.0–16.8 | 15.9 | 15.0–16.9 | 16.0 | 14.9–17.1 | 15.8 | 14.9–16.8 | 16.1 | 15.0–17.2 | 0.2 | B | L |
| College graduate or higher | 19.5 | 18.3–20.7 | 18.9 | 17.8–20.0 | 20.7 | 19.2–22.3 | 19.5 | 18.4–20.7 | 21.4 | 20.1–22.7 | 1.9† | AB | L |
| Region | |||||||||||||
| Northeast | 14.2 | 13.1–15.4 | 14.1 | 12.9–15.3 | 16.3 | 14.7–18.0 | 14.9 | 13.6–16.3 | 15.9 | 14.6–17.3 | 1.7 | AB | |
| Midwest | 15.1 | 14.1–16.2 | 14.7 | 13.6–15.8 | 15.5 | 14.0–17.1 | 17.1 | 15.8–18.4 | 16.2 | 15.0–17.5 | 1.1 | A | L |
| South | 12.1 | 11.4–12.9 | 14.1 | 13.3–14.9 | 13.4 | 12.5–14.4 | 14.5 | 13.7–15.3 | 16.1 | 15.1–17.1 | 4.0† | B | L |
| West | 15.7 | 14.6–16.7 | 15.3 | 14.1–16.5 | 15.5 | 14.4–16.8 | 15.9 | 15.0–16.7 | 18.6 | 17.3–19.9 | 2.9† | AB | L, Q |
| BMI Category ** | |||||||||||||
| Normal/Underweight | 14.8 | 14.0–15.6 | 15.0 | 14.2–15.8 | 15.3 | 14.3–16.3 | 16.1 | 15.2–16.9 | 16.8 | 15.8–17.8 | 2.0† | A | L |
| Overweight | 14.1 | 13.3–14.8 | 15.0 | 14.1–16.0 | 15.7 | 14.6–16.9 | 15.9 | 15.0–16.8 | 16.9 | 15.8–18.0 | 2.8† | A | L |
| Obesity | 12.3 | 11.4–13.3 | 13.3 | 12.3–14.2 | 13.5 | 12.4–14.7 | 14.3 | 13.4–15.4 | 16.5 | 15.4–17.6 | 4.2† | A | L |
PP: percentage point change (2018 – 1998).
1998 vs 2018 significantly different from 0, p<0.001
D in D: Tests for difference in difference; across levels of a covariate, values that share a letter are not significantly different (Bonferroni-adjusted p-value <0.05)
L: linear; Q: quadratic; C: cubic
BMI based on self-reported height and weight and equal to (weight [kg])÷(height [m])2; underweight: BMI<18.5, normal weight: 18.5 ≤ BMI ≤ 24.9; overweight: 25.0 ≤ BMI ≤ 29.9; obesity: BMI ≥ 30
For all groups examined, the prevalence of meeting the high aerobic guideline was higher in 2018 than 1998 (Table 5). The difference in prevalence between 1998 and 2018 was higher among women than men, and higher among adults without obesity than adults with obesity. There were no statistically significant differences in the change in prevalence between 1998 and 2018 by age, race and ethnicity, educational attainment, or Census region.
Table 5:
Age-adjusted prevalence of meeting the high aerobic guideline in leisure time among adults for selected years, National Health Interview Survey 1998–2018
| Characteristic | 1998 | 2003 | 2008 | 2013 | 2018 | 21-year change | |||||||
|---|---|---|---|---|---|---|---|---|---|---|---|---|---|
| % | 95% CI | % | 95% CI | % | 95% CI | % | 95% CI | % | 95% CI | PP* | D in D test† | Tests of Trend‡ | |
| Overall | 26.0 | 25.4–26.6 | 28.6 | 27.8–29.4 | 28.4 | 27.5–29.4 | 34.3 | 33.5–35.1 | 37.4 | 36.4–38.4 | 11.4 | -- | L, Q, C |
| Sex | |||||||||||||
| Male | 31.9 | 30.9–32.8 | 33.2 | 32.2–34.3 | 33.0 | 31.8–34.3 | 39.0 | 37.8–40.2 | 42 | 40.7–43.3 | 10.1 | A | L, Q, C |
| Female | 20.6 | 19.9–21.3 | 24.3 | 23.4–25.3 | 24.2 | 23.2–25.2 | 29.9 | 29.0–30.9 | 33 | 31.8–34.3 | 12.4 | B | L, Q, C |
| Age group (years) | |||||||||||||
| 18–24 | 35.3 | 33.1–37.5 | 39.5 | 37.0–42.0 | 36.3 | 33.4–39.2 | 45.6 | 43.1–48.1 | 48.3 | 45.4–51.3 | 13.1 | A | L, Q, C |
| 25–34 | 30.2 | 29.0–31.5 | 31.9 | 30.3–33.4 | 34.2 | 32.3–36.2 | 41.6 | 39.8–43.5 | 42.6 | 40.6–44.7 | 12.4 | A | L, Q, C |
| 35–44 | 28.1 | 26.8–29.4 | 30.2 | 28.8–31.7 | 28.8 | 27.0–30.6 | 35.3 | 33.6–37.1 | 38.8 | 36.9–40.7 | 10.7 | A | L, Q |
| 45–64 | 23.7 | 22.7–24.8 | 26.3 | 25.1–27.5 | 26.8 | 25.5–28.1 | 30.6 | 29.3–32.0 | 34.9 | 33.5–36.2 | 11.1 | A | L, Q |
| 65+ | 15.9 | 14.7–17.1 | 18.8 | 17.5–20.2 | 18.6 | 17.2–20.1 | 23.2 | 21.9–24.6 | 26.1 | 24.8–27.4 | 10.2 | A | L, Q |
| Race and ethnicity | |||||||||||||
| White, non-Hispanic | 28.1 | 27.3–28.9 | 31.3 | 30.3–32.2 | 31.5 | 30.3–32.7 | 37.2 | 36.2–38.3 | 39.9 | 38.7–41.1 | 11.8 | A | L, Q, C |
| Black, non-Hispanic | 19.8 | 18.4–21.2 | 22.4 | 20.7–24.2 | 21.3 | 19.4–23.4 | 27.3 | 25.7–28.9 | 32.6 | 30.3–35.0 | 12.8 | A | L, Q, C |
| Hispanic | 19.1 | 17.7–20.7 | 21.6 | 20.2–23.1 | 21.0 | 19.3–22.8 | 29.6 | 28.2–31.0 | 33.7 | 31.4–36.0 | 14.5 | A | L, Q, C |
| Other, Non-Hispanic | 22.7 | 19.8–25.8 | 26.2 | 23.0–29.6 | 27.0 | 24.1–30.1 | 31.0 | 28.7–33.4 | 34.4 | 31.7–37.1 | 11.7 | A | L, Q |
| Education | |||||||||||||
| <High school | 16.3 | 15.0–17.6 | 18.3 | 17.1–19.7 | 16.5 | 14.9–18.3 | 21.7 | 20.2–23.4 | 24.7 | 22.4–27.2 | 8.4 | A | L, Q, C |
| High school graduate | 22.0 | 21.0–23.0 | 24.7 | 23.4–26.0 | 23.5 | 22.1–25.1 | 29.1 | 27.7–30.5 | 30.9 | 29.3–32.6 | 8.9 | A | L, Q |
| Some college | 29.0 | 27.9–30.2 | 31.6 | 30.3–32.9 | 29.4 | 27.9–30.9 | 35.8 | 34.4–37.2 | 37.8 | 36.3–39.4 | 8.8 | A | L, Q |
| College graduate or higher | 35.9 | 34.4–37.4 | 37.6 | 36.1–39.1 | 38.2 | 36.4–40.0 | 43.3 | 41.8–44.7 | 45.2 | 43.7–46.7 | 9.3 | A | L, Q, C |
| Region | |||||||||||||
| Northeast | 25.4 | 24.2–26.6 | 31.5 | 29.8–33.2 | 25.5 | 23.5–27.7 | 33.8 | 32.0–35.7 | 39.3 | 37.1–41.6 | 13.9 | A | L, Q, C |
| Midwest | 26.8 | 25.4–28.2 | 29.0 | 27.5–30.4 | 29.7 | 27.6–31.9 | 32.5 | 30.5–34.5 | 36.7 | 34.7–38.8 | 10.0 | A | L, Q |
| South | 23.2 | 22.3–24.2 | 25.6 | 24.2–27.1 | 26.8 | 25.3–28.4 | 32.6 | 31.3–33.8 | 34.3 | 32.6–36.0 | 11.0 | A | L, Q, C |
| West | 30.9 | 29.2–32.6 | 31.0 | 29.6–32.4 | 31.7 | 29.9–33.6 | 39.4 | 37.7–41.1 | 41.2 | 39.2–43.2 | 10.3 | A | L, Q, C |
| BMI Category § | |||||||||||||
| Normal/Underweight | 28.2 | 27.3–29.2 | 31.2 | 30.1–32.3 | 32.3 | 31.0–33.6 | 37.5 | 36.2–38.8 | 42.7 | 41.2–44.2 | 14.4 | A | L, Q, C |
| Overweight | 27.8 | 26.7–28.8 | 30.9 | 29.7–32.2 | 30.3 | 28.8–31.8 | 37.2 | 36.1–38.4 | 40.6 | 39.1–42.1 | 12.8 | A | L, Q, C |
| Obesity | 20.5 | 19.3–21.8 | 22.9 | 21.6–24.2 | 22.9 | 21.2–24.7 | 28.2 | 26.8–29.6 | 29.6 | 28.1–31.1 | 9.0 | B | L, Q |
PP: percentage point change (2018 – 1998). All differences significantly different from 0, p<0.001
D in D: Tests for difference in difference; across levels of a covariate, values that share a letter are not significantly different (Bonferroni- adjusted p-value <0.05)
L: linear; Q: quadratic; C: cubic
BMI based on self-reported height and weight and equal to (weight [kg])÷(height [m])2; underweight: BMI<18.5, normal weight: 18.5 ≤ BMI ≤ 24.9; overweight: 25.0 ≤ BMI ≤ 29.9; obesity: BMI ≥ 30
All subgroups exhibited significant linear and higher-order trends in the prevalence of meeting the high aerobic guideline from 1998 to 2018. JoinPoint analyses revealed four distinct periods of change for the overall sample of adults: a non-significant average annual increase from 1998 to 2001, a non-significant decrease from 2001 to 2007, another non-significant increase from 2007 to 2010, and a significant increase from 2010 to 2018 (Figure 3). Most subgroups exhibited at least two distinct periods of change and statistically significant increases in prevalence were more common in the second half of the monitoring period.
Figure 3:
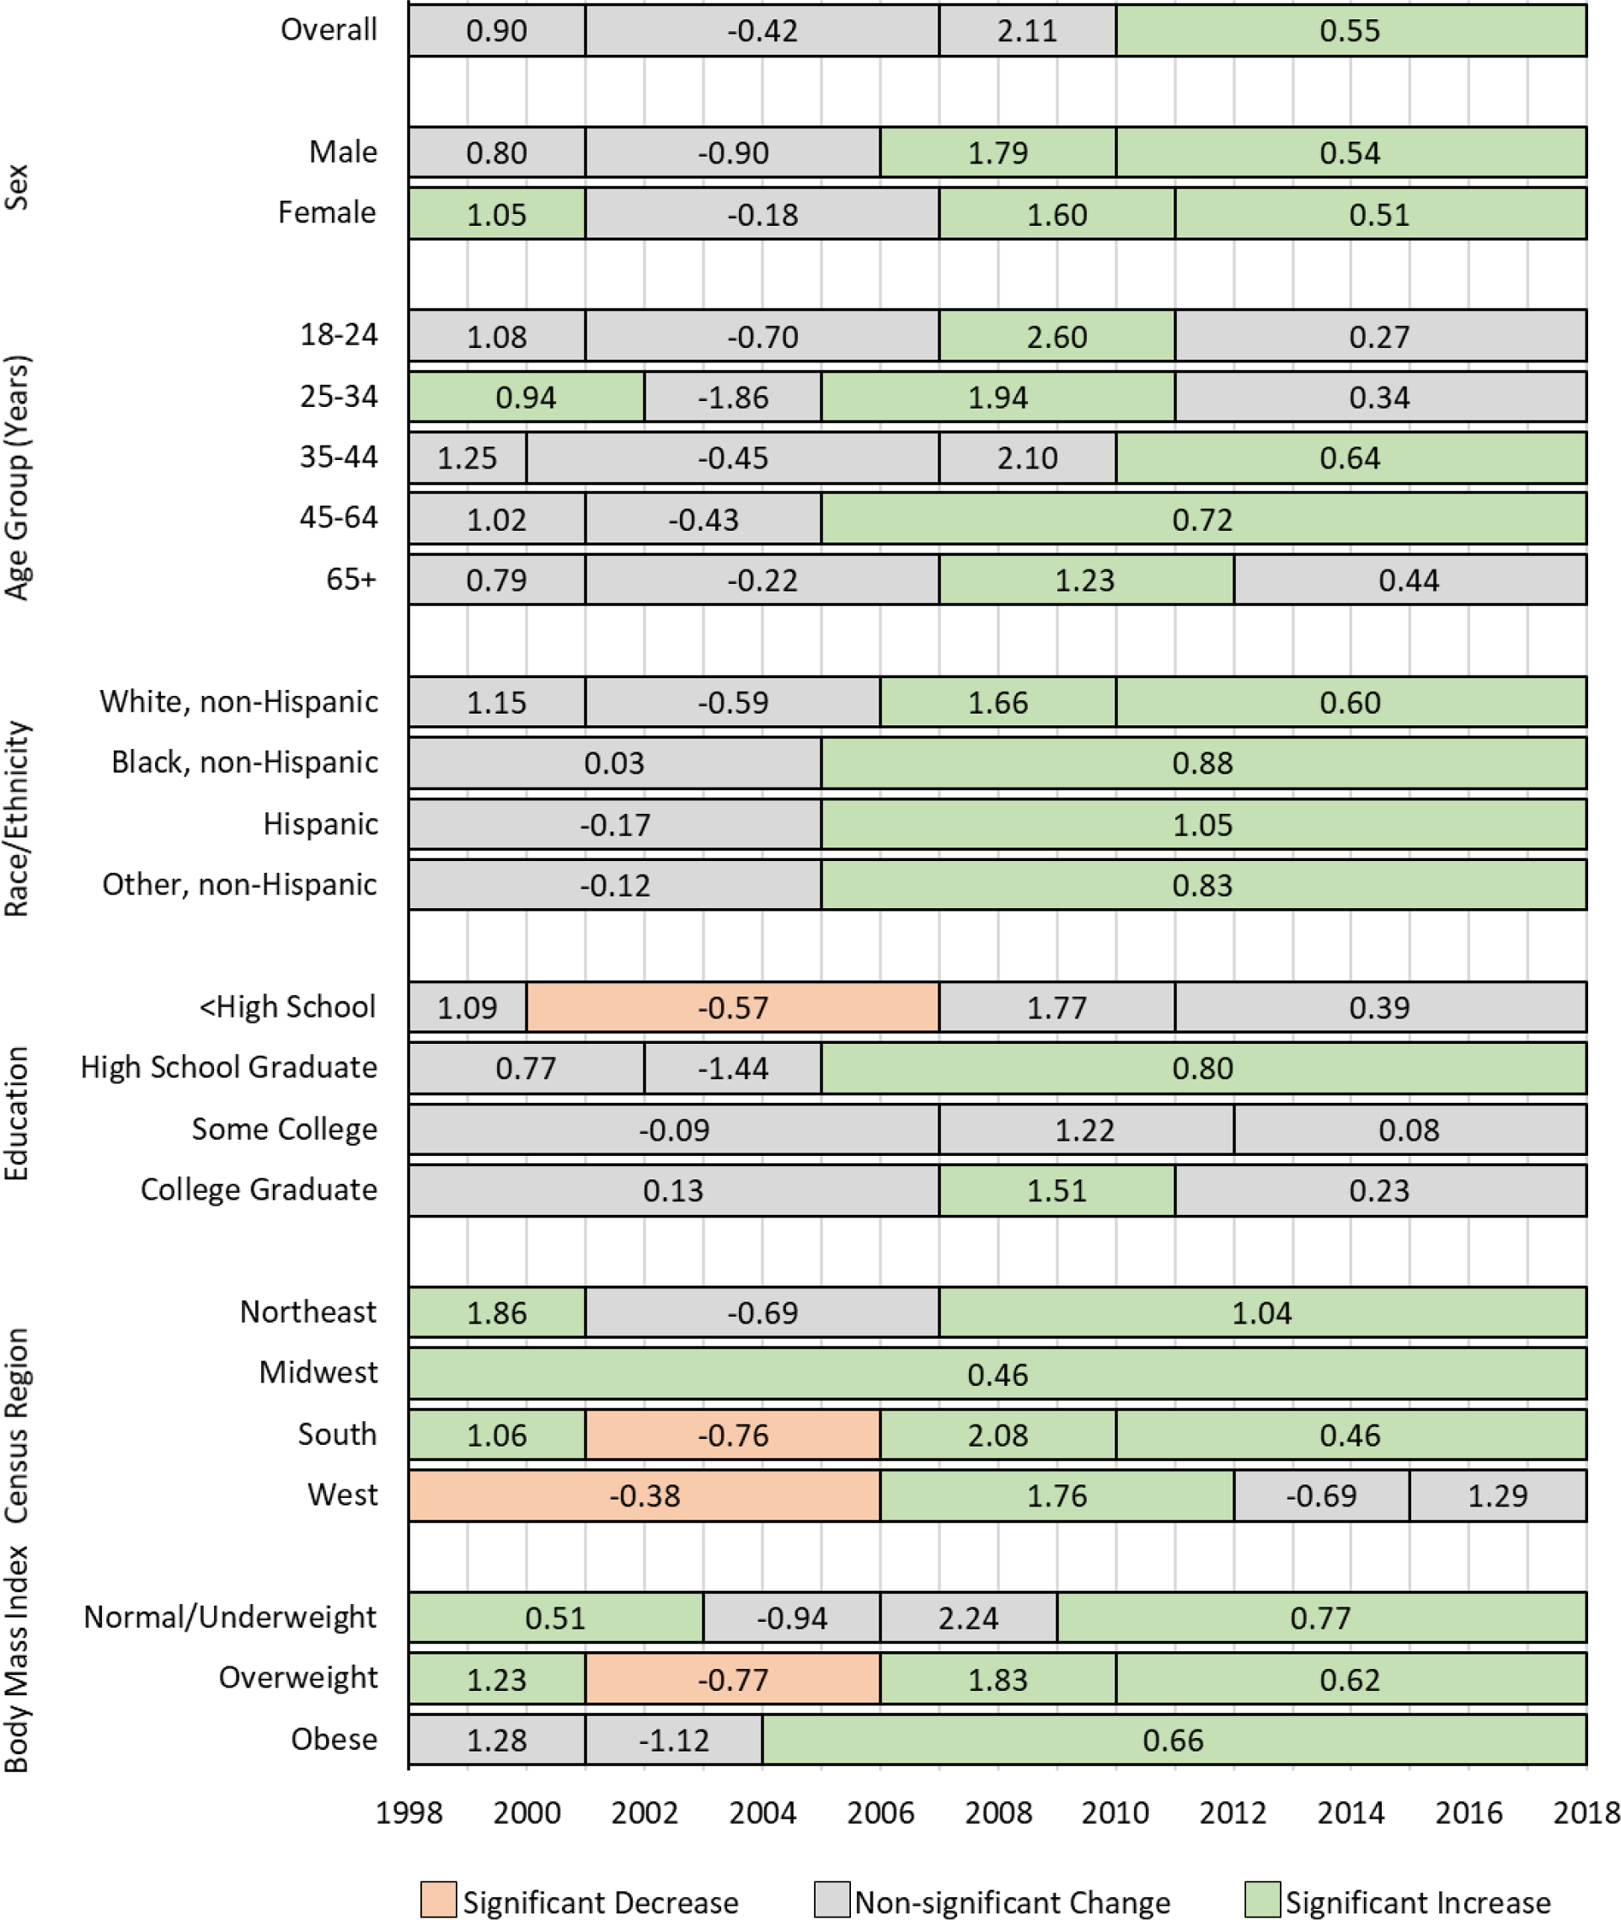
Average annual percentage-point change in meeting the high aerobic guideline in leisure time by year, adults, National Health Interview Survey 1998–2018
Discussion
The prevalence of physical inactivity in leisure time decreased inconsistently from 1998 to 2018 and this coincided with increased prevalence of meeting the high aerobic guideline, which increased inconsistently during this period. The prevalence of insufficient activity and meeting the minimal aerobic guideline increased slightly during this period. Changes in inactivity and meeting the high guideline were statistically significant in all subgroups, but changes in both measures were inconsistent from year to year, with most statistically significant periods of change occurring in the second decade of monitoring. These results are encouraging, but our results also suggest several apparent disparities in physical activity participation have remained largely unchanged since 1998, including meeting the high guideline among older adults, racial/ethnic minorities, and adults with less than a college education.
These results extend previous reports of leisure-time aerobic activity participation in NHIS in two important ways. First, we reported separate estimates for meeting the minimal guideline only and meeting the high guideline. Most previous reports have included meeting or exceeding the minimal guideline (≥150 minutes per week) and meeting the high guideline (>300 minutes per week), but not meeting the minimal guideline only (150–300 minutes per week).2,5,13,14 This addition allowed us to show that recent increases in meeting or exceeding the guideline overall are primarily driven by more people reporting sufficient activity to meet the high guideline, not the minimal guideline. Second, most previous reports of leisure-time activity in NHIS have focused on shorter time periods.2,5,13,14 For example, physical activity reporting for Healthy People 20205 covers the years since 2010 and CDC’s Trends in Meeting the Physical Activity Guidelines for Americans covers 2008 – 2018.2 By including 21 years of data and JoinPoint regression, we were able to place recent changes in context and show that increases in activity and decreases in inactivity were more common in the years after 2008.
Comparing trends in physical activity participation in NHIS to other surveillance systems is challenging because of differences in their assessment and data collection methods.3,15 BRFSS and NHANES have also shown increasing trends in subsets of the years examined here,15,16 but important differences should be noted. For example, unlike the NHIS, NHANES assesses occupational/household- and transportation-related aerobic activity in addition to leisure-time aerobic activity.17 From 2007–2008 to 2017–2018, the prevalence of meeting the aerobic guideline (≥150 minutes/week) using all domains among adult NHANES participants increased from 64.1% to 68.1%;16 if limited to only leisure-time activity, the NHANES estimates were 35.3% to 38.6%.16 Over a comparable period in NHIS (2007 – 2018), the prevalence of meeting the aerobic guideline in leisure time increased from 41.5% to 54.2%, which is higher than the leisure-time only NHANES estimates. One possible explanation is the order of assessment in NHANES, which assesses occupational/household activity, then transportation activity, and concludes with leisure activity.17 It is possible that respondents may report activity that is not clearly leisure-time related as being household or transportation-related activity in NHANES18,19 (e.g., walking the dog could be a household chore or a leisure pursuit; bicycling to dinner could be for transportation or leisure), resulting in a lower leisure-time estimate than NHIS which has only one category to capture these activities. It is also notable that changes in NHANES over this period were of smaller magnitude than changes in NHIS. Despite differences in methodology, it is encouraging to observe concomitant changes in the same direction in two distinct surveillance systems that assess closely related physical activity constructs.
Year to year changes in physical inactivity and meeting the high aerobic guideline were remarkably similar but in opposite directions, yielding near mirror-image changes in these measures over time. Conversely, changes in insufficient activity and meeting the low aerobic guideline were relatively small. This finding is consistent with a gradual population-level increase in average physical activity participation. Under this scenario, the lowest category (inactivity) would experience a net loss as the population became, on average, more active while the highest category would experience a net gain. The two intermediate categories would experience both losses, as adults moved to higher categories of participation, and gains, as adults moved up from lower categories. Analyses of large, longitudinal cohorts or panels may further explain how participation shifts among physical activity categories over time. Regardless of cause, increased prevalence of meeting the high guideline is a positive finding with public health implications, including the potential to reduce the incidence of certain chronic diseases. Complimentary to our findings, the CDC recently reported a reduction in the age-adjusted incidence of diagnosed diabetes among US adults from 8.4 cases/1000 in 2008 to 6.7/1000 in 2018.20 Our study cannot determine causal attribution; however, continued increases in physical activity participation may reduce disease risk and help continue this encouraging trend.
Increases in the prevalence of meeting the high guideline were markedly similar across categories of characteristics examined, which means several disparities that existed in 1998 remained mostly unchanged in 2018. For example, the prevalence of meeting the high guideline was approximately 20 percentage points higher among the youngest compared to the oldest age group in 1998 and remained approximately 22 percentage points higher in 2018. Similarly, the prevalence was approximately 20 percentage points higher among the most educated adults compared to the least educated adults in 1998 and remained approximately 21 percentage points higher in 2018. These results may be used to identify groups that could benefit from focused strategies to close persistent disparities in physical activity participation, such as tailored programs in areas with high concentrations of persistently less-active subgroups.
The prevalence of inactivity and of meeting the high aerobic guideline exhibited greater change in the second decade of monitoring than in the first, both overall and for many subgroups. While a definitive explanation of the causes of increases in this period are beyond the scope of this analysis, several possibilities exist. First, physical activity has gained prominence as an important health behavior during the second decade of monitoring. Before 2008, various organizations made recommendations for physical activity participation3, but physical activity arguably gained importance with the federal Physical Activity Guidelines for Americans21 in 2008. The importance of physical activity was further reinforced with Step It Up! The Surgeon General’s Call to Action to Promote Walking and Walkable Communities22 in 2015, and the updated federal Physical Activity Guidelines for Americans, 2nd edition1 in 2018. Second, policies that promote access to safe and convenient places for physical activity have become more common in the U.S. over the past decade. For example, from 2006 to 2018, the number of states with a Complete Streets policy (i.e. policies that promote streets designed to enable safe access for all users, including pedestrians, bicyclists, motorists and transit riders of all ages and abilities23) increased from 11 to 35 and the number of local or regional policies increased from 34 to 1,339.23 Third, leisure-time physical activity is known to be more common among urban versus rural residents,7,24 and the proportion of the U.S. population living in urban areas has increased at every decennial census since 1910, reaching 81% in 2010.25 The 2020 decennial Census will indicate if this trend has continued. Finally, 21 years of monitoring includes a change in the generational composition of adults. A person who turned 18 years old in 1998 was born in 1980 (Gen X or millennial), while a person who turned 18 in 2018 was born in 2000 (generation Z).26 Additional analyses of these data examining age, period, and cohort effects27 may indicate if younger generations are more active at a given age than their predecessors. Understanding the underlying causes of recent increases in physical activity participation is important to inform future efforts to sustain and expand participation.
In 2017, CDC launched Active People, Healthy NationSM, an initiative to increase physical activity participation by “leveling up” 27 million Americans from lower to higher activity categories.28 The initiative focuses on seven proven strategies to increase physical activity: activity friendly routes to everyday destinations, access to places for physical activity, school and youth programs, community-wide campaigns, social supports, individual supports, and prompts to encourage physical activity. Further proliferation of initiatives such as Active People, Healthy NationSM may be important for continued elevation of physical activity as an important health behavior and sustaining recent progress in promoting physical activity.
This report is subject to at least four limitations. First, all physical activity in NHIS is self-reported and subject to recall and social desirability biases.18 Second, we excluded those missing data, which could bias estimates if they were substantially different from those with complete data, though physical activity data were complete for over 90% of the sample. Third, NHIS instructed respondents to report physical activity that occurred in bouts of 10 minutes or longer, and this no longer concurs with the Guidelines, which have no bout length recommendation1. However, recent research suggests the 10-minute prompt has minimal impact on the prevalence of meeting the aerobic guideline.29 Finally, NHIS instructs respondents to report light or moderate aerobic activity simultaneously, but the Guidelines recommend activity that is of at least moderate intensity.1 Strengths of this report include the NHIS sample, which includes hundreds of thousands of adults from around the country to provide nationally-representative estimates over the course of the study period. Additionally, this analysis includes 21 years of NHIS data with consistent physical activity assessment, providing the most complete information possible on changes in leisure-time aerobic activity over this period.
In conclusion, the prevalence of physical inactivity in leisure time decreased and the prevalence of meeting the high aerobic physical activity guideline increased from 1998 to 2018. These changes were statistically significant in all subgroups and were larger than changes observed for insufficient activity and meeting only the minimal aerobic guideline. Future physical activity promotion strategies may focus on narrowing persistent disparities in participation across subgroups and physical activity initiatives such as Active People, Healthy NationSM may be important to continue recent positive trends.
Funding:
The work of E.T.H was partially supported by the National Heart, Lung, and Blood Institute (5T32-HL079891-14).
Footnotes
Disclaimer: The findings and conclusions in this manuscript are those of the authors and do not necessarily represent the official position of the CDC.
References
- 1.United States Department of Health and Human Services. Physical Activity Guidelines for Americans, 2nd edition. Washington, DC: U.S. Dept. of Health and Human Services; 2018. [Google Scholar]
- 2.Centers for Disease Control and Prevention. Trends in meeting the 2008 Physical Activity Guidelines, 2008–2017. 2018; https://www.cdc.gov/physicalactivity/downloads/trends-in-the-prevalence-of-physical-activity-508.pdf. Accessed 6 February 2019.
- 3.Omura J, Ussery E, Watson K, et al. Placeholder for the summary paper. Journal of physical activity & health. 2021. [Google Scholar]
- 4.National Center for Health Statistics. National Health Interview Survey. 2018; https://www.cdc.gov/nchs/nhis/index.htm. Accessed 2 January 2019.
- 5.United States Department of Health and Human Services. 2020 Topics and Objectives, Physical Activity. 2020; https://www.healthypeople.gov/2020/topics-objectives/topic/physical-activity/objectives. Accessed 6 February 2020.
- 6.Division of Nutrition Physical Activity and Obesity. Nutrition, Physical Activity, and Obesity: Data, Trends and Maps. 2020; https://www.cdc.gov/nccdphp/dnpao/data-trends-maps/index.html. Accessed 2020 August 12.
- 7.Whitfield GP, Carlson SA, Ussery EN, Fulton JE, Galuska DA, Petersen R. Trends in Meeting Physical Activity Guidelines Among Urban and Rural Dwelling Adults - United States, 2008–2017. MMWR Morb Mortal Wkly Rep. 2019;68(23):513–518. [DOI] [PMC free article] [PubMed] [Google Scholar]
- 8.Carlson SA, Fulton JE, Pratt M, Yang Z, Adams EK. Inadequate physical activity and health care expenditures in the United States. Prog Cardiovasc Dis. 2015;57(4):315–323. [DOI] [PMC free article] [PubMed] [Google Scholar]
- 9.National Center for Health Statistics. Health, United States, 2018. In. Hyatsville, MD: Centers for Disease Control and Prevention; 2019. [Google Scholar]
- 10.National Center for Health Statistics. National Health Interview Survey Methods. 2019; https://www.cdc.gov/nchs/nhis/methods.htm. Accessed 2020 August 12.
- 11.Clinical Guidelines on the Identification, Evaluation, and Treatment of Overweight and Obesity in Adults--The Evidence Report. National Institutes of Health. Obes Res. 1998;6 Suppl 2:51S–209S. [PubMed] [Google Scholar]
- 12.Klein RJ, Schoenborn CA. Age adjustment using the 2000 projected U.S. population. Healthy People 2010 Stat Notes. 2001(20):1–10. [PubMed] [Google Scholar]
- 13.Gu JK, Charles LE, Ma CC, et al. Prevalence and trends of leisure-time physical activity by occupation and industry in U.S. workers: the National Health Interview Survey 2004–2014. Ann Epidemiol. 2016;26(10):685–692. [DOI] [PMC free article] [PubMed] [Google Scholar]
- 14.Carlson SA, Fulton JE, Schoenborn CA, Loustalot F. Trend and prevalence estimates based on the 2008 Physical Activity Guidelines for Americans. Am J Prev Med. 2010;39(4):305–313. [DOI] [PubMed] [Google Scholar]
- 15.Carlson SA, Densmore D, Fulton JE, Yore MM, Kohl HW 3rd. Differences in physical activity prevalence and trends from 3 U.S. surveillance systems: NHIS, NHANES, and BRFSS. Journal of physical activity & health. 2009;6 Suppl 1:S18–27. [DOI] [PubMed] [Google Scholar]
- 16.Whitfield GP, Ussery EN, Carlson SA. Trends in Meeting the Aerobic Guideline in Multiple Domains: NHANES 2007–2008 to 2017–2018. JAPH. 2021;TBD. [Google Scholar]
- 17.Centers for Disease Control and Prevention. National Health and Nutrition Examination Survey 2011–2012 Data Documentation, Codebook, and Frequencies Physical Activity (PAQ_G). 2013; https://wwwn.cdc.gov/Nchs/Nhanes/2011-2012/PAQ_G.htm. Accessed 6 February 2020.
- 18.Rzewnicki R, Vanden Auweele Y, De Bourdeaudhuij I. Addressing overreporting on the International Physical Activity Questionnaire (IPAQ) telephone survey with a population sample. Public Health Nutr. 2003;6(3):299–305. [DOI] [PubMed] [Google Scholar]
- 19.Hutto B, Sharpe PA, Granner ML, Addy CL, Hooker S. The effect of question order on reporting physical activity and walking behavior. Journal of physical activity & health. 2008;5 Suppl 1:S16–29. [DOI] [PubMed] [Google Scholar]
- 20.Centers for Disease Control and Prevention. National Diabetes Statistics Report 2020: Estimates of Diabetes and Its Burden in the United States. In: Services DoHaH, ed. Atlanta, GA2020:6. [Google Scholar]
- 21.United States Department of Health and Human Services. 2008 Physical Activity Guidelines for Americans. Washington, DC: U.S. Dept. of Health and Human Services; 2008. [Google Scholar]
- 22.United States Department of Health and Human Services. Step it up! The Surgeon General’s Call to Action to Promote Walking and Walkable Communities. In. Washington, DC: U.S. Dept of Health and Human Services, Office of the Surgeon General; 2015. [PubMed] [Google Scholar]
- 23.National Complete Streets Coalition. Complete Streets Policies Nationwide. 2020; https://smartgrowthamerica.org/program/national-complete-streets-coalition/publications/policy-development/policy-atlas/. Accessed 14 August 2020.
- 24.Fan JX, Wen M, Kowaleski-Jones L. Rural-urban differences in objective and subjective measures of physical activity: findings from the National Health and Nutrition Examination Survey (NHANES) 2003–2006. Preventing chronic disease. 2014;11:E141. [DOI] [PMC free article] [PubMed] [Google Scholar]
- 25.Ratcliffe M, Burd C, Holder K, Fields A. Defining Rural at the U.S. Census Bureau. In: United States Department of Commerce, ed. Washington, DC: 2016. [Google Scholar]
- 26.Twenge J. How are Generations Named? 2018; https://www.pewtrusts.org/en/trend/archive/winter-2018/how-are-generations-named. Accessed 14 August 2020.
- 27.Yang Y, Land KC. A Mixed Models Approach to the Age-Period-Cohort Analysis of Repeated Cross-Section Surveys, with an Application to Data on Trends in Verbal Test Scores. Social Methodology. 2006;36(1):75–97. [Google Scholar]
- 28.Fulton JE, Buchner DM, Carlson SA, et al. CDC’s Active People, Healthy Nation(SM): Creating an Active America, Together. Journal of physical activity & health. 2018;15(7):469–473. [DOI] [PMC free article] [PubMed] [Google Scholar]
- 29.Ussery EN, Watson KB, Carlson SA. The Influence of Removing the Ten-Minute Bout Requirement on National Physical Activity Estimates. Preventing chronic disease. 2020;17:E19. [DOI] [PMC free article] [PubMed] [Google Scholar]