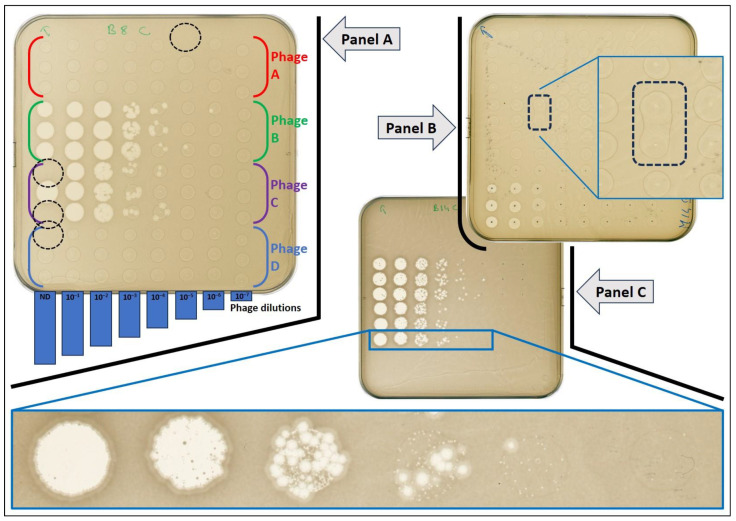
Figure 3.
Representative images of agar plates obtained with the automated method. Panel A: layout of phage spots on the bacterial lawn (four different phages, vertical axe, A to D), at a decreasing concentration (horizontal axe, from left to right, ten-fold serial dilution, non-diluted to 10−7), in triplicate. Dotted circles indicate the absence of a drop at the expected location. Panel B: example of drop coalescence (merging). Panel C: example of the visualization of two plaque morphologies when testing the cocktail, corresponding to two active phages.

