

Abstract
Recently three large meta‐analyses of genome‐wide association studies for venous thromboembolism (VTE) identified over 130 genetic variants. However, mechanisms by which newly identified and therefore underexplored VTE‐associated genetic variants influence VTE remain unclear. To elucidate the mechanism, we investigated the association between 61 newly identified VTE‐associated genetic variants and the levels of coagulation factor (F) VIII, FIX, FXI, and fibrinogen as well as thrombin generation parameters (lag time, peak, endogenous thrombin potential, time‐to‐peak, and velocity), which are well‐known biological traits associated with VTE. This study was conducted on 5341 participants of the Netherlands Epidemiology of Obesity study. The associations between VTE‐associated genetic variants and coagulation factor levels and thrombin generation parameters were examined using linear regression analyses, adjusted for age, sex, body mass index, oral contraceptive use, hormone replacement therapy, and menopausal status. Of 61 genetic variants, 33 were associated with one or more of the coagulation factor levels and thrombin generation parameters. Following multiple testing corrections, five genetic variants remained significant, of which MAP1A rs55707100 exhibited the most robust association with thrombin generation parameters and FXI levels (β = ‐5.33%, 95% confidence interval: ‐8.44, ‐2.22). Our findings shed light on the underlying mechanisms by which these genetic variants influence the risk of VTE.
Keywords: genetic variant, procoagulant factor, the Netherlands epidemiology of obesity study, thrombin generation potential, venous thromboembolism
1. INTRODUCTION
Venous thromboembolism (VTE) is a multicausal disease influenced by acquired and genetic risk factors. Genome‐wide association studies (GWAS) have identified genetic variants associated with VTE [1, 2, 3, 4, 5, 6]. Recently, three large GWAS meta‐analyses identified over 130 genetic loci associated with VTE. In 2019, a GWAS meta‐analysis was performed in 30,234 VTE cases and 172,122 controls, which identified 37 novel genetic variants associated with VTE [7]. This included six loci that were newly identified and replicated in an independent cohort. Klarin and colleagues reported 39 genetic loci from GWAS meta‐analysis, of which 22 replicated loci had not previously been reported in VTE [8]. In 2022, a cross‐ancestry GWAS meta‐analysis identified 135 independent genetic loci, of which 34 novel genetic loci were replicated in an independent cohort [9].
Knowledge of associations between novel genetic loci and the coagulation system may lead to a better understanding of the biological mechanism by which genetic loci influence VTE risks. However, although in individual GWAS, associations between newly identified genetic variants and intermediate hemostasis phenotypes (fibrinogen, fibrin D‐dimer, coagulation factors (F) VII, FVIII, FXI, von Willebrand factor (VWF), tissue plasminogen activator, plasminogen activator inhibitor‐1, activated partial thromboplastin time, and prothrombin time) was investigated, functional role of these genetic variants remains to be fully understood [7, 9]. To better understand the mechanism, more extensive intermediate hemostasis phenotypes of VTE need to be investigated, for example, by assessing the association with FIX, which is associated with an increased risk of VTE [10, 11, 12].
In addition to individual coagulation factors, to capture the dynamics of the coagulation cascade, global hemostatic coagulation tests are developed, and the thrombin generation assay is one example. The thrombin generation assay measures the potential to generate thrombin, which plays a crucial role in response to vascular injury as the major enzyme involved in the hemostatic system. In the thrombin generation assay, coagulation is activated with a small amount of tissue factor after which five parameters of thrombin generation can be assessed: lag time, peak height, endogenous thrombin potential (ETP), time‐to‐peak, and velocity. An increased ETP and a high peak of thrombin generation have consistently been associated with an increased risk of VTE [13, 14, 15, 16].
In this study, we aim to better understand potential biological mechanisms by which yet functionally underexplored genetic variants identified from three recent large GWAS meta‐analyses affect VTE risks. We investigated associations between functionally underexplored genetic variants reported in three recent VTE GWAS meta‐analyses [7, 8, 9] and the levels of FVIII, FIX, FXI, and fibrinogen as well as the five thrombin generation parameters including lag time, peak, time‐to‐peak, ETP, and velocity measured in the Netherlands Epidemiology of Obesity (NEO) study.
2. MATERIALS AND METHODS
2.1. Study population
The NEO study is a population‐based cohort study and included 6671 men and women aged between 45 and 65 years at baseline (2008–2012), with an oversampling of individuals with a self‐reported body mass index (BMI) of 27 kg/m2 or higher. The study was approved by the Medical Ethical Committee of the Leiden University Medical Center (LUMC), Leiden, the Netherlands. All participants gave their written informed consent. The study design has been described in detail previously [17]. Briefly, people with a BMI of 27 kg/m2 or higher living in the greater area of Leiden in the west of the Netherlands were invited to participate in the NEO study. Additionally, people living in the neighboring municipality Leiderdorp were invited regardless of BMI, representing a reference distribution of BMI similar to the general Dutch population.
The present study consists of cross‐sectional analyses using baseline measurements of the NEO study. Participants were excluded from analyses if 1) they used vitamin K antagonist or heparin, 2) had active cancer, and 3) had non‐white ethnicity in self‐report (Figure 1). Active cancer patients were defined as those who have been diagnosed within 5 years and have not been medically cured based on self‐report. We also excluded participants who did not pass genotype quality control as described earlier [18]. We additionally excluded participants with missing data on any needed variables and with outlier values (z‐score > 5) in outcomes. Finally, this study was performed on 5341 participants.
FIGURE 1.
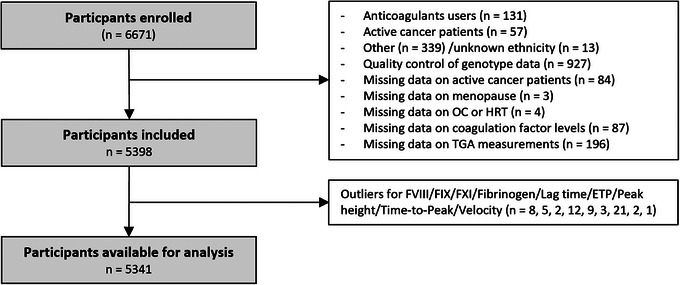
Flow chart of the study. ETP, endogenous thrombin potential; F, coagulation factor; HRT, hormone replacement therapy; OC, oral contraceptive; TGA, thrombin generation assay.
2.2. Outcome measurement
In 5341 participants at baseline, fasting blood samples to measure the levels of coagulation factors and thrombin generation parameters were drawn into tubes containing 0.106 M trisodium citrate (Sarstedt, Etten Leur, the Netherlands) and processed within 4 hours without the measurement of residual platelets [17]. Tubes were centrifuged for 10 min at 2500 g at 18°C and aliquoted plasma was stored at −80°C until further use, only after the first time thawing for 3 min at 37°C of a water bath. FVIII, FIX, and FXI activity were measured using a factor‐specific clotting assay with an ACL TOP 700 analyzer (Werfen, Barcelona, Spain). Fibrinogen levels were measured by the method of Clauss [19]. The reproducibility of measurements was evaluated by using the same protocol with fasting blood samples collected from a random subset of 100 participants after three to five months from the first visit. The reproducibility of measurements was presented in a previous publication [20]. Thrombin generation was measured using protocols described previously by Hemker et al.[21]: calibrated automated thrombogram (Thrombinoscope BV) [22]. Briefly, 20 μL of PPP‐Reagent LOW (86194, TS31.00; Stago) and thrombin calibrator (86192, TS30.00; Stago) were dispensed into the wells of a round‐bottom, 96‐well plate (#3655; Thermo Scientific). A thermostable inhibitor of contact activation (PS‐0177‐oxoxox; Synapse Research Institute) was added to plasma samples from the participants in the NEO study and to normal pooled plasma (as an internal control for each plate). Then, 80 μL of mixed plasma was added to the plate, and the plate was placed in a fluorometer for incubation at 37°C for 10 min. Thrombin formation was initiated by adding 20 μL of a fluorogenic substrate with calcium (FluCa‐kit, 86197, TS 50.00; Stago). The final reaction volume was 120 μL. Thrombin formation was determined every 10 seconds for 50 min and corrected for the calibrator using the Thrombinoscope software. The inter‐assay coefficient variation determined in normal pooled plasma ranged between 5.3% and 17.2% for thrombin generation parameters. Lag time measured in minutes represents the time from induction to the initial thrombin generation. ETP, the area under the thrombin generation curve is a measure of the total amount of thrombin formed during the assay. Peak height measured in nM indicates the highest point of thrombin level. Time‐to‐peak measured in minutes represents the time from induction to peak. Velocity indicates how fast thrombin levels rise from the initial point of thrombin generation to the peak amount formed.
2.3. Selection of VTE‐associated genetic variants
As this study aims to better understand the biological functions of recently identified and therefore less explored VTE‐associated genetic variants, we focused on the single nucleotide polymorphisms (SNPs), which were defined as “novel” findings in three original GWASs published between 2019 and 2022 [7, 8, 9]. These GWAS meta‐analyses reported 58 “novel” genetic variants, that is, which were newly identified to be associated with VTE risk and were successfully replicated in a different study population in the original publication. Additionally, we included six novel variants in articles by Lindström et al. [7] and Klarin et al.[8], which were not replicated within the original publication but were identified as VTE‐associated SNPs in GWAS by Thibord et al.[9]. Therefore, we aimed to assess the phenotype association of 64 VTE‐associated SNPs from imputed genotype data in the NEO study.
Detailed information on genotyping and imputation procedure was described elsewhere [18]. Briefly, genotyping was conducted using the Illumina HumanCoreExome‐24 BeadChip (Illumina Inc.). Because not all genetic variants were directly genotyped, we performed genotype imputation to infer the missing genotypes based on a reference panel from the 1000 Genome project (v3 2011) with IMPUTE (v2.2) software after the quality control. This procedure increased genome coverage and power for the investigation of the association with coagulation factor levels and thrombin generation parameters. After genotype imputation, a total of 29,556,346 genetic variants were included in the imputed genotype data, including 61 out of the 64 VTE‐associated SNPs that we aimed to study. Among the studied genetic variants in the current study, 12 were directly genotyped and 49 were imputed genetic variants. Three of the 64 genetic variants (rs2074492, rs35208412, and rs142140545) were not covered in the imputed genotype data in the NEO study therefore we analyzed associations between 61 VTE‐associated SNPs and the levels of coagulation factors and thrombin generation parameters. An imputation quality score below 0.3 indicates a low accuracy of imputation. For these 61 genetic variants, imputation quality was higher than 0.55 with a median of 0.97 (Table S1).
Imputed SNPs have uncertainties in inferring their genotypes, that is, the lower the imputation quality, the higher the chance to deviate from real genotypes. To evaluate potential measurement error from imputed genotype data, we performed TaqMan Assay (Applied Biosystems) using a polymerase chain reaction mix (TaqPath ProAmp Master Mix, Applied Biosystems) for nine SNPs identified by Lindström et al.[7]. Five of nine genetic variants succeeded in being genotyped. We assessed the correspondence of these five genotypes between TaqMan measures and imputed genotypes and developed a prediction model to infer the misclassification rate of the other imputed variants without TaqMan measures.
2.4. Statistical analysis
In the NEO study, participants with a BMI ≥ 27 kg/m2 were oversampled. We first invited individuals aged between 45 and 65 years with self‐reported BMI ≥ 27 kg/m2 who lived in Leiden and its surrounding area. In addition, individuals aged between 45 and 65 years living in the neighboring municipality, Leiderdorp, were invited regardless of BMI. A total of 1671 individuals participated in the NEO study from the latter invitation, representing a reference BMI distribution similar to the BMI distribution of the general Dutch population [23]. Because of the skewed BMI distribution in the NEO study due to the oversampling of overweight and obese individuals, inferences made on the general population might be biased. To correctly represent associations in the general population, adjustments for the oversampling of individuals with a BMI ≥ 27 kg/m2 have been made [24, 25]. This was done by calculating weight factors for the NEO population based on the 1671 participants with a reference BMI distribution. By using these weight factors, we assigned a higher weight to the participants with lower BMI when we estimated the association between genetic variants and coagulation factor levels as well as thrombin generation parameters [26]. Consequently, the results of the present study applied to a population‐based study without oversampling of individuals with a BMI ≥ 27 kg/m2.
We assessed distributions for the levels of coagulation factors and thrombin generation parameters. All were normally distributed except thrombin generation velocity. We applied natural logarithm transformation to obtain normal distribution for thrombin generation velocity. Linear regression analysis was used to estimate the regression coefficient (β) with 95% confidence intervals (CI) for the association between genetic variants and the levels of coagulation factors and thrombin generation parameters under an additive genetic model and adjusted for age, sex, body mass index, oral contraceptive use, hormone replacement therapy, and menopausal status. We considered a minor allele as an effect allele in the analysis. As lag time and time‐to‐peak are negatively associated with VTE risks, a reversed linear regression analysis was performed for these two outcomes. Due to natural logarithm transformations applied to velocity, we exponentiated the obtained coefficients and 95% CI, subtracted one from the values, and multiplied by 100 to report the results in Tables 2 and 3, and Tables S2 and S3. The results are interpreted as the percent increase or decrease of velocity per allele. We employed a false discovery rate (FDR) for multiple testing corrections with a q‐value of 0.1 as a significant threshold. To assess the impact of potential misclassification on the estimated effect sizes, we replicated the analyses with the genotype data obtained from the TaqMan assay after adjustment for the same confounders. All statistical analyses were conducted in R version 4.2.1.
TABLE 2.
Venous thromboembolism (VTE)‐associated genetic variants associated with thrombin generation parameters.
| Chr | rsID | Gene | Direction for VTE | Lag time | ETP | Peak | Time‐to‐peak | Velocity |
|---|---|---|---|---|---|---|---|---|
| 6 | rs7739314 | STXBP5 | – | −0.01 (−0.09, 0.08) | −14.49 (−31.63, 2.64) | −1.73 (−3.34, −0.13) | −0.08 (−0.18, 0.03) | −3.63 (−6.13, −1.06) |
| 12 | rs216296 | VWF | – | −0.04 (−0.18, 0.10) | −15.20 (−47.56, 17.16) | −3.32 (−6.06, −0.58) | −0.23 (−0.41, −0.04) | −6.44 (−10.66, −2.01) |
| 12 | rs12824685 | SBNO1 | – | 0.03 (−0.08, 0.14) | −5.53 (−28.09, 17.04) | −1.68 (−3.72, 0.36) | −0.02 (−0.16, 0.12) | −2.71 (−5.93, 0.62) |
| 15 | rs55707100 | MAP1A | – | −0.50 (−0.84, −0.17) | −120.31 (−180.38, −60.24) | −10.73 (−15.77, −5.70) | −0.63 (−1.05, −0.21) | −15.00 (−22.14, −7.21) |
| 17 | rs77542162 | ABCA6 | + | −0.16 (−0.42, 0.10) | 5.15 (−53.79, 64.09) | 1.98 (−3.41, 7.38) | −0.03 (−0.36, 0.31) | 2.51 (−6.29, 12.14) |
Results are based on analyses weighted toward the BMI distribution of the general population (n = 5341).
Values are reported as regression coefficients with 95% confidence intervals.
Analyses are adjusted for age, sex, body mass index, menopausal status, oral contraceptive use, and hormone replacement therapy.
Abbreviations: Chr, chromosome; ETP, endogenous thrombin potential; VTE, venous thromboembolism.
TABLE 3.
Venous thromboembolism (VTE)‐associated genetic variants associated with coagulation factor levels.
| Chr | rsID | Gene | Direction for VTE | FVIII | FIX | FXI | Fibrinogen |
|---|---|---|---|---|---|---|---|
| 6 | rs7739314 | STXBP5 | – | −3.45 (−5.13, −1.77) | −0.52 (−1.45, 0.42) | −0.26 (−1.30, 0.79) | 0.86 (−2.06, 3.79) |
| 12 | rs216296 | VWF | – | −6.05 (−8.79, −3.31) | −0.05 (−1.67, 1.56) | −1.04 (−2.86, 0.78) | 4.04 (−1.49, 9.57) |
| 12 | rs12824685 | SBNO1 | – | −0.47 (−2.53, 1.59) | −1.97 (−3.13, −0.80) | −1.08 (−2.28, 0.12) | −0.17 (−3.95, 3.61) |
| 15 | rs55707100 | MAP1A | – | −4.11 (−9.23, 1.02) | 1.35 (−1.73, 4.44) | −5.33 (−8.44, −2.22) | −4.63 (−13.59, 4.32) |
| 17 | rs77542162 | ABCA6 | + | 4.45 (−1.00, 9.90) | 4.34 (1.54, 7.13) | 5.18 (2.05, 8.31) | 5.98 (−4.31, 16.27) |
Results are based on analyses weighted toward the BMI distribution of the general population (n = 5341).
Values are reported as regression coefficients with 95% confidence intervals.
Analyses are adjusted for age, sex, body mass index, menopausal status, oral contraceptive use, and hormone replacement therapy.
Abbreviations: Chr, chromosome; VTE, venous thromboembolism.
3. RESULTS
3.1. Participant characteristics
Table 1 describes the baseline characteristics of 5341 study participants as proportion for categorical variables and mean with standard deviation (SD) or median with interquartile range for continuous variables. The mean (SD) age of participants was 56 (6) years. The study population consisted of 56% women, of whom 83% were peri‐ or postmenopausal, and 6.2% and 3.2% were taking oral contraceptives or hormone replacement therapy, respectively.
TABLE 1.
Characteristics of the study population.
| Study population (n = 5341) | |
|---|---|
| Age (year) | 56 (6) |
| Sex (% women) | 56 |
| Menopause status (% peri or post) | 82.50 |
| Oral contraceptive user (%) | 6.20 |
| Hormone replacement therapy (%) | 3.19 |
| Body mass index | 29.4 (27.3–32.1) |
| FVIII activity (%) | 120.87 (30.87) |
| FIX activity (%) | 116.08 (19.07) |
| FXI activity (%) | 116.46 (19.44) |
| Fibrinogen (mg/dL) | 291.18 (55.50) |
| Lag time (min) | 7.08 (1.55) |
| ETP (nM*min) | 1077.16 (354.72) |
| Peak height (nM) | 79.49 (32.95) |
| Time‐to‐peak (min) | 14.91 (2.05) |
| Velocity (nM/min) | 9.42 (6.70 ‐ 13.27) |
Results are based on analyses weighted toward the BMI distribution of the general population (n = 5341).
Values are reported as mean with standard deviation and median with interquartile ranges or percentages.
The values of menopause, oral contraceptive use, and hormone replacement therapy were calculated in women.
Abbreviations: ETP, endogenous thrombin potential.
3.2. Association between VTE‐associated genetic variants and coagulation factor levels and thrombin generation parameters
Table S1 presents the characteristics of the genetic variants included. Associations between 61 genetic variants and the levels of coagulation factors and thrombin generation parameters are shown in Table S2 with the crude model and Table S3 with the adjusted model. Of 61 genetic variants, 33 were associated with one or more coagulation factor levels and thrombin generation parameters, of which five genetic variants remained after FDR corrections (Tables 2 and 3).
Among five variants, STXBP5 rs7739314, VWF rs216296, and MAP1A rs55707100 were associated with phenotypes with a q‐value of FDR < 0.05. STXBP5 rs7739314 (β = −3.45%, 95% CI: −5.13, −1.77) and VWF rs216296 (β = −6.05%, 95% CI: −8.79, −3.31) were associated with FVIII levels. MAP1A rs55707100 was associated with ETP (β = −120.31 nM*min, 95% CI: −180.38, −60.24), peak height (β = −10.73 nM, 95% CI: −15.77, −5.70), and velocity (β = −15.00%, 95% CI: −22.14, −7.21). Additionally, we observed that MAP1A rs55707100 (β = −5.33%, 95% CI: −8.44, −2.22) and ABCA6 rs77542162 (β = 5.18%, 95% CI: 2.05, 8.31) were associated with FXI levels with a q‐value of FDR < 0.1. SBNO1 rs12824685 was associated with FIX levels (β = −1.97%, 95% CI: −3.13, −0.80) with a q‐value of FDR < 0.1. The direction of these associations aligned with the effect direction observed in associations between these genetic variants and VTE risks.
For 56 genetic variants without TaqMan measures, the predicted misclassification rate ranged between 1.54% and 17.86% with a median of 2.69% (Table S1). Table S4 describes associations between genotyped variants obtained by TaqMan assay and the levels of coagulation factors and thrombin generation parameters showing only minor changes from the main observations.
4. DISCUSSION
We studied the association between 61 recently described VTE‐associated genetic variants, which were functionally not yet well characterized, and the levels of coagulation factors and thrombin generation parameters. We observed that 33 genetic variants were associated with one or more of the coagulation factor levels and thrombin generation parameters. Following multiple testing corrections, we identified five genetic variants with robust associations with one or more of these outcomes.
Intermediate phenotypes for clinical endpoints serve as indicators for understanding how disease‐associated genetic variants influence the risk of disease. The coagulation system represents intermediate phenotypes for VTE risk with evidence that individuals with elevated levels of coagulation factors have an increased risk of VTE. Individual coagulation factors (i.e., FVIII, FXI, and fibrinogen), therefore, have been used to study the mechanism through which genetic variants identified by GWAS for VTE mediate their effects [7, 9]. We replicated all associations between genetic variants and FVIII and FXI identified in previous studies while we observed an association between ARID4A rs11158204 and fibrinogen levels among associations between genetic variants and fibrinogen. However, fibrinogen‐associated genetic variants except for PLCE1 rs2274224 in previous studies were associated with other coagulation factor levels and thrombin generation parameters in the current study. In addition to three coagulation factors, we further examined the association between functionally underexplored VTE‐associated genetic variants and FIX levels and thrombin generation potential which represents global coagulation levels. Following multiple testing corrections, we identified five robust associations between genetic variants (i.e., STXBP5 rs7739314, VWF rs216296, SBNO1 rs12824685, ABCA6 rs77542162, and MAP1A rs55707100) and coagulation factor levels and thrombin generation parameters. Our findings provide insight into the mechanisms by which these genetic variants influence VTE risks, underscoring the role of the coagulation system in VTE pathogenesis.
In the present study, MAP1A rs55707100 was associated with thrombin generation ETP, peak, and velocity as well as FXI levels. MAP1A encodes microtubule‐binding associated protein which plays a role in microtubule assembly. The microtubule is essential for various cellular processes such as cell division and maintenance. The genetic variant was associated with platelet count, triglyceride levels, high‐density lipoprotein cholesterol levels, and C‐reactive protein levels [27, 28, 29]. In addition, our results showed that these genetic variants are associated with a coagulation system which likely explains the genetic association with VTE risks. However, the mechanism underlying the association between MAP1A rs55707100, thrombin generation parameters, and FXI levels remains to be clarified.
We also identified that STXBP5 rs7739314 and VWF rs216296 were associated with FVIII levels. These variants are correlated with STXBP5 rs9390460 and VWF rs11064010, respectively, which were previously identified in a GWAS for FVIII and VWF plasma levels [30]. In the coagulation system, VWF serves as a carrier for FVIII, protecting FVIII from proteolysis. STXBP5 encodes a syntaxin 1 binding protein which plays a role in inhibiting endothelial release of VWF [31]. Experimental evidence showed that decreased expression of STXBP5 by siRNA against STXBP5 in vitro led to increased VWF release [31]. Furthermore, mice with Stxbp5 deficiency showed increased plasma VWF levels [31]. Overall, our findings indicate that STXBP5 rs7739314 and VWF rs216296 influence FVIII levels by regulating VWF, which in turn contributes to VTE risks. Further studies are needed to establish the validity of these assumptions.
Besides, we showed the association between SBNO1 rs12824685 and FIX levels. The protein encoded by SBNO1 is suggested to play a role in the regulation of transcription. Previous studies suggested that SBNO1 is associated with testicular development via the Wnt signaling pathway in mice [32, 33]. Moreover, Takano et al. showed that the knockdown of sbno1 resulted in abnormal brain development in zebrafish [34]. SBNO1 rs12824685 was also identified to be associated with brain morphology via GWAS [35, 36]. Nevertheless, no evidence has been reported to explain the detailed role and function of SBNO1 rs12824685 for FIX levels and coagulation cascades.
Additionally, we observed an association between ABCA6 rs77542162 and FXI levels. ABCA6 encodes a membrane‐associated protein that belongs to the adenosine triphosphate binding cassette A transporter superfamily. Notably, ABCA6 rs77542162 was associated with total and low‐density lipoprotein (LDL) cholesterol [37]. Elevated total and LDL cholesterol levels were associated with increased FXI activity [38] whereas the use of lipid‐lowering drugs resulted in decreased levels of FXI [39, 40, 41]. Proteomics analysis indicated associations between proteins involved in lipid metabolism and FXI activity in patients with VTE at 12 months follow‐up [42]. Lowering FXI activity was associated with improved fibrin clot permeability, which indicated increased susceptibility to clot lysis in coronary artery disease [41]. Decreased FXI levels reduced macrophage accumulation and improved the early‐stage thrombus resolution in mice [43]. Overall, the association between ABCA6 rs77542162 and FXI levels may be mediated through lipid metabolism, which may influence VTE risks. The complex interplay between lipid metabolism, FXI levels, and thrombosis warrants further investigation to better understand the underlying mechanisms and potential clinical implications.
We did not observe a clear association between a large number of newly identified genetic variants associated with VTE and any coagulation factor levels or thrombin generation parameters after multiple testing corrections. The lack of associations in our study might be explained by the difference in statistical power as most GWASs include more participants. Also, these variants may be associated with other intermediate phenotypes of VTE. For example, other genetic variants in GRK5 and SMG6, but not the variants studied here, have been suggested to involve platelet traits, which are also considered intermediate phenotypes associated with VTE risk [44]. Considering the complexity of VTE, further studies should focus on the association between genetic variants and other intermediate phenotypes including blood traits, as well as environmental factors, or epigenetic markers to characterize the biological mechanisms of genetic loci that have no identified functional role associated with coagulation factors and thrombin generation parameters in VTE risks.
This study investigated the association between newly identified VTE‐associated genetic variants and individual coagulation factors and thrombin generation parameters in a large population‐based cohort study. However, there are several limitations. First, we only focused on white ethnicity. Further studies are warranted to replicate the findings in other populations. Secondly, we used imputed genotype data, which may potentially be affected by measurement error. However, when we estimated the misclassification rate by comparing the genotypes obtained from imputation and genotyping by TaqMan assay, we confirmed that 82 to 98% of the classification was estimated correctly across variants. Also, the results only marginally changed when we replicated the analyses with the genotype data obtained from the TaqMan assay.
In conclusion, among functionally underexplored VTE‐associated genetic variants, we identified that five VTE‐associated genetic variants were associated with one or more coagulation factor levels or thrombin generation parameters, shedding light on the underlying mechanisms by which these genetic variants influence the risk of VTE. Future studies should study the role of other VTE‐associated variants, which may lay outside the coagulation system. Further research and integration with clinical data will contribute to elucidating the clinical relevance of these genetic variants and their impact on VTE risk.
AUTHOR CONTRIBUTIONS
Renée de Mutsert and Frits R. Rosendaal conducted the study design and data collection of the NEO study. For the present study, Jihee Han, Ruifang Li‐Gao, and Astrid van Hylckama Vlieg contributed to the conceptualization and study design of the current study. Jihee Han and Ruifang Li‐Gao analyzed the data. Jihee Han wrote the original draft of the manuscript. All authors reviewed the manuscript.
CONFLICT OF INTEREST STATEMENT
Ruifang Li‐Gao is a part‐time consultant for Metabolon Inc. The other authors declare no conflict of interest.
FUNDING INFORMATION
The NEO study is supported by the participating departments, the Division, and the Board of Directors of the Leiden University Medical Centre, and by the Leiden University, Research Profile Area ‘Vascular and Regenerative Medicine’. Coagulation factor analyses were funded by ‘Stichting De Merel’. Stichting De Merel had no role in the study design, data collection, and analysis, decision to publish, or preparation, review, or approval of the manuscript.
ETHICS STATEMENT
The NEO study was approved by the Medical Ethics Committee of the Leiden University Medical Center (LUMC), Leiden, the Netherlands.
PATIENT CONSENT STATEMENT
The author has confirmed patient consent statement is not needed for this submission.
CLINICAL TRIAL REGISTRATION
The authors have confirmed clinical trial registration is not needed for this submission.
Supporting information
Supporting information
ACKNOWLEDGMENTS
We wish to thank all participants of the NEO study. We are grateful to all participating general practitioners for inviting eligible participants. We also express our gratitude to Pat van Beelen and all research nurses for the data collection, Petra Noordijk and her team for the laboratory management, and Ingeborg de Jonge for data management.
Han J, Li‐Gao R, de Mutsert R, Rosendaal FR, van Hylckama Vlieg A. Association between venous thromboembolism‐associated genetic variants, coagulation factor levels, and thrombin generation potential. eJHaem. 2024;5:47–54. 10.1002/jha2.863
DATA AVAILABILITY STATEMENT
The data that support the findings of this study are not openly available due to the privacy of the participants of the NEO study and legal reasons (NEO study participants did not sign informed consent to make their data publicly available). The data will be made available upon request to interested qualified researchers. Data requests should be sent to the NEO Executive Board, which can be contacted via https://www.lumc.nl/org/neo‐studie/contact/.
REFERENCES
- 1. Tang W, Teichert M, Chasman DI, Heit JA, Morange PE, Li G, et al. A genome‐wide association study for venous thromboembolism: the extended cohorts for heart and aging research in genomic epidemiology (CHARGE) consortium. Genet Epidemiol. 2013;37(5):512–521. [DOI] [PMC free article] [PubMed] [Google Scholar]
- 2. Heit JA, Armasu SM, Asmann YW, Cunningham JM, Matsumoto ME, Petterson TM, et al. A genome‐wide association study of venous thromboembolism identifies risk variants in chromosomes 1q24.2 and 9q. J Thromb Haemost. 2012;10(8):1521–1531. [DOI] [PMC free article] [PubMed] [Google Scholar]
- 3. Klarin D, Emdin CA, Natarajan P, Conrad MF, Kathiresan S. Genetic Analysis of Venous Thromboembolism in UK Biobank Identifies the ZFPM2 Locus and Implicates Obesity as a Causal Risk Factor. Circ Cardiovasc Genet. 2017;10(2). [DOI] [PMC free article] [PubMed] [Google Scholar]
- 4. Hinds DA, Buil A, Ziemek D, Martinez‐Perez A, Malik R, Folkersen L, et al. Genome‐wide association analysis of self‐reported events in 6135 individuals and 252 827 controls identifies 8 loci associated with thrombosis. Hum Mol Genet. 2016;25(9):1867–1874. [DOI] [PMC free article] [PubMed] [Google Scholar]
- 5. Germain M, Chasman DI, de Haan H, Tang W, Lindström S, Weng LC, et al. Meta‐analysis of 65,734 individuals identifies TSPAN15 and SLC44A2 as two susceptibility loci for venous thromboembolism. Am J Hum Genet. 2015;96(4):532–542. [DOI] [PMC free article] [PubMed] [Google Scholar]
- 6. Trégouët DA, Heath S, Saut N, Biron‐Andreani C, Schved JF, Pernod G, et al. Common susceptibility alleles are unlikely to contribute as strongly as the FV and ABO loci to VTE risk: results from a GWAS approach. Blood. 2009;113(21):5298–5303. [DOI] [PubMed] [Google Scholar]
- 7. Lindström S, Wang L, Smith EN, Gordon W, van Hylckama Vlieg A, de Andrade M, et al. Genomic and transcriptomic association studies identify 16 novel susceptibility loci for venous thromboembolism. Blood. 2019;134(19):1645–1657. [DOI] [PMC free article] [PubMed] [Google Scholar]
- 8. Klarin D, Busenkell E, Judy R, Lynch J, Levin M, Haessler J, et al. Genome‐wide association analysis of venous thromboembolism identifies new risk loci and genetic overlap with arterial vascular disease. Nat Genet. 2019;51(11):1574–1579. [DOI] [PMC free article] [PubMed] [Google Scholar]
- 9. Thibord F, Klarin D, Brody JA, Chen MH, Levin MG, Chasman DI, et al. Cross‐ancestry investigation of venous thromboembolism genomic predictors. Circulation. 2022;146(16):1225–1242. Available from: 10.1161/circulationaha.122.059675 [DOI] [PMC free article] [PubMed] [Google Scholar]
- 10. Vlieg A, Linden IK, Bertina R, Rosendaal F. High levels of factor IX increase the risk of venous thrombosis. Blood. 2000;95:3678–3682. [PubMed] [Google Scholar]
- 11. Bezemer ID, Arellano AR, Tong CH, Rowland CM, Ireland HA, Bauer KA, et al. F9 Malmö, factor IX and deep vein thrombosis. Haematologica. 2009;94(5):693–699. [DOI] [PMC free article] [PubMed] [Google Scholar]
- 12. Lowe G, Woodward M, Vessey M, Rumley A, Gough P, Daly E. Thrombotic variables and risk of idiopathic venous thromboembolism in women aged 45–64 years. Thromb Haemost. 2000;83(04):530–535. [PubMed] [Google Scholar]
- 13. Dargaud Y, Trzeciak MC, Bordet JC, Ninet J, Negrier C. Use of calibrated automated thrombinography +/‐ thrombomodulin to recognise the prothrombotic phenotype. Thromb Haemost. 2006;96(5):562–567. [PubMed] [Google Scholar]
- 14. van Hylckama Vlieg A, Christiansen S, Luddington R, Cannegieter S, Rosendaal F, Baglin T. Elevated endogenous thrombin potential is associated with an increased risk of a first deep venous thrombosis but not with the risk of recurrence. Br J Haematol. 2007;138(6):769–774. [DOI] [PubMed] [Google Scholar]
- 15. Wang H, Rosendaal FR, Cushman M, van Hylckama Vlieg A. D‐dimer, thrombin generation, and risk of a first venous thrombosis in the elderly. Res Pract Thromb Haemost. 2021;5(5):e12536. [DOI] [PMC free article] [PubMed] [Google Scholar]
- 16. Lutsey PL, Folsom AR, Heckbert SR, Cushman M. Peak thrombin generation and subsequent venous thromboembolism: the Longitudinal Investigation of Thromboembolism Etiology (LITE) study. J Thromb Haemost. 2009;7(10):1639–1648. [DOI] [PMC free article] [PubMed] [Google Scholar]
- 17. de Mutsert R, den Heijer M, Rabelink TJ, Smit JW, Romijn JA, Jukema JW, et al. The Netherlands Epidemiology of Obesity (NEO) study: study design and data collection. Eur J Epidemiol. 2013;28(6):513–523. [DOI] [PubMed] [Google Scholar]
- 18. Blauw LL, Li‐Gao R, Noordam R, de Mutsert R, Trompet S, Berbée JFP, et al. CETP (Cholesteryl Ester Transfer Protein) concentration: a genome‐wide association study followed by Mendelian randomization on coronary artery disease. Circ Genom Precis Med. 2018;11(5):e002034. [DOI] [PubMed] [Google Scholar]
- 19. Clauss A. Rapid physiological coagulation method in determination of fibrinogen. Acta Haematol. 1957;17(4):237–246. [DOI] [PubMed] [Google Scholar]
- 20. van der Toorn FA, de Mutsert R, Lijfering WM, Rosendaal FR, van Hylckama Vlieg A. Glucose metabolism affects coagulation factors: the NEO study. J Thromb Haemost. 2019;17(11):1886–1897. [DOI] [PubMed] [Google Scholar]
- 21. Hemker HC, Giesen P, Al Dieri R, Regnault V, De Smedt E, Wagenvoord R, et al. Calibrated automated thrombin generation measurement in clotting plasma. Pathophysiol Haemost Thromb. 2003;33(1):4–15. [DOI] [PubMed] [Google Scholar]
- 22. Yuan L, Han J, van der Velden AI, Vink H, de Mutsert R, Rosendaal FR, et al. Sex‐specific association between microvascular health and coagulation parameters: the Netherlands Epidemiology of Obesity study. J Thromb Haemost. 2023;21(9):2585–2595. [DOI] [PubMed] [Google Scholar]
- 23. Mv V. Hoeveel mensen hebben overgewicht? 2013. https://www.volksgezondheidenzorg.info/onderwerp/overgewicht/cijfers‐context/huidige‐situatie
- 24. Korn EL, Graubard BI. Epidemiologic studies utilizing surveys: accounting for the sampling design. Am J Public Health. 1991;81(9):1166–1173. [DOI] [PMC free article] [PubMed] [Google Scholar]
- 25. Dekkers I, De Mutsert R, De Vries A, Rosendaal F, Cannegieter S, Jukema J, et al. Determinants of impaired renal and vascular function are associated with elevated levels of procoagulant factors in the general population. J Thromb Haemost. 2018;16(3):519–528. [DOI] [PubMed] [Google Scholar]
- 26. Lumley T. Analysis of complex survey samples. J Stat Softw. 2004;9:1–19. [Google Scholar]
- 27. Astle WJ, Elding H, Jiang T, Allen D, Ruklisa D, Mann AL, et al. The allelic landscape of human blood cell trait variation and links to common complex disease. Cell. 2016;167(5):1415–1429.e19. [DOI] [PMC free article] [PubMed] [Google Scholar]
- 28. Hoffmann TJ, Theusch E, Haldar T, Ranatunga DK, Jorgenson E, Medina MW, et al. A large electronic‐health‐record‐based genome‐wide study of serum lipids. Nat Genet. 2018;50(3):401–413. [DOI] [PMC free article] [PubMed] [Google Scholar]
- 29. Said S, Pazoki R, Karhunen V, Võsa U, Ligthart S, Bodinier B, et al. Genetic analysis of over half a million people characterises C‐reactive protein loci. Nat Commun. 2022;13(1):2198. [DOI] [PMC free article] [PubMed] [Google Scholar]
- 30. Sabater‐Lleal M, Huffman JE, de Vries PS, Marten J, Mastrangelo MA, Song C, et al. Genome‐wide association transethnic meta‐analyses identifies novel associations regulating coagulation Factor VIII and von Willebrand factor plasma levels. Circulation. 2019;139(5):620–635. [DOI] [PMC free article] [PubMed] [Google Scholar]
- 31. Zhu Q, Yamakuchi M, Ture S, de la Luz Garcia‐Hernandez M, Ko KA, Modjeski KL, et al. Syntaxin‐binding protein STXBP5 inhibits endothelial exocytosis and promotes platelet secretion. J Clin Invest. 2014;124(10):4503–4516. [DOI] [PMC free article] [PubMed] [Google Scholar]
- 32. Shen C, Yu J, Zhang X, Liu CC, Guo YS, Zhu JW, et al. Strawberry Notch 1 (SBNO1) promotes proliferation of spermatogonial stem cells via the noncanonical Wnt pathway in mice. Asian J Androl. 2019;21(4):345–350. [DOI] [PMC free article] [PubMed] [Google Scholar]
- 33. Zheng B, Zhou Q, Guo Y, Shao B, Zhou T, Wang L, et al. Establishment of a proteomic profile associated with gonocyte and spermatogonial stem cell maturation and differentiation in neonatal mice. Proteomics. 2014;14(2‐3):274–285. [DOI] [PubMed] [Google Scholar]
- 34. Takano A, Zochi R, Hibi M, Terashima T, Katsuyama Y. Function of strawberry notch family genes in the zebrafish brain development. Kobe J Med Sci. 2011;56(5):E220–E230. [PubMed] [Google Scholar]
- 35. van der Meer D, Frei O, Kaufmann T, Shadrin AA, Devor A, Smeland OB, et al. Understanding the genetic determinants of the brain with MOSTest. Nat Commun. 2020;11(1):3512. [DOI] [PMC free article] [PubMed] [Google Scholar]
- 36. van der Meer D, Shadrin AA, O'Connell K, Bettella F, Djurovic S, Wolfers T, et al. Boosting schizophrenia genetics by utilizing genetic overlap with brain morphology. Biol Psychiatry. 2022;92(4):291–298. [DOI] [PMC free article] [PubMed] [Google Scholar]
- 37. van Leeuwen EM, Karssen LC, Deelen J, Isaacs A, Medina‐Gomez C, Mbarek H, et al. Genome of The Netherlands population‐specific imputations identify an ABCA6 variant associated with cholesterol levels. Nat Commun. 2015;6:6065. [DOI] [PMC free article] [PubMed] [Google Scholar]
- 38. Kim JA, Kim JE, Song SH, Kim HK. Influence of blood lipids on global coagulation test results. Ann Lab Med. 2015;35(1):15–21. [DOI] [PMC free article] [PubMed] [Google Scholar]
- 39. Bordbar M, de Mutsert R, Cevval M, Rosendaal FR, Jukema JW, Lijfering WM. Differential effect of statin use on coagulation markers: an active comparative analysis in the NEO study. Thrombosis Journal. 2021;19(1):45. [DOI] [PMC free article] [PubMed] [Google Scholar]
- 40. Biedermann JS, Kruip MJHA, van der Meer FJ, Rosendaal FR, Leebeek FWG, Cannegieter SC, et al. Rosuvastatin use improves measures of coagulation in patients with venous thrombosis. Eur Heart J. 2018;39(19):1740–1747. [DOI] [PubMed] [Google Scholar]
- 41. Stępień K, Siudut J, Konieczyńska M, Nowak K, Zalewski J, Undas A. Effect of high‐dose statin therapy on coagulation factors: Lowering of factor XI as a modifier of fibrin clot properties in coronary artery disease. Vascul Pharmacol. 2023;149:107153. [DOI] [PubMed] [Google Scholar]
- 42. Pallares Robles A, Ten Cate V, Schulz A, Prochaska JH, Rapp S, Koeck T, et al. Association of FXI activity with thrombo‐inflammation, extracellular matrix, lipid metabolism and apoptosis in venous thrombosis. Sci Rep. 2022;12(1):9761. [DOI] [PMC free article] [PubMed] [Google Scholar]
- 43. Jordan KR, Wyatt CR, Fallon ME, Woltjer R, Neuwelt EA, Cheng Q, et al. Pharmacological reduction of coagulation factor XI reduces macrophage accumulation and accelerates deep vein thrombosis resolution in a mouse model of venous thrombosis. J Thromb Haemost. 2022;20(9):2035–2045. [DOI] [PMC free article] [PubMed] [Google Scholar]
- 44. Astle WJ, Elding H, Jiang T, Allen D, Ruklisa D, Mann AL, et al. The allelic landscape of human blood cell trait variation and links to common complex disease. Cell. 2016;167(5):1415–1429.e19. [DOI] [PMC free article] [PubMed] [Google Scholar]
Associated Data
This section collects any data citations, data availability statements, or supplementary materials included in this article.
Supplementary Materials
Supporting information
Data Availability Statement
The data that support the findings of this study are not openly available due to the privacy of the participants of the NEO study and legal reasons (NEO study participants did not sign informed consent to make their data publicly available). The data will be made available upon request to interested qualified researchers. Data requests should be sent to the NEO Executive Board, which can be contacted via https://www.lumc.nl/org/neo‐studie/contact/.