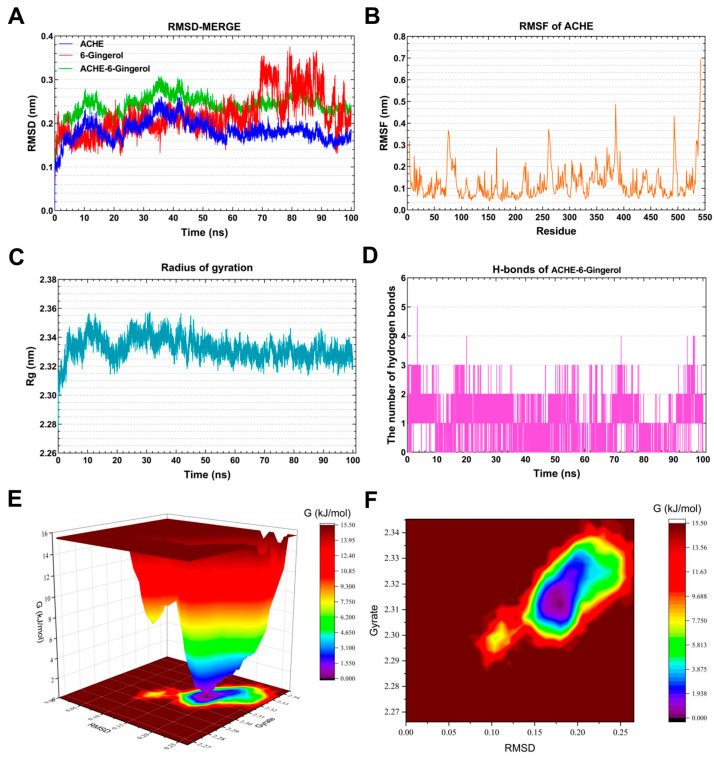
Figure 7.
Molecular dynamics simulation analysis of the ACHE-6-Gingerol complex. (A) RMSD curve of 6-Gingerol (red line), ACHE (blue line), and the ACHE–6-Gingerol complex (green line). (B) RMSF curve of ACHE. (C) Rg curve of ACHE. (D) Hydrogen bonds of the ACHE–6-Gingerol complex. (E,F) Three-dimensional and two-dimensional Gibbs free energy landscape of the ACHE–6-Gingerol complex.

