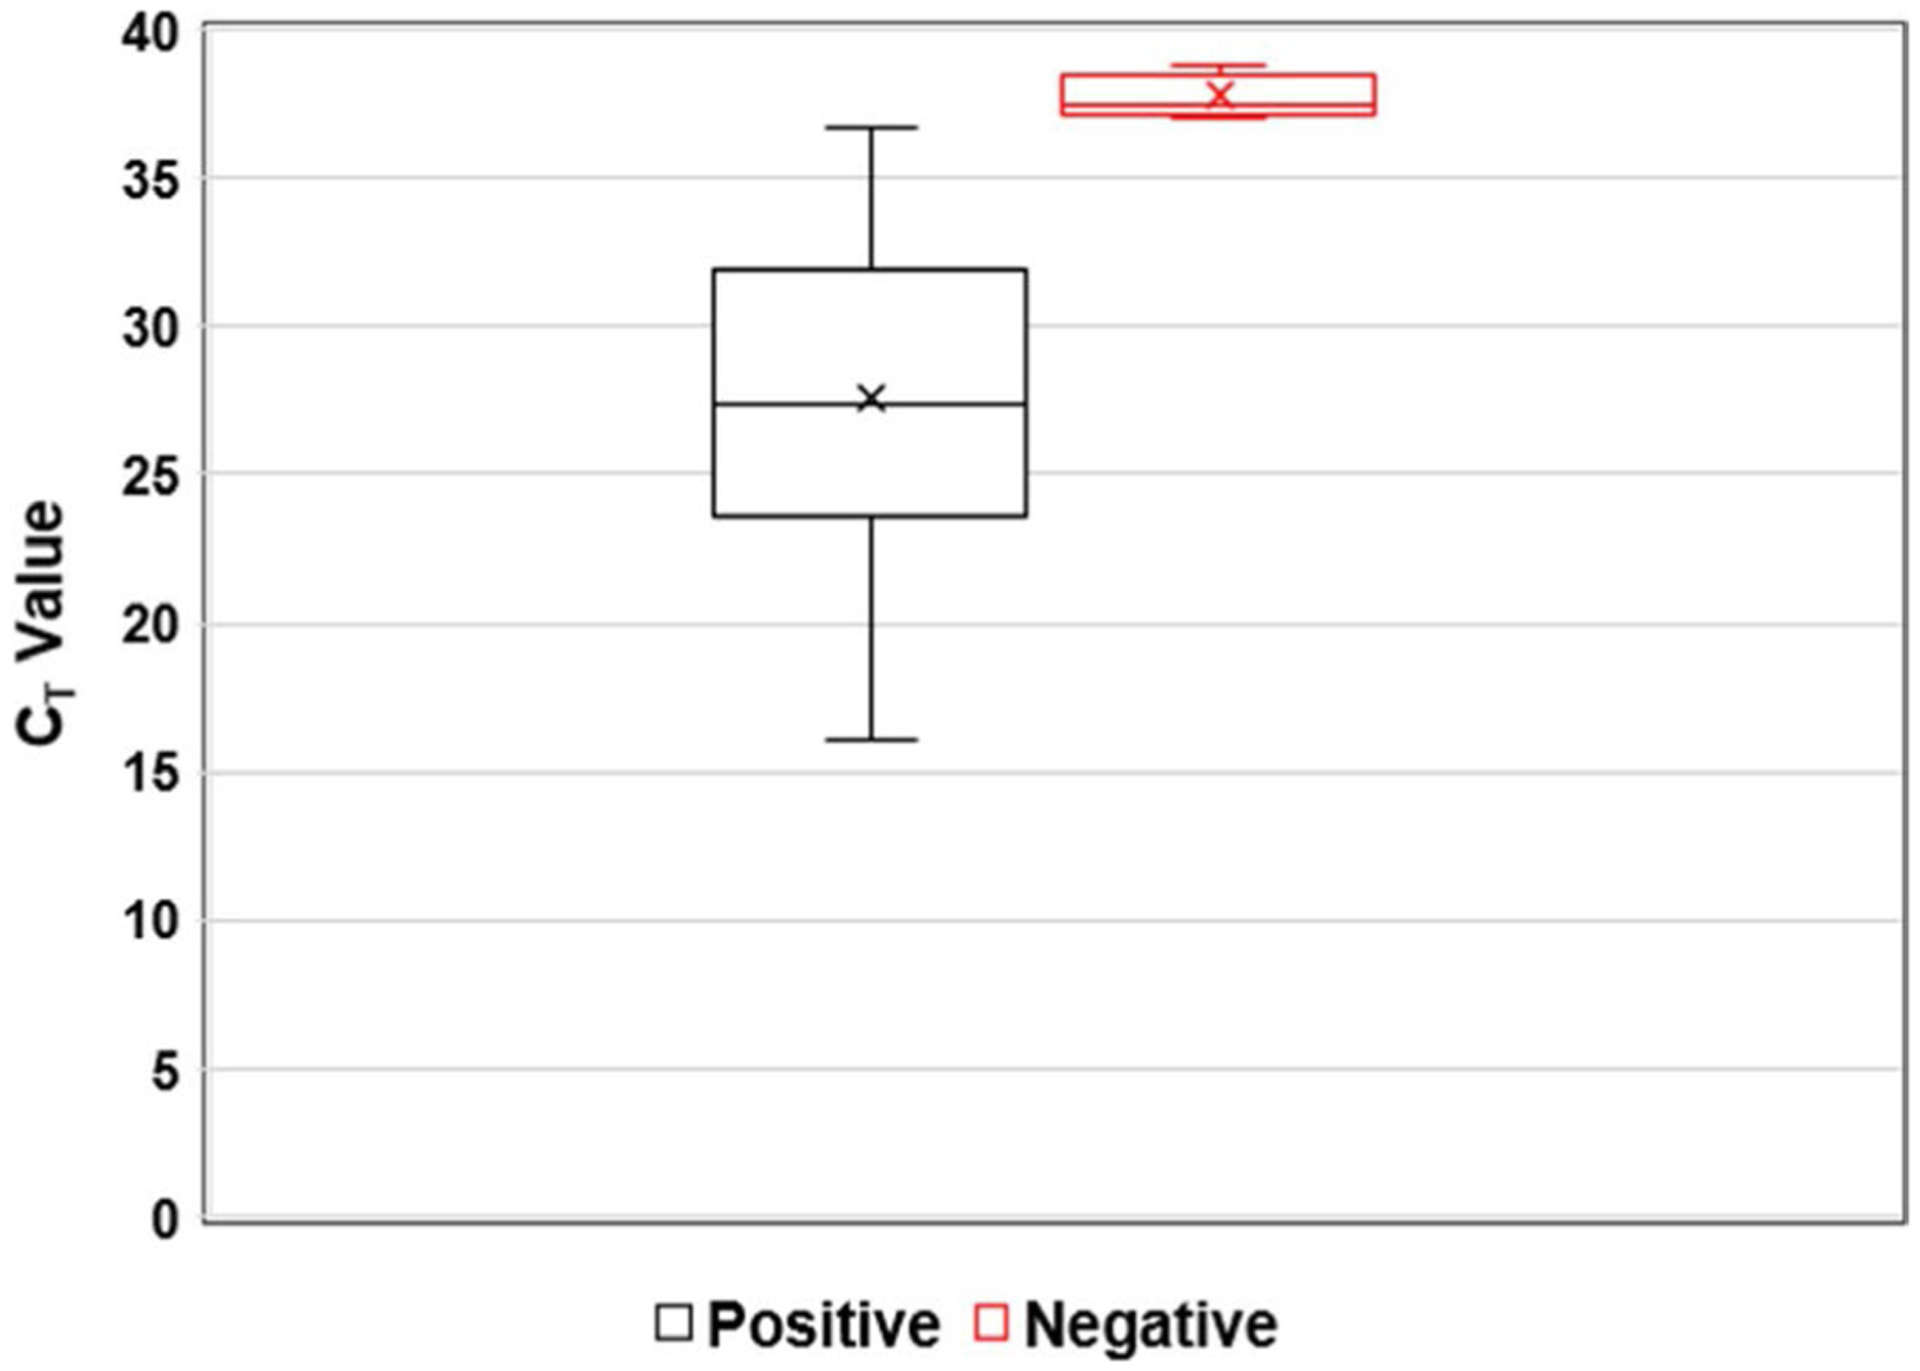
FIGURE 3.

Distribution of CT value: CT value distribution for Candida auris positive and negative samples. A centerline across the boxes indicates the median. Lower and upper boxes indicating the 25th percentile to the 75th percentile. Whiskers caps represent the maximum and minimum CT values
