

Abstract
Background
The spinal cord is a crucial part of the vertebrate CNS, controlling movements and receiving and processing sensory information from the trunk and limbs. However, there is much we do not know about how this essential organ develops. Here, we describe expression of 21 transcription factors and one transcriptional regulator in zebrafish spinal cord.
Results
We analyzed the expression of aurkb, foxb1a, foxb1b, her8a, homeza, ivns1abpb, mybl2b, myt1a, nr2f1b, onecut1, sall1a, sall3a, sall3b, sall4, sox2, sox19b, sp8b, tsc22d1, wdhd1, zfhx3b, znf804a, and znf1032 in wild-type and MIB E3 ubiquitin protein ligase 1 zebrafish embryos. While all of these genes are broadly expressed in spinal cord, they have distinct expression patterns from one another. Some are predominantly expressed in progenitor domains, and others in subsets of post-mitotic cells. Given the conservation of spinal cord development, and the transcription factors and transcriptional regulators that orchestrate it, we expect that these genes will have similar spinal cord expression patterns in other vertebrates, including mammals and humans.
Conclusions
Our data identify 22 different transcriptional regulators that are strong candidates for playing different roles in spinal cord development. For several of these genes, this is the first published description of their spinal cord expression.
Keywords: progenitor, post-mitotic, MIB E3 ubiquitin protein ligase 1 (mib1), Central Nervous System (CNS), blood, brain
Introduction
The spinal cord is a crucial part of the Central Nervous System (CNS), responsible for controlling movements and receiving and processing sensory information from the trunk and the limbs. Even though the spinal cord is relatively simple compared to the brain, there are still fundamental gaps in our knowledge of how it develops and appropriate neuronal and glial spinal cell types are made, maintained and connected into appropriate neuronal circuitry. Transcription factors, proteins that bind DNA and regulate gene expression, play crucial roles in these processes 1–3. In addition, regulatory proteins that modulate the complex organization of chromatin to permit transcription factor activity are also essential for the correct development and differentiation of these cells and tissues. However, we have no idea how many transcription factors and transcriptional regulators are expressed in the spinal cord during development and the temporo-spatial expression patterns of many transcription factors and transcriptional regulators are currently unknown. This significantly impedes our ability to identify the regulatory gene networks that orchestrate spinal cord development. To begin addressing this, as part of a larger gene expression screen to identify transcription factor and transcriptional regulator genes that are expressed in the developing spinal cord 4,5 we identified 22 genes that are expressed broadly in the zebrafish embryonic spinal cord. When we started this study, the expression of many of these genes was unknown. Since then, some of them have been studied by other groups, although often in other tissues. In most cases, the published expression data is still limited, particularly in the spinal cord and for some of the genes that we analyze in this paper, there are currently no other published reports of their expression in zebrafish embryos. For example, expression of znf1032, has, to our knowledge, never been examined in any vertebrate before. There is also no published zebrafish expression data for homeza, ivns1abpb, mybl2b, onecut1, tsc22d1 or wdhd1, although there are some online photographs available from large scale expression screens 6–12.
In this report, we describe the spinal cord expression of all 22 of these genes in zebrafish embryos at key developmental stages, and we also show their expression in the brain and other trunk tissues. In addition, we examine whether these genes are expressed in progenitor and/or post-mitotic spinal cells. We analyze their expression in both whole-mount preparations and lateral cross-sections in wild-type (WT) embryos and MIB E3 ubiquitin protein ligase 1 (mib1, formerly called mind bomb) mutants. mib1 encodes a ubiquitin ligase that is part of the Notch pathway, and in mib1ta52b mutants the vast majority of spinal cord progenitor cells precociously differentiate as early-forming populations of spinal cord post-mitotic neurons, at the expense of later forming neurons and glia 13–17 This enables us to distinguish between progenitor domain expression (which should be lost in mib1 mutants) and post-mitotic expression (which is often, although not always, expanded into additional cells in mib1 mutants). In combination with analysing WT trunk cross-sections, this allows us to discriminate between expression in progenitor cells and post-mitotic cells. Interestingly, we find that while all of these genes are broadly expressed in the spinal cord, they have distinct expression patterns from one another. Some are expressed in progenitor cells, others in both progenitor cells and different subsets of post-mitotic cells, and others are predominantly expressed in distinct subtypes of post-mitotic cells. This identification of transcription factor and transcriptional regulator genes with distinct expression patterns in progenitor and/or post-mitotic cells is an essential first step in determining the gene regulatory networks that specify the correct development of spinal cord circuitry and function.
Results
We have performed several different high-throughput gene expression screens to identify transcription factor genes that are expressed in the developing spinal cord e.g. 4,5. In previous studies, we analyzed transcription factors that are expressed by specific types of spinal cord interneurons 4,5,18–23 However, we have also identified a subset of 21 transcription factor genes and 1 transcriptional regulator gene that our initial analyses suggested were broadly expressed in the zebrafish embryonic spinal cord, but are not ubiquitious throughout the embryo. Each of the transcription factor genes encodes a protein containing a verified DNA-binding domain, according to functional classification by InterPro (Table 1; 24). In addition, we analysed expression of the putative transcriptional regulator gene, aurkb - which is involved in chromatin silencing of differentiated post-mitotic mesenchymal stem cells 25. As discussed in the introduction, spinal cord expression of some of these genes has not been reported before, while for most of the others, there are only limited descriptions of their expression in the published literature (see Discussion for more detail).
Table 1. InterPro Identifier Numbers and Domain Names for Transcription Factor and Transcriptional Regulator Proteins Identified in this Study.
Column 1 lists proteins analyzed in this study. Column 2 indicates whether the protein has chromatin-remodelling or DNA-binding activity. Columns 3 and 4 contain the InterPro identifier numbers and protein domain names for the transcription-related functional domains contained within each protein 24 Column 5 provides references for the papers that document the transcriptional activity of these protein domains and/or the proteins themselves.
| Protein Name | Chromatin or DNA-Binding Activity | InterPro Identifier Number | InterPro Protein Domain Name | Reference(s) Describing Transcriptional Activity |
|---|---|---|---|---|
| Aurkb | Chromatin | IPR000719 | Protein kinase domain | 1 |
| Foxb1a | DNA | IPR001766 | Fork head domain | 2 |
| Foxb1b | DNA | IPR001766 | Fork head domain | 2 |
| Her8a | DNA | IPR001598 | Myc-type, basic helix-loop-helix domain | 3 |
| Homeza | DNA | IPR001356 | Homeobox domain | 4 |
| Ivns1abpb | DNA | IPR000210 | BTB/POZ domain | 5–7 |
| Mybl2b | DNA | IPR001005 | SANT/Myb domain | 8,9 |
| Myt1a | DNA | IPR002515 | Zinc finger, C2H2C-type domain | 10–13 |
| Nr2f1b | DNA | IPR001628 | Zinc finger, nuclear hormone receptor-type | 14,15 |
| Onecut1 | DNA | IPR001356 | Homeobox domain | 4 |
| Sall1a | DNA | IPR013087 | Zinc finger C2H2-type domain | 10,16 |
| Sall3a | DNA | IPR013087 | Zinc finger C2H2-type domain | 10,16 |
| Sall3b | DNA | IPR013087 | Zinc finger C2H2-type domain | 10,16 |
| Sall4 | DNA | IPR013087 | Zinc finger C2H2-type domain | 10,16 |
| Sox2 | DNA | IPR009071 | High mobility group box domain | 17 |
| Sox19b | DNA | IPR009071 | High mobility group box domain | 17 |
| Sp8b | DNA | IPR013087 | Zinc finger C2H2-type domain | 10,16 |
| Tsc22d1 | DNA | IPR000580 | TSC22/Bun domain | 18 |
| Wdhd1 | DNA | IPR009071 | High mobility group box domain | 17 |
| Zfhx3b | DNA | IPR001356 | Homeobox domain | 4 |
| Znf804a | DNA | IPR013087 | Zinc finger C2H2-type domain | 10,16 |
| Znf1032 | DNA | IPR013087 | Zinc finger C2H2-type domain | 10,16 |
As these genes may play important roles in spinal cord development, we analyzed their expression in more detail. At 24 hours post fertilization (h), aurkb, foxb1a, foxb1b, her8a, homeza, ivns1abpb, mybl2b, myt1a, nr2f1b, onecut1, sall1a, sall3a, sall3b, sall4, sox2, sox19b, sp8b, tsc22d1, wdhd1, zfhx3b, znf804a, and znf1032 are all expressed throughout the rostro-caudal and dorso-ventral spinal cord (Fig. 1). All of these genes are also broadly expressed throughout the hindbrain (Figs. 1, 2, 3 and 4, for a schematic of anatomical locations see Fig. 1W) and all of them except znf804a and znf1032 (Fig. 1U, V) have distinct, spatially-restricted expression patterns within the fore- and midbrain. In contrast, znf804a and znf1032 are more broadly expressed in these brain regions (Figs. 1 and 3). In addition, aurkb, ivns1abpb, mybl2b, sall4, wdhd1, znf804a, and znf1032 are variably expressed in the blood (located in the dorsal aorta and cardinal vein) beneath the notochord (Fig. 1A, F, G, N, S, U, V, W).
Figure 1. Broad Expression of Transcription Factor and Transcriptional Regulator Genes in Wholemount Zebrafish Embryos at 24 h.

(A-V) Lateral views of wholemount WT zebrafish embryos at 24 h. A minimum of 5 embryos were analysed in detail per gene to determine the representative expression pattern (see Experimental Procedures for further details). (W) Schematic of a lateral view of a 24 h wholemount zebrafish embryo. F = forebrain, M = midbrain, H = hindbrain, V = mid- and hindbrain ventricles, SC = spinal cord, N = notochord, B = blood (black dotted line indicates boundary between dorsal aorta and cardinal vein), Y = yolk and the eye and lens are indicated with concentric blue dotted circles. In all panels, rostral is left and dorsal is up. Transcriptional regulator gene (A) aurkb, and transcription factor genes (B) foxb1a, (C) foxb1b, (D) her8a, (E) homeza, (F) ivns1abpb, (G) mybl2b, (H) myt1a, (I) nr2f1b, (J) onecut1, (K) sall1a, (L) sall3a, (M) sall3b, (N) sall4, (O) sox2 (P), sox19b, (Q) sp8b, (R) tsc22d1, (S) wdhd1, (T) zfhx3b, (U) znf804a, and (V) znf1032 are all broadly expressed throughout the rostro-caudal and dorso-ventral spinal cord and all 22 of these genes are also variably expressed in the brain. (A) aurkb, (F) ivns1abpb, (G) mybl2b, (N) sall4, (S) wdhd1, (U) znf804a, and (V) znf1032 are also variably expressed in the blood beneath the notochord. (N) sall4 in situ hybridization experiments were performed with the molecular crowding reagent Dextran Sulfate (see Experimental Procedures for rationale). All other in situ hybridization experiments in this figure were performed without this reagent. Scale bar: 200 μm.
Figure 2. A Subset of Transcription Factor and Transcriptional Regulator Genes Lose Expression in the Spinal Cord of Zebrafish mib1ta52b Mutant Embryos at 24 h.

(A-Y) Lateral views of (A, C, F, H, K, M, P, R, U, W) head, (B, D, G, I, L, N, Q, S, V, X) spinal cord, and (E, J, O, T, Y) tail in (A, B, F, G, K, L, P, Q, U, V) sibling and (C-E, H-J, M-O, R-T, W-Y) mib1ta52b mutant embryos at 24 h. Rostral, left. Dorsal, up. A minimum of 5 embryos were analysed per gene for each genotype to determine representative expression patterns (see Experimental Procedures). None of the in situ hybridization experiments in this figure were performed with the molecular crowding reagent Dextran Sulfate. Scale bar: (A, C, F, H, K, M, P, R, U, W) 50 μm, (B, D, G, I, L, N, Q, S, V, X) 20 μm, and (E, J, O, T, Y) 25 μm.
Figure 3. A Subset of Transcription Factor Genes Show Reduced Expression in the Spinal Cord of Zebrafish mib1ta52b Mutant Embryos at 24 h.
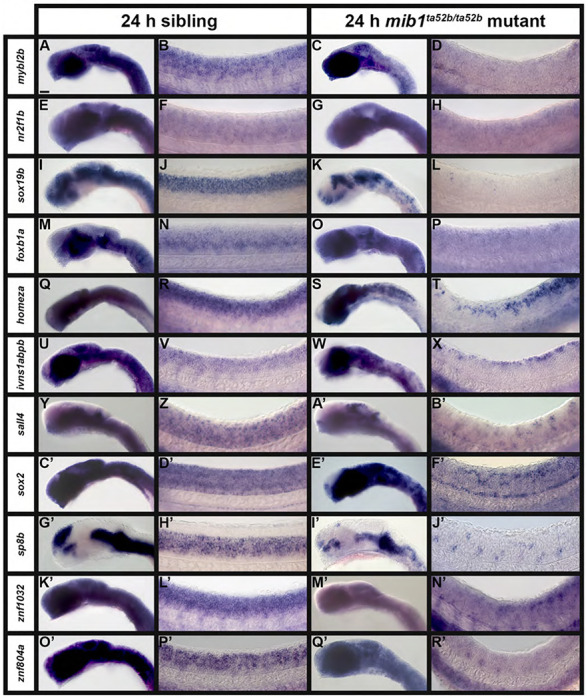
Lateral views of (A, C, E, G, I, K, M, O, Q, S, U, W, Y, A’, C’, E’, G’, I’, K’, M’, O’, Q’) head, and (B, D, F, H, J, L, N, P, R, T, V, X, Z, B’, D’, F’, H’, J’, L’, N’, P’, R’) spinal cord in (A, B, E, F, I, J, M, N, Q, R, U, V, Y, Z, C’, D’, G’, H’, K’, L’, O’, P’) sibling and (C, D, G, H, K, L, O, P, S, T, W, X, A’, B’, E’, F’, I’, J’, M’, N’, Q’, R’) mib1ta52b mutant embryos at 24 h. Rostral, left. Dorsal, up. A minimum of 5 embryos were analysed per gene for each genotype to determine representative expression patterns (see Experimental Procedures). (Y-B’) sall4 in situ hybridization experiments were performed with the molecular crowding reagent Dextran Sulfate (see Experimental Procedures for rationale). All other in situ hybridization experiments in this figure were performed without this reagent. Scale bar: (A, C, E, G, I, K, M, O, Q, S, U, W, Y, A’, C’, E’, G’, I’, K’, M’, O’, Q’) 50 μm, (B, D, F, H, J, L, N, P, R, T, V, X, Z, B’, D’, F’, H’, J’, L’, N’, P’, R’) 20 μm.
Figure 4. A Subset of Transcription Factor Genes Show Expanded Expression in the Spinal Cord of Zebrafish mib1ta52b Mutant Embryos at 24 h.

Lateral views of (A, C, E, G, I, K, M, O, Q, S, U, W) head, and (B, D, F, H, J, L, N, P, R, T, V, X) spinal cord in (A, B, E, F, I, J, M, N, Q, R, U, V) sibling and (C, D, G, H, K, L, O, P, S, T, W, X) mib1ta52b mutant embryos at 24 h. Rostral, left. Dorsal, up. A minimum of 5 embryos were analysed per gene for each genotype to determine representative expression patterns (see Experimental Procedures). In most of these cases, gene expression can be observed in additional spinal cord regions in mib1ta52b mutants compared to WT and sibling embryos, because of the expansion of specific populations of post-mitotic cells into neighboring locations along both dorsal-ventral and medial-lateral axes (see Figure 8). None of the in situ hybridization experiments in this figure were performed with the molecular crowding reagent Dextran Sulfate. Scale bar: (A, C, E, G, I, K, M, O, Q, S, U, W) 50 μm, (B, D, F, H, J, L, N, P, R, T, V, X) 20 μm.
The spinal cord expression of aurkb, foxb1a, homeza, myt1a, onecut1, sall1a, sall3b, sall4, sox2, sox19b, sp8b, zfhx3b, and znf1032 persists at 36 h (Fig. 5A, B, E, H, J, K, M–Q, T, V). In contrast, the spinal cord expression of foxb1b, her8a, ivns1abpb, mybl2b, nr2f1b, sall3a, tsc22d1, wdhd1, and znf804a decreases by this stage, either persisting most strongly in ventral spinal cord foxb1b, her8a, ivns1abpb, mybl2b, sall3a, and znf804a), only very weakly in the spinal cord (nr2f1b and tsc22d1), or only in very few spinal cells (wdhd1) (Fig. 5C, D, F, G, I, L, R, S, U). her8a,sox2 and znf804a are now also expressed in neuromasts, deposited at intervals along the length of the embryo by the migrating lateral line primordium (black arrows, Fig. 5W, X, E’). The variable expression of aurkb, ivns1abpb, mybl2b, sall4, wdhd1, znf804a and znf1032 in the blood (dorsal aorta and cardinal vein immediately beneath the notochord) persists at this stage (Fig. 5Z–F’). Interestingly, wdhd1 is expressed in individual blood cells at this stage (Fig. 5D’).
Figure 5. Transcription Factor and Transcriptional Regulator Gene Expression in Zebrafish Spinal Cord and Mesendodermal Tissues at 36 h.

Lateral (A-F’) views of spinal cord (A-V), neuromasts of the lateral line primordium (W, X, E’), the hypochord (Y), and the blood (Z-F’) in WT zebrafish embryos at 36 h. Rostral, left. Dorsal, up. (G’-J’) Dorsal wholemount views of WT zebrafish embryos at 36 h. Rostral, left. A minimum of 5 embryos were analysed per gene to determine the representative expression pattern (see Experimental Procedures). (A-V) In the spinal cord views, the morphological boundary between the ventral spinal cord and the notochord is visible towards the bottom of the panel and the spinal cord is in focus. In panels (W, X, E’) the focal plane is more lateral, and the somites and lateral line primordium are in focus. Black arrows (W, X, E’) indicate neuromasts, deposited at intervals along the length of the embryo by the migrating lateral line primordium. White arrowheads (Y) indicate the hypochord, at the ventral interface between the notochord and the blood. (Z-F’) Expression in the blood is observed in the dorsal aorta (DA, white arrow) and cardinal vein (CV, white arrow), beneath the notochord. (G’-J’) Expression in the pectoral fin buds is indicated (blue arrows). in situ hybridization experiments with (L) sall3a, (M, I’) sall3b, (N, C’) sall4, and (T, J’) zfhx3b were performed with the molecular crowding reagent Dextran Sulfate (see Experimental Procedures for rationale). All other in situ hybridization experiments in this figure were performed without this reagent. Scale bar: (A-F’) 30 μm, (G’-J’) 130 μm.
While we concentrated predominantly on spinal cord expression of these genes, at 36 h we also, as at 24 h, observed different brain expression patterns (Figure 6, for a schematic of anatomical locations within the brain, see Fig. 6W). myt1a, sox19b, sp8b and zfhx3b have distinct expression patterns in the pallium and subpallium of the telencephalon (dorsal forebrain) (Fig. 6H, P, Q, T, W). In the diencephalon (ventral forebrain), homeza, onecut1, sox2 and wdhd1 are expressed in the habenula, and there is variable expression of nr2f1b, onecut1, sox19b, sp8b, wdhd1 and zfhx3b in the preoptic region, sox19b and myt1a in the thalamic region, and aurkb, foxb1a,foxb1b, myt1a, wdhd1 and znf1032 in the hypothalamus (Fig. 6A, B, C, E, H, I, J, O, P, Q, S, T, V, W). We also observed distinct expression patterns within the hindbrain. For example, aurkb, foxb1a and foxb1b are expressed in both the tectum and tegmentum, at the boundary with the hindbrain (Fig. 6A, B, C, W). In contrast, ivns1abpb, mybl2b, myt1a, nr2f1b, sox2, tsc22d1, wdhd1 and zfhx3b are variably expressed in the tectum (dorsal midbrain) (Fig. 6F, G, H, I, O, R, S, T, W). Within the tegmentum (ventral midbrain), myt1a, nr2f1b, sox2 and zfhx3b are more broadly expressed than they are in the tectum, whilst wdhd1 expression is more spatially defined in the tegmentum compared to the tectum (Fig. 6H, I, O, T, W). We also observed expression of onecut1, sox19b, sp8b and znf1032 in the tegmentum (Fig. 6J, P, Q, R, W). Within the hindbrain (cerebellum), myt1a, nr2f1b, sox2, sox19b, sp8b, zfhx3b and znf1032 are widely expressed throughout the structure. In contrast, her8a, homeza, ivns1abpb, mybl2b and wdhd1 are restricted to expression in the rhombomeres (white arrowheads) (Fig. 6D, E, F, G, H, I, O, P, Q, S, T, V, W). In comparison to the genes described above, we observed extensive expression of sall1a, sall3a, sall3b, sall4, tsc22d1 and znf804a throughout all brain regions (Fig. 6K, L, M, N, R, U, W). Lateral to the brain, we also observed expression of aurkb and tsc22d1 in the otic vesicles (white asterisks, Fig. 6A, R), aurkb, onecut1, sall3b and sox2 in the branchial (gill) mesenchyme adjacent to the hindbrain (black arrows) (Fig. 6A, J, M, O), and onecut1 and sp8b in the olfactory bulbs (blue arrowheads) (Fig. 6J and data not shown).
Figure 6. Transcription Factor and Transcriptional Regulator Gene Expression in Zebrafish Brain at 36 h.

(A-V) Lateral views of heads in WT zebrafish embryos at 36 h. A minimum of 5 embryos were analysed per gene (see Experimental Procedures for further details). (W) Schematic of a lateral view of the head of a 36 h zebrafish embryo. The telencephalon (dorsal forebrain, yellow) consists dorsally and ventrally of the pallium (P) and subpallium (SP) respectively. The diencephalon (ventral forebrain, orange) consists of the habenula (H), the hypothalamus (Hyp), the Thalamic region (Th), the Posterior Tuberculum (PT) and the preoptic region (PO). The midbrain (blue) consists dorsally and ventrally of the tectum (Te) and the tegmentum (Tg) resepectively. The hindbrain (green) consists of the cerebellum (C). V = ventricle in the hindbrain. Black dotted line = midbrain-hindbrain boundary. Blue dotted lines = otic vesicle. Transcriptional regulator gene (A) aurkb, and transcription factor genes (B) foxb1a, (C) foxb1b, (D) her8a, (E) homeza, (F) ivns1abpb, (G) mybl2b, (H) myt1a, (I) nr2f1b, (J) onecut1, (K) sall1a, (L) sall3a, (M) sall3b, (N) sall4, (O) sox2 (P), sox19b, (Q) sp8b, (R) tsc22d1, (S) wdhd1, (T) zfhx3b, (U) znf804a, and (V) znf1032 are all all variably expressed in the brain. (D, E, F, G, S) White arrowheads depict weak expression in the rhomobomeres of the hindbrain. (A, R) aurkb and tsc22d1 are expressed in the otic vesicles (white asterisks). (A, J, M, O) aurkb, onecut1, sall3b and sox2 are expressed in the branchial (gill) mesenchyme (black arrow). (J and data not shown) onecut1 and sp8b are expressed in the olfactory bulbs (blue arrowhead). (N) sall4 in situ hybridization experiments were performed with the molecular crowding reagent Dextran Sulfate (see Experimental Procedures for rationale). All other in situ hybridization experiments in this figure were performed without this reagent. Scale bar: 100 μm.
To determine whether each of these genes is expressed in spinal cord progenitor cells and/or post-mitotic cells we analyzed their expression in spinal cord cross-sections and mib mutants at 24 h. Our WT spinal cord cross-sections show that most of these genes, aurkb, foxb1a, foxb1b, her8a, homeza, ivns1abpb, mybl2b, nr2f1b, sall1a, sall3b, sall4, sox2, sox19b, sp8b, tsc22d1, wdhd1, zfhx3b, znf804a, and znf1032, are expressed in both the medial (progenitor), and lateral (postmitotic) domains of the spinal cord (Fig. 7). These genes are also expressed throughout the dorso-ventral axis of the spinal cord, except for sall3b and sp8b, which are only expressed in the ventral two-thirds of the spinal cord (Fig. 7M, Q), andfoxb1b and wdhd1, which are expressed throughout the dorso-ventral medial (progenitor) domains of the spinal cord, but are only expressed in the ventral two-thirds of the lateral (post-mitotic) domains of the spinal cord (Fig. 7C, S). In contrast, myt1a and onecut1 are only expressed in the lateral (post-mitotic) domains of the spinal cord (Fig. 7H, J), and if sall3a is expressed in the medial spinal cord, that expression is much weaker than the lateral expression (Fig. 7L). myt1a and onecut1 expression extends to all dorso-ventral domains of the spinal cord, but sall3a expression is absent in the dorsal-most spinal cord (Fig. 7H, J, L). Consistent with the whole-mount analyses (Fig. 1), aurkb, ivns1abpb, mybl2b, sall4, wdhd1, znf804a, and znf1032 expression is also visible in the blood immediately beneath the notochord (Fig. 7A, F, G, N, S, U, V, W). In addition, sox2 is also expressed in the hypochord, at the ventral interface between the notochord and the blood (Fig. 7O, for a schematic of anatomical locations see Fig. 7W) and tsc22d1 is expressed in the pronephros, which are tubular structures paired ventrally, lateral to the blood, on each side of the cross-section (Fig. 7R, and see Fig. 7W).
Figure 7. Broad Expression of Transcription Factor and Transcriptional Regulator Genes in Zebrafish Spinal Cord at 24 h.

(A-V) Cross-section views of trunk expression of transcriptional regulator gene (A) aurkb, and transcription factor genes (B) foxb1a, (C) foxb1b, (D) her8a, (E) homeza, (F) ivns1abpb, (G) mybl2b, (H) myt1a, (I) nr2f1b, (J) onecut1, (K) sall1a, (L) sall3a, (M) sall3b, (N) sall4, (O) sox2, (P) sox19b, (Q) sp8b, (R) tsc22d1, (S) wdhd1, (T) zfhx3b, (U) znf804a, and (V) znf1032 in WT zebrafish embryos at 24 h. Dorsal, up. A minimum of 5 embryos were analysed per gene to determine the representative expression pattern (see Experimental Procedures). As indicated in the schematic cross-section (W), the spinal cord (SC), is located above the notochord (N), which is above the hypochord (H, indicated with red arrow), dorsal aorta (DA), and the cardinal vein (CV). The somites (S) can be seen on both sides of these tissues and the pronephros tubes (P, indicated with red arrows) are ventral, either side of the cardinal vein. Within the spinal cord, the dotted line indicates the midline, the small oval indicates the central canal and the small black triangles indicate the roof plate and floor plate. (N) sall4 in situ hybridization experiments were performed with the molecular crowding reagent Dextran Sulfate (see Experimental Procedures for rationale). All other in situ hybridization experiments in this figure were performed without this reagent. Scale bar: 30 μm.
To further confirm whether these genes are expressed in progenitor cells or post-mitotic cells, we also examined their expression in 24 h mib1ta52b mutants. As described in the introduction, the vast majority of spinal cord progenitor cells precociously differentiate as early-forming populations of post-mitotic neurons in these mutants, at the expense of later forming neurons and glia 13–17. Therefore, spinal cord progenitor domain expression is lost, and post-mitotic expression is usually expanded to additional cells, in these mutants (e.g. see Fig. 8A–D).
Figure 8. Expression of a Subset of Transcription Factor Genes is Either Lost in Progenitor Domains and/or Expanded in Post-Mitotic Domains in the Spinal Cord of Zebrafish mib1ta52b Mutant Embryos at 24 h.

(A-L) Cross-section views of trunk expression of transcription factor genes (A, B) dbx2 (expressed in a spinal cord progenitor domain), (C-D) elavl3 (expressed by all spinal cord post-mitotic cells), (E) homeza, (F) ivns1abpb, (G) myt1a, (H) onecut1, (I) sall1a, (J) sall3a, (K) sall3b, and (L) tsc22d1 in (A, C) sibling and (B, D, E, F, G, H, I, J, K, L) mib1ta52b mutant embryos at 24 h. Dorsal, up. A minimum of 5 embryos were analysed per gene per genotype to determine representative expression patterns (see Experimental Procedures). For schematic, please see Fig. 7W. The expression patterns of homeza, ivns1abpb, myt1a, onecut1, sall1a, sall3a, sall3b and tsc22d1 in sibling spinal cords at 24 h (data not shown) is identical to that in 24 h WT embryos shown in Fig. 7. None of the in situ hybridization experiments in this figure were performed with the molecular crowding reagent Dextran Sulfate. Scale bar: 30 μm.
mib1ta52b mutant embryos and their siblings were processed and stained identically and we analyzed at least 5 embryos per gene per genotype (see Experimental Procedures). We found that expression of five of the genes, aurkb, foxb1b, her8a, wdhd1 and zfhx3b, is lost from the spinal cord in all but the very caudal tail in mib1ta52b mutants (Fig. 2), suggesting that these genes are all expressed in spinal cord progenitor cells. Interestingly though, brain expression of these genes is largely unchanged in these mutants, with the exception that her8a expression is slightly less intense, and zfhx3b expression is slightly expanded in the telencephalon (Fig. 2M, W). aurkb and wdhd expression in the blood is also unaffected (Fig. 2E, T).
Eleven other genes also lose a lot of their normal spinal cord expression in mib1ta52b mutants, but in contrast to the five genes discussed above, they are still expressed in distinct subsets of spinal cord cells (Fig. 3). Expression of mybl2b, nr2f1b, sox19b, and foxb1a is lost in all but a few dorsal spinal cord cells, whereas expression of homeza and ivns1abpb persists in more cells but only in dorso-caudal spinal cord (Fig. 3D, H, L, P, T, X). In contrast, small clusters of cells in both dorsal and ventral spinal cord still express sall4, sox2, sp8b, and znf1032, whereas znf804a is only expressed in small clusters of ventral spinal cord cells (Fig. 3B’, F’, J’, N’, R’). These data suggest that these genes are expressed broadly in spinal cord progenitor cells, and also in a small number of post-mitotic spinal cord cells. Interestingly, and in contrast to the five genes discussed above (Fig. 2), all eleven of these genes also have a dramatic reduction in hindbrain expression in mib1ta52b mutants. However, consistent with the five genes discussed above, their expression in the fore- and midbrain regions is largely unchanged in mib1ta52b mutants, with the exception of sall4, which is expanded into a slightly larger territory of the dorsal midbrain, and sox2 and sp8b, which are almost lost in the dorsal forebrain (Fig. 3A’, E’, I’). Expression of mybl2b, ivns1abpb, sall4, znf1032, and znf804a in the blood is unaffected in mib1ta52b mutants (Fig. 3D, X, B’, N’, R’).
Unlike the 16 genes discussed above, expression of the remaining six genes, myt1a, onecut1, sall1a, sall3a, sall3b, and tsc22d1, persists and is expanded into additional cells in the spinal cord of mib1ta52b mutant embryos (Fig. 4). This suggests that these genes are expressed by post-mitotic spinal cord cells. myt1a, onecut1, sall1a, and sall3a expression is also expanded to include additional cells throughout the brain in mib1ta52b mutants, including the hindbrain (Fig. 4C, G, K, O). In contrast, sall3b and tsc22d1 expression is only expanded into additional cells in the hindbrain and largely unchanged elsewhere in the brain (Fig. 4S, W).
We also performed cross-sectional analyses for some of the genes that still had spinal cord expression in mib1ta52b mutants (Fig. 8). As a comparison, we first analyzed the expression of a known spinal cord progenitor domain marker, dbx2, and post-mitotic marker, elavl3, in spinal cord cross-sections (Fig. 8A–D). In WT zebrafish embryos, dbx2 is expressed in the spinal cord progenitor domains pd5, pd6, p0 and p1 at 24 h 26,27. Our cross-sections show that this progenitor domain expression occupies a medial mid-dorsoventral position in the spinal cord of sibling embryos but is lost completely in the spinal cord of mib1ta52b mutants (Fig. 8A, B). In contrast, elavl3 is expressed by all post-mitotic neurons in the zebrafish spinal cord 28–30. In sibling embryo cross sections, elavl3 is expressed by post-mitotic cells in the lateral spinal cord. It is not expressed by progenitor cells in the medial spinal cord. In mib1ta52b mutant cross-sections, elavl3 expression persists laterally but also expands medially to include every cell in the spinal cord (Fig. 8C, D), consistent with spinal progenitor cells precociously differentiating and becoming post-mitotic in these mutants.
The spinal cord expression of homeza and ivns1abpb in mib1ta52b mutants appears, in lateral view, to be in specific post-mitotic dorsal spinal cord domains. To further confirm this we analyzed spinal cord cross sections for these two genes. Consistent with the lateral views, the only remaining expression of homeza and ivns1abpb is in the very dorsal spinal cord, where it extends across the medio-lateral axis, as we would expect for a specific population of post-mitotic cells (Fig. 8E, F). This is in contrast to the expression of these genes in WT and sibling embryos, where they are expressed in both medial progenitor, and lateral post-mitotic cells along most of the dorsoventral axis of the spinal cord (Fig. 7E, F and data not shown). This suggests that all progenitor domain expression of these genes has been lost and that post-mitotic expression only persists in the dorsal spinal cord. We also performed cross-sectional analyzes for some of the genes that, from the lateral views, appear to be expressed in post-mitotic cells throughout the dorsal-ventral axis of the spinal cord in mib1ta52b mutants (Fig. 7). As predicted from the elavl3 results, for each of these genes, we see expression throughout most of the spinal cord, both medially and laterally (Fig. 8 G–L), although, consistent with the lateral view (Fig. 4P), the expression for sall3a (Fig. 8J) is less extensive than that of the other genes.
Discussion and Conclusions
In this paper, while we, for completeness, include some expression data for other tissues, we primarily describe the expression of 21 different transcription factor genes and 1 transcriptional regulator gene in the zebrafish spinal cord. Given the high conservation of spinal cord development and transcription factor expression in vertebrates 31,32, these data are relevant not only to zebrafish development, but also to other vertebrates, including mammals and humans. All of these genes have broad, but not ubiquitious, expression patterns in the spinal cord. This suggests that they have specific functions in particular subsets of spinal cells, rather than general house-keeping roles in all cells. In order to hypothesize about the possible functions of these genes, we first need to know whether they are expressed in progenitor and/or post-mitotic cells in the spinal cord. At the stages that we examined, in WT embryos, spinal cord progenitor cells are located medially and as cells become post-mitotic, they move laterally. In contrast, spinal cord progenitor domain expression is lost (e.g. dbx2, Fig. 8A, B) and post-mitotic expression (e.g. elavl3, Fig. 8C, D) is usually expanded into additional cells in mib1ta52b mutants Based on our cross-sectional analyses and the dramatic reduction of their spinal cord expression in mib1ta52b mutants, we conclude that aurkb, foxb1b, her8a, wdhd1, and zfhx3b are all expressed in spinal cord progenitor cells (Figs. 2 and 7). mybl2b, nr2f1b, sox19b, foxb1a, homeza, ivns1abpb, sall4, sox2, sp8b, znf1032 and znf804a are also predominantly expressed in progenitor cells, but mybl2b, nr2f1b, sox19b, foxb1a, homeza and ivns1abpb are also expressed in some dorsal post-mitotic cells, whereas sall4, sox2, sp8b, and znf1032 are expressed in some post-mitotic cells in both the dorsal and ventral spinal cord and znf804a is expressed in only some ventral spinal cord post-mitotic cells (Figs. 3 and 7). In contrast, myt1a, onecut1, sall1a, sall3a, sall3b, and tsc22d1 are predominantly expressed by different subsets of post-mitotic spinal cord cells, although our cross-sectional analyses suggest that sall1a, sall3b and tsc22d1 are also expressed, at variable extents, in spinal cord progenitor cells (Figs. 4 and 7).
This is the first detailed description of spinal cord expression for most of these genes, in any vertebrate. The exceptions are her8a 33,34, sall1a 35, sall3a 35, sox2 36–39, sox19b 37,40–42 and sp8b 43,44 There is also some limited spinal expression data at 24 h for aurkb 45,46 supplementary data, foxb1b 47,48, nr2f1b 49 supplementary data, sall4 50, zfhx3b 51, as well as at stages earlier than those we examine in this paper for foxb1a 47, foxb1b 52, myt1a 53 and sall1a 35. Finally, there are some data at www.ZFIN.org or https://ibcs-bip-web1.ibcs.kit.edu/ffdb/ from large scale zebrafish expression screens, that show spinal cord expression of aurkb, foxb1a, foxb1b, her8a, homeza, ivns1abpb, mybl2b, nr2f1b, onecut1, sall1a, sall3b, sall4, sox2, sox19b, sp8b, tsc22d1, wdhd1 and zfhx3b 6–11. For homeza, ivns1abpb, mybl2b, onecut1, tsc22d1, and wdhd1, these online database photos are the only spinal cord expression data that we are aware of, outside this paper. To our knowledge, there is no other expression data, in any tissue, in any vertebrate, for znf1032 and no spinal cord expression data in any vertebrate for znf804a, not even in online databases of large-scale expression screens.
For all but one of the genes where there is some additional spinal cord expression data, our results are consistent with these other reports. The one possible exception is sall3b, where a photo from a large scale expression screen shows unrestricted expression, although no lateral views are provided so it is possible that this experiment just had higher levels of background expression than our data 7. However, for several genes, the data from the other sources shows weaker / less apparent spinal cord expression than our results and / or does not show spinal cord expression at stages older than 24 h. This is probably because many of these studies were not concentrating specifically on the spinal cord and, therefore, developed their in situ hybridization staining reactions to a level more appropriate for examining expression in other tissues. Spinal cord expression is often weaker than, for example, brain expression, particularly at later stages 22,23.
Notably, even in cases where some expression in the spinal cord has previously been shown, with the exception of sall1a 35, sall3a 35, sox2 39,54 and sp8b 44 there are no cross-sectional analyses of spinal expression and, with the exception of her8a 55, there is no analysis of spinal cord expression in mib1 mutants, which means that it is often not clear whether the reported spinal cord expression is in progenitor and / or post-mitotic cells. This is a crucial piece of information for considering the functional roles of these genes in the spinal cord. In this paper, we have analyzed these aspects of expression for all 22 genes.
Interestingly, as described above, we find that while all of the genes that we examined are broadly expressed in the spinal cord, most of them have distinct expression patterns from one another. This suggests that they have different, specific functions in the spinal cord. However, for most of these genes, there is currently no data to suggest what their function(s) may be in the spinal cord. The exceptions are aurkb, which may be important for axonal outgrowth of spinal motor neurons 56, her8a, which is important for Notch signaling and, hence, neurogenesis e.g. 34,55,57, onecut1, which data from mouse and chick suggest may be important for motoneuron and V1 interneuron (Renshaw cell) development 58–60, sox2, which is required for correct differentiation of spinal motoneurons and oligodendrocytes 39,61,62 and sp8b, which is required for correct specification of the pMN/p3 progenitor domain boundary and hence the correct development of the cells that develop from these domains 44,63. Interestingly, at earlier stages of spinal cord development, sall4 and sp8b, might belong to a common gene regulatory network as sall4 is thought to regulate pou5f3 expression, which in turn regulates hoxb1a/b expression in the posterior neurectoderm that forms the spinal cord, and hoxb1a/b over-expression can induce expression of sp8b 64–67. Further eludidation of these functions and the roles of the other genes in spinal cord development await further studies.
In conclusion, this study identifies 21 transcription factor genes and 1 transcriptional regulator gene with specific spinal cord expression patterns, that may have important roles in spinal cord development. In this way, it provides key new knowledge for Developmental Biologists, especially those interested in CNS development, and / or specific transcription factors, regulatory genes, or gene regulatory networks.
Experimental Procedures
Ethics statement
All zebrafish experiments in this research were carried out in accordance with the recommendations and approval of Syracuse University Institutional Animal Care and Use (IACUC) committee.
Zebrafish husbandry and fish lines
Zebrafish (Danio rerio) were maintained on a 14-h light/10-h dark cycle at 28.5°C. Embryos were obtained from natural paired and/or grouped spawnings of WT (AB, TL or AB/TL hybrid) fish, or heterozygous mib1ta52b mutants 14.
in situ hybridization
We fixed embryos in 4% paraformaldehyde / phosphate-buffered saline (PBS) and performed single in situ hybridization experiments as previously described 17,68. For WT experiments, 30 embryos were processed per tube. For mib1ta52b experiments, 30 embryos from an incross of heterozygous mib1ta52b mutant parents were also processed per tube. Mendelian genetics predicts that we would, therefore, have about 7-8 mutant embryos per tube. For the experiments in this paper, we had a minimum of 6, and a maximum of 10 mib1ta52b mutant embryos per tube. Both mutant and sibling embryos were treated identically and stained for the exact same length of time to enable the comparison of expression patterns between genotypes. Since in situ hybridization is not quantitative, when comparing mib mutants and sibling embryos, we concentrated mainly on whether gene expression was expanded into additional cells or lost from specific domains. In some cases, we also saw stronger or weaker staining in the mutants. As the embryos were processed identically, this probably reflects changes in the level of expression, but to be sure of this, more quantitative methods, such as spatial transcriptomics, would need to be used, which are beyond the scope of this study.
For all genes except dbx2, we synthesized in situ RNA riboprobes using the methods described in 18 using the primers and annealing temperatures shown in Table 2. To avoid cross-reactivity, whenever possible, riboprobes were designed against 3’UTR or coding sequence lacking all conserved protein domains in Pfam 69. Primers were designed using Primer3 web version 4.1.0 at https://primer3.ut.ee 70,71 and the following design parameters: optimum primer size: 22 bp (minimum: 20 bp, maximum: 25 bp), optimum annealing temperature: 58.0°C (minimum: 57.0°C, maximum: 60.0°C), and optimum GC content: 50% (minimum: 40%, maximum: 60%). The preferred product size range was 800-1100 bp. This was not always possible, if there was little or no novel coding and/or 3’ UTR sequence available (see Table 2). The PCR conditions were: 98.0°C for 30 seconds, 35 cycles of: 98.0°C for 10 seconds; annealing temperature in Table 2 for 30 seconds and 72.0°C for 30 seconds, followed by a final extension for 5 minutes at 72.0°C. The PCR product was assessed on a 1% TAE gel, before purifying through phenol:chloroform:isoamyl alcohol extraction and precipitation with 0.2 M NaCl and ice-cold ethanol. If non-specific banding was generated in addition to the desired PCR product, the specific product was purified from the agarose gel using the Monarch DNA Gel Extraction Kit (NEB, T1020S). Each reverse primer contains the T3 RNA Polymerase minimal promoter sequence (shown in bold and underlined in Table 2). The template for the dbx2 in situ RNA riboprobe was prepared from plasmid DNA kindly provided by Gribble and colleagues 26. For all RNA riboprobes except dbx2, in situ probe synthesis was performed using 1 μg purified PCR product, T3 RNA Polymerase (11031171001, Roche) and DIG RNA Labeling Mix (11277073910, Roche). To synthesize the dbx2 RNA riboprobe, 1 μg of linearized plasmid DNA was used, together with T7 RNA Polymerase (10881775001, Roche) and DIG RNA Labeling Mix (11277073910, Roche).
Table 2. Gene Names, ZFIN Identifiers, Primer Sequences and PCR Conditions for in situ Hybridization Riboprobe Synthesis.
Column 1 lists genes analyzed in this study. Column 2 provides the unique ZFIN identification number for each gene. Columns 3 and 4 contain the primer sequences and expected product sizes (in base pairs (bp)) respectively, used to generate templates for anti-sense RNA riboprobe synthesis from 27 h WT cDNA. Bold and underlined text in column 3 shows the T3 RNA Polymerase minimal promoter sequence added to the reverse primers. Column 5 indicates the annealing temperature for the primer pairs shown in each row of column 3. For further conditions for riboprobe synthesis, please see Experimental Procedures.
| Gene Name | ZFIN Gene ID | Primer Sequences | PCR Product Size (bp) | Annealing Temperature (°C) |
|---|---|---|---|---|
| aurkb | ZDB-GENE-020419-40 | Forward: CTGGATTAAACAGCCGCCATG | 1082 | 65.0 |
| Reverse: AATTAACCCTCACTAAAGGGACAGAAGAACAGCTATAATACAGTGGAG | ||||
| elavl3 | ZDB-GENE-980526-76 | Forward: GAAGTCCAACCTAACAAACCATGC | 1064 | 65.0 |
| Reverse: AATTAACCCTCACTAAAGGGATCTTAGTCCCCAACCCTCCTATC | ||||
| foxb1a | ZDB-GENE-990616-47 | Forward: CAGACGCTGCCCACTACCTC | 429 | 67.0 |
| Reverse: AATTAACCCTCACTAAAGGGAGGCTCAGAGATTGCGGAGAG | ||||
| foxb1b | ZDB-GENE-990415-77 | Forward: AACAACAAGCAAAACTCCGAATG | 1029 | 63.0 |
| Reverse: AATTAACCCTCACTAAAGGGAGGTAGCCTAAATTCATGACATGC | ||||
| her8a | ZDB-GENE-030131-2376 | Forward: ACCAATGCGTCACTCAGATTTG | 853 | 64.0 |
| Reverse: AATTAACCCTCACTAAAGGGACCATGTGGCATAAGGAACATTGTC | ||||
| homeza | ZDB-GENE-030616-592 | Forward: GGCATAGCCGCTACAAAAAG | 1069 | 62.0 |
| Reverse: AATTAACCCTCACTAAAGGGATCTTGCAGTGGTCCTGTCTG | ||||
| ivns1abpb | ZDB-GENE-030131-6266 | Forward: ATTATGCCCGTTCTGGACTG | 846 | 63.0 |
| Reverse: AATTAACCCTCACTAAAGGGATAAATGGGCTCCACTCGTTC | ||||
| mybl2b | ZDB-GENE-041007-1 | Forward: AAAACCCCGCTCACACAGAAG | 507 | 66.0 |
| Reverse: AATTAACCCTCACTAAAGGGACAGTGGAGAGATAGTTTTGGGTG | ||||
| myt1a | ZDB-GENE-030131-3885 | Forward: GGCTACACCAAAAGCAGCTC | 1065 | 64.0 |
| Reverse: AATTAACCCTCACTAAAGGGAAGCTCTAGGGCAACCTGACA | ||||
| nr2f1b | ZDB-GENE-040426-1438 | Forward: AGCTAAATTTGGGCTGTCAGAC | 1028 | 64.0 |
| Reverse: AATTAACCCTCACTAAAGGGAGCCCCAAATAATCAACCTGCAG | ||||
| onecut1 | ZDB-GENE-040426-1469 | Forward: GTGGACACTGCTCCGCTATATC | 856 | 65.0 |
| Reverse: AATTAACCCTCACTAAAGGGAGGAACGGAGGAGTGGTTCTG | ||||
| sall1a | ZDB-GENE-020228-2 | Forward: CTCTTTAACTGGCACACACACATG | 1041 | 65.0 |
| Reverse: AATTAACCCTCACTAAAGGGAGAGAAACTGGGCCCTAAAAGATC | ||||
| sall3a | ZDB-GENE-020228-4 | Forward: CGGACATCCCTTCTCCAGATTC | 1026 | 65.0 |
| Reverse: AATTAACCCTCACTAAAGGGAATTCCTGTGCTACATCCAGAAC | ||||
| sall3b | ZDB GENE-030131-9140 | Forward: CAGTGAAATCAACTCCGAGCTTG | 957 | 64.0 |
| Reverse: AATTAACCCTCACTAAAGGGAGGCTTGCTGTCAAATATGGAGAC | ||||
| sall4 | ZDB GENE-060328-2 | Forward: CTCCGCTCTATGACCCTCAG | 1189 | 64.0 |
| Reverse: AATTAACCCTCACTAAAGGGAGTGCAAAGTGTCTGGCGATA | ||||
| sox2 | ZDB-GENE-030909-1 | Forward: CCCACCTACAGCATGTCCTATTC | 970 | 65.0 |
| Reverse: AATTAACCCTCACTAAAGGGATCTAACAGATGAAGAGTGGGAGAC | ||||
| sox19b | ZDB-GENE-010111-1 | Forward: TTAAACCAGAACCCCTGTCG | 1112 | 62.0 |
| Reverse: AATTAACCCTCACTAAAGGGACTGACAGCGAAGATCAGTGC | ||||
| sp8b | ZDB-GENE-030131-3654 | Forward: CGACGTGTAACAAAATCGGGAG | 683 | 64.0 |
| Reverse: AATTAACCCTCACTAAAGGGAAGACGAGAGAACCGGTTTGAATC | ||||
| tsc22d1 | ZDB-GENE-030131-7785 | Forward: GACCTTGGAGTTTCTTTGTGCTG | 347 | 65.0 |
| Reverse: AATTAACCCTCACTAAAGGGATTCACCAGATCCATGGCTTGTTC | ||||
| wdhd1 | ZDB-GENE-030131-1665 | Forward: TTATGGTCACTCTGAAGGCCAC | 748 | 65.0 |
| Reverse: AATTAACCCTCACTAAAGGGAATCCCAAATCAGCAGGTTTCCTC | ||||
| zfhx3b | ZDB-GENE-030131-7577 | Forward: AGCCCATCCTCATGTGTTTC | 1197 | 63.0 |
| Reverse: AATTAACCCTCACTAAAGGGAGGTTCTGGGTGCATTCACTT | ||||
| znf804a | ZDB-GENE-070912-632 | Forward: TCATGCAAGCAAGAGAGTGG | 1172 | 63.0 |
| Reverse: AATTAACCCTCACTAAAGGGACAGTCCTCTGCAGGGCTAAC | ||||
| znf1032 | ZDB-GENE-080305-4 | Forward: TATCGTGGTCCCGTAATCTACAC | 366 | 64.0 |
| Reverse: AATTAACCCTCACTAAAGGGATTCTCGTGTGGTGTTTAAGGTG |
Embryos older than 24 h were usually incubated in 0.003% 1-phenyl-2-thiourea (PTU) to prevent pigment formation. For some experiments, we added 5% of Dextran Sulfate to the hybridization buffer. In cases where this was done it is indicated in the relevant figure legend. Dextran sulfate can increase specific staining in in situ hybridization experiments as it facilitates molecular crowding 72,73.
In cases of low riboprobe hybridization efficiency, we exposed embryos to prolonged staining. In some cases, this produced higher background (diffuse, non-specific staining), especially in the hindbrain, where ventricles can sometimes trap anti-sense riboprobes 23.
Imaging and Expression Analysis
Prior to imaging, all embryos for each gene were placed in a small dish of 70% glycerol / 30% sterile water, and examined using a stereo microscope (SMZ1000, Nikon), equipped with a gooseneck LED microscope light. We examined the expression pattern of each gene in each embryo to check if it was reproducible. If we observed variable staining within a genotype (for example, due to microclimates being formed during the in situ hybridization process which can cause differential exposure of the embryos to experimental reagents), we repeated the experiment. Once satisfied that we had reproducible staining, a minium of 5 embryos per gene, for each genotype, were analysed further as described below. mib1ta52b mutant embryos have an obvious morphological phenotype of curled tails and large heads and, in addition, the expression patterns of all of the genes that we examined were clearly changed in these mutants compared to their siblings. Therefore, we could not examine expression patterns blind to genotype.
All embryos were deyolked in 70% glycerol / 30% sterile water using mounting pins. For lateral and dorsal views of the embryo, whole embryos were mounted in 70% glycerol between coverslip sandwiches (24 mm x 60 mm coverslips; VWR, 48393-106), with 2-4 coverslips (22 mm x 22 mm; VWR, 16004-094) on either side of the sample to avoid sample compression. Cross-sections were cut by hand using a razor blade mounted in a 12 cm blade holder (World Precision Instruments, Cat. # 14134). Differential interference contrast (DIC) pictures were taken using an AxioCam MRc5 camera mounted on a Zeiss Axio Imager M1 compound microscope. All images were processed for brightness-contrast and colour balance using Adobe Photoshop software 74 Images of control and mib1ta52b mutant embryos are from the same experiment and they were processed identically. Figures were assembled using Adobe Photoshop 74.
Acknowledgements
We would like to thank Jessica Bouchard and several SU undergraduate fish husbandry workers for help with maintaining zebrafish lines and Richard Dorsky for the dbx2 plasmid. This work was funded by NINDS R21NS073979, NINDS R01 NS077947 and NSF IOS 1755354 to K.E.L.
Grant Sponsors and Numbers:
NSF IOS 1755354, NINDS R21NS073979, NINDS R01 NS077947
Footnotes
Ethics statement: All zebrafish experiments in this research were carried out in accordance with the recommendations and approval of Syracuse University Institutional Animal Care and Use (IACUC) committee.
References
- 1.Alaynick WA, Jessell TM, Pfaff SL. SnapShot: spinal cord development. Cell. Jul 8 2011;146(1):178–178. 10.1016/j.cell.2011.06.038. [DOI] [PMC free article] [PubMed] [Google Scholar]
- 2.Lai HC, Seal RP, Johnson JE. Making sense out of spinal cord somatosensory development. Development. Oct 1 2016;143(19):3434–3448. 10.1242/dev.139592. [DOI] [PMC free article] [PubMed] [Google Scholar]
- 3.Lu DC, Niu T, Alaynick WA. Molecular and cellular development of spinal cord locomotor circuitry. Frontiers in molecular neuroscience. 2015;8:25. 10.3389/fnmol.2015.00025. [DOI] [PMC free article] [PubMed] [Google Scholar]
- 4.England S, Hilinski W, de Jager S, et al. Identifying Transcription Factors expressed by Ventral Spinal Cord Interneurons. ZFIN on-line publication. 2014;http://zfin.org/ZDB-PUB-140822-10. [Google Scholar]
- 5.Hilinski WC, Bostrom JR, England SJ, et al. Lmx1b is required for the glutamatergic fates of a subset of spinal cord neurons. Neural development. 2016;11(1):16. 10.1186/s13064-016-0070-1. [DOI] [PMC free article] [PubMed] [Google Scholar]
- 6.Thisse B, Heyer V, Lux A, et al. Spatial and temporal expression of the zebrafish genome by large-scale in situ hybridization screening. Methods Cell Biol. 2004;77:505–19. 10.1016/s0091-679x(04)77027-2. [DOI] [PubMed] [Google Scholar]
- 7.Thisse B, Thisse C. Fast Release Clones: A High Throughput Expression Analysis ZFIN Direct Data Submission (unpublished) (http://zfinorg) 2004;ZDB-PUB-040907-1.
- 8.Thisse B, Wright GJ, Thisse C. Embryonic and Larval Expression Patterns from a Large Scale Screening for Novel Low Affinity Extracellular Protein Interactions. ZFIN Direct Data Submission (Unpublished) 2008;ZDB-PUB-080227-22. [DOI] [PMC free article] [PubMed]
- 9.Thisse B, Pflumio S, Fürthauer M, et al. Expression of the zebrafish genome during embryogenesis. ZFIN Direct Data Submission (Unpublished) 2001;ZDB-PUB-010810-1.
- 10.Thisse C, Thisse B. High Throughput Expression Analysis of ZF-Models Consortium Clone. ZFIN Direct Data Submission : (Unpublished). 2005;ZDB-PUB-051025-1 [Google Scholar]
- 11.Armant O, Marz M, Schmidt R, et al. Genome-wide, whole mount in situ analysis of transcriptional regulators in zebrafish embryos [Research Support, Non-U.S. Gov’t]. Dev Biol. Aug 15 2013;380(2):351–62. 10.1016/_i.ydbio.2013.05.006. [DOI] [PMC free article] [PubMed] [Google Scholar]
- 12.Diotel N, Rodriguez Viales R, Armant O, et al. Comprehensive expression map of transcription regulators in the adult zebrafish telencephalon reveals distinct neurogenic niches. J Comp Neurol. Jun 1 2015;523(8):1202–21. 10.1002/cne.23733. [DOI] [PMC free article] [PubMed] [Google Scholar]
- 13.Itoh M, Kim C, Palardy G, et al. Mind bomb is a ubiquitin ligase that is essential for efficient activation of Notch signaling by Delta. Dev Cell. 2003;4(1):67–82. [DOI] [PubMed] [Google Scholar]
- 14.Jiang YJ, Brand M, Heisenberg CP, et al. Mutations affecting neurogenesis and brain morphology in the zebrafish, Danio rerio. Development. 1996;123:205–216. [DOI] [PubMed] [Google Scholar]
- 15.Park HC, Appel B. Delta-Notch signaling regulates oligodendrocyte specification. Development. 2003;130:3747–3755. [DOI] [PubMed] [Google Scholar]
- 16.Schier AF, Neuhauss SC, Harvey M, et al. Mutations affecting the development of the embryonic zebrafish brain. Development. 1996;123(165):165–178. [DOI] [PubMed] [Google Scholar]
- 17.Batista MF, Jacobstein J, Lewis KE. Zebrafish V2 cells develop into excitatory CiD and Notch signalling dependent inhibitory VeLD interneurons. Dev Biol. Oct 15 2008;322(2):263–75. [DOI] [PubMed] [Google Scholar]
- 18.England SJ, Rusnock AK, Mujcic A, et al. Molecular analyses of zebrafish V0v spinal interneurons and identification of transcriptional regulators downstream of Evx1 and Evx2 in these cells. Neural development. Nov 28 2023;18(1):8. 10.1186/s13064-023-00176-w. [DOI] [PMC free article] [PubMed] [Google Scholar]
- 19.Andrzejczuk LA, Banerjee S, England SJ, Voufo C, Kamara K, Lewis KE. Tal1, Gata2a, and Gata3 Have Distinct Functions in the Development of V2b and Cerebrospinal Fluid-Contacting KA Spinal Neurons. Frontiers in neuroscience. 2018;12:170. 10.3389/fnins.2018.00170. [DOI] [PMC free article] [PubMed] [Google Scholar]
- 20.Juárez-Morales JL, Schulte CJ, Pezoa SA, et al. Evx1 and Evx2 specify excitatory neurotransmitter fates and suppress inhibitory fates through a Pax2-independent mechanism. Neural development. 2016;11:5. 10.1186/s13064-016-0059-9. [DOI] [PMC free article] [PubMed] [Google Scholar]
- 21.Batista MF, Lewis KE. Pax2/8 act redundantly to specify glycinergic and GABAergic fates of multiple spinal interneurons. Dev Biol. Nov 1 2008;323(1):88–97. [DOI] [PMC free article] [PubMed] [Google Scholar]
- 22.England SJ, Cerda GA, Kowalchuk A, Sorice T, Grieb G, Lewis KE. Hmx3a Has Essential Functions in Zebrafish Spinal Cord, Ear and Lateral Line Development. Genetics. Dec 2020;216(4):1153–1185. 10.1534/genetics.120.303748. [DOI] [PMC free article] [PubMed] [Google Scholar]
- 23.England SJ, Campbell PC, Banerjee S, Swanson AJ, Lewis KE. Identification and Expression Analysis of the Complete Family of Zebrafish pkd Genes. Front Cell Dev Biol. 2017;5:5. 10.3389/fcell.2017.00005. [DOI] [PMC free article] [PubMed] [Google Scholar]
- 24.Paysan-Lafosse T, Blum M, Chuguransky S, et al. InterPro in 2022. Nucleic acids research. Jan 6 2023;51(D1):D418–D427. 10.1093/nar/gkac993. [DOI] [PMC free article] [PubMed] [Google Scholar]
- 25.Sabbattini P, Canzonetta C, Sjoberg M, et al. A novel role for the Aurora B kinase in epigenetic marking of silent chromatin in differentiated postmitotic cells. The EMBO journal. Nov 14 2007;26(22):4657–69. 10.1038/sj.emboj.7601875. [DOI] [PMC free article] [PubMed] [Google Scholar]
- 26.Gribble SL, Nikolaus OB, Dorsky RI. Regulation and function of Dbx genes in the zebrafish spinal cord. Developmental dynamics : an official publication of the American Association of Anatomists. Dec 2007;236(12):3472–83. [DOI] [PMC free article] [PubMed] [Google Scholar]
- 27.Satou C, Kimura Y, Hirata H, Suster ML, Kawakami K, Higashijima S. Transgenic tools to characterize neuronal properties of discrete populations of zebrafish neurons. Development. Sep 2013;140(18):3927–31. 10.1242/dev.099531. [DOI] [PubMed] [Google Scholar]
- 28.Park HC, Kim CH, Bae YK, et al. Analysis of upstream elements in the HuC promoter leads to the establishment of transgenic zebrafish with fluorescent neurons. Dev Biol. Nov 15 2000;227(2):279–93. [DOI] [PubMed] [Google Scholar]
- 29.Park HC, Hong SK, Kim HS, et al. Structural comparison of zebrafish Elav/Hu and their differential expressions during neurogenesis. Neurosci Lett. Jan 28 2000;279(2):81–84. [DOI] [PubMed] [Google Scholar]
- 30.Sato T, Takahoko M, Okamoto H. HuC:Kaede, a useful tool to label neural morphologies in networks in vivo. Genesis. Mar 2006;44(3):136–42. [DOI] [PubMed] [Google Scholar]
- 31.Lewis KE. How do genes regulate simple behaviours? Understanding how different neurons in the vertebrate spinal cord are genetically specified. Philos Trans R Soc Lond B Biol Sci. Jan 29 2006;361(1465):45–66. [DOI] [PMC free article] [PubMed] [Google Scholar]
- 32.Goulding M, Pfaff SL. Development of circuits that generate simple rhythmic behaviors in vertebrates. Current opinion in neurobiology. Feb 2005;15(1):14–20. [DOI] [PubMed] [Google Scholar]
- 33.Chung GW, Edwards AO, Schimmenti LA, Manligas GS, Zhang YH, Ritter R 3rd., Renal-coloboma syndrome: report of a novel PAX2 gene mutation. Am J Ophthalmol. Dec 2001;132(6):910–4. [DOI] [PubMed] [Google Scholar]
- 34.Webb KJ, Coolen M, Gloeckner CJ, et al. The Enhancer of split transcription factor Her8a is a novel dimerisation partner for Her3 that controls anterior hindbrain neurogenesis in zebrafish. BMC developmental biology. May 17 2011;11:27. 10.1186/1471-213X-11-27. [DOI] [PMC free article] [PubMed] [Google Scholar]
- 35.Camp E, Hope R, Kortschak RD, Cox TC, Lardelli M. Expression of three spalt (sal) gene homologues in zebrafish embryos. Development genes and evolution. Feb 2003;213(1):35–43. 10.1007/s00427-002-0284-6. [DOI] [PubMed] [Google Scholar]
- 36.Ouchi Y, Yamamoto J, Iwamoto T. The heterochronic genes lin-28a and lin-28b play an essential and evolutionarily conserved role in early zebrafish development. PloS one. 2014;9(2):e88086. 10.1371/journal.pone.0088086. [DOI] [PMC free article] [PubMed] [Google Scholar]
- 37.Okuda Y, Yoda H, Uchikawa M, et al. Comparative genomic and expression analysis of group B1 sox genes in zebrafish indicates their diversification during vertebrate evolution. Developmental dynamics : an official publication of the American Association of Anatomists. Mar 2006;235(3):811–25. 10.1002/dvdy.20678. [DOI] [PubMed] [Google Scholar]
- 38.Dee CT, Hirst CS, Shih YH, Tripathi VB, Patient RK, Scotting PJ. Sox3 regulates both neural fate and differentiation in the zebrafish ectoderm. Dev Biol. Aug 1 2008;320(1):289–301. 10.1016/j.ydbio.2008.05.542. [DOI] [PubMed] [Google Scholar]
- 39.Gong J, Hu S, Huang Z, et al. The Requirement of Sox2 for the Spinal Cord Motor Neuron Development of Zebrafish. Frontiers in molecular neuroscience. 2020;13:34. 10.3389/fnmol.2020.00034. [DOI] [PMC free article] [PubMed] [Google Scholar]
- 40.Hu S, Wu Z, Yan Y, Li Y. Sox31 is involved in central nervous system anteroposterior regionalization through regulating the organizer activity in zebrafish. Acta biochimica et biophysica Sinica. May 2011;43(5):387–99. 10.1093/abbs/gmr025. [DOI] [PubMed] [Google Scholar]
- 41.Chen YY, Harris MP, Levesque MP, Nusslein-Volhard C, Sonawane M. Heterogeneity across the dorso-ventral axis in zebrafish EVL is regulated by a novel module consisting of sox, snail1a and max genes. Mechanisms of development. Mar-Jun 2012;129(1-4):13–23. 10.1016/j.mod.2012.03.003. [DOI] [PubMed] [Google Scholar]
- 42.Li X, Zhou W, Li X, et al. SOX19b regulates the premature neuronal differentiation of neural stem cells through EZH2-mediated histone methylation in neural tube development of zebrafish. Stem cell research & therapy. Dec 16 2019;10(1):389. 10.1186/s13287-019-1495-3. [DOI] [PMC free article] [PubMed] [Google Scholar]
- 43.Kawakami Y, Esteban CR, Matsui T, Rodriguez-Leon J, Kato S, Izpisua Belmonte JC. Sp8 and Sp9, two closely related buttonhead-like transcription factors, regulate Fgf8 expression and limb outgrowth in vertebrate embryos. Development. Oct 2004;131(19):4763–74. 10.1242/dev.01331. [DOI] [PubMed] [Google Scholar]
- 44.Penberthy WT, Zhao C, Zhang Y, et al. Pur alpha and Sp8 as opposing regulators of neural gata2 expression. Dev Biol. Nov 1 2004;275(1):225–34. 10.1016/j.ydbio.2004.08.007. [DOI] [PubMed] [Google Scholar]
- 45.Zhong H, Xin S, Zhao Y, et al. Genetic approach to evaluate specificity of small molecule drug candidates inhibiting PLK1 using zebrafish. Mol Biosyst. Aug 2010;6(8):1463–8. 10.1039/b919743e. [DOI] [PubMed] [Google Scholar]
- 46.Yabe T, Ge X, Lindeman R, et al. The maternal-effect gene cellular island encodes aurora B kinase and is essential for furrow formation in the early zebrafish embryo. PLoS genetics. Jun 2009;5(6):e1000518. 10.1371/journal.pgen.1000518. [DOI] [PMC free article] [PubMed] [Google Scholar]
- 47.Odenthal J, Nüsslein-Volhard C. fork head domain genes in zebrafish. Dev Genes Evol. 1998;208(5):245–258. [DOI] [PubMed] [Google Scholar]
- 48.Grinblat Y, Gamse J, Patel M, Sive H. Determination of the zebrafish forebrain: induction and patterning. Development. 1998;125:4403–4416. [DOI] [PubMed] [Google Scholar]
- 49.Van Ryswyk L, Simonson L, Eisen JS. The role of inab in axon morphology of an identified zebrafish motoneuron. PloS one 2014;9(2):e88631. 10.1371/journal.pone.0088631. [DOI] [PMC free article] [PubMed] [Google Scholar]
- 50.Jackson R, Braubach OR, Bilkey J, et al. Expression of sall4 in taste buds of zebrafish. Developmental neurobiology. Jul 2013;73(7):543–58. 10.1002/dneu.22079. [DOI] [PubMed] [Google Scholar]
- 51.Fuller TD, Westfall TA, Das T, Dawson DV, Slusarski DC. High-throughput behavioral assay to investigate seizure sensitivity in zebrafish implicates ZFHX3 in epilepsy. Journal of neurogenetics. Mar-Jun 2018;32(2):92–105. 10.1080/01677063.2018.1445247. [DOI] [PMC free article] [PubMed] [Google Scholar]
- 52.Yeo SY, Little MH, Yamada T, et al. Overexpression of a slit homologue impairs convergent extension of the mesoderm and causes cyclopia in embryonic zebrafish. Dev Biol. Feb 1 2001;230(1):1–17. [DOI] [PubMed] [Google Scholar]
- 53.Feng L, Hernandez RE, Waxman JS, Yelon D, Moens CB. Dhrs3a regulates retinoic acid biosynthesis through a feedback inhibition mechanism. Dev Biol. Feb 1 2010;338(1):1–14. 10.1016/j.ydbio.2009.10.029. [DOI] [PMC free article] [PubMed] [Google Scholar]
- 54.Hudish LI, Blasky AJ, Appel B. miR-219 regulates neural precursor differentiation by direct inhibition of apical par polarity proteins. Developmental cell. Nov 25 2013;27(4):387–98. 10.1016/j.devcel.2013.10.015. [DOI] [PMC free article] [PubMed] [Google Scholar]
- 55.Chung PC, Lin WS, Scotting PJ, Hsieh FY, Wu HL, Cheng YC. Zebrafish Her8a is activated by Su(H)-dependent Notch signaling and is essential for the inhibition of neurogenesis. PloS one Apr 26 2011;6(4):e19394. 10.1371/journal.pone.0019394. [DOI] [PMC free article] [PubMed] [Google Scholar]
- 56.Gwee SSL, Radford RAW, Chow S, et al. Aurora kinase B regulates axonal outgrowth and regeneration in the spinal motor neurons of developing zebrafish. Cellular and molecular life sciences : CMLS. Dec 2018;75(23):4269–4285. 10.1007/s00018-018-2780-5. [DOI] [PMC free article] [PubMed] [Google Scholar]
- 57.Cheng YC, Huang YC, Yeh TH, et al. Deltex1 is inhibited by the Notch-Hairy/E(Spl) signaling pathway and induces neuronal and glial differentiation. Neural development. Dec 30 2015;10:28. 10.1186/s13064-015-0055-5. [DOI] [PMC free article] [PubMed] [Google Scholar]
- 58.Radhakrishnan B, Alwin Prem Anand A. Role of miRNA-9 in Brain Development. J Exp Neurosci. 2016;10:101–120. 10.4137/JEN.S32843. [DOI] [PMC free article] [PubMed] [Google Scholar]
- 59.Francius C, Clotman F. Dynamic expression of the Onecut transcription factors HNF-6, OC-2 and OC-3 during spinal motor neuron development. Neuroscience. Jan 13 2010;165(1):116–29. 10.1016/j.neuroscience.2009.09.076. [DOI] [PubMed] [Google Scholar]
- 60.Stam FJ, Hendricks TJ, Zhang J, et al. Renshaw cell interneuron specialization is controlled by a temporally restricted transcription factor program. Development. Jan 2012;139(1):179–90. 10.1242/dev.071134. [DOI] [PMC free article] [PubMed] [Google Scholar]
- 61.Johnson K, Barragan J, Bashiruddin S, et al. Gfap-positive radial glial cells are an essential progenitor population for later-born neurons and glia in the zebrafish spinal cord. Glia. Jul 2016;64(7):1170–89. 10.1002/glia.22990. [DOI] [PMC free article] [PubMed] [Google Scholar]
- 62.Hoffmann SA, Hos D, Kuspert M, et al. Stem cell factor Sox2 and its close relative Sox3 have differentiation functions in oligodendrocytes. Development. Jan 2014;141(1):39–50. 10.1242/dev.098418. [DOI] [PMC free article] [PubMed] [Google Scholar]
- 63.Li X, Liu Z, Qiu M, Yang Z. Sp8 plays a supplementary role to Pax6 in establishing the pMN/p3 domain boundary in the spinal cord. Development. Jul 2014;141(14):2875–84. 10.1242/dev.105387. [DOI] [PubMed] [Google Scholar]
- 64.Dong X, Li J, He L, et al. Zebrafish Znfl1 proteins control the expression of hoxb1b gene in the posterior neuroectoderm by acting upstream of pou5f3 and sall4 genes. The Journal of biological chemistry. Aug 4 2017;292(31):13045–13055. 10.1074/jbc.M117.777094. [DOI] [PMC free article] [PubMed] [Google Scholar]
- 65.van den Akker WM, Durston AJ, Spaink HP. Identification of hoxb1b downstream genes: hoxb1b as a regulatory factor controlling transcriptional networks and cell movement during zebrafish gastrulation. The International journal of developmental biology. 2010;54(1):55–62. 10.1387/ijdb.082678wv. [DOI] [PubMed] [Google Scholar]
- 66.Paik EJ, Mahony S, White RM, et al. A Cdx4-Sall4 regulatory module controls the transition from mesoderm formation to embryonic hematopoiesis. Stem Cell Reports. 2013;1(5):425–36. 10.1016/j.stemcr.2013.10.001. [DOI] [PMC free article] [PubMed] [Google Scholar]
- 67.Young JJ, Kjolby RA, Kong NR, Monica SD, Harland RM. Spalt-like 4 promotes posterior neural fates via repression of pou5f3 family members in Xenopus. Development. Apr 2014;141(8):1683–93. 10.1242/dev.099374. [DOI] [PMC free article] [PubMed] [Google Scholar]
- 68.Concordet JP, Lewis KE, Moore JW, et al. Spatial regulation of a zebrafish patched homologue reflects the roles of sonic hedgehog and protein kinase A in neural tube and somite patterning. Development. 1996;122(9):2835–2846. [DOI] [PubMed] [Google Scholar]
- 69.Punta M, Coggill PC, Eberhardt RY, et al. The Pfam protein families database. Nucleic acids research. Jan 2012;40(Database issue):D290–301. 10.1093/nar/gkr1065. [DOI] [PMC free article] [PubMed] [Google Scholar]
- 70.Untergasser A, Cutcutache I, Koressaar T, et al. Primer3--new capabilities and interfaces. Nucleic acids research. Aug 2012;40(15):e115. 10.1093/nar/gks596. [DOI] [PMC free article] [PubMed] [Google Scholar]
- 71.Koressaar T, Remm M. Enhancements and modifications of primer design program Primer3. Bioinformatics. May 15 2007;23(10):1289–91. 10.1093/bioinformatics/btm091. [DOI] [PubMed] [Google Scholar]
- 72.Lauter G, Soll I, Hauptmann G. Two-color fluorescent in situ hybridization in the embryonic zebrafish brain using differential detection systems. BMC developmental biology. Jul 4 2011;11:43. 10.1186/1471-213X-11-43. [DOI] [PMC free article] [PubMed] [Google Scholar]
- 73.Ku WC, Lau WK, Tseng YT, Tzeng CM, Chiu SK. Dextran sulfate provides a quantitative and quick microarray hybridization reaction. Biochemical and biophysical research communications. Feb 27 2004;315(1):30–7. 10.1016/j.bbrc.2004.01.013. [DOI] [PubMed] [Google Scholar]
- 74.Adobe. Adobe Photoshop Adobe Inc.; 2019. [Google Scholar]