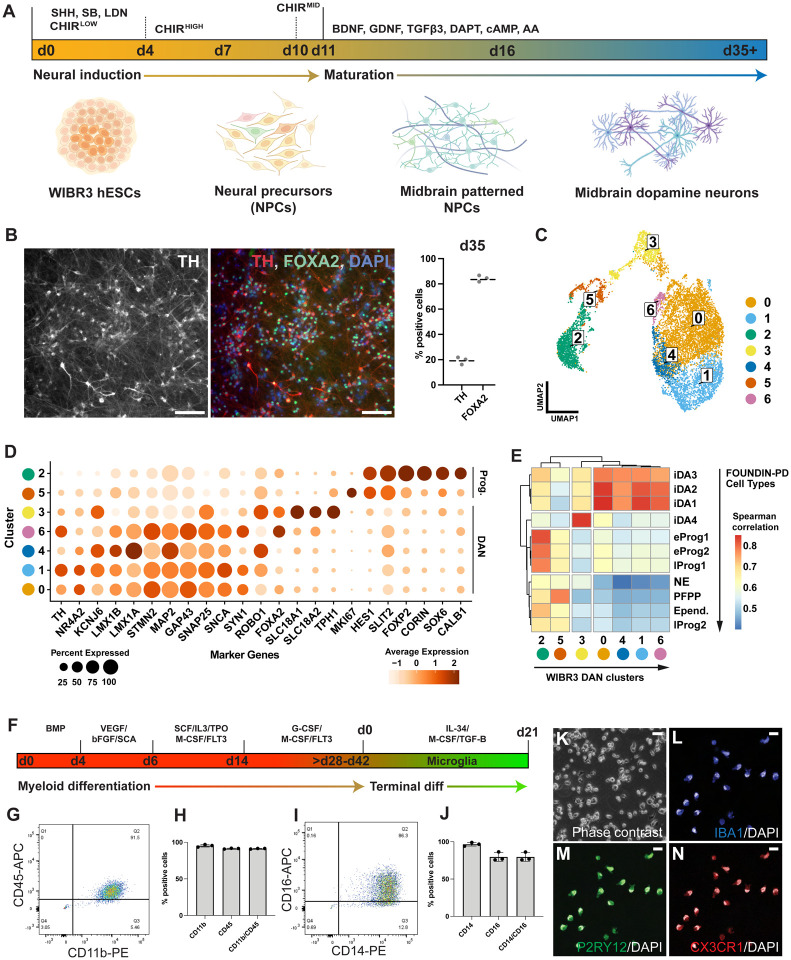
Figure 2. WIBR3 differentiation potential into dopaminergic neurons and microglia subtypes in 2D culture.
(A) Schematic depicting the protocol for in vitro differentiation of dopaminergic neurons from WIBR3 hESCs.
(B) Immunocytochemistry and quantification of TH and FOXA2 expressing cells in WIBR3 (parental) hESC-derived dopaminergic neurons at day 35. Scale bar 100 μm.(N=3).
(C) Uniform manifold approximation and projection (UMAP) plot of scRNA-Seq analysis at day 35 to 37 of dopaminergic neuron differentiation from WIBR3-S1, WIBR3-S2 and WIBR3-S3 hESCs showing 10,097 cells separated into 7 coarse clusters.
(D) Dot plot showing expression of key midbrain progenitor and dopamine neuron marker genes across different cluster identities indicates that clusters identified in (C) represent midbrain progenitors and dopaminergic neurons at different developmental stages. Dot size indicates the proportion of cells in a cluster expressing a given gene, while color intensity indicates its average expression.
(E) Heatmap depicting Spearman correlation coefficients between pseudo-bulk expression profiles of 7 WIBR3 clusters identified in (C) compared to pseudo-bulk expression profiles of 11 FOUNDIN-PD cell types.
(F) Schematic depicting in vitro microglia differentiation protocol from WIBR3 hESCs.
(G–J) Representative flow cytometry (FACS) analysis (G,I) and quantification (H,J) of CD14/CD16 and CD11b/CD45 expression in hESC-derived iMPs from subclones WIBR3-S1, WIBR3-S2 and WIBR3-S3.
(K–N) Representative phase contrast (K, Scale bar 50 μm) and immunostaining (L–N, Scale bar 10 μm) images of in vitro differentiated microglia derived from subclone WIBR3-S1 for microglia-specific markers IBA1 (blue), P2RY12 (green)) and CX3CR1 (red) (terminal differentiation day 14).

