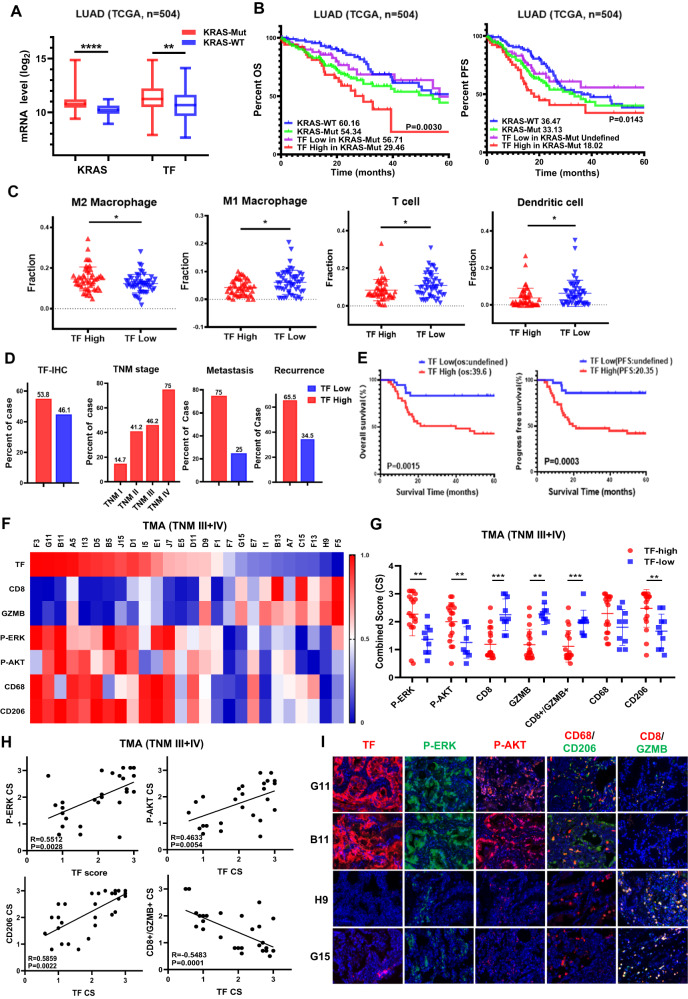
Fig. 1. TF is elevated in KRASmut NSCLC and correlates with poor survival and immunosuppressive TME.
A TCGA datasets were analyzed for TF and KRAS mRNA expression. B OS and PFS of TF high and TF low groups were calculated by Kaplan-Meier method. C The infiltration levels of immune cells in TF high vs TF low groups in TCGA cohort. D KRASmut lung cancer tissue microarrays were subjected to IHC staining. TF expression was analyzed versus the indicated clinical parameters. E OS and PFS in negative/low (n = 36) and moderate/high (n = 42) TF expression groups were calculated by Kaplan-Meier method. F IHC was performed for the indicated biomarkers, quantified as described in methods and plotted as expression level heatmap in KRASmut LUAD patients of stage III and IV. G The levels of P-ERK, P-AKT and immune cell markers in TF high/low KRASmut LUAD patients of stage III and IV (n = 29). H Comparing the correlation between P-ERK, P-AKT, CD206, CD8A+GZMB+ and TF expression in KRASmut LUAD patients of stage III and IV. I IHC profile of representative TF-high/low tumors are shown. Loss of tissue during staining was not included in the analysis. *P < 0.05, **P < 0.01, ***P < 0.001.

