Abstract
Background
Clear cell renal cell carcinoma (ccRCC) is one of the most common cancers worldwide, and its incidence is increasing every year. Endoplasmic reticulum stress (ERS) caused by protein misfolding has broad and profound effects on the progression and metastasis of various cancers. Accumulating evidence suggests that ERS is closely related to the occurrence and progression of ccRCC. This study aimed to identify ERS-related genes for evaluating the prognosis of ccRCC.
Methods
Transcriptomic expression profiles were obtained from the Gene Expression Omnibus (GEO) and The Cancer Genome Atlas (TCGA), and clinical data were downloaded from the TCGA. First, the differentially expressed genes (DEGs) were analyzed using the limma package, and the DEGs related to ERS (ERS-DEGs) were identified from the GeneCards database. Second, a function and pathway enrichment analysis and a Gene Set Enrichment Analysis (GSEA) were performed. Third, a protein-protein interaction (PPI) network was constructed to identify the hub genes, and a gene-micro RNA (miRNA) network and gene-transcription factor (TF) network were established using the hub genes. Finally, a least absolute shrinkage and selection operator (LASSO) regression analysis was conducted to establish a diagnostic model, and a Cox analysis was used to analyze the correlations between the expression of the characteristic genes and the clinical characteristics.
Results
We identified 11 signature genes and established a diagnostic model. Further, the Cox analysis results revealed a correlation between the expression levels of the signature genes and the clinical characteristics. Ultimately, five signature genes (i.e., TNFSF13B, APOL1, COL5A3, and CDH5) were found to be associated with a poor prognosis.
Conclusions
This study suggests that TNFSF13B, APOL1, COL5A3, and CDH5 may have potential as prognostic biomarkers in ccRCC and may provide new evidence to support targeted therapy in ccRCC.
Keywords: Clear cell renal cell carcinoma (ccRCC), endoplasmic reticulum stress (ERS), diagnosis, prognosis
Highlight box.
Key findings
• The messenger RNA (mRNA) expressions of endoplasmic reticulum stress (ERS)-associated genes TNFSF13B, APOL1, COL5A3, and CDH5 were independent biomarkers indicating a poor prognosis for clear cell renal cell carcinoma (ccRCC) patients.
What is known, and what is new?
• ERS is activated in multiple solid tumors and regulates the various malignant biological behaviors of tumors.
• ERS-associated genes play a significant role in the diagnosis and prognosis of ccRCC.
What is the implication, and what should change now?
• Our study identified potential biomarkers for diagnosing ccRCC and predicting the prognosis of ccRCC. However, more clinical data needs to be collected and more experiments need to be conducted to further verify our results.
Introduction
With 403,262 new cases worldwide in 2018, renal cell carcinoma (RCC) is one of the most commonly diagnosed malignant cancers (1). Clear cell RCC (ccRCC) is the most common subtype of RCC, and comprises about 80% of all RCC cases (2). The incidence of ccRCC has increased fivefold since 1971, and the mortality rate has increased twofold (3). At present, about 25% of ccRCC patients are diagnosed when the disease is already in an advanced stage (4). Due to its heterogeneous pathologies and molecular characteristics, the treatment of ccRCC has met with obstacles. Considerable research has been conducted to identify genetic markers that can be used to accurately predict patient outcomes. As a first-line clinical treatment, immunotherapy drugs can greatly improve the survival time of advanced stage or relapsed ccRCC patients. The detection of tumor molecular markers may help to predict local recurrence and distant metastasis, and thus enable more aggressive treatment regimens to be implemented (5-9).
Endoplasmic reticulum stress (ERS) is the physiological dysfunction of the endoplasmic reticulum caused by oxidative stress, chemical damage, and other factors, leading to the accumulation of misfolded or unfolded proteins in the endoplasmic reticulum (10). ERS plays a key role in a variety of human diseases, including, neurodegenerative diseases, inflammatory diseases, metabolic diseases, and tumors (11). Previous research has shown that ERS plays an important role in the occurrence and development of tumors and protects tumor cells from drug-induced stress and radiation damage (12). Moreover, a study also showed that ERS maintains the survival of renal cancer cells and can be used as a new anti-cancer mechanism for the treatment of renal cancer (13). To date, relatively few studies have examined the treatment of renal cancer by regulating ERS, and there are few confirmed targets that can play a therapeutic role in the treatment of renal cancer (13).
In this study, we first selected two gene data sets (i.e., GSE53757 and GSE66272) from the Gene Expression Omnibus (GEO) database. Second, we identified the differentially expressed genes (DEGs) using R-encapsulated limma, we then identified the ERS-related genes from the GeneCards database, and finally we identified the ERS-related genes in ccRCC. Third, annotations and visualizations were used to analyze these DEGs, including the molecular functions (MFs), cellular components (CCs), biological processes (BPs), and Kyoto Encyclopedia of Genes and Genomes (KEGG) pathways. Fourth, we established a protein-protein interaction (PPI) network and then applied the cell type Molecular Complex Detection (MCODE) algorithm for an additional DEG analysis to identify some important modules. Fifth, we visualized the hub gene-micro RNA (miRNA) network associated with ccRCC, the hub gene-transcription factor (TF) network associated with ccRCC, and the hub gene-gene interaction network associated with drug-ccRCC using Cytoscape software. Sixth, we used The Cancer Genome Atlas (TCGA) data and the least absolute shrinkage and selection operator (LASSO) regression method to identify the final key characteristic genes, combined the final expression values of the characteristic genes with the regression coefficients of the characteristic genes to establish the diagnostic model, and then used TCGA data set and the GSE53000 data set to draw the receiver operating characteristic (ROC) curve to verify the effectiveness of the diagnostic model. We present this article in accordance with the TRIPOD reporting checklist (available at https://tau.amegroups.com/article/view/10.21037/tau-23-374/rc).
Methods
Data collection
We used the R package GEOquery (14) to download the gene expression profile GSE53757 (15) and GSE66272 (16) data sets of human ccRCC tumor tissues and adjacent normal tissues from the GEO database (http://www.ncbi.nlm.nih.gov/geo/) (17). The GSE53757 data set comprised 144 samples, of which 72 were tumor tissues and 72 were normal tissues adjacent to the tumors. The GSE66272 data set comprised 53 samples, of which 26 were tumor tissues and 27 were normal adjacent to the normal tissues. We also applied the R package TCGAbiolinks (18) to obtain the gene expression profile ccRCC data from TCGA database, which comprised 534 tumor tissues and 72 normal tissues adjacent to the tumors, and we obtained the survival data and clinical phenotypes of the ccRCC patients from TCGA database (https://portal.gdc.cancer.gov/). The ERS-related genes were obtained from the GeneCards database (https://www.genecards.org/) (19).
DEGs
First, we used the R package sva (20) to remove the batch utility of the GSE53757 and GSE66272 data sets to obtain an integrated GEO data set. To analyze the influence of the gene expression values on the ccRCC tumor tissues relative to the normal tissues, according to the grouping information in the data, the R package limma (21) was used to analyze the differences between the groups. Genes with log fold change (logFC) >1 and P<0.05 were considered up-regulated genes, and genes with logFC <−1 and P<0.05 were considered down-regulated genes.
DEG function and pathway enrichment analysis
A Gene Ontology (GO) function annotation analysis, which includes the BPs, MFs, and CCs, is a common method for large-scale gene enrichment research. KEGG is a widely used database that stores information about genomes, biological pathways, diseases, and drugs. The R package clusterProfiler (22) was used to perform the GO function annotation analysis and the KEGG pathway enrichment analysis of the differentially expressed ERS-related genes associated with ccRCC. P<0.05 was considered statistically significant.
Gene Set Enrichment Analysis (GSEA) enrichment analysis
A GSEA is used to evaluate the distribution trend of genes in a pre-defined gene set in a gene table ranked by the phenotype correlation to determine their contribution to the phenotype (23). We obtained the background gene sets of “c2.kegg.v7.4.symbols” and “c5.go.v7.4.symbols” from the MSigDB (24) database, and we used the “clusterprofiler” R package to perform the GSEA (25). In this analysis, P<0.05 was considered statistically significant.
PPI network
A PPI network is composed of individual proteins that interact with each other to participate in all aspects of life processes, such as biological signal transmission, gene expression regulation, energy and material metabolism, and cell cycle regulation. A systematic analysis of the interaction relationships between a large number of proteins in biological systems is useful to understand the working principles of proteins in biological systems, the reaction mechanism of biological signals and energy substance metabolism under special physiological conditions, such as diseases, and the functional connections between important proteins. The STRING database (26) can be used to search for known proteins and predict the interactions among proteins. The database includes 2,031 species, 9.6 million proteins, and 1.38 million interactions of proteins to proteins. It contains the results obtained from experimental data, text mining from PubMed abstracts, and the integration of data from other databases, as well as the results obtained from using bioinformatics methods. We used the STRING database to construct a PPI network of differentially expressed ERS-related genes of ccRCC.
Closely connected local areas in a PPI network may represent molecular complexes that may possess specific biological functions. The MCODE (27) network clustering algorithm can be used to mine protein complexes or corresponding functional modules from complex protein networks. We extracted PPI subnets with MCODE scores greater than 10 to obtain ccRCC-related genes in the subnets. Additionally, cytoHubba was used to extract the top 20 key genes in the network. The intersection of the hub genes and top 20 genes was used to compare the function of the hub genes in the PPI network.
Hub gene-miRNA network and hub gene-TF network
In the post-transcriptional stage, the miRNAs or TFs that control gene expression by interacting with the target gene were analyzed under conditions that define the disease (28,29). We used the miRNet database to identify the hub gene-related miRNAs and TFs associated with ccRCC. We used Cytoscape software to visualize the hub gene-miRNA network related to ccRCC and the hub gene-TF network related to ccRCC.
The drug-gene interaction database (DGIdb) version 3.0.2 (https://www.dgidb.org) (30) is an available resource for targeting drugs, sensitive genomes, and drug-gene interactions. We searched the DGIdb to predict the potential drugs or molecular compounds that interact with the hub genes associated with ccRCC and visualized the drug-hub gene interaction network using Cytoscape.
Construction of a diagnostic model
We analyzed the ability of the hub genes related to ccRCC to distinguish between normal tissues and ccRCC tissues. We used the R package pROC (31) to draw a ROC curve for each gene and calculate the area under the curve (AUC), and we chose the genes with AUC values greater than 0.9 from the two data sets as the key genes. We used TCGA database to find the best lambda value to confirm the final characteristic genes from the key genes using the LASSO regression method and combined the expression values of the final characteristic genes with the regression coefficients of the characteristic genes to establish a diagnostic model. The diagnostic score of each patient was equal to the sum of the characteristic gene expression value multiplied by the regression coefficient. The ROC curves were drawn using TCGA data set and the integrated GEO data set to verify the effectiveness of the diagnostic model. We also obtained an independent validation data set (GSE53000) (32) from the GEO. The GSE53000 data set comprised the gene expression profile data of 53 ccRCC tissues and six normal tissues. We drew ROC curves using the GSE53000 validation data set to verify the effectiveness of the diagnostic model.
Prognostic analysis of the characteristic genes
Gene expression levels and clinical characteristics play a key role in the development and prognosis of tumors. To further evaluate the effect of the expression of the characteristic genes and the clinicopathological characteristics on the prognosis of patients, we first analyzed the differences in the expression levels of the characteristic genes between the normal tissues and tumor tissues in the two data sets. We then analyzed the effect of the characteristic gene expression levels on the survival and prognosis of patients with ccRCC. Univariate and multivariate Cox analyses were conducted to analyze the independent ability of the characteristic genes and clinicopathological characteristics to predict overall survival (OS), and the corresponding indicators were incorporated into a model to construct a clinical prediction nomogram and calibration curve. The gene expression level significantly affected the survival and prognosis of patients with ccRCC, and the correlations between the gene expression level and the clinical characteristics was analyzed.
Human renal cell lines
CcRCC tissues and normal adjacent tissues were collected from 10 patients admitted to the First Affiliated Hospital of Chongqing Medical University. The study was conducted in accordance with the Declaration of Helsinki (as revised in 2013) and was approved by the Ethics Committee of the First Affiliated Hospital of Chongqing Medical University (Ethical Application Ref: 2022-120). Informed consent was obtained from all the participants. Three renal cancer cell lines (786-O, RCC-23, and CAKI) and one human normal renal cell line (HK-2) were purchased from the American Type Culture Collection (Manassas, Virginia, USA). The cells were cultured in Dulbecco’s Modified Eagle Medium (Gibco, Waltham, MA, USA) and McCoy’s 5A medium (Gibco), which were supplemented with 10% fetal bovine serum (BioInd, Israel), 100 u/mL of penicillin (Beyotime, Shanghai, China), and 100 mg/mL of streptomycin (Beyotime). The cells were incubated at 37 ℃ in 5% CO2. The medium was changed every 1–3 days.
Real time-quantitative polymerase chain reaction (RT-qPCR)
Trizol (ABclonal, Wuhan, China) was used to extract the total RNA from the tissues and cell lines under various experimental conditions in accordance with the manufacturer’s instructions. A complementary DNA (cDNA) Synthesis Kit (ABclonal) that was combined with RNA (1 µg) was used to reverse transcribe the cDNA. The qPCR was performed on an ABI 7500 RT PCR system (Applied Biosystems, Waltham, MA, USA) using the SYBR-green method (ABclonal). The relative expression levels of the mRNAs normalized to β-actin were calculated using the 2−ΔCt method. The primer sequences are shown in Table 1. Three assays were performed per cDNA sample.
Table 1. The primer sequences of APOL1, COL5A3, TNFSF13B, CDH5, and β-actin.
| Gene | Primers | Primers sequences |
|---|---|---|
| APOL1 | F primer (5'-3') | TGGACTACGGAAAGAAGTGGT |
| R primer (5'-3') | CCTCCTTCAATTTGTCAAGGCTT | |
| COL5A3 | F primer (5'-3') | TTCTCCTACGTGGACGCCGA |
| R primer (5'-3') | TCTCCATTGGTGCCAAGGAA | |
| TNFSF13B | F primer (5'-3') | TTCTAGGGCACTTCCCCTTT |
| R primer (5'-3') | CTCAAGACTGCTTGCAACTGA | |
| CDH5 | F primer (5'-3') | GGCTCCACAGAGCTCCACTC |
| R primer (5'-3') | TGAGGGATGTTTCTGTTCCGT | |
| β-actin | F primer (5'-3') | AAACGTGCTGCTGACCGAG |
| R primer (5'-3') | TAGCACAGCCTGGATAGCAAC |
Immunohistochemistry (IHC)
The slides were deparaffinized with xylene and rehydrated with graded ethanol for 1 hr. Antigen retrieval was achieved by immersing the slides in boiling sodium citrate‐hydrochloric acid buffer solution and heating them in the microwave for another 25 min. After the samples were cooled to room temperature, 3% hydrogen peroxide was added to remove the endogenous peroxidase, and the samples were washed three times with Tris-buffered saline (TBS). After normal goat serum was used to block the samples at room temperature for 15 min, the slides were incubated with primary antibodies overnight at 4 ℃. After washing with TBS three times, the secondary antibodies were used. Next, the slides were washed and incubated with streptavidin‐biotin‐conjugated horseradish peroxidase (HRP) at 37 ℃ for another 30 min. After being washed three more times, diaminobenzidine was added for approximately 1 min, and hematoxylin was applied to counterstain for 50 s. The antibodies used in the study were as follows: COL5A3 (1:200, Abmart, pa2654), APOL1 (1:5,000, Proteintech, 66124-1-Ig), CDH5 (1:400, Proteintech, 66804-1-lg), TNFSF13B (1:400, Wanleibio, WL02618).
Statistical analysis
All the data calculations and statistical analysis were performed using R language (https://www.r-projec t.org/, version 4.0.2) and GraphPad Prism9 (GraphPad Software Inc., La Jolla, CA, USA). To compare two groups of continuous variables, the statistical significance of the normally distributed variables was estimated by an independent t-test. To compare two groups of independent variables, the differences between the non-normally distributed variables were analyzed by the Wilcoxon rank-sum test. To compare multiple groups of independent variables, the difference between the variables was compared and analyzed by the Kruskal-Wallis test. R package pROC was used to draw the ROC curves and calculate the AUCs to evaluate the accuracy of the risk scores in estimating patient prognosis. All statistical P values were two-sided, and P<0.05 was considered statistically significant.
Results
Identification of ERS-related genes
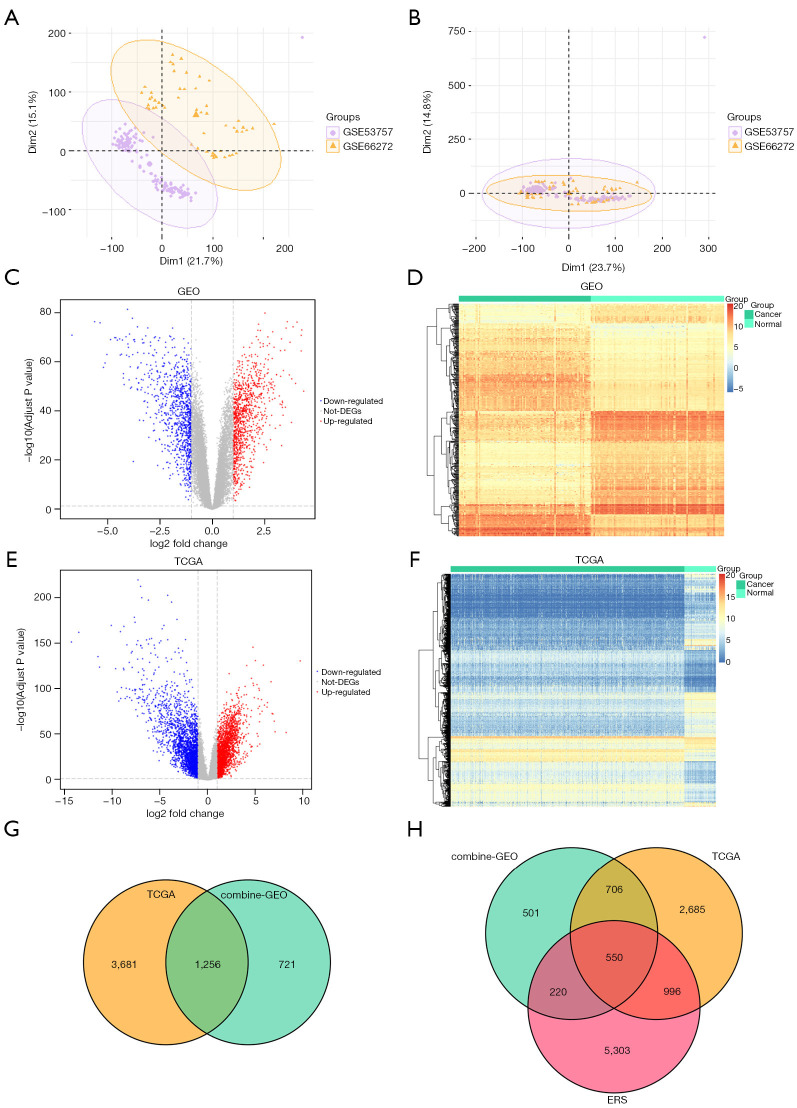
We first performed a principal component analysis on the GSE53757 and GSE66272 data sets, and the results showed that there was a significant batch effect between the GSE53757 and GSE66272 data sets (Figure 1A). We used the combat function to remove the batch effect to obtain an integrated GEO data set (Figure 1B). The integrated GEO data set comprised 197 samples, of which 98 were tumor tissue samples and 99 were normal tissue samples.
Figure 1.
Differentially expressed genes. (A) PCA analysis before batch calibration. (B) PCA analysis after batch calibration. (C,E) The abscissa is the log2 fold change; the ordinate is −log10 (adjusted P value). (D,F) The abscissa is the patient id; the ordinate is the respective DEGs. (G) Venn diagram of the DEGs; the green circle represents the DEGs of the integrated GEO data set; the yellow circle represents the DEGs of TCGA data set. The intersection was used to identify the ccRCC-related DEGs. (H) The yellow circle represents the DEGs of TCGA data set; the green circle represents the DEGs of the integrated GEO data set; the red circle represents the ERS-related genes of ccRCC. PCA, principal component analysis; DEGs, differentially expressed genes; GEO, Gene Expression Omnibus; TCGA, The Cancer Genome Atlas; ERS, endoplasmic reticulum stress; ccRCC, clear cell renal cell carcinoma.
To analyze the effect of gene expression on the ccRCC tissues relative to the normal tissues, we conducted a limma differential analysis to identify the DEGs in the two data sets and drew a volcano map of the DEGs. The GEO data were integrated and 1,977 DEGs were identified, of which 1,007 were up-regulated and 970 were down-regulated (Figure 1C). The DEGs and data groupings were then used to draw a classification heat map (Figure 1D). The DEGs could be used to distinguish between the tumor tissues and the normal tissues. Using the TCGA-ccRCC data, we identified 4,937 DEGs, of which 2,362 were up-regulated and 2,575 were down-regulated (Figure 1E). The DEGs and data grouping were used to draw a classification heat map (Figure 1F). The DEGs could be used to distinguish between the tumor tissues and the normal tissues. We then identified 1,256 intersecting DEGs related to ccRCC in the two data sets (Figure 1G). The 1,256 intersecting ccRCC DEGs and 7,069 ERS-related genes were then entered into the GeneCards database and 550 differentially expressed ERS-related genes of ccRCC were identified (Figure 1H).
Functional enrichment analysis of the differentially expressed ERS-related genes
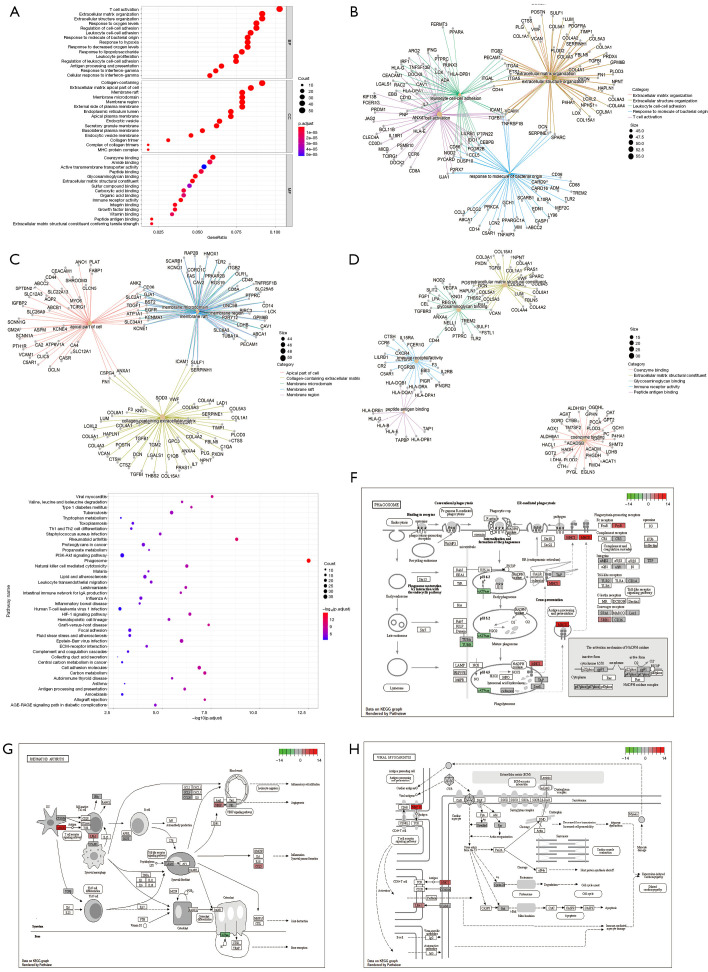
To analyze the relationship between the differentially expressed ERS-related genes of ccRCC and the BPs, MFs, CCs, biological pathways, and diseases, we first performed a functional enrichment analysis. The ERS-related genes were analyzed by a functional enrichment analysis (Figure 2A). In terms of the BPs, the differentially expressed ERS-related genes of ccRCC were mainly enriched in the extracellular matrix organization, extracellular structure organization, T cell activation, leukocyte cell-cell adhesion, response to molecule of bacterial origin, response to oxygen levels, regulation of cell-cell adhesion, response to interferon-gamma, antigen processing and presentation, response to hypoxia (Figure 2B). In terms of the CCs, they were simultaneously enriched in the collagen-containing extracellular matrix, membrane raft, membrane microdomain, membrane region, apical part of the cell, endoplasmic reticulum lumen, apical plasma membrane, external side of plasma membrane, endocytic vesicle, and basolateral plasma membrane. (Figure 2C). In terms of the MFs, they were enriched in the extracellular matrix structural constituent, immune receptor activity, coenzyme binding, peptide antigen binding, glycosaminoglycan binding, integrin binding, extracellular matrix structural constituent conferring tensile strength, growth factor binding, peptide binding, and carboxylic acid binding (Figure 2D).
Figure 2.
GO and KEGG enrichment analyses. (A) GO function enrichment analysis. (B) The top five BP items are displayed. (C) The top five CC items are displayed. (D) The top five MF items are displayed. (E) KEGG pathway enrichment analysis. (F) Significantly enriched KEGG pathway, hsa04145: phagosome. (G) Significantly enriched KEGG pathway, hsa05323: rheumatoid arthritis. (H) Significantly enriched KEGG pathway, hsa05416: viral myocarditis. The red boxes in (F-H) represent the up-regulated genes, and the green boxes represent the down-regulated genes. GO, Gene Ontology; KEGG, Kyoto Encyclopedia of Genes and Genomes; BP, biological processes; CC, cellular components; MF, molecular functions.
Next, a pathway enrichment analysis was performed on the differentially expressed ERS-related genes of ccRCC, and the results showed that the differentially expressed ERS-related genes of ccRCC were enriched in phagosome, rheumatoid arthritis, viral myocarditis, graft-versus-host disease, carbon metabolism, allograft rejection, cell adhesion molecules, type I diabetes mellitus, HIF-1 signaling pathway, natural-killer cell-mediated cytotoxicity, and other biological pathways (Figure 2E). The first three pathways that were significantly enriched were the hsa04145: phagosome (Figure 2F), hsa05323: rheumatoid arthritis (Figure 2G), and hsa05416: viral myocarditis pathways (Figure 2H).
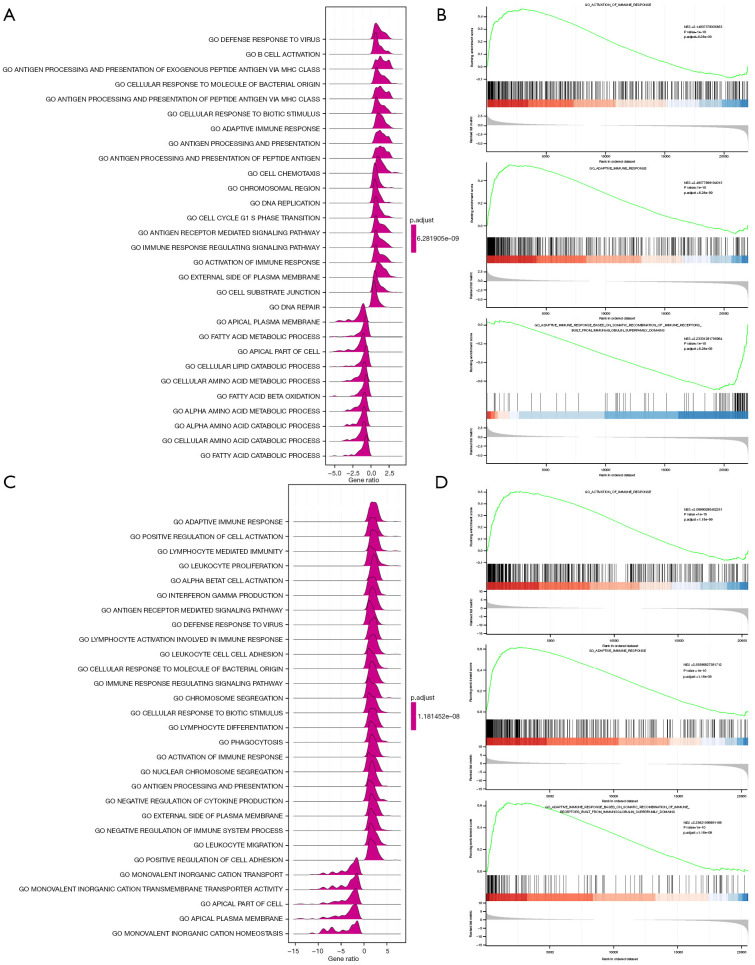
To determine the effect of the gene expression levels on ccRCC, we analyzed the relationship between gene expression in the two data sets, and the BPs involved, the CCs affected, and the MFs performed. The results showed that the genes in the integrated GEO data mainly affected the activation of the immune response, adaptive immune response, α amino acid catabolism, and other biological functions (Figure 3A,3B). The genes in the TCGA-ccRCC data mainly affected the activation of the immune response, adaptive immune response, α-T cell activation, and other biologically related functions (Figure 3C,3D). The occurrence of ccRCC was more likely to be related to immune response disorders.
Figure 3.
GSEA-GO analysis. (A) The GSEA-GO analysis of the integrated GEO data. (B) The first three items of the GSEA-GO analysis of the integrated GEO data are displayed. (C) The GSEA-GO analysis of TCGA data. (D) The top three items of the GSEA-GO analysis of the TCGA data are displayed. GEO, Gene Expression Omnibus; GO, Gene Ontology; GSEA, Gene Set Enrichment Analysis; TCGA, The Cancer Genome Atlas.
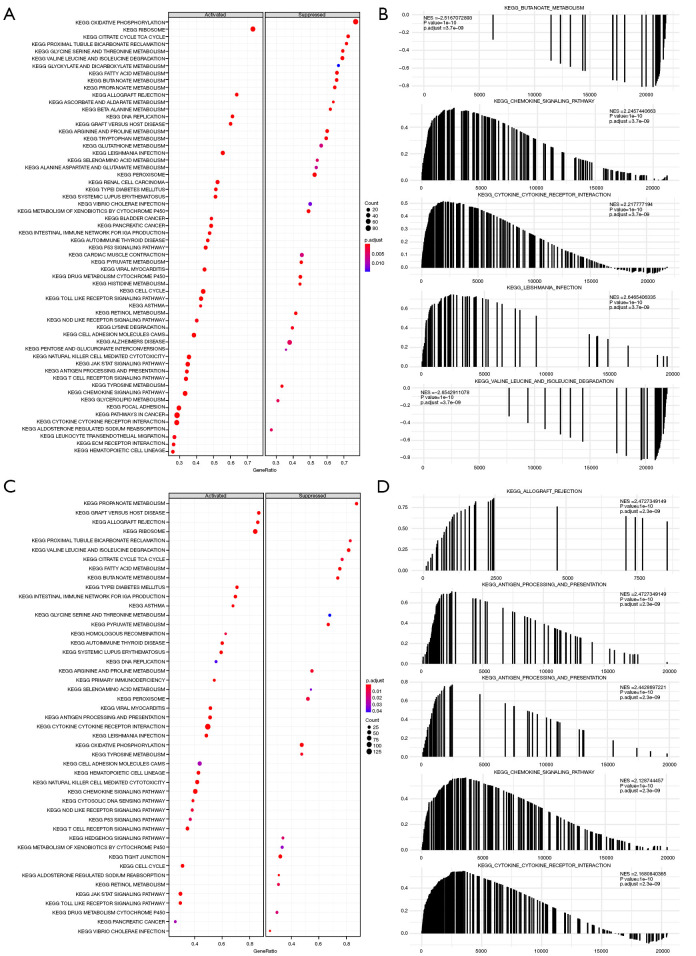
We also separately analyzed the biological pathways affected by gene expression in the two data sets. The results showed that the genes in the integrated GEO data set mainly affected the butyrate metabolism, chemokine signaling pathways, cytokine-cytokine receptor interactions, Leishmania infection, valine leucine, isoleucine degradation, and other biological pathways (Figure 4A,4B). The genes in the TCGA-ccRCC data set mainly affected biologically related pathways, such as allogeneic rejection, antigen processing and presentation, autoimmune thyroid diseases, chemokine signaling pathways, and cytokine-cytokine receptor interactions (Figure 4C,4D).
Figure 4.
GSEA-KEGG analysis. (A) The GSEA-KEGG analysis of the integrated GEO data. (B) The top five items analyzed by the KEGG of the integrated GEO data. (C) GSEA-KEGG analysis of TCGA data. (D) The top five items analyzed by GSEA-KEGG in TCGA data. GSEA, Gene Set Enrichment Analysis; KEGG, Kyoto Encyclopedia of Genes and Genomes; GEO, Gene Expression Omnibus; TCGA, The Cancer Genome Atlas.
Construction of a PPI network
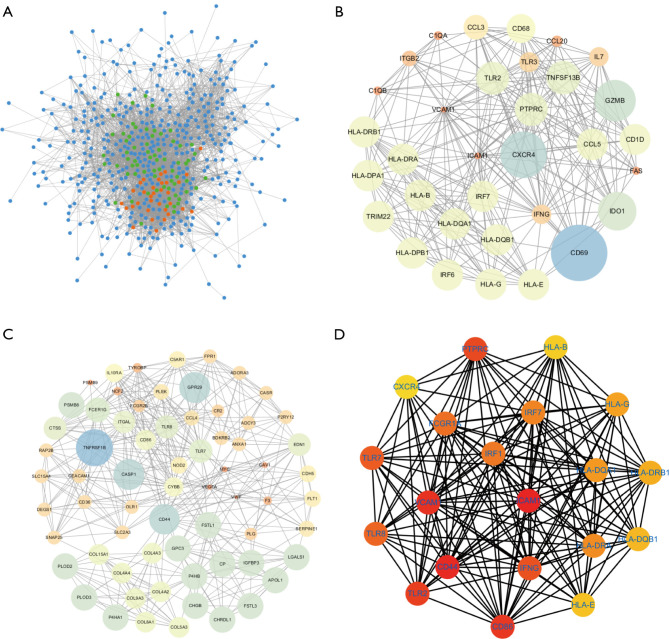
We constructed a PPI network related to the differentially expressed ERS-related genes of ccRCC, which were visualized in Cytoscape (Figure 5A). There was a total of 522 differentially expressed ERS-related genes of ccRCC and 4,826 PPI pairs in the PPI network. Among them, the top five differentially expressed ERS-related genes that had the most interactions with other ccRCCs were EGFR (which interacted with 121 differentially expressed ERS-related genes of ccRCCs), VEGFA (which interacted with 118 differentially expressed ERS-related genes of ccRCCs), FN18 (which interacted with 104 differentially expressed ERS-related genes of ccRCCs), CD44 (which interacted with 101 differentially expressed ERS-related genes of ccRCCs), and PTPRC (which interacted with 100 differentially expressed ERS-related genes of ccRCCs). We used MCODE to obtain two subnets with scores greater than 10, of which the first subnet contained 33 ERS-related DEGs (Figure 5B), and the second subnet comprised 67 ERS-related DEGs (Figure 5C). We obtained took 100 ccRCC-related hub genes from two subnets to obtain. At the same time, we used cytoHubba to extract the top 20 nodes in the PPI network related to the ERS-related DEGs (Figure 5D), and after intersection with the 100 ccRCC-related hub genes, the following 18 genes were identified: TLR7, CD44, CD86, TLR8, IFNG, CXCR4, IRF7, HLA-DQB1, PTPRC, HLA-B, HLA-DQA1, HLA-E, HLA-G, VCAM1, HLA-DRA, ICAM1, TLR2, and HLA-DRB1.
Figure 5.
PPI network. (A) PPI network of the DEGs related to renal clear cell carcinoma; the blue nodes indicate the DEGs related to renal clear cell carcinoma; the red nodes indicate the first subnet gene; the green nodes indicate the second subnet gene. (B) The first subnet in the PPI network of the DEGs related to renal clear cell carcinoma; the size of the node represents the MCODE score. (C) The first subnet in the PPI network of the DEGs related to renal clear cell carcinoma; the size of the node is the MCODE score. (D) Top 20 subnets in the PPI network of the DEGs related to renal clear cell carcinoma. PPI, protein-protein interaction; DEGs, differentially expressed genes; MCODE, Molecular Complex Detection.
Construction of a hub gene-miRNA network and a hub gene-TF network
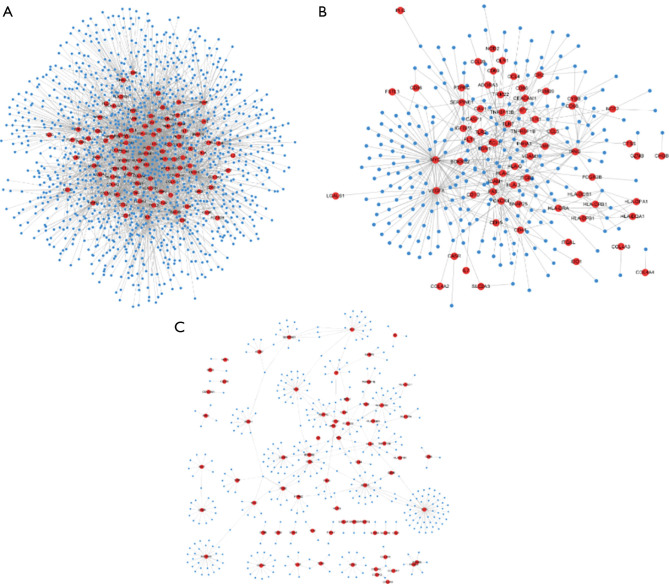
We constructed a mRNA-miRNA network of the hub genes of ccRCC, which contained 99 mRNAs and 1,408 miRNAs. The top five miRNAs targeting ccRCC hub genes were VEGFA, which was regulated by 207 miRNAs, MYC, which was regulated by 194 miRNAs, RAP2B, which was regulated by 163 miRNAs, FSTL1, which was regulated by 144 miRNAs, and CD44, which was regulated by 138 miRNAs. The top five miRNAs that controlled multiple ccRCC hub genes at the same time were hsa-mir-129-2-3p, which controlled 49 hub genes, hsa-mir-124-3p, which controlled 47 hubs genes, and hsa-mir-27a-3p, which controlled 38 hub genes, hsa-mir-155-5p, which controlled 37 hub genes, and hsa-mir-146a-5p, which controlled 36 hub genes (Figure 6A).
Figure 6.
Hub gene-miRNA network, hub gene-TF network, and hub gene-drug network. (A) The mRNA-miRNA network of the hub genes related to renal clear cell carcinoma; the blue nodes indicate miRNA; the red nodes indicate the hub genes related to renal clear cell carcinoma. (B) mRNA-TF network of the hub genes related to renal clear cell carcinoma; the blue nodes represent the TFs; the pink nodes represent the hub genes related to renal clear cell carcinoma. (C) The mRNA-drug network of the hub genes related to renal clear cell carcinoma; the blue nodes represent the drugs; the pink nodes represent the hub genes related to renal clear cell carcinoma. miRNA, micro RNA; mRNA, messenger RNA; TF, transcription factor.
We constructed the mRNA-TF network of hub genes of ccRCC, which contained 70 mRNAs and 232 TFs. Among them, the top five TFs targeting ccRCC hub genes were MYC, which was regulated by 74 TFs, VEGFA, which was regulated by 58 TFs, IFNG, which was regulated by 29 TFs, FAS, which was regulated by 24 TFs, and CXCR4, which was regulated by 23 TFs. The top five TFs that controlled multiple ccRCC hub genes at the same time were NFKB1, which controlled 28 hub genes, RELA, which controlled 26 hub genes, SP1, which controlled 16 hub genes, STAT1, which controlled 11 hub genes, and IRF1, JUN, TP53, which controlled nine hub genes (Figure 6B).
We searched for 100 drugs and compounds related to the ccRCC hub genes from the DGIDB data set and constructed a ccRCC hub gene-drug action network, which contained 69 mRNAs and 404 drugs. Among them, the top five hub genes of ccRCC regulated by the most drugs were FLT1, which was targeted by 55 drugs, ADORA3, which was targeted by 27 drugs, VEGFA, which was targeted by 26 drugs, MYC, which was targeted by 25 drugs, and PLG, which was targeted by 20 drugs. The drug that controlled multiple ccRCC hub genes at the same time was PREDNISONE, which targeted five hub genes, while ASPIRIN, bevacizumab, etanercept, collagenase clostridium histolyticum, floxacillin, ocriplasmin and ticlopidine targeted four hub genes of ccRCC (Figure 6C).
Construction of a ccRCC diagnostic model
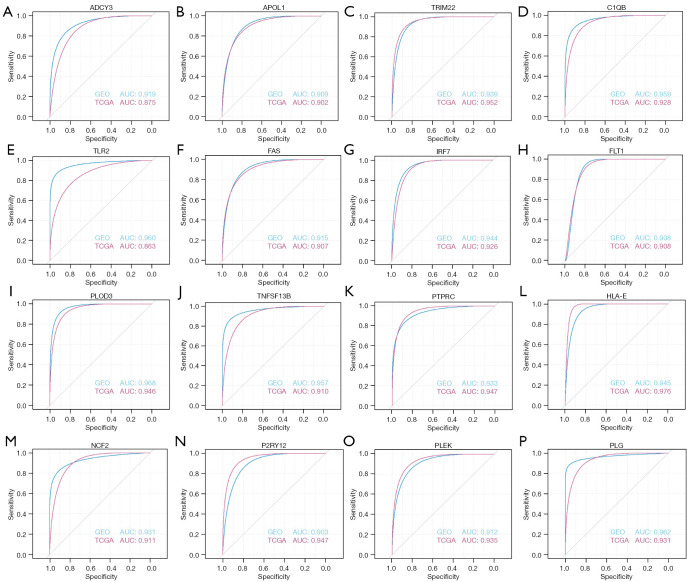
We analyzed the ability of the ccRCC hub genes to independently distinguish between tumor tissues and normal tissues and drew a ROC curve for each gene. We identified 45 key genes related to ccRCC with AUC values greater than 0.8 in the two data sets, and 16 key genes with AUC values greater than 0.9 in the two data sets (Figure 7).
Figure 7.
ROC curves of the key genes. (A-P) The ROC curves of the 16 renal clear cell carcinoma-related hub genes with AUC values greater than 0.9. ROC, receiver operating characteristic; AUC, area under curve; GEO, Gene Expression Omnibus; TCGA, The Cancer Genome Atlas.
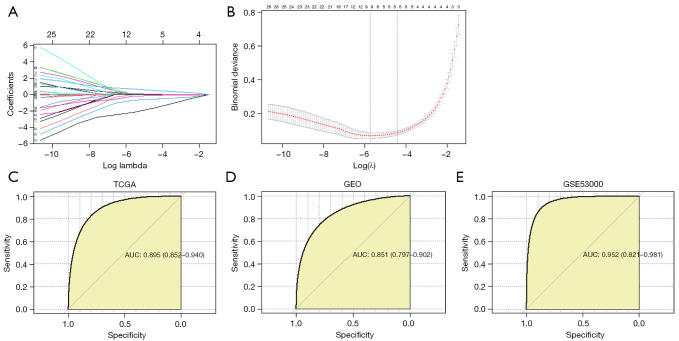
We identified the following 11 characteristic genes using the LASSO regression method in TCGA database (Figure 8A,8B): TRIM22, PTPRC, TNFSF13B, FCGR2B, CTSS, TLR7, APOL1, COL5A3, C5AR1, CDH5, and TYROBP. The diagnostic model was constructed by multiplying the expression values of the 11 characteristic genes by the regression coefficients of each characteristic gene.
Figure 8.
Diagnostic model and its verification. (A) LASSO regression characteristic fitting curve. (B) LASSO regression analysis of characteristic genes. The ROC curve of the diagnostic model in (C) TCGA data set, (D) integrated GEO data set and (E) the GSE53000 data set. LASSO, least absolute shrinkage and selection operator; ROC, receiver operating characteristic; AUC, area under the curve; TCGA, The Cancer Genome Atlas; GEO, Gene Expression Omnibus.
The model risk score was calculated as follows:
Model risk score = 0.121 × TRIM22 + 0.064 × PTPRC + 0.699 × TNFSF13B − 0.011 × FCGR2B − 2.229 × CTSS + 0.153 × TLR7 − 0.799 × APOL1 + 0.0537 × COL5A3 + 0.089 × C5AR1 − 0.305 × CDH5 + 0.134 × TYROBP
The ROC curve was drawn using TCGA data set, and the results showed that the AUC value was 0.895 (Figure 8C). The ROC curve was drawn using the integrated GEO data set, and the AUC value was 0.851 (Figure 8D). The ROC curve was drawn using the GSE53000 data set, and the AUC value was 0.952 (Figure 8E). The diagnostic model we constructed had a high diagnostic efficiency. To analyze the relationship between the 11 signature genes and the 18 intersection genes, we calculated the correlations between the 11 signature genes and the 18 intersection genes in the ccRCC tissues and normal tissues from TCGA (Figure S1). The 11 signature genes and 18 intersection genes showed a high positive correlation.
APOL1, COL5A3, TNFSF13B, and CDH5 were prognostic factors related to ccRCC
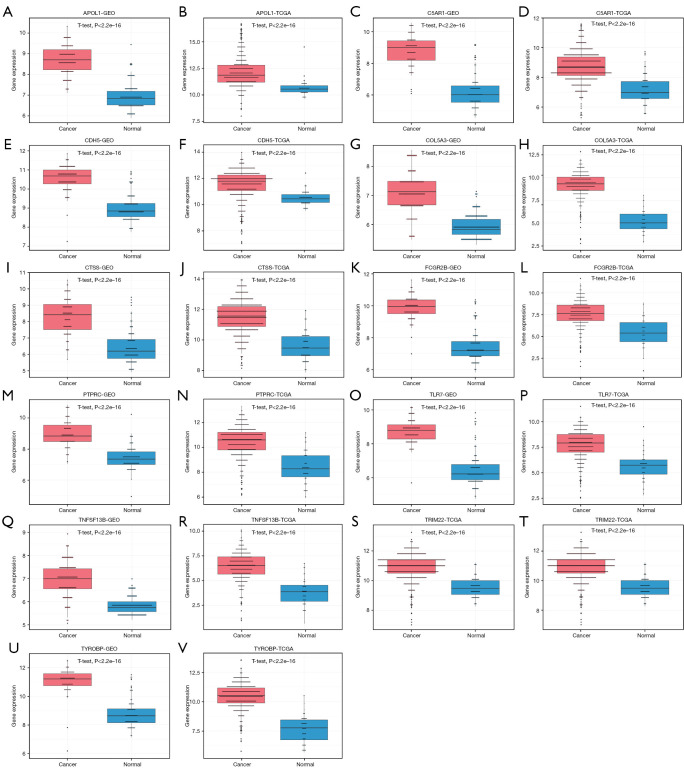
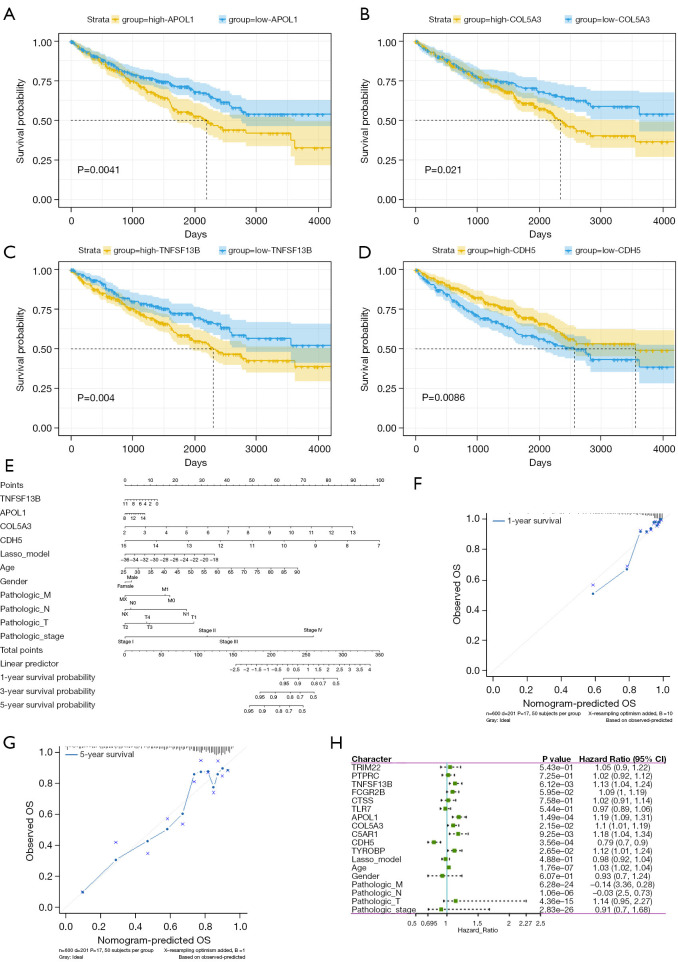
We analyzed the expression differences of the 11 characteristic genes in the tumor tissues and normal tissues in the two data sets, and the results showed that the expression levels of the 11 characteristic genes in the tumor tissues were significantly higher than those in the normal tissues (Figure 9). We also analyzed the effect of the expression levels of the 11 characteristic genes on the prognosis of patients, and the results showed that high expression levels of APOL1, COL5A3, and TNFSF13B indicated a poor prognosis (Figure 10A-10C), while a low expression level of CDH5 indicated a poor prognosis (Figure 10D). Subsequently, the clinical data and 11 characteristic genes were used to construct a nomogram (Figure 10E) to simultaneously predict the one-year survival rate (Figure 10F) and five-year survival rate (Figure 10G) of the ccRCC patients. The results showed that the Nomo model we constructed could accurately predict the one-year and five-year survival rates of the patients. A univariate Cox analysis was conducted using the 11 characteristic genes and clinical characteristics, and the results showed that TNFSF13B, APOL1, COL5A3, C5AR1, CDH5, age, and American Joint Committee on Cancer (AJCC) stage were prognostic factors related to ccRCC (Figure 10H). The multivariate Cox analysis showed that COL5A3, CDH5, age, and AJCC stage were all prognostic factors for ccRCC (Figure 10H).
Figure 9.
The expression of the hub genes. (A-V) The expression differences of the 11 hub genes between the normal tissues and tumor tissues of the two data sets. GEO, Gene Expression Omnibus; TCGA, The Cancer Genome Atlas.
Figure 10.
Prognostic analysis of characteristic genes. (A) APOL1, (B) COL5A3, (C) NFSF13B, (D) CDH5 expression levels. (E) A nomogram of 11 characteristic genes and clinical characteristics. Nomo model predicting the (F) 1- and (G) 5-year survival of patients with renal clear cell carcinoma. (H) Multivariate Cox analysis of the 11 characteristic genes and clinical characteristics. OS, overall survival.
APOL1, COL5A3, CDH5, and TNFSF13B expression was correlated with AJCC TNM staging
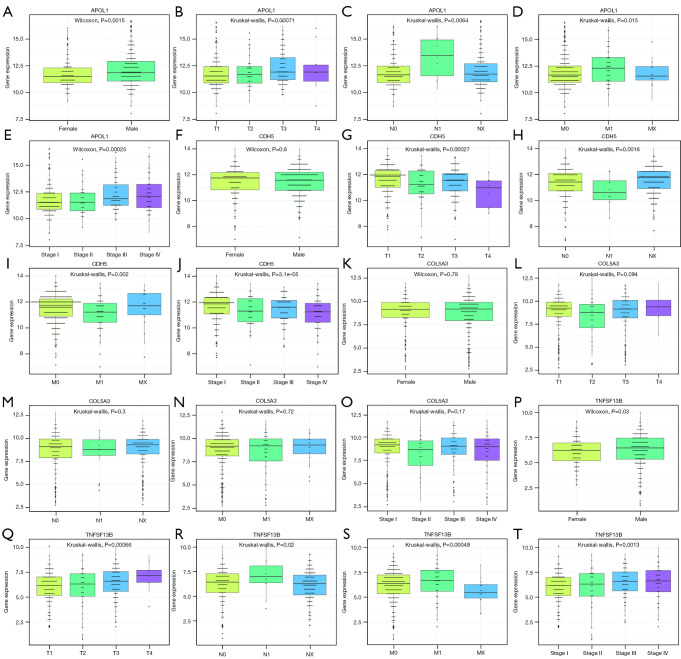
We found that APOL1, COL5A3, TNFSF13B, and CDH5 were all related to the prognosis of ccRCC patients. We analyzed the correlation between the expression levels of these four genes and the patients’ gender and AJCC TNM staging. The results showed that the expression of the APOL1 gene was related to the patients’ gender. APOL1 gene expression was significantly higher in male patients than female patients. APOL1 gene expression was also significantly related to the stage of the disease, such that the higher the gene expression level, the higher the stage of the patient (Figure 11A-11E). There was no significant difference in CDH5 gene expression between the male and female patients; however, CDH5 gene expression was significantly related to the stage of the disease, such that the lower gene expression level, the higher the stage of the patient (Figure 11F-11J). COL5A3 gene expression did not differ significantly between the male and female patients, and was not significantly correlated with the stage of the disease (Figure 11K-11O). TNFSF13B gene expression differed significantly between the male and female patients; TNFSF13B gene expression was significantly higher in male patients than female patients. TNFSF13B gene expression was also significantly related with the stage of the disease, such that the higher the gene expression level, the higher the stage of the patient (Figure 11P-11T).
Figure 11.
The correlation between the prognostic-related feature genes and clinical features. The expression levels of APOL1 between the (A) genders, (B) T grades, (C) N grades, (D) M grades, and (E) patients’ AJCC staging grades. The expression levels of CDH5 between the (F) genders, (G) T grades, (H) N grades, (I) T M grades, and (J) patients’ AJCC staging grades. The expression levels of COL5A3 between the (K) genders, (L) T grades, (M) N grades, (N) M grades, and (O) patients’ AJCC staging grades. The expression levels of TNFSF13B between the (P) genders, (Q) T grades, (R) N grades, (S) M grades, and (T) patients’ AJCC staging grades. AJCC, American Joint Committee on Cancer.
APOL1, COL5A3, TNFSF13B, and CDH5 were highly expressed in ccRCC
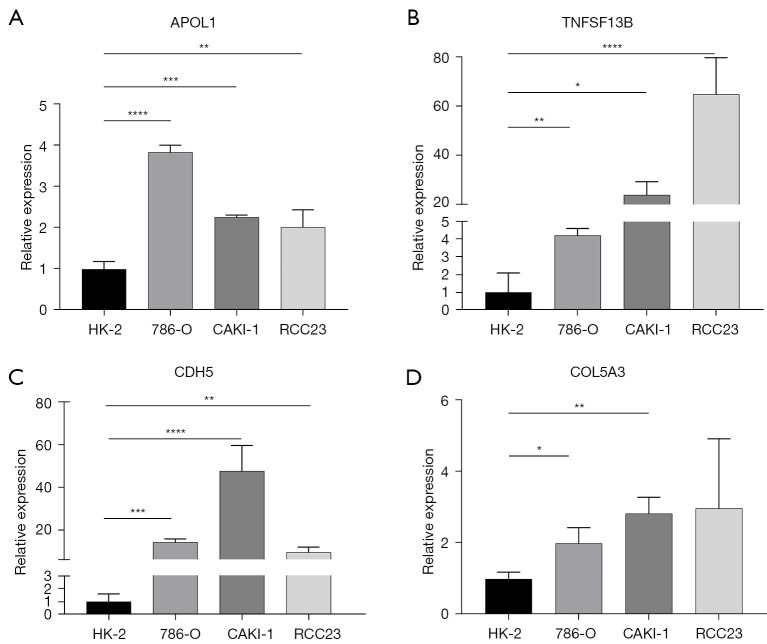
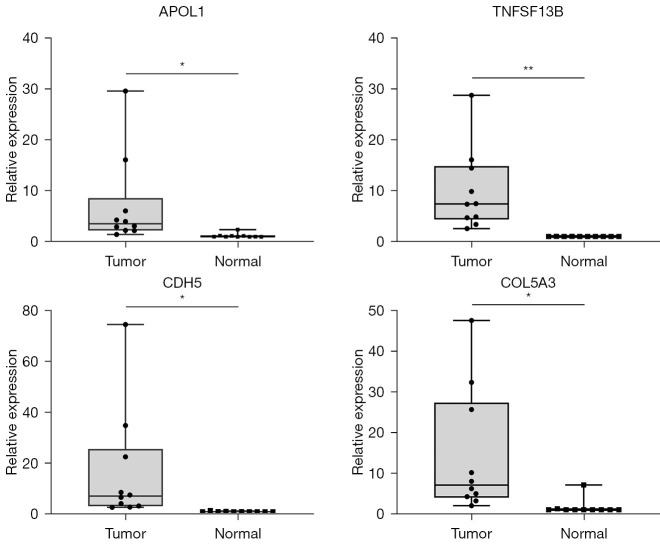
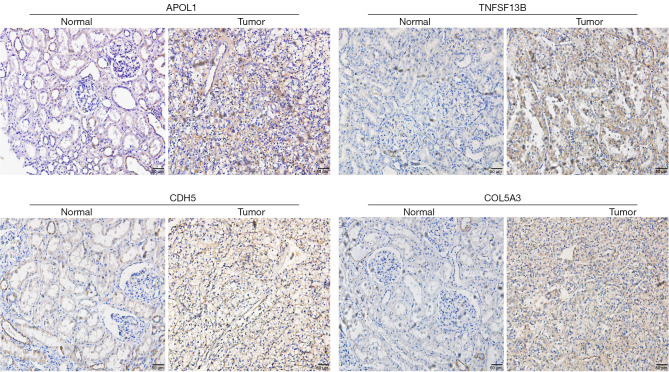
Previously, using bioinformatics methods, we found that APOL1, COL5A3, TNFSF13B, and CDH5 were associated with the prognosis of patients with ccRCC and were significantly highly expressed in ccRCC. Further, the RT-qPCR results showed that APOL1, COL5A3, TNFSF13B, and CDH5 were significantly more highly expressed in human ccRCC cell lines than renal tubular epithelial cell lines (HK-2) (Figure 12). Similarly, APOL1, COL5A3, TNFSF13B, and CDH5 were significantly more highly expressed in tumor tissues than adjacent normal tissues. Notably, the RT-qPCR and IHC results were consistent with our previous results (Figures 13,14).
Figure 12.
The expression levels of (A) APOL1, (B) TNFSF13B, (C) CDH5, and (D) COL5A3 in the renal cancer cell lines and renal tubular epithelial cell lines as measured by RT-qPCR. *, P<0.05; **, P<0.01; ***, P<0.001; ****, P<0.0001 compared with HK-2.
Figure 13.
The expression levels of APOL1, COL5A3, TNFSF13B, and CDH5 in the tumor tissue and adjacent normal tissue. *, P<0.05; **, P<0.01.
Figure 14.
Immunohistochemistry staining was performed to validate the differential expressions of APOL1, TNFSF13B, CDH5, and COL5A3 using ccRCC samples from our clinical center. Scale bar: 50 µm. ccRCC, clear cell renal cell carcinoma.
Discussion
CcRCC is a common malignant tumor of the urinary system. The global morbidity rate of ccRCC continues to rise (1). Renal cancer accounts for about 4% of malignant diseases in adults (1) and has the highest annual mortality rate of urinary tract tumors (3). Innovative and multimodal treatment strategies have provided a large number of ccRCC patients with new options and prolonged their survival to a certain extent; however, the curative effects are still unsatisfactory in some patients (2,4,6).
Studies have shown that ERS is activated in multiple solid tumors and is associated with a variety of malignant biological behaviors, such as tumor cell blood vessel production, genome instability, radiotherapy and chemotherapy resistance, autophagy, and abnormal energy metabolism (7,8,10). RCC is essentially a metabolic disease characterized by the reprogramming of energetic metabolism (33-36). Notably, the metabolic flux through glycolysis is partitioned (35,37,38), and mitochondrial bioenergetics and oxidative phosphorylation are impaired, as is lipid metabolism (39-42). Accumulating research has shown that the ERS-related activation of an unfolded protein response plays a role in regulating cell metabolism, and lipid metabolism in particular. Emerging evidence suggests that the activation of specific metabolic pathways has a role in regulating angiogenesis and inflammatory signatures (43,44).
In our study, we obtained the gene expression profile data of 632 tumor tissue samples and 171 normal tissue samples from the GEO and TCGA databases and screened and identified 550 differentially expressed ERS-related genes associated with ccRCC. A further LASSO regression analysis identified 11 eigengenes related to ERS, and a diagnostic model was then constructed. Through TCGA and the integrated GEO data set, high AUC values were obtained. Our diagnostic model had outstanding diagnostic performance.
We found that APOL1, COL5A3, TNFSF13B, and CDH5 were all related to the prognosis of patients with ccRCC. APOL1 belongs to the APOL gene family, a minor component of high-density lipoprotein, which is associated with a variety of cancers. In previous studies, APOL1 was shown to be highly elevated in various cancers (15-18). Lin et al. found that APOL1 was significantly up-regulated in pancreatic cancer and was associated with advanced pathological stage, lymph node metastasis, and distant metastasis, and could be used as both a prognostic biomarker and a new diagnostic target for pancreatic cancer patients (19). COL5A3 is a member of the collagen triple helical repeat family and plays a role in cell proliferation, differentiation, apoptosis, migration, and carcinogenesis (20). It has been shown to play a key role in breast cancer brain metastasis and radiosensitivity in rectal cancer (21,22). Amrutkar et al. found that COL5A3 promotes the chemoresistance of pancreatic cancer cells to gemcitabine (23). TNFSF13B is a member of the TNF superfamily. As a B lymphocyte stimulator, it is important for the survival, proliferation, and differentiation of B cells (24). In addition, TNFSF13B effectively promotes the apoptosis of various tumor cells, such as human lymphoma cells (U937), prostate cancer cells (PC-3), colon cancer cells (HT-29), cervical cancer cells (HeLa), breast cancer cells (MCF-7), and embryonic kidney cells (A293) (25). Previous studies have confirmed that TNFSF13B can not only predict the prognosis of ccRCC patients, but is also an important mediator of information transmission between tumor cells and the tumor microenvironment, and is a potential therapeutic target (26). CDH5 is aberrantly expressed in a variety of human cancers, such as papillary RCC, lung adenocarcinoma, and breast cancer, and it plays an important role in angiogenesis (27).
We then analyzed the gene expression characteristics, identified 540 DEGs related to ERS, and performed a functional enrichment analysis. The GO function analysis showed that in addition to participating in ERS, these DEGs are also involved in T cell activation, leukocyte cell-cell adhesion, the response to oxygen levels, the regulation of cell-cell adhesion, antigen processing and presentation, and the response to hypoxia. ccRCC is considered an immunomodulatory disease with abundant immune infiltration (28,29). Features of the tumor microenvironment greatly affect disease biology and may affect responses to systemic therapy (42,45-47).
Among many ERS-DEGs, previous studies have shown that the high expression of TNFSF13B is mainly involved in some immune-related functions, and its expression is positively correlated with the abundance of activated CD4+ memory T cells, regulatory T cells, and CD8+ T cells (30,31). CD8+ T cell infiltration is associated with a good prognosis in most cancers, including bladder and lung cancer (32). Xiong et al. reported that infiltrating CD8+ T cells were associated with a poorer prognosis in ccRCC, and the authors also suggested that immunosuppressive immune cells, such as regulatory T cells, might suppress the anti-tumor effects of CD8+ T cells (48).
ERS has a profound effect on the proliferation and survival of cancer cells, and it also has the ability to activate cells of the adaptive immune system. In other tumors, the activation of ERS can stimulate the phagocytosis of dendritic cells, thereby activating CD8+ T cells, triggering a dependent anti-tumor immune response, and ultimately increasing the sensitivity of tumor cells to antigen-specific CD8+ T cell-mediated killing (49). Thus, consistent with the results of this study, the higher the expression level of TNFSF13B, the higher the stage of the patients.
The GSEA showed that the differentially expressed ERS-related genes of ccRCC mainly affect the activation of the immune response and adaptive immune response. The unfavorable microenvironmental conditions that predominate in most tumor types can significantly disrupt endoplasmic reticulum homeostasis and cause the abnormal unfolded protein response activation of infiltrating immune cells (50). Previous studies have shown that unresolved ERS enables pancreatic ductal adenocarcinoma to evade immunity and establish latent metastasis (51). In addition, studies have found that the ERS response further hinders the development of protective anti-cancer immunity by manipulating the function of immune cells in the tumor microenvironment (52).
The present study had some limitations. First, to fully reflect the factors that affect the microenvironmental phenotype of ccRCC, the clinical characteristics of more patients should have been included. Second, the sample size of each subtype was relatively small in the training set and the validation set, and only the GEO and TCGA data sets were used for verification, which might have led to inaccurate results and high false positive rates. Finally, while we constructed a PPI network, a hub gene-miRNA network and a hub gene-TF network, further in vivo and in vitro experiments still need to be conducted.
Conclusions
Our study suggests that the five signature genes associated with ERS may serve as prognostic indicators for clinical decision making in the treatment of ccRCC patients. A multi-omics analysis of the role of these genes in the promotion of ccRCC tumors may shed new light on the mechanisms underlying ccRCC.
Supplementary
The article’s supplementary files as
Acknowledgments
Funding: This work was supported by the Chongqing Young and Middle-Aged High-End Medical Talents Project Fund.
Ethical Statement: The authors are accountable for all aspects of the work in ensuring that questions related to the accuracy or integrity of any part of the work are appropriately investigated and resolved. The study was conducted in accordance with the Declaration of Helsinki (as revised in 2013). The study was approved by the Ethics Committee of the First Affiliated Hospital of Chongqing Medical University (Ethical Application Ref: 2022-120) and informed consent was obtained from all the patients.
Footnotes
Reporting Checklist: The authors have completed the TRIPOD reporting checklist. Available at https://tau.amegroups.com/article/view/10.21037/tau-23-374/rc
Data Sharing Statement: Available at https://tau.amegroups.com/article/view/10.21037/tau-23-374/dss
Peer Review File: Available at https://tau.amegroups.com/article/view/10.21037/tau-23-374/prf
Conflicts of Interest: All authors have completed the ICMJE uniform disclosure form (available at https://tau.amegroups.com/article/view/10.21037/tau-23-374/coif). The authors have no conflicts of interest to declare.
References
- 1.Siegel RL, Miller KD, Jemal A. Cancer statistics, 2020. CA Cancer J Clin 2020;70:7-30. 10.3322/caac.21590 [DOI] [PubMed] [Google Scholar]
- 2.Gulati S, Vaishampayan U. Current State of Systemic Therapies for Advanced Renal Cell Carcinoma. Curr Oncol Rep 2020;22:26. 10.1007/s11912-020-0892-1 [DOI] [PubMed] [Google Scholar]
- 3.Capitanio U, Bensalah K, Bex A, et al. Epidemiology of Renal Cell Carcinoma. Eur Urol 2019;75:74-84. 10.1016/j.eururo.2018.08.036 [DOI] [PMC free article] [PubMed] [Google Scholar]
- 4.Clark DJ, Dhanasekaran SM, Petralia F, et al. Integrated Proteogenomic Characterization of Clear Cell Renal Cell Carcinoma. Cell 2019;179:964-983.e31. 10.1016/j.cell.2019.10.007 [DOI] [PMC free article] [PubMed] [Google Scholar]
- 5.Turajlic S, Swanton C, Boshoff C. Kidney cancer: The next decade. J Exp Med 2018;215:2477-9. 10.1084/jem.20181617 [DOI] [PMC free article] [PubMed] [Google Scholar]
- 6.Formisano L, Napolitano F, Rosa R, et al. Mechanisms of resistance to mTOR inhibitors. Crit Rev Oncol Hematol 2020;147:102886. 10.1016/j.critrevonc.2020.102886 [DOI] [PubMed] [Google Scholar]
- 7.Ros M, Nguyen AT, Chia J, et al. ER-resident oxidoreductases are glycosylated and trafficked to the cell surface to promote matrix degradation by tumour cells. Nat Cell Biol 2020;22:1371-81. 10.1038/s41556-020-00590-w [DOI] [PubMed] [Google Scholar]
- 8.Chen X, Cubillos-Ruiz JR. Endoplasmic reticulum stress signals in the tumour and its microenvironment. Nat Rev Cancer 2021;21:71-88. 10.1038/s41568-020-00312-2 [DOI] [PMC free article] [PubMed] [Google Scholar]
- 9.Fotia G, Stellato M, Guadalupi V, et al. Current Status of Predictive Biomarker Development in Metastatic Renal Cell Carcinoma. Curr Oncol Rep 2023;25:671-7. 10.1007/s11912-023-01395-4 [DOI] [PubMed] [Google Scholar]
- 10.Li J, He J, Fu Y, et al. Hepatitis B virus X protein inhibits apoptosis by modulating endoplasmic reticulum stress response. Oncotarget 2017;8:96027-34. 10.18632/oncotarget.21630 [DOI] [PMC free article] [PubMed] [Google Scholar]
- 11.Okubo K, Sato A, Isono M, et al. Nelfinavir Induces Endoplasmic Reticulum Stress and Sensitizes Renal Cancer Cells to TRAIL. Anticancer Res 2018;38:4505-14. 10.21873/anticanres.12754 [DOI] [PubMed] [Google Scholar]
- 12.Okubo K, Isono M, Asano T, et al. Panobinostat and Nelfinavir Inhibit Renal Cancer Growth by Inducing Endoplasmic Reticulum Stress. Anticancer Res 2018;38:5615-26. 10.21873/anticanres.12896 [DOI] [PubMed] [Google Scholar]
- 13.Correia de Sousa M, Delangre E, Türkal M, et al. Endoplasmic Reticulum Stress in Renal Cell Carcinoma. Int J Mol Sci 2023;24:4914. 10.3390/ijms24054914 [DOI] [PMC free article] [PubMed] [Google Scholar]
- 14.Isono M, Sato A, Okubo K, et al. Ritonavir Interacts With Belinostat to Cause Endoplasmic Reticulum Stress and Histone Acetylation in Renal Cancer Cells. Oncol Res 2016;24:327-35. 10.3727/096504016X14666990347635 [DOI] [PMC free article] [PubMed] [Google Scholar]
- 15.Chidiac M, Fayyad-Kazan M, Daher J, et al. ApolipoproteinL1 is expressed in papillary thyroid carcinomas. Pathol Res Pract 2016;212:631-5. 10.1016/j.prp.2016.04.004 [DOI] [PubMed] [Google Scholar]
- 16.Zhong F, Lu HP, Chen G, et al. The clinical significance of apolipoprotein L1 in head and neck squamous cell carcinoma. Oncol Lett 2020;20:377. 10.3892/ol.2020.12240 [DOI] [PMC free article] [PubMed] [Google Scholar]
- 17.Jing S, Tian J, Zhang Y, et al. Identification of a new pseudogenes/lncRNAs-hsa-miR-26b-5p-COL12A1 competing endogenous RNA network associated with prognosis of pancreatic cancer using bioinformatics analysis. Aging (Albany NY) 2020;12:19107-28. 10.18632/aging.103709 [DOI] [PMC free article] [PubMed] [Google Scholar]
- 18.Jian L, Yang G. Identification of Key Genes Involved in Diabetic Peripheral Neuropathy Progression and Associated with Pancreatic Cancer. Diabetes Metab Syndr Obes 2020;13:463-76. 10.2147/DMSO.S235011 [DOI] [PMC free article] [PubMed] [Google Scholar]
- 19.Lin J, Xu Z, Xie J, et al. Oncogene APOL1 promotes proliferation and inhibits apoptosis via activating NOTCH1 signaling pathway in pancreatic cancer. Cell Death Dis 2021;12:760. 10.1038/s41419-021-03985-1 [DOI] [PMC free article] [PubMed] [Google Scholar]
- 20.Fischer H, Stenling R, Rubio C, et al. Colorectal carcinogenesis is associated with stromal expression of COL11A1 and COL5A2. Carcinogenesis 2001;22:875-8. 10.1093/carcin/22.6.875 [DOI] [PubMed] [Google Scholar]
- 21.Ge C, Wu M, Chen G, et al. Identification of molecular characteristics induced by radiotherapy in rectal cancer based on microarray data. Oncol Lett 2017;13:2777-83. 10.3892/ol.2017.5750 [DOI] [PMC free article] [PubMed] [Google Scholar]
- 22.Zhang L, Wang L, Yang H, et al. Identification of potential genes related to breast cancer brain metastasis in breast cancer patients. Biosci Rep 2021;41:BSR20211615. 10.1042/BSR20211615 [DOI] [PMC free article] [PubMed] [Google Scholar]
- 23.Amrutkar M, Aasrum M, Verbeke CS, et al. Secretion of fibronectin by human pancreatic stellate cells promotes chemoresistance to gemcitabine in pancreatic cancer cells. BMC Cancer 2019;19:596. 10.1186/s12885-019-5803-1 [DOI] [PMC free article] [PubMed] [Google Scholar]
- 24.Schneider P, MacKay F, Steiner V, et al. BAFF, a novel ligand of the tumor necrosis factor family, stimulates B cell growth. J Exp Med 1999;189:1747-56. 10.1084/jem.189.11.1747 [DOI] [PMC free article] [PubMed] [Google Scholar]
- 25.Mao Y, Alimu P, Wang C, et al. High TNFSF13B expression as a predictor of poor prognosis in adrenocortical carcinoma. Transl Androl Urol 2021;10:3275-85. 10.21037/tau-21-232 [DOI] [PMC free article] [PubMed] [Google Scholar]
- 26.Jiang M, Lin J, Xing H, et al. Microenvironment-related gene TNFSF13B predicts poor prognosis in kidney renal clear cell carcinoma. PeerJ 2020;8:e9453. 10.7717/peerj.9453 [DOI] [PMC free article] [PubMed] [Google Scholar]
- 27.Mehrpour Layeghi S, Arabpour M, Esmaeili R, et al. Evaluation of the potential role of long non-coding RNA LINC00961 in luminal breast cancer: a case-control and systems biology study. Cancer Cell Int 2020;20:478. 10.1186/s12935-020-01569-1 [DOI] [PMC free article] [PubMed] [Google Scholar]
- 28.Jawanda GG, Drachenberg D. Spontaneous regression of biopsy proven primary renal cell carcinoma: A case study. Can Urol Assoc J 2012;6:E203-5. 10.5489/cuaj.11035 [DOI] [PMC free article] [PubMed] [Google Scholar]
- 29.Sheng IY, Rini BI. Immunotherapy for renal cell carcinoma. Expert Opin Biol Ther 2019;19:897-905. 10.1080/14712598.2019.1628946 [DOI] [PubMed] [Google Scholar]
- 30.Luo J, Xie Y, Zheng Y, et al. Comprehensive insights on pivotal prognostic signature involved in clear cell renal cell carcinoma microenvironment using the ESTIMATE algorithm. Cancer Med 2020;9:4310-23. 10.1002/cam4.2983 [DOI] [PMC free article] [PubMed] [Google Scholar]
- 31.Ma T, Meng L, Wang X, et al. TNFSF13B and PPARGC1A expression is associated with tumor-infiltrating immune cell abundance and prognosis in clear cell renal cell carcinoma. Am J Transl Res 2021;13:11048-64. [PMC free article] [PubMed] [Google Scholar]
- 32.Fridman WH, Zitvogel L, Sautès-Fridman C, et al. The immune contexture in cancer prognosis and treatment. Nat Rev Clin Oncol 2017;14:717-34. 10.1038/nrclinonc.2017.101 [DOI] [PubMed] [Google Scholar]
- 33.Lucarelli G, Loizzo D, Franzin R, et al. Metabolomic insights into pathophysiological mechanisms and biomarker discovery in clear cell renal cell carcinoma. Expert Rev Mol Diagn 2019;19:397-407. 10.1080/14737159.2019.1607729 [DOI] [PubMed] [Google Scholar]
- 34.di Meo NA, Lasorsa F, Rutigliano M, et al. Renal Cell Carcinoma as a Metabolic Disease: An Update on Main Pathways, Potential Biomarkers, and Therapeutic Targets. Int J Mol Sci 2022;23:14360. 10.3390/ijms232214360 [DOI] [PMC free article] [PubMed] [Google Scholar]
- 35.De Marco S, Torsello B, Minutiello E, et al. The cross-talk between Abl2 tyrosine kinase and TGFβ1 signalling modulates the invasion of clear cell Renal Cell Carcinoma cells. FEBS Lett 2023;597:1098-113. 10.1002/1873-3468.14531 [DOI] [PubMed] [Google Scholar]
- 36.di Meo NA, Lasorsa F, Rutigliano M, et al. The dark side of lipid metabolism in prostate and renal carcinoma: novel insights into molecular diagnostic and biomarker discovery. Expert Rev Mol Diagn 2023;23:297-313. 10.1080/14737159.2023.2195553 [DOI] [PubMed] [Google Scholar]
- 37.Lucarelli G, Galleggiante V, Rutigliano M, et al. Metabolomic profile of glycolysis and the pentose phosphate pathway identifies the central role of glucose-6-phosphate dehydrogenase in clear cell-renal cell carcinoma. Oncotarget 2015;6:13371-86. 10.18632/oncotarget.3823 [DOI] [PMC free article] [PubMed] [Google Scholar]
- 38.Ragone R, Sallustio F, Piccinonna S, et al. Renal Cell Carcinoma: A Study through NMR-Based Metabolomics Combined with Transcriptomics. Diseases 2016;4:7. 10.3390/diseases4010007 [DOI] [PMC free article] [PubMed] [Google Scholar]
- 39.Bianchi C, Meregalli C, Bombelli S, et al. The glucose and lipid metabolism reprogramming is grade-dependent in clear cell renal cell carcinoma primary cultures and is targetable to modulate cell viability and proliferation. Oncotarget 2017;8:113502-15. 10.18632/oncotarget.23056 [DOI] [PMC free article] [PubMed] [Google Scholar]
- 40.Lucarelli G, Rutigliano M, Sallustio F, et al. Integrated multi-omics characterization reveals a distinctive metabolic signature and the role of NDUFA4L2 in promoting angiogenesis, chemoresistance, and mitochondrial dysfunction in clear cell renal cell carcinoma. Aging (Albany NY) 2018;10:3957-85. 10.18632/aging.101685 [DOI] [PMC free article] [PubMed] [Google Scholar]
- 41.Bombelli S, Torsello B, De Marco S, et al. 36-kDa Annexin A3 Isoform Negatively Modulates Lipid Storage in Clear Cell Renal Cell Carcinoma Cells. Am J Pathol 2020;190:2317-26. 10.1016/j.ajpath.2020.08.008 [DOI] [PubMed] [Google Scholar]
- 42.Lucarelli G, Rutigliano M, Loizzo D, et al. MUC1 Tissue Expression and Its Soluble Form CA15-3 Identify a Clear Cell Renal Cell Carcinoma with Distinct Metabolic Profile and Poor Clinical Outcome. Int J Mol Sci 2022;23:13968. 10.3390/ijms232213968 [DOI] [PMC free article] [PubMed] [Google Scholar]
- 43.Lucarelli G, Rutigliano M, Ferro M, et al. Activation of the kynurenine pathway predicts poor outcome in patients with clear cell renal cell carcinoma. Urol Oncol 2017;35:461.e15-27. 10.1016/j.urolonc.2017.02.011 [DOI] [PubMed] [Google Scholar]
- 44.Netti GS, Lucarelli G, Spadaccino F, et al. PTX3 modulates the immunoflogosis in tumor microenvironment and is a prognostic factor for patients with clear cell renal cell carcinoma. Aging (Albany NY) 2020;12:7585-602. 10.18632/aging.103169 [DOI] [PMC free article] [PubMed] [Google Scholar]
- 45.Ghini V, Laera L, Fantechi B, et al. Metabolomics to Assess Response to Immune Checkpoint Inhibitors in Patients with Non-Small-Cell Lung Cancer. Cancers (Basel) 2020;12:3574. 10.3390/cancers12123574 [DOI] [PMC free article] [PubMed] [Google Scholar]
- 46.Lasorsa F, di Meo NA, Rutigliano M, et al. Immune Checkpoint Inhibitors in Renal Cell Carcinoma: Molecular Basis and Rationale for Their Use in Clinical Practice. Biomedicines 2023;11:1071. 10.3390/biomedicines11041071 [DOI] [PMC free article] [PubMed] [Google Scholar]
- 47.Lasorsa F, Rutigliano M, Milella M, et al. Cellular and Molecular Players in the Tumor Microenvironment of Renal Cell Carcinoma. J Clin Med 2023;12:3888. 10.3390/jcm12123888 [DOI] [PMC free article] [PubMed] [Google Scholar]
- 48.Xiong Y, Wang Z, Zhou Q, et al. Identification and validation of dichotomous immune subtypes based on intratumoral immune cells infiltration in clear cell renal cell carcinoma patients. J Immunother Cancer 2020;8:e000447. 10.1136/jitc-2019-000447 [DOI] [PMC free article] [PubMed] [Google Scholar]
- 49.Lee SY, Oh JY, Kang TH, et al. Endoplasmic reticulum stress enhances the antigen-specific T cell immune responses and therapeutic antitumor effects generated by therapeutic HPV vaccines. J Biomed Sci 2019;26:41. 10.1186/s12929-019-0536-7 [DOI] [PMC free article] [PubMed] [Google Scholar]
- 50.Song M, Cubillos-Ruiz JR. Endoplasmic Reticulum Stress Responses in Intratumoral Immune Cells: Implications for Cancer Immunotherapy. Trends Immunol 2019;40:128-41. 10.1016/j.it.2018.12.001 [DOI] [PubMed] [Google Scholar]
- 51.Pommier A, Anaparthy N, Memos N, et al. Unresolved endoplasmic reticulum stress engenders immune-resistant, latent pancreatic cancer metastases. Science 2018;360:eaao4908. 10.1126/science.aao4908 [DOI] [PMC free article] [PubMed] [Google Scholar]
- 52.Cubillos-Ruiz JR, Bettigole SE, Glimcher LH. Tumorigenic and Immunosuppressive Effects of Endoplasmic Reticulum Stress in Cancer. Cell 2017;168:692-706. 10.1016/j.cell.2016.12.004 [DOI] [PMC free article] [PubMed] [Google Scholar]
Associated Data
This section collects any data citations, data availability statements, or supplementary materials included in this article.
Supplementary Materials
The article’s supplementary files as


