Abstract
Introduction:
Glypican-3 (GPC3) is a surface-bound proteoglycan overexpressed in pediatric liver cancer and utilized clinically as an immunohistochemical tumor marker. Furin is a proprotein convertase that is ubiquitously expressed and shown to modify GPC3 post-translationally. In experimental models of epithelial-based cancers, furin inhibition decreased tumor cell migration and proliferation representing a potential therapeutic target.
Methods:
Using a synthetic furin inhibitor, we evaluated proliferation, migration, protein, and RNA expression in two liver cancer cell lines, HepG2 (GPC3-positive) and SKHep1 cells (GPC3-negative). Total furin protein and GPC3 protein expression were assessed to evaluate functional levels of furin.
Results:
There was a reduction in HepG2 proliferation with addition of furin inhibitor at the 48-h timepoint, however there was an increase in HepG2 migration.
Conclusions:
GPC3 cleavage in hepatoblastoma (HB) has a role in cell proliferation with therapeutic potential, however furin inhibition is not an appropriate target for GPC3-expressing HB due to increased migration which may enhance metastatic potential.
Keywords: Furin inhibition, Glypican-3, Hepatoblastoma, Migration, Proliferation
Introduction
Hepatoblastoma (HB) is the most common primary malignant liver tumor in children. Annual incidence is approximately 1.5 cases per million in the United States, increasing by 2.7% annually.1,2 HB is thought to arise from hepatocyte precursor cells, as well as differentiated hepatic stem cells or human liver multipotent progenitor cells.3–5 Currently, efforts are being made to understand the pathogenesis of HB. Experimental models to study HB are limited and work is in progress to expand in vivo and in vitro systems to better recapitulate the disease.6,7
Glypican 3 (GPC3) is the second most overexpressed gene in a study of 48 HB tumors compared to normal liver.8,9 Although normally expressed in fetal liver, the oncofetal protein is absent in adult liver tissues.10–12 GPC3 is one of six members of the heparan sulfate proteoglycan family of proteins which localizes to many parts of the cell, including cell membrane via GPI anchor.13 The known biological role of GPC3 is as a key regulator in several cell signaling pathways, including WNT, Hedgehog (HH), BMP and FGF, leading to morphogenesis in the developing embryo due to tissue- and cell-specific expression.14–17 The differential effect of GPC3 on these signaling pathways has been attributed to the various forms of GPC3 present in the cell resulting from extensive post-translational modification.13,18,19
Furin, a proprotein convertase enzyme, cleaves GPC3 into 30 kDa C-terminal domain and 40 kDa N-terminal domain.20,21 Furin is expressed ubiquitously throughout tissues and has many substrates including matrix metalloproteinases, cell adhesion molecules, and growth factors that have direct implications for cancer development.22–24 Although the biological significance of GPC3 cleavage products is unclear, studies have suggested that cleaved GPC3 is required for HH signaling; however, full-length GPC3 is able to stimulate WNT pathway in normal development.25–29
GPC3 is currently being used as a biomarker of HB at the molecular, histologic, and serum level; however, its role in tumor development remains unclear.18,30,31 GPC3 has been associated with liver cancer for over 30 y, first found to be upregulated in hepatocellular carcinoma.32 Since that time, studies have shown that GPC3 acts as an oncogene in hepatocellular carcinoma (HCC) and lung squamous cell carcinoma and tumor suppressor in breast, ovarian, renal and gastric cancer.33–37 Prior research suggests that the protein structure and cleavage of GPC3 is important for progression of liver cancer.21,29
Due to overexpression of GPC3 in HB, we hypothesize that this molecule plays a role in HB pathogenesis. In this study, we demonstrate that serial treatment of an HB cell line with furin inhibitor (FI) decreases the protein expression of cleaved GPC3 subunits and leads to reduced cellular proliferation. However, furin inhibition also induces increased cell migration and morphologic changes.
Materials and Methods
Patient subjects
Human background liver and HB tumor were collected from patient resection specimens under conditions appropriate for characterization and mechanistic studies with institutional review board approval (IRB # 2016-9497) and informed patient consent.
Cell culture
HepG2, a GPC3-expressing HB cell line, and SKHep1, a GPC3-negative liver adenocarcinoma cell line,38–41 were purchased from American Type Culture Collection (ATCC) and confirmed to be mycoplasma free using MycoAlert PLUS (Lonza) and MycoStrip (InvivoGen). HepG2 and SKHep1 cells were cultured in Dulbecco’s Modified Eagle Medium (DMEM) supplemented with 10% fetal bovine serum (FBS), 1% nonessential amino acids (NEAA) and 1% Penicillin-streptomycin (PS; Penicillin 10,000 units/mL; Streptomycin 10,000 μg/mL) and were cultured at 37C, 5% CO2, and 90% humidity.
For RNA and protein analysis, HepG2 and SKHep1 cells were plated on 6-well dishes (150,000 cells/well and 100,000 cells/well, respectively). Cells were serum starved for 24 h using DMEM with 1% FBS, 1% NEAA, and 1% PS. HepG2 and SKHep1 cells were treated with 100uM Furin inhibitor II (FI product number SCP0148; Sigma–Aldrich, St. Louis, MO, USA) for varying time intervals indicated in figure legends.42,43
HepG2 Crispr/Cas9 GPC3 knock out (KO) cells were generated by the Cincinnati Children’s Hospital (CCHMC) Transgenic Animal and Genome Editing Core using 1000 ng Cas9 and 250 ng fluorescent gRNA per reaction and electroporation following prior reported protocol.44 Clones were screened by amplifying a target GPC3 region by PCR (PCR primer sequence-P1 vs7904 CTCTAGTCATAGCTTTGTTCTGC, P2 Vs7905 TCAAGCACTCTACTCAGAAGAAC) and followed by Sanger sequencing for KO confirmation. Sequencing confirmed a 13 bp insertion and 170 bp deletion that results in premature stop codon, knocking out GPC3 within two clones.
Transfection/peptide addition
GPC3 peptides for full length (FL), N, and C terminal protein fragments were generated by Genscript using the ExpiCHO expression system. Peptide was added to cell culture at 1μg/mL for each condition. Transfections were completed using Lipofectamine 2000 following manufacturer’s suggested protocol and 1mg of plasmid DNA (pCDNA3.4-EV, pCDNA3.4-GPC3N, pCDNA3.4-GPC3C, and pCDNA3.4-GPC3-FL).
WST-1 cell proliferation assay
HepG2 and SKHep1 cells were plated in 96-well dish (10,000 cells/well and 5000 cells/well, respectively). As mentioned above, the cells were serum starved for 24 h prior to treatment with 100 μM FI for a final volume of 100 μL/well. The cells were treated with Premix WST-1 (Takara Bio Inc) following manufacturer’s instructions and incubated at 37C for an hour. Absorbance was measured using Synergy HI microplate reader (BioTek).
Scratch wound healing assay
HepG2, SKHep1, and HepG2 GPC3 KO cells were plated on 6-well dish as above. After incubation, cells were serum starved for 24 h. A scratch wound was made using a pipette tip with the long-axial of the tip perpendicular to the bottom of the well.45 Cells were then washed to remove detached cells. Media was replaced, along with 100uM FI. Cells were then imaged using Nikon Ti or Ts2 microscopes at 24 h and 48 h after treatment and scratch. Wound closure was calculated by obtaining distance of each scratch closure using Nikon Elements software to measure distance between the wound edges.
Immunofluorescence
Paraffin sections from background liver and HB tumor samples were used to perform IF staining after sections were deparaffinized and rehydrated. Antibodies were diluted in phosphate-buffered saline (PBS) containing 2% BSA and 0.05% tween 20. Tissue sections were incubated overnight at 4°C, washed with PBS +0.05% tween 20, and then visualized with fluorescent secondary antibody for 1 h at room temperature.
HepG2 and SKHep1 cells were plated on chamber slides. Cells were serum starved for 24 h, and then treated with 100uM FI for 24 h and 48 h. After treatment, cells were fixed with 1% PFA then permeabilized and blocked with 4% normal goat serum with 0.25% Triton X-100 in PBS for an hour at room temperature (RT). Primary antibodies for IF staining of cells were incubated overnight at 4°C. Secondary antibody was added the following day for 1 h at room temperature. Antibodies are listed in Supplemental Table S1. All slides were visualized with a Nikon Ti microscope.
Real-time PCR–expression and western blot analysis
For analysis of transcriptional gene expression, RNA was isolated from cells using RNeasy Plus Mini Kit from Qiagen. cDNA was prepared using VILO cDNA synthesis kit from Invitrogen. Polymerase chain reaction was performed using RT2 SYBR green master mix (Qiagen) in a CFX Connect real-time thermocycler (BioRad). RT2 primer assay gene primers were purchased from Qiagen. Primers used are listed in Supplemental Table S1. Assays were performed in triplicate on each independent sample.
For protein analysis, cell lysates were prepared using Mammalian Cell Lysis Kit (Sigma–Aldrich). A 1x stock sample loading buffer was prepared using 4x Laemmli buffer plus beta-mercaptoethanol. Protein samples were run on 4% to 15% polyacrylamide gels using a Biorad system. Protein was transferred to nitrocellulose membrane. Antibodies are listed in Supplemental Table S1.
Statistical analysis
Data analysis was performed using GraphPad Prism 9.0.0. Normality was evaluated using Q-Q plot. T-test and ANOVA were used to evaluate normally distributed data. Appropriate nonparametric testing was performed for non-normally distributed data. Significance is indicated in the figures and associated legends * = P < 0.05, ** = P < 0.01, *** = P < 0.001, and **** = P < 0.0001.
Results
GPC3 cleavage in HB
GPC3 overexpression in human HB tumor is well established; however, the role of GPC3 in HB pathogenesis is unclear. Using immunofluorescence, we evaluated GPC3 expression in tumor of HB patients compared to adjacent background liver. Relevant clinical data has been previously published.46 We endeavored to evaluate the presence of each separate subunit within our samples using antibodies targeting the N-terminus (40 kDa) and C-terminus (30 kDa) GPC3 subunits. Compared to background, there was elevated expression of GPC3 in HB tumor as indicated by colocalization of staining from both N- and C-terminal antibodies consistent with presumed full length GPC3 (Fig. 1A, white arrow) and regions with single N- or C-terminal staining (Fig. 1A, yellow arrow). Assessment of GPC3 protein expression in human HB samples demonstrated presence of full length (70 kDa) and cleaved N-terminal (40 kDa) subunit. (Fig. 1B).
Fig. 1 –
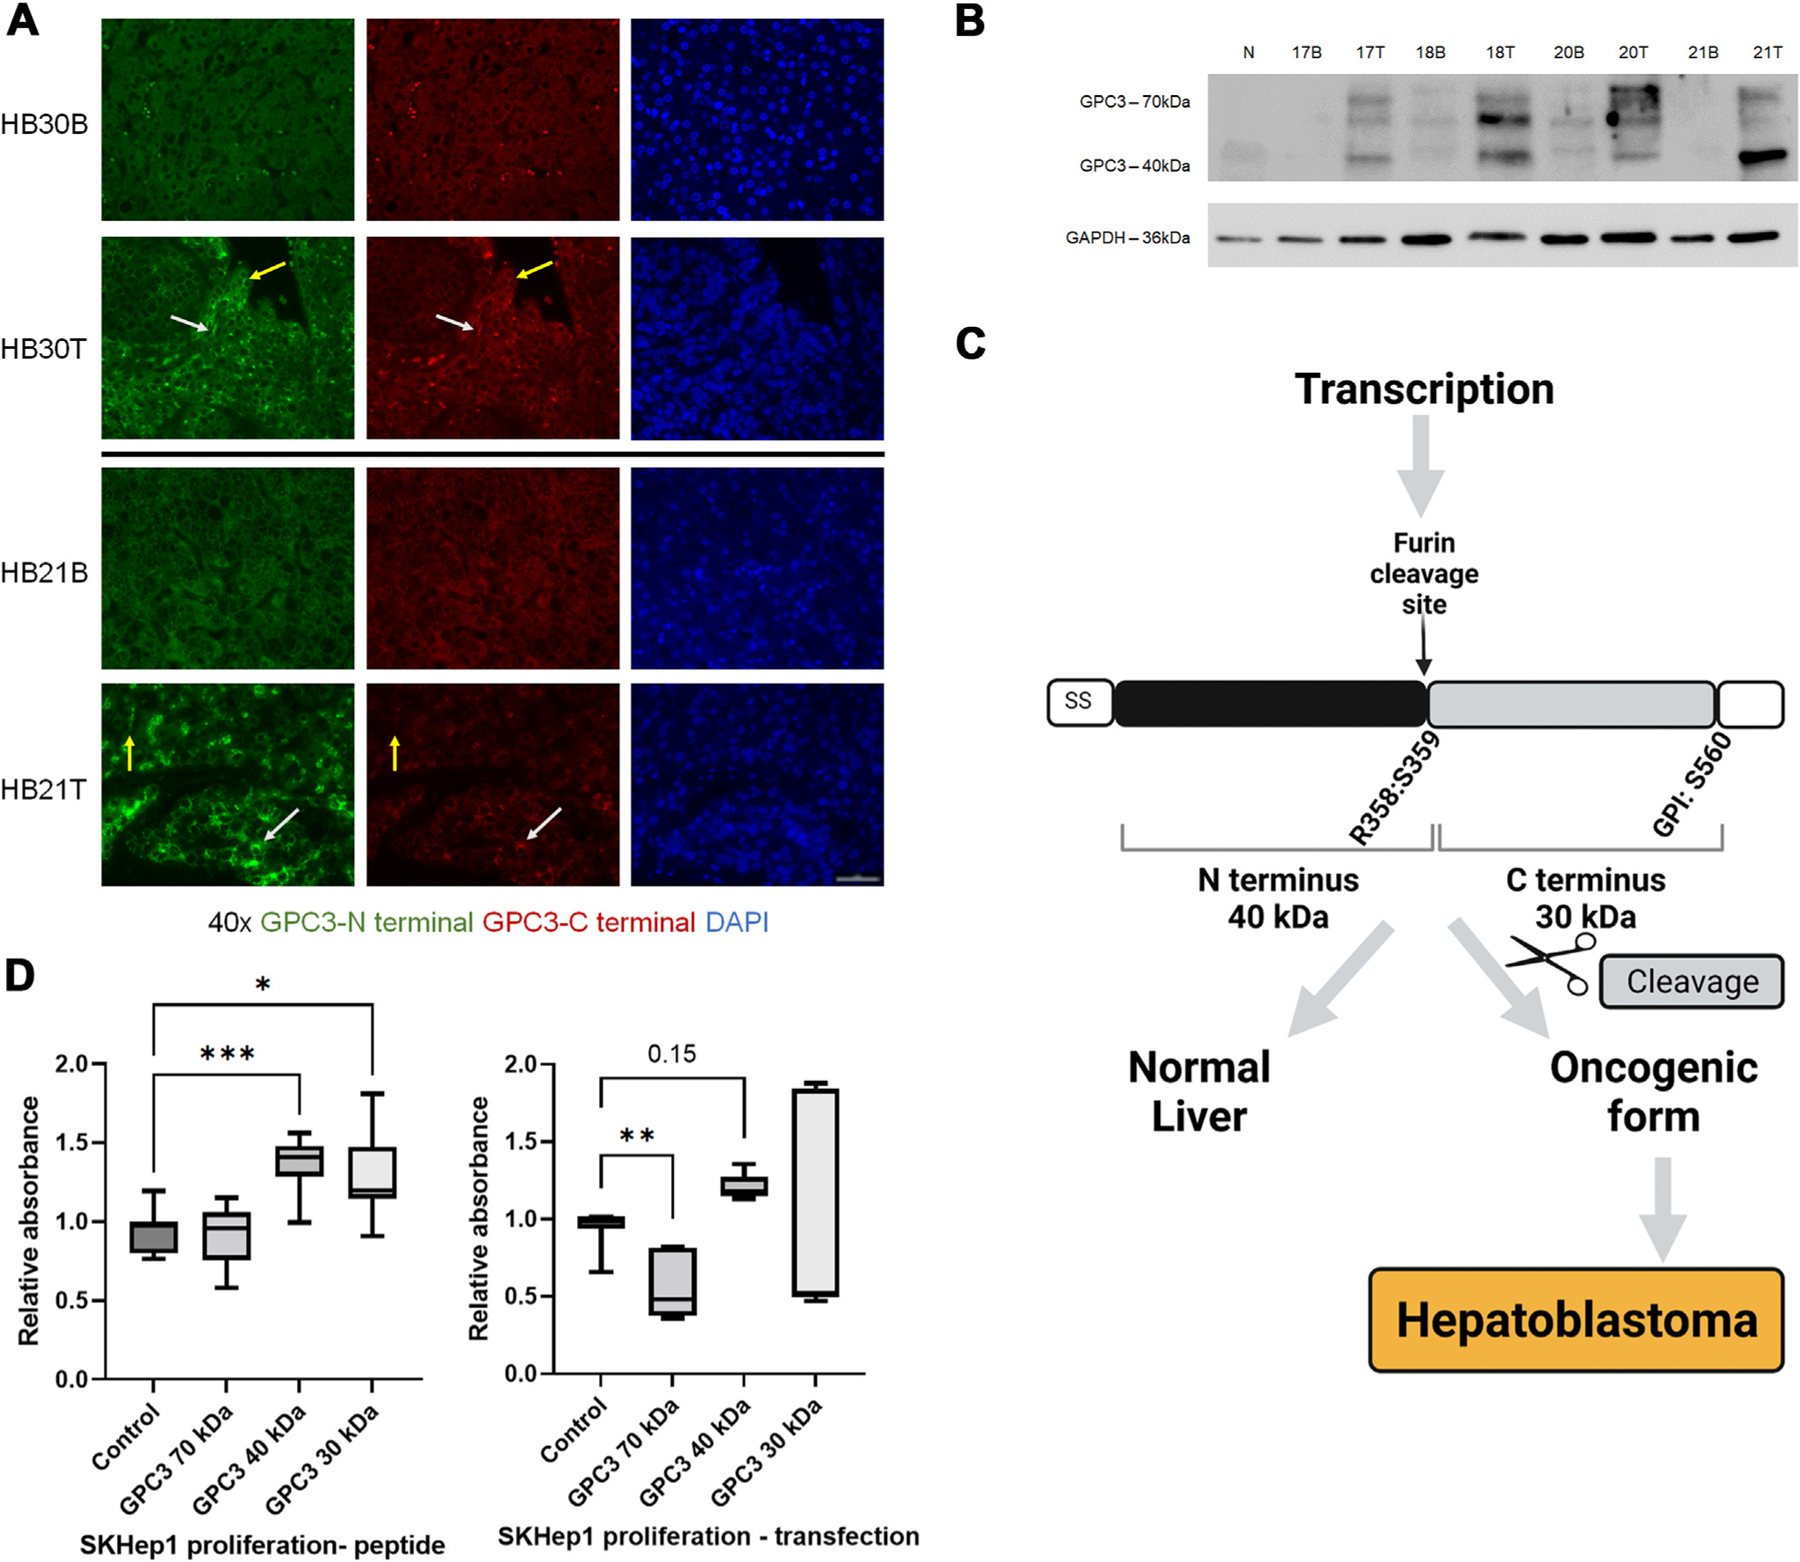
GPC3 cleavage as a potential target to reduce tumor growth. (A) Background (B) and tumor (T) from HB specimens shows increased GPC3 expression in tumor with areas of localization of presumed full-length (70 kDa) GPC3 (white arrow) and areas with N-terminus (40 kDa) staining only (yellow arrow) (40X objective, scale bar 50um). Five patient samples were evaluated with representative images shown. (B) Western blot of normal liver (N), human background (B) and tumor (T) samples from three HB patients (17, 18, 21 B/T), and one HCC patient (20 B/T), showing elevated GPC3 in tumor with more abundant GPC3 40 kDa cleaved product in HB compared to HCC (50 kDa band is also observed in tumor). Eight additional patient T/B samples were evaluated (data not shown). (C) Schematic demonstrating potential phenomena for an oncogenic form of proteins as a result of aberrant cleavage. Image created by BioRender.com. (D) Addition of cleaved GPC3 products (40 kDa and 30 kDa subunit peptides) and DNA construct transfection into SKHep1 cells results in increased proliferation with no change or reduced growth seen in cells treated with full-length (70 kDa) GPC3.
We hypothesize that overexpression of the cleaved products of GPC3 is critical to the pathogenesis of HB as demonstrated by our schematic in Figure 1C. SKHep1 cell line was used to further explore this hypothesis. Although SKHep1 cell line is derived from liver adenocarcinoma, it is one of the few cell lines available that does not express GPC3 and is commonly used in studies of liver cancer and GPC3.38,40,47 Addition of GPC3 peptide or transfection of SKHep1 cells demonstrated that GPC3 cleavage products, not full-length protein drive cell growth (Fig. 1D). These findings support the idea that convertase activity is needed for increased proliferation in vitro.
As discussed, furin has many different substrates that can be affected by use of an inhibitor. In Supplemental Figure S1A, we have demonstrated reduced expression of a subset of furin substrates including TNF, TGF-beta, E-cadherin, and N-cadherin in six human HB tumors. Although not comprehensive, these findings support the use of FI as a proxy to evaluate GPC3 following furin inhibition in HB.
Treatment with furin inhibitor reduces cleaved GPC3 in HB cell lines
We evaluated expression of GPC3 and its cleaved forms at early two-hour intervals and longer intervals after single treatment with FI.
Figure 2A and B demonstrate HepG2 and SKHep1 protein expression changes for full-length (70 kDa) and N-terminal (40 kDa) GPC3, as well as furin protein. In HepG2 cells, N-terminal (40 kDa) GPC3 expression is reduced within 4 h after treatment with FI and sustained through 48 h (Fig. 2A). There was no reduction of full-length (70 kDa) GPC3 at early or later timepoints. Furin protein expression was reduced at 48 h in HepG2 cells and at 4 and 6 h in SKHep1 cells, but was elevated at 48 h in the latter (Fig. 2B).
Fig. 2 –
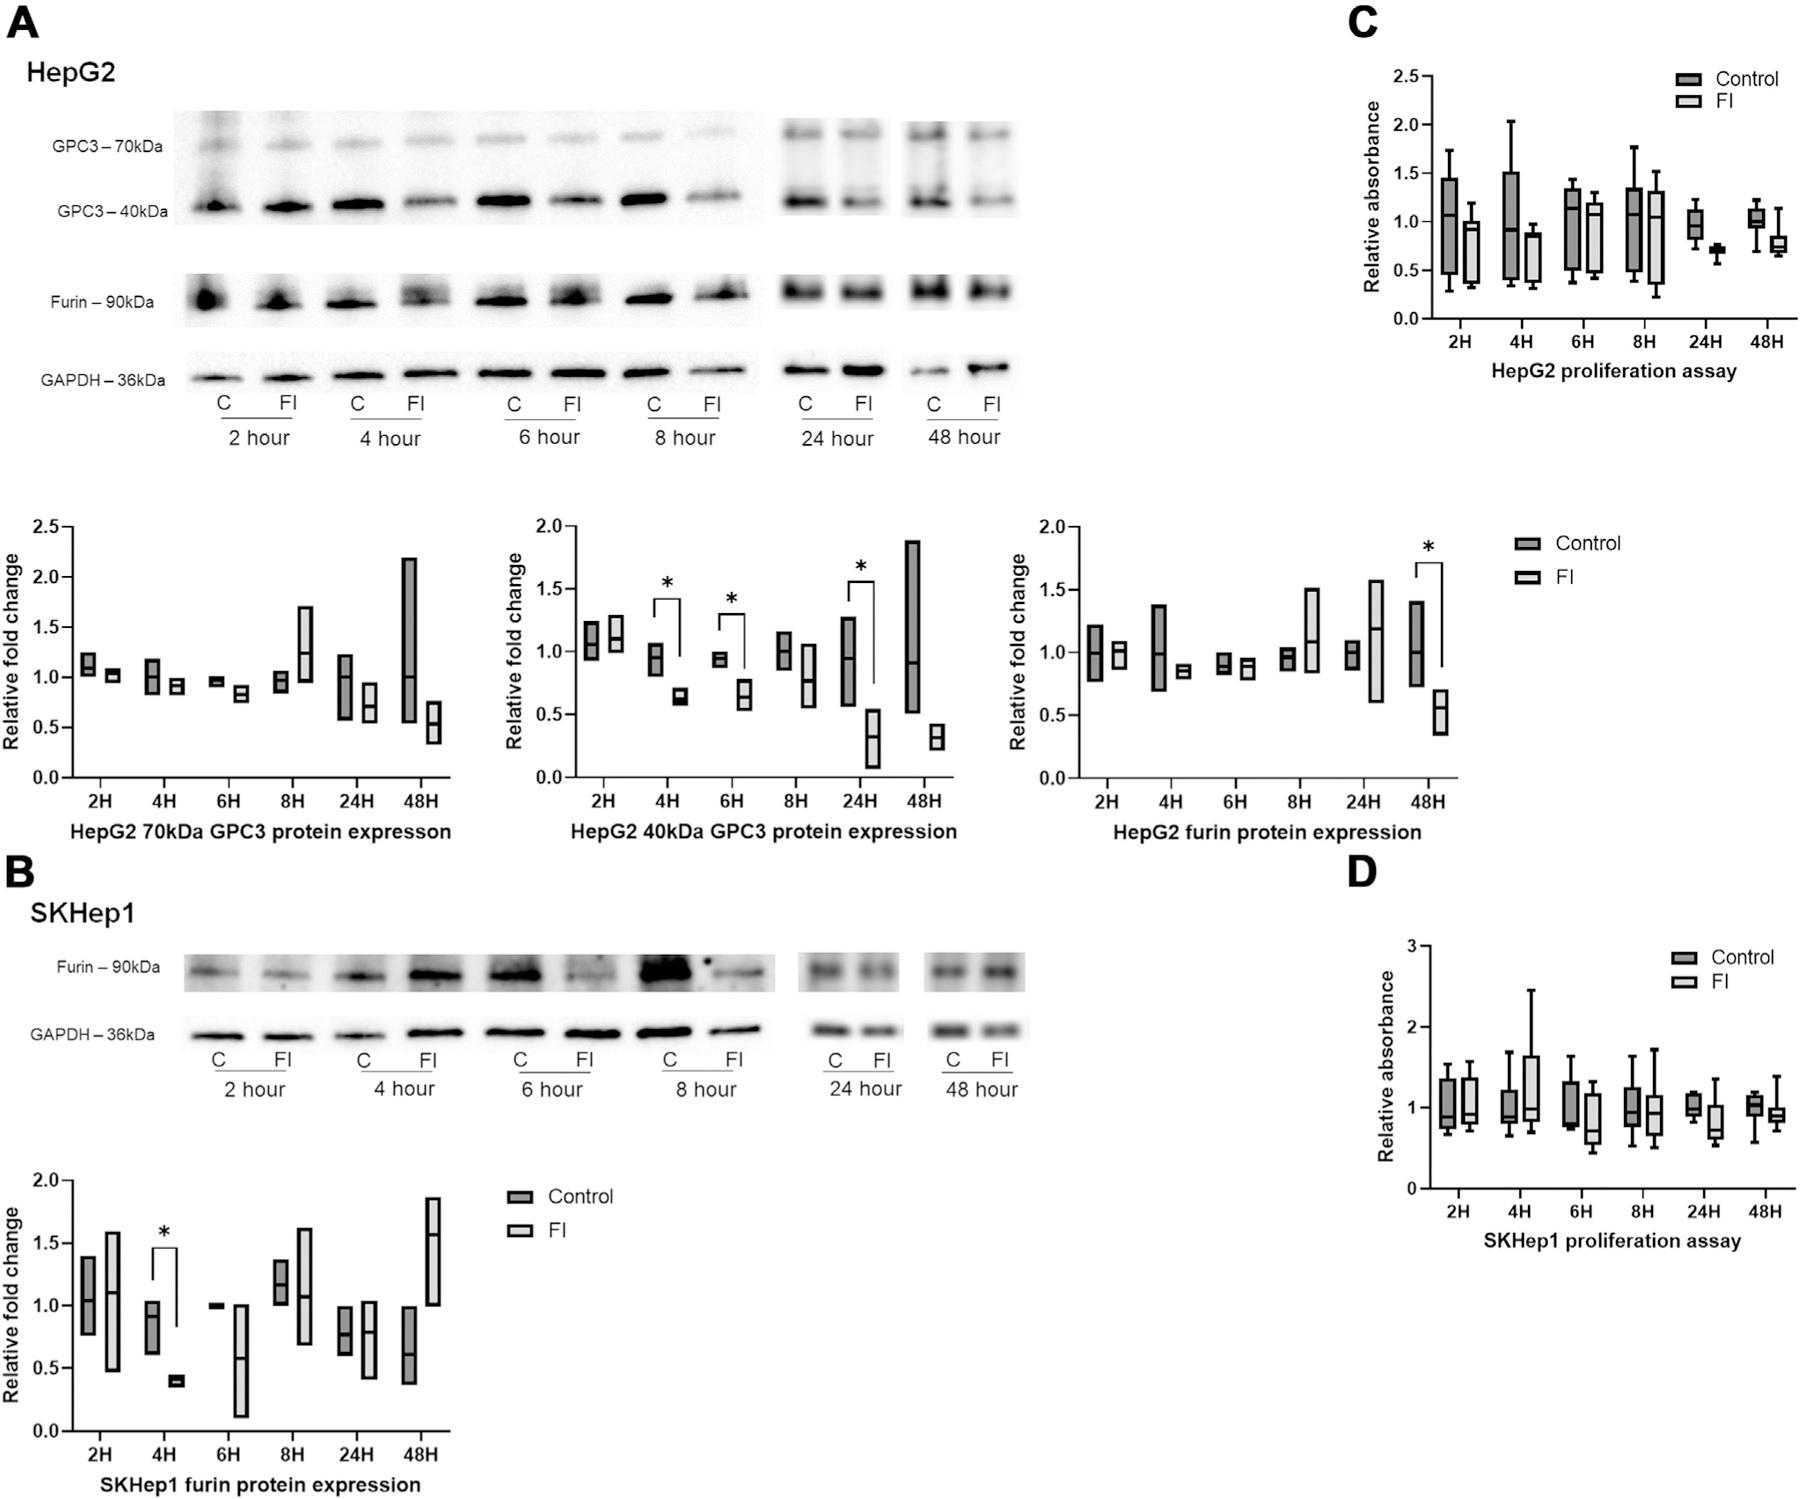
Furin inhibition moderates GPC3 cleavage with minimal reduction in cell growth after single treatment. (A) N-terminal (40 kDa) GPC3 protein expression is reduced in HepG2 cells treated with FI compared to control (C) at four and 6 h with sustained reduction through 48 h after single treatment. No change seen in full-length (70 kDa) or furin protein expression. (B) Furin protein expression in SKHep1 cells had variable response to FI, with no prominent trend. (C) HepG2 cells treated with FI and evaluated at early (2, 4, 6, 8 h) and late (24 and 48 h) time points showed no significant reduction in proliferation. (D) SKHep1 cell proliferation was unchanged after single treatment with FI.
Gene expression for GPC3 and furin were not significantly or consistently altered after treatment with FI in either cell line, which suggest that the effect of treatment is at the protein level and has minimal effect on gene expression (Supplemental Fig. S2A). There were no significant changes in proliferation of HepG2 or SKHep1 cells after single treatment with FI (Fig. 2C and 2D).
Our data indicate that furin inhibitor begins to inhibit GPC3 cleavage at early timepoints, but a single dose is insufficient to drive significant changes in proliferation. However, we did observe phenotypic changes in HepG2 cell morphology creating a more uniform single cellular appearance that warranted further evaluation (Supplemental Fig. S1B).
Furin inhibition induces morphological changes and reduces expression of cytoskeletal and adhesion proteins
As discussed, furin inhibition caused changes in HepG2 cell ultrastructure suggesting that furin inhibition may lead to cytoskeletal reorganization. (Supplemental Fig. S1B). In addition, we have rescued cells treated with FI by addition of full-length GPC3 peptide (Supplemental Fig. S1B). After 24 h, there is evidence of increased clustering of cells indicating that although GPC3 is not sufficient to independently drive the morphological changes observed, there is a prominent role for this protein in observed changes following furin inhibition.
We evaluated HepG2 and SKHep1 cell morphology and structure using immunofluorescence after single treatment with FI. HepG2 cells showed reduction of E-cadherin and GPC3 at 24 h after treatment with FI (Fig. 3A). HepG2 cells also showed reduced or reorganized F-actin (phalloidin), a key cytoskeletal protein, as well as RhoA which has a role in cell adhesion and migration (Fig. 3A). SKHep1 cells demonstrated no differences in abundance or pattern in these same proteins at 24 h, and as expected SKHep1 cells have no GPC3 expression (Fig. 3B).
Fig. 3 –
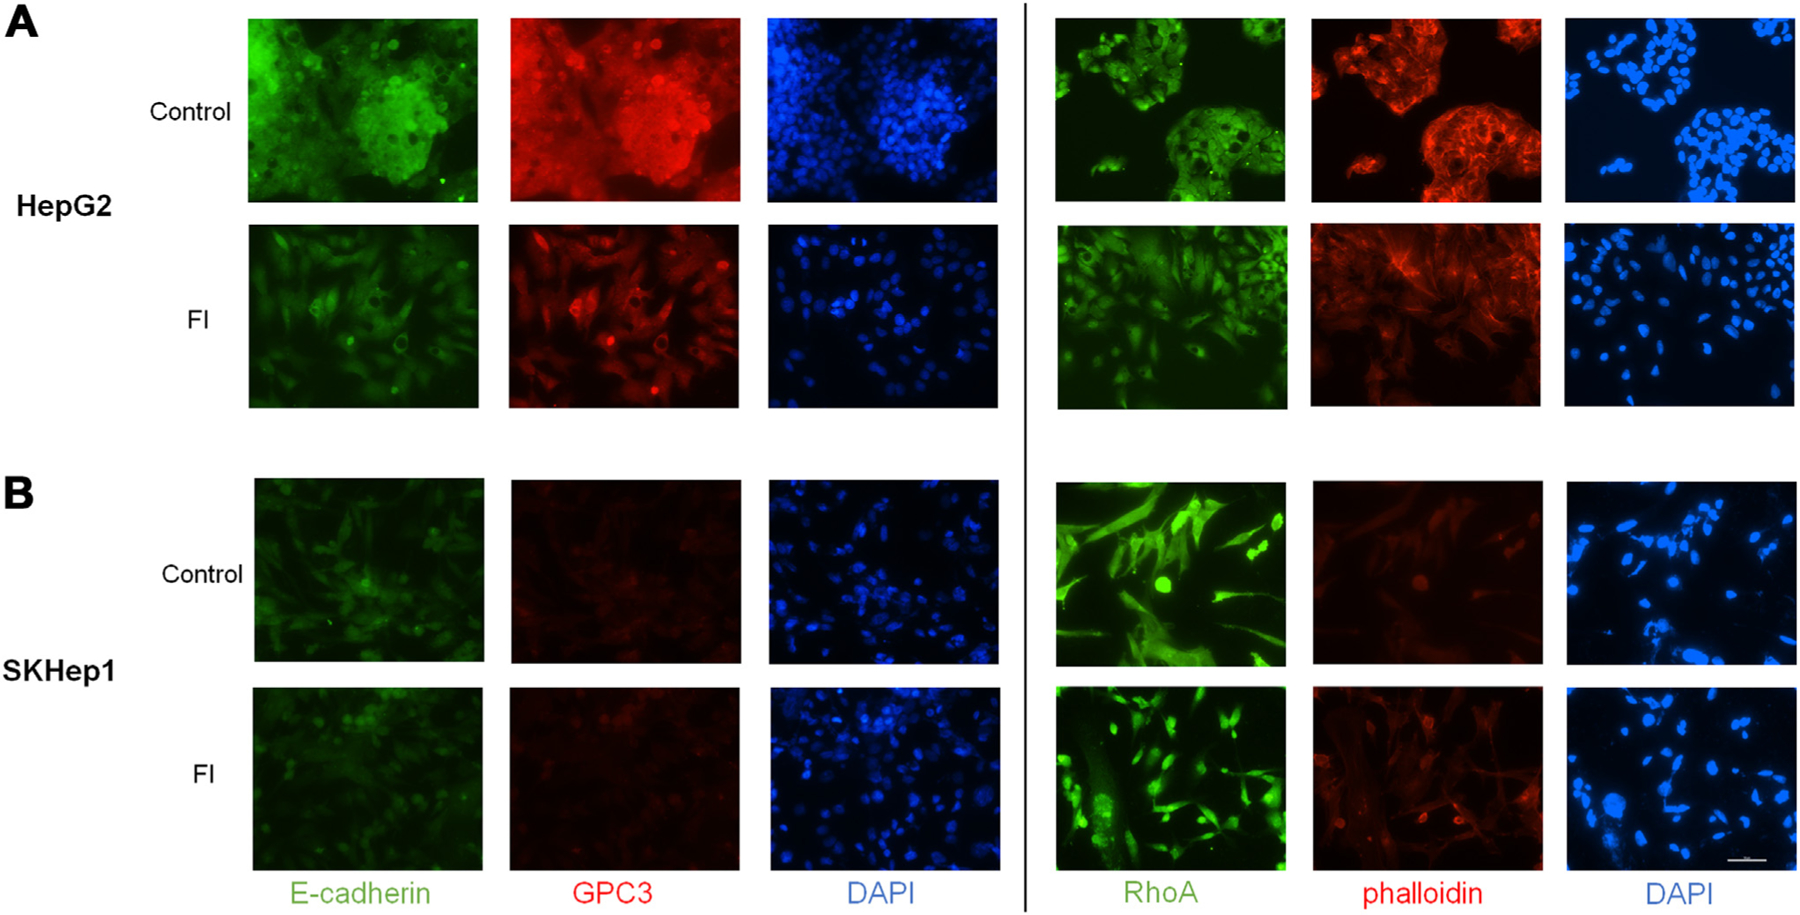
Furin inhibition induces morphological changes and reduces expression of cytoskeletal and adhesion proteins. (A) HepG2 cells show reduced protein expression of E-cadherin as well as reorganization and potential reduction of total GPC3 at 24 h after FI treatment compared to control cells. RhoA and phalloidin after 24-h treatment with FI show reduction and reorganization. (B) No clear change in staining is observed in SKHep1 cells in FI treated cells compared to control although there may be some reorganization of RhoA. GPC3 staining is negative in SKHep1 cells as expected (20X objective, scale bar 100 μm).
Multiple dosing of FI drives sustained proliferation reduction through reduced GPC3 cleavage but also drives HepG2 cell migration
HepG2 and SKHep1 cells were treated at 8-h (q8h) and 24-h (q24 h) intervals with FI and evaluated at 24 h and 48 h for sustained proliferation changes and evaluation of cell migration using scratch assay (Figs. 4 and 5). After treatment with FI, we observed reduced N-terminal (40 kDa) GPC3 as expected based on single dose treatment (Fig. 4A). At 48 h, both q8h and q24h dosing schemes elicit a statistically significant reduction of HepG2 proliferation following FI (Fig. 4B). Although we see no proliferative changes at 24 h, reduced protein expression at this timepoint may influence downstream effectors of cell division as demonstrated by reduced proliferation at 48 h.
Fig. 4 –
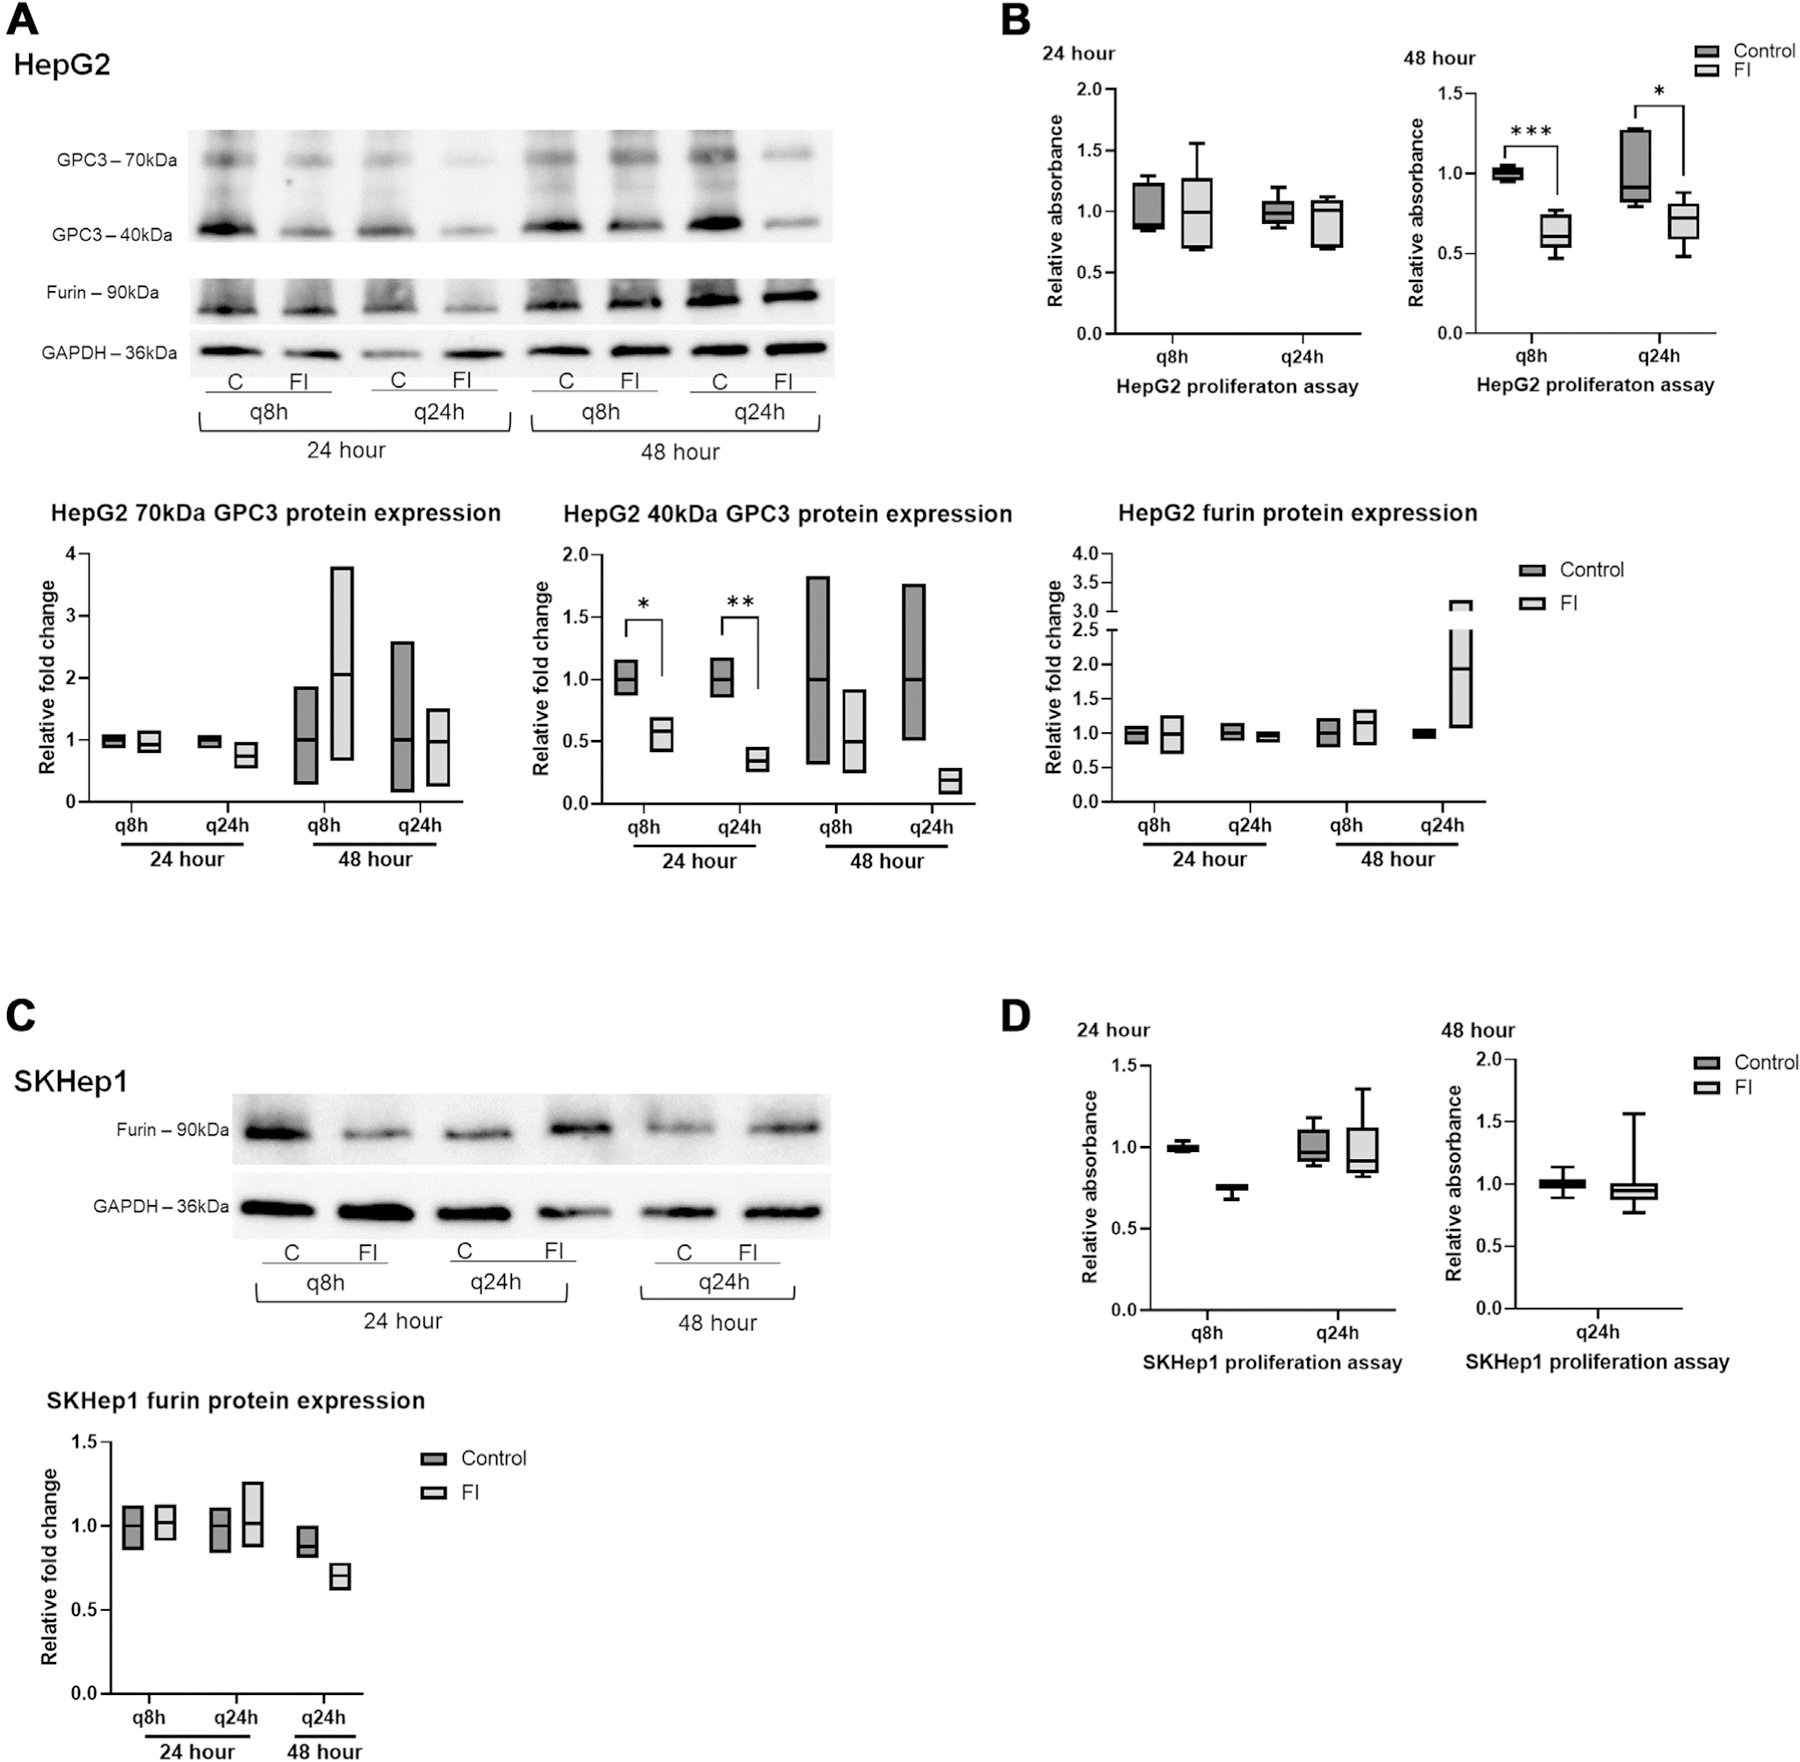
Multiple dosing of FI elicits greater reduction in proliferation. (A) N-terminal GPC3 protein expression is reduced in HepG2 cells with control (C) and furin inhibitor (FI) shown for each treatment regimen at 24 h and 48 h. Full-length GPC3 and furin protein expression was not significantly changed. (B) Reduced proliferation was observed 48 h after treatment of HepG2 cells with FI every 8 h (q8h) and every 24 h (q24h), but not at 24 h. (C) Furin protein expression in SKHep1 cells after treatment with FI showed no significant change between control and treated cells. (D) SKHep1 proliferation at 24 h and 48 h in SKHep1 cells after treatment with 100 μM furin inhibitor every 8 h (q8h) and 24 h (q24h) showed no significant change. At the 48 h timepoint, q8h dosing resulted in cell death preventing analysis.
Fig. 5 –
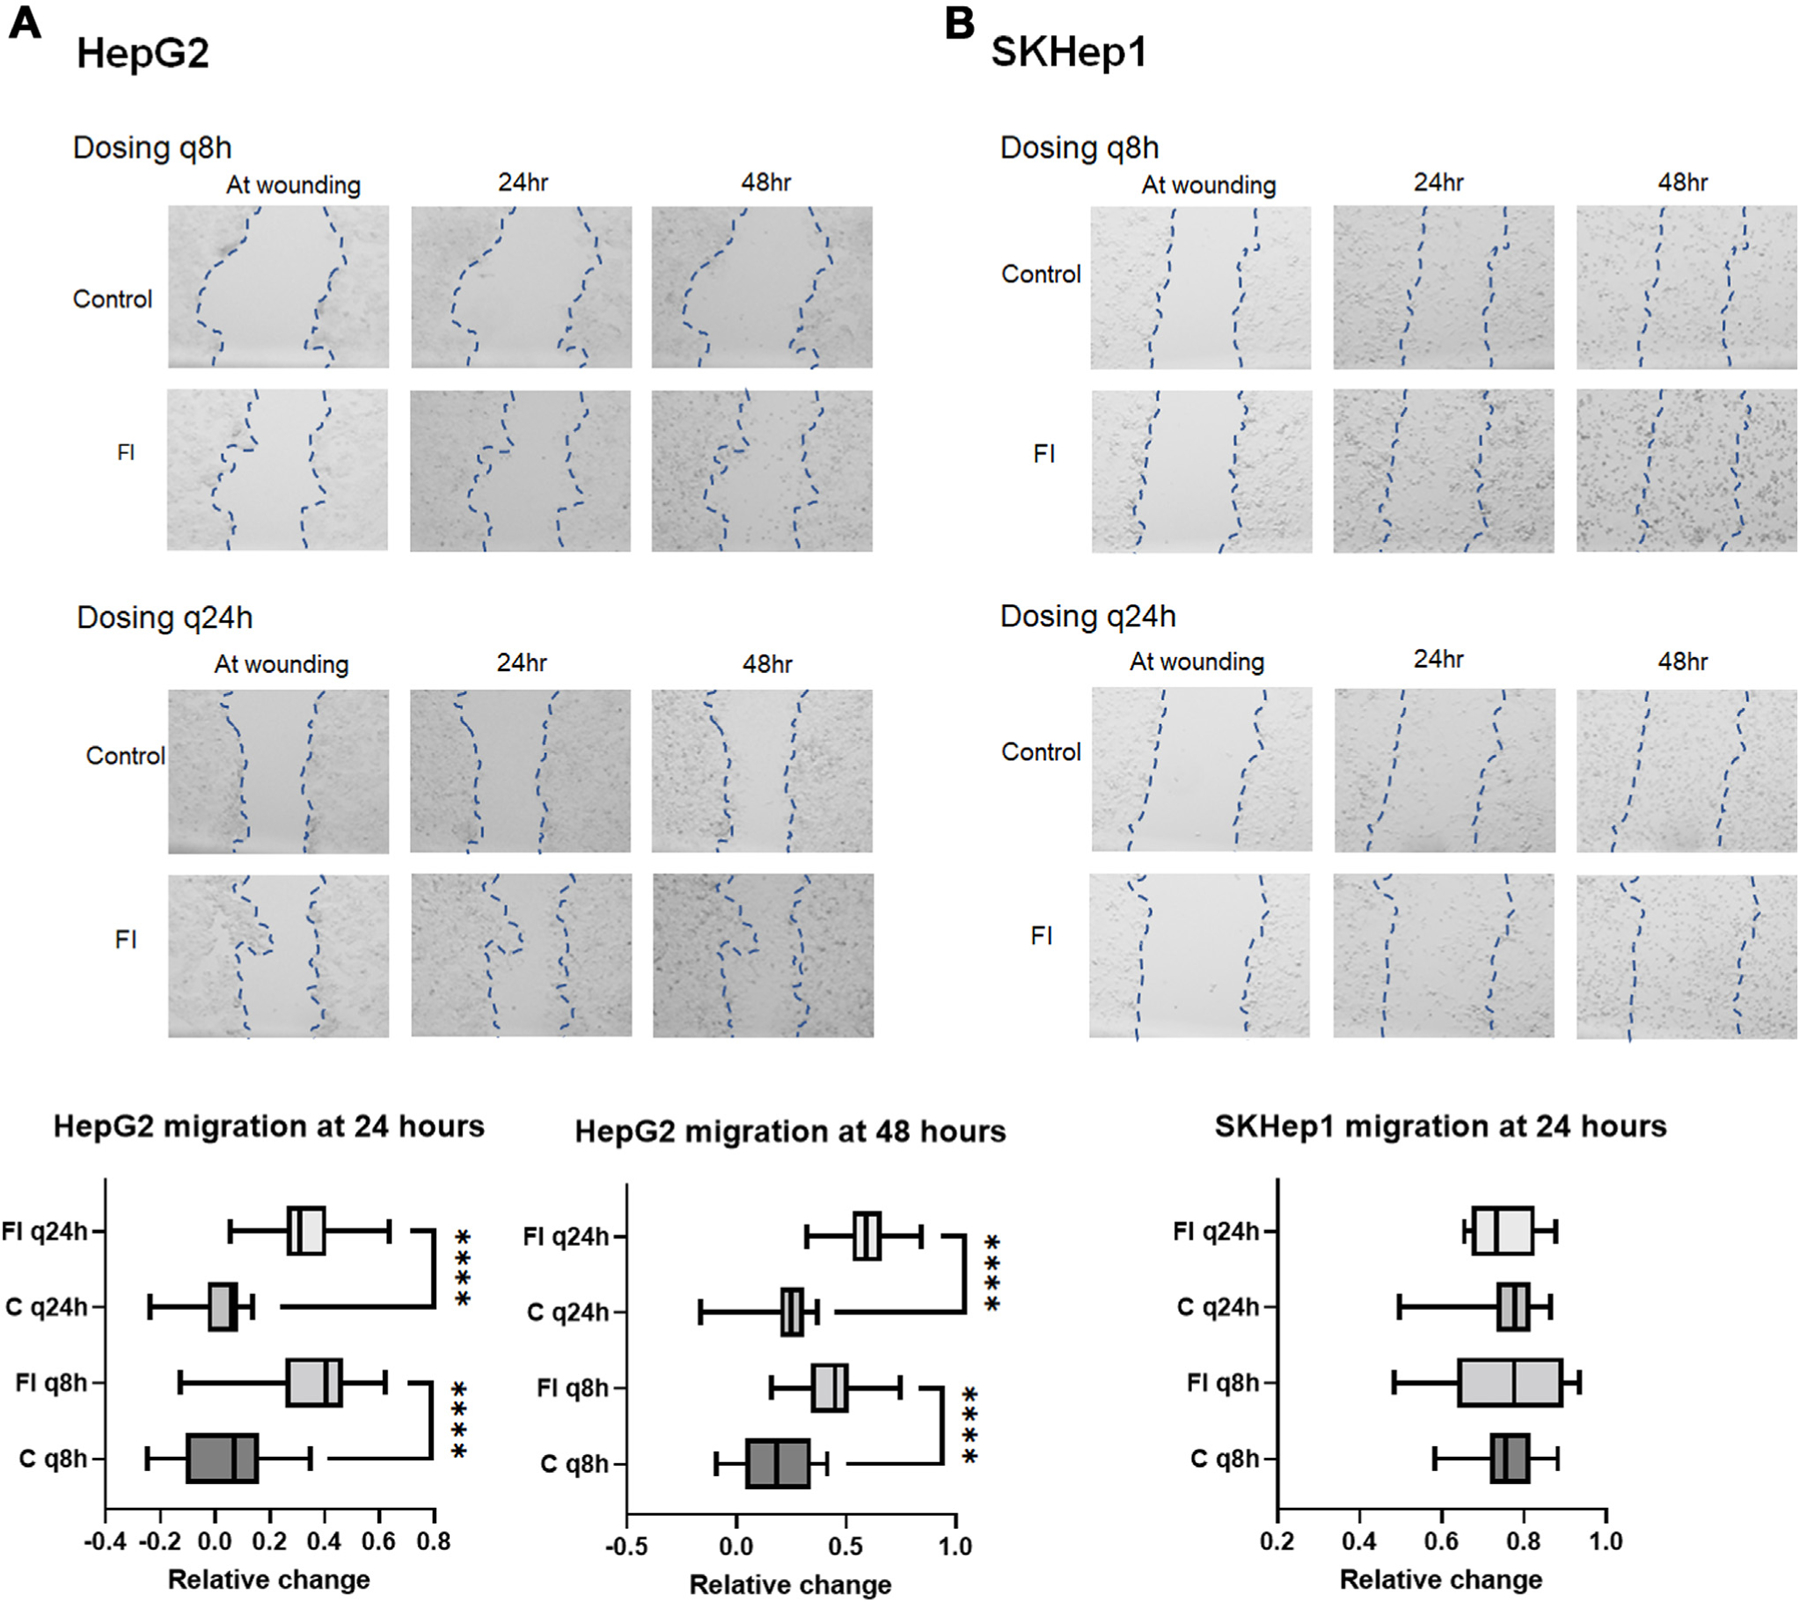
FI increases HepG2 migration. (A) Migration of cells was minimal in control HepG2 cells. With q8h FI, migration is increased with some variability compared to the control, but with q24h treatment, migration was greatly increased following multiple doses of FI as shown in the bar graphs for 24 h and 48 h of treatment. (B) SKHep1 cells show no difference in migration compared to control for either treatment arm, but cell morphology/floating cells in q8h arm suggests significant cell death. (4x images zoomed 6.5x to visualize wound area-EVOS XL). Graphs for each experiment depict the average difference of individual measurements from replicate experiments across time points by measuring wound width at multiple points.
SKHep1 furin protein expression was not changed and GPC3 was not expressed (Fig. 4C). As observed with single treatment of FI, there were no consistent changes in gene expression in either cell line regardless of treatment scheme (Supplemental S2B). SKHep1 did not show any changes in proliferation with either dosing scheme at 24 h or 48 h. Migration of HepG2 cells following FI was significantly increased at both 24 h and 48 h post treatment and with both treatment arms (Fig. 5A). SKHep1 cells did not demonstrate increased cell migration at any timepoint or with either treatment arm, however increased cell death was observed at 48 h with the q8h dosing as seen in Figure 5B (small dark punctate SKHep1 cells were rounded and often floating).
Addition of FL GPC3 increases proliferation in GPC3 KO cells and rescues FI treated HepG2 cells
Following combination treatment with FI and FL GPC3 and HepG2 cells show moderate rescue from reduced proliferation seen with FI alone at 48 h, although no statistical difference is seen by ANOVA (Supplemental Fig. S1C). To further understand if GPC3 has a role in proliferation, we utilized Crispr-modified GPC3 KO HepG2 cells. GPC3 KO cells were generated using HepG2 cells and Crispr/Cas9 gene editing with guide RNA and a PAM site near the GPC3 furin cleavage site, which resulted in a premature stop codon in exon 4 of GPC3. Sanger sequencing confirmed these changes in two KO clones (Fig. 6A and B). GPC3 KO cells were treated with FI and FL GPC3 peptide and combination treatment of FI and FL GPC3 peptide given simultaneously to rescue cells from the proliferation reduction seen previously in FI treated HepG2 cells. At 24 h, FL GPC3 increased proliferation with a similar effect as seen with FI, supporting the role of GPC3 in the response of wild type HepG2 cells to FI (Fig. 6C). At 48 h, there is increased proliferation in cells treated with FL peptide and combined FI and FL GPC3 (Fig. 6C).
Fig. 6 –
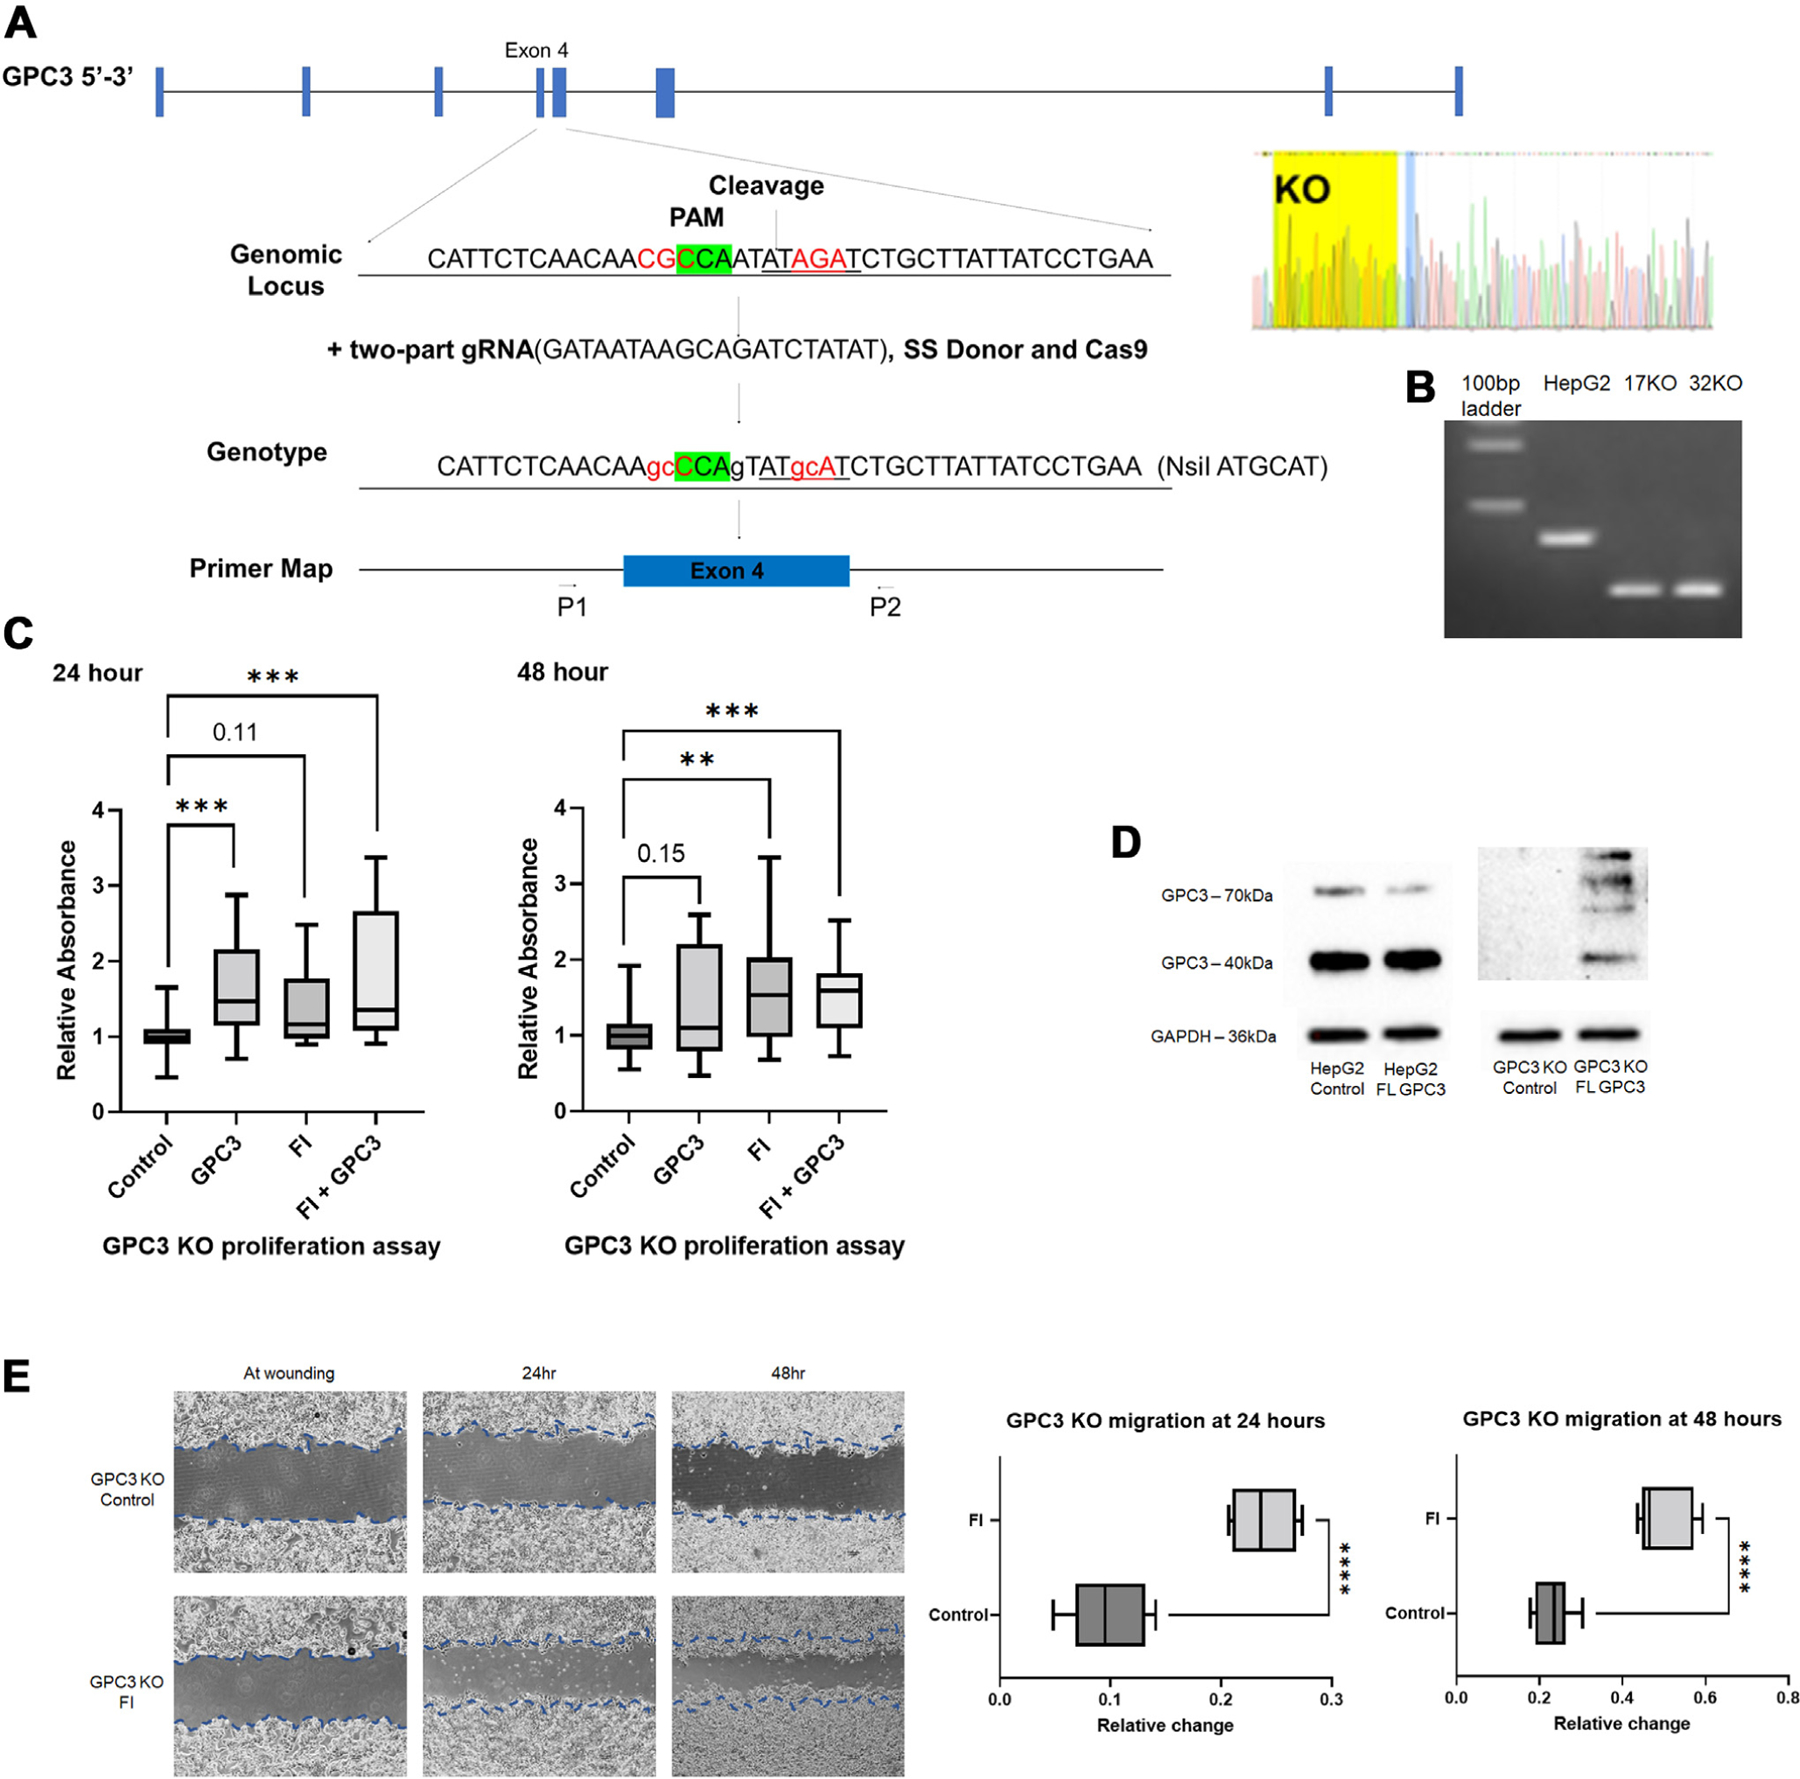
GPC3 peptide increases proliferation in GPC3 knock out (KO) HepG2 cells with no effect after treatment with FI. (A) Design of HepG2 Crispr GPC3 KO cell lines with PAM, restriction site, and sequencing confirmation. (B) PCR genotyping confirming no expression of GPC3 in knock out cell line. Compared to HepG2 (~345 bp), KO yields truncated PCR band (~220 bp). A portion of the 100 bp ladder is shown in lane one. (C) GPC3 KO cells were treated with FI, FL GPC3 peptide and combination of FI and FL GPC3 peptide for 24 and 48 h. At 24 and 48 h, there was increase in proliferation following treatment with full-length GPC3 peptide, FI, and combination of full-length GPC3 peptide and FI relative to untreated control HepG2 GPC3 knock out cells (Fig. 6C). (D) GPC3 protein expression in GPC3 KO cells show absence of expression in untreated control cells and expression of both 70 kDa and 40 kDa GPC3 in GPC3 KO cells treated with full-length GPC3 peptide. (E) Scratch assay performed on two HepG2 GPC3 KO clones demonstrates increased migration following q24 h FI treatment at 24 and 48 h compared to control GPC3 KO cells. Representative images shown (4x images, Nikon Ts2).
Using western blot, protein expression was evaluated in HepG2 and GPC3 KO cells and confirmed absence of GPC3 in KO control cells (Fig. 6D). We were able to confirm uptake and processing of FL GPC3 peptide with expression of both 70 kDa and 40 kDa GPC3. Fifty kilodalton and 100 kDa protein fragments were also observed following peptide addition to GPC3 KO cells (Fig. 6D). Following FI GPC3 KO cells showed increased migration compared to control HepG2 KO cells, suggestive of an off-target effect of FI not specific to the GPC3 proliferation effect observed (Fig. 6E). Untreated GPC3 KO clones show no significant difference in migration rate compared to wild type HepG2 (Supplemental Fig. S1D).
Discussion
In this study, we demonstrate that two liver cancer cell lines, which differ in GPC3 expression, also demonstrate contrasting responses to furin inhibition relative to proliferation and migration. Furin inhibition reduces HepG2 cell proliferation after serial treatment with enzyme inhibitor with reduction in 40 kDa cleavage product seen as early as four to 6 h after single treatment (Fig. 2). We also demonstrated that SKHep1 cell proliferation is enhanced by treatment with recombinant GPC3 subunits (Fig. 1D). HepG2 GPC3 KO cells demonstrate there is a prominent role for GPC3 in driving proliferation in liver cancer cell lines demonstrated by increased proliferation following addition of FL GPC3 peptide.
In addition, we have shown that HepG2 cells treated with FI demonstrate an increased propensity for cell migration potentially due to cytoskeletal reorganization (Figs. 3 and 5). Increased migration was also observed in HepG2 GPC3 KO cells treated with FI which suggest that FI, not GPC3, promotes migration in HepG2 cells and requires further exploration. From a therapeutic standpoint, furin inhibition prevents tumor cell proliferation however our studies did not demonstrate a treatment worthy response, with the adverse consequence of promoting cellular migration.
There are conflicting results in the current literature on the proliferative effect of GPC3 overexpression in cancer. Wang et al. provided evidence that GPC3 promoted proliferation by stimulating the HH signaling pathway.41 Conversely, Pan et al. demonstrated a reduction in HCC cell lines following transfection with GPC3.40 Our results demonstrate variable overexpression profile of GPC3 between human HB samples compared to adjacent noncancerous liver.46 The importance of GPC3 cleavage in tumor remains unclear and further examination of the GPC3 mechanism in HB must be explored to further understand these results following furin inhibition. Although we show that some other furin substrates have reduced gene expression in HB, it is still possible that our results are due to off-target effects of FI or due to different GPC3 interactions driven by different forms of GPC3 protein. Several studies have reported that cleavage of GPC3 appears to be necessary for interaction with HH signaling pathway, however this modification is not required for GPC3 interaction with both canonical and noncanonical WNT pathways.21,48,49 Understanding the importance of GPC3 cleavage by furin needs to be further studied to provide insight into the drivers of proliferation and other effects induced by GPC3 overexpression in HB.
GPC3 is currently being studied as an immunotherapy target due to its extensive expression.50 Regarding GPC3 as a specific treatment target, our study indicates that furin inhibition should be avoided as treatment for HB until the role of GPC3 in cellular adhesion and migration are more clearly explained. Due to heterogeneity of physiologic GPC3 expression, there is likely a broad range of GPC3 effects at the individual patient level and across cancer types. Further investigation on GPC3 interaction with signaling pathways including crosstalk between these pathways and discovery of driving mechanisms of tumorigenesis is essential for discovering novel therapeutic strategies for HB.
Conclusions
Through inhibition of furin in HepG2 and SKHep1 cell lines, we show that cell proliferation is of modest importance. We also show that GPC3 drives increased proliferation in GPC3 KO HepG2 cells. However, cell morphology and migration are enhanced in HepG2 cells due to reduced protein cleavage by furin. From this, we conclude that FI is a poor treatment candidate for HB due to the risk of increasing cell motility and invasion through increased migration and cytoskeletal restructuring possibly due to mechanisms in addition to GPC3. Further exploration is needed to clarify GPC3 interactions and mechanism to determine if this protein is necessary or sufficient to drive these cellular changes.
Supplementary Material
Acknowledgment
We would like to thank the CCHMC Research pathology core of the Digestive Diseases Research Core Center for technical expertise and support. We also thank Dr Yueh-Chiang Hu and the CCHMC Transgenic Animal and Genome Editing Core for generating our HepG2 GPC3 KO cells.
Funding
This work was supported by National Institutes of Health Digestive Health Center: Bench-to-Bedside Research in Pediatric Digestive Disease [grant P30 DK078392, 2020]; AASLD Pilot Award [SPR200430, 2019]; Markham Award [2018]; and Grace Foundation Funds [2021].
Footnotes
Supplementary Materials
Supplementary data related to this article can be found at https://doi.org/10.1016/j.jss.2022.09.011.
Disclosure
None declared.
Institutional Review Board Statement and Informed Consent Statement
We have collected background liver and tumor samples from patients with HB under conditions appropriate for characterization and mechanistic studies with institutional review board approval (IRB # 2016-9497) and informed patient consent.
Availability of Data
Data sharing is not applicable to this article; findings are reported in article figures.
REFERENCES
- 1.Lim IIP, Bondoc AJ, Geller JI, Tiao GM. Hepatoblastoma—the evolution of biology, surgery, and transplantation. Children 2019;6:1. [DOI] [PMC free article] [PubMed] [Google Scholar]
- 2.Hubbard AK, Spector LG, Fortuna G, Marcotte EL, Poynter JN. Trends in international incidence of pediatric cancers in children under 5 years of age: 1988–2012. JNCI Cancer Spectr 2019;3:pkz007. [DOI] [PMC free article] [PubMed] [Google Scholar]
- 3.Capurro MI, Shi W, Filmus J. LRP1 mediates Hedgehog-induced endocytosis of the GPC3–Hedgehog complex. J Cell Sci 2012;125:3380–3389. [DOI] [PMC free article] [PubMed] [Google Scholar]
- 4.Sukowati CH. Heterogeneity of Hepatic Cancer Stem Cells. Stem Cells Heterogeneity in Cancer. Adv Exp Med Biol; 2019:59–81. [DOI] [PubMed] [Google Scholar]
- 5.Cairo S, Armengol C, De Reynies A, et al. Hepatic stem-like phenotype and interplay of wnt/beta-catenin and Myc signaling in aggressive childhood liver cancer. Cancer Cell 2008;14:471–484. [DOI] [PubMed] [Google Scholar]
- 6.Whitlock RS, Yang T, Vasudevan SA, Woodfield SE. Animal modeling of pediatric liver cancer. Cancers (Basel) 2020;12:273. [DOI] [PMC free article] [PubMed] [Google Scholar]
- 7.López-Terrada D, Cheung SW, Finegold MJ, Knowles BB. Hep G2 is a hepatoblastoma-derived cell line. Hum Pathol 2009;40:1512. [DOI] [PubMed] [Google Scholar]
- 8.Ortiz MV, Roberts SS, Glade Bender J, Shukla N, Wexler LH. Immunotherapeutic targeting of GPC3 in pediatric solid embryonal tumors. Front Oncol 2019;9:108. [DOI] [PMC free article] [PubMed] [Google Scholar]
- 9.Zynger DL, Gupta A, Luan C, Chou PM, Yang GY, Yang XJ . Expression of glypican 3 in hepatoblastoma: an immunohistochemical study of 65 cases. Hum Pathol 2008;39:224–230. [DOI] [PubMed] [Google Scholar]
- 10.Li N, Wei L, Liu X, et al. A frizzled-like cysteine-rich domain in glypican-3 mediates wnt binding and regulates hepatocellular carcinoma tumor growth in mice. Hepatology 2019;70:1231–1245. [DOI] [PMC free article] [PubMed] [Google Scholar]
- 11.Baumhoer D, Tornillo L, Stadlmann S, Roncalli M, Diamantis EK, Terracciano LM. Glypican 3 expression in human nonneoplastic, preneoplastic, and neoplastic tissues: a tissue microarray analysis of 4,387 tissue samples. Am J Clin Pathol 2008;129:899–906. [DOI] [PubMed] [Google Scholar]
- 12.Iglesias BV, Centeno G, Pascuccelli H, et al. Expression pattern of glypican-3-GPC3-during human embryonic and fetal development. Histol Histopathol 2008;23:1333–1340. [DOI] [PubMed] [Google Scholar]
- 13.Filmus J, Capurro M, Rast J. Glypicans. Genome Biol 2008;9:224. [DOI] [PMC free article] [PubMed] [Google Scholar]
- 14.Kolluri A, Ho M. The role of glypican-3 in regulating wnt, YAP and hedgehog in liver cancer. Front Oncol 2019;9:708. [DOI] [PMC free article] [PubMed] [Google Scholar]
- 15.Ho M, Kim H. Glypican-3: a new target for cancer immunotherapy. Eur J Cancer 2011;47:333–338. [DOI] [PMC free article] [PubMed] [Google Scholar]
- 16.Sha Y-L, Liu S, Yan W-W, Dong B. Wnt/β-catenin signaling as a useful therapeutic target in hepatoblastoma. Biosci Rep 2019;39:BSR20192466. [DOI] [PMC free article] [PubMed] [Google Scholar]
- 17.Bell D, Ranganathan S, Tao J, Monga SP. Novel advances in understanding of molecular pathogenesis of hepatoblastoma: a Wnt/β-catenin perspective. Gene Expr 2017;17:141–154. [DOI] [PMC free article] [PubMed] [Google Scholar]
- 18.Hippo Y, Watanabe K, Watanabe A, et al. Identification of soluble NH2-terminal fragment of glypican-3 as a serological marker for early-stage hepatocellular carcinoma. Cancer Res 2004;64:2418–2423. [DOI] [PubMed] [Google Scholar]
- 19.Luo JH, Ren B, Keryanov S, et al. Transcriptomic and genomic analysis of human hepatocellular carcinomas and hepatoblastomas. Hepatology 2006;44:1012–1024. [DOI] [PMC free article] [PubMed] [Google Scholar]
- 20.Declercq J, Brouwers B, Pruniau VP, et al. Liver-specific inactivation of the proprotein convertase FURIN leads to increased hepatocellular carcinoma growth. Biomed Res Int 2015;2015:148651. [DOI] [PMC free article] [PubMed] [Google Scholar]
- 21.Capurro M, Shi W, Izumikawa T, Kitagawa H, Filmus J. Processing by convertases is required for glypican-3-induced inhibition of Hedgehog signaling. J Biol Chem 2015;290:7576–7585. [DOI] [PMC free article] [PubMed] [Google Scholar]
- 22.Bassi DE, Mahloogi H, Klein-Szanto AJ. The proprotein convertases furin and PACE4 play a significant role in tumor progression. Mol Carcinog 2000;28:63–69. [PubMed] [Google Scholar]
- 23.Tian S, Huang Q, Fang Y, Wu J. FurinDB: a database of 20-residue furin cleavage site motifs, substrates and their associated drugs. Int J Mol Sci 2011;12:1060–1065. [DOI] [PMC free article] [PubMed] [Google Scholar]
- 24.He Z, Khatib A-M, Creemers JW. The proprotein convertase furin in cancer: more than an oncogene. Oncogene 2022;41:1252–1262. [DOI] [PubMed] [Google Scholar]
- 25.Riaz SK, Ke Y, Wang F, Kayani MA, Malik MFA. Influence of SHH/GLI1 axis on EMT mediated migration and invasion of breast cancer cells. Sci Rep 2019;9:1–13. [DOI] [PMC free article] [PubMed] [Google Scholar]
- 26.Capurro MI, Xu P, Shi W, Li F, Jia A, Filmus J. Glypican-3 inhibits Hedgehog signaling during development by competing with patched for Hedgehog binding. Dev Cell 2008;14:700–711. [DOI] [PubMed] [Google Scholar]
- 27.Gao W, Kim H, Feng M, et al. Inactivation of Wnt signaling by a human antibody that recognizes the heparan sulfate chains of glypican-3 for liver cancer therapy. Hepatology 2014;60:576–587. [DOI] [PMC free article] [PubMed] [Google Scholar]
- 28.Li N, Gao W, Zhang Y-F, Ho M. Glypicans as cancer therapeutic targets. Trends Cancer 2018;4:741–754. [DOI] [PMC free article] [PubMed] [Google Scholar]
- 29.Saad A, Liet B, Joucla G, et al. Role of glycanation and convertase maturation of soluble glypican-3 in inhibiting proliferation of hepatocellular carcinoma cells. Biochemistry 2018;57:1201–1211. [DOI] [PubMed] [Google Scholar]
- 30.Zhou F, Shang W, Yu X, Tian J. Glypican-3: a promising biomarker for hepatocellular carcinoma diagnosis and treatment. Med Res Rev 2017;38:741–767. [DOI] [PubMed] [Google Scholar]
- 31.Zhou S, O’Gorman MR, Yang F, Andresen K, Wang L. Glypican 3 as a serum marker for hepatoblastoma. Sci Rep 2017;7:45932. [DOI] [PMC free article] [PubMed] [Google Scholar]
- 32.Hsu H-C, Cheng W, Lai P-L. Cloning and expression of a developmentally regulated transcript MXR7 in hepatocellular carcinoma: biological significance and temporospatial distribution. Cancer Res 1997;57:5179–5184. [PubMed] [Google Scholar]
- 33.Capurro MI, Xiang Y-Y, Lobe C, Filmus J. Glypican-3 promotes the growth of hepatocellular carcinoma by stimulating canonical Wnt signaling. Cancer Res 2005;65:6245–6254. [DOI] [PubMed] [Google Scholar]
- 34.Fernández D, Guereño M, Huvelle MAL, Cercato M, Peters MG. Signaling network involved in the GPC3-induced inhibition of breast cancer progression: role of canonical Wnt pathway. J Cancer Res Clin Oncol 2018;144:2399–2418. [DOI] [PubMed] [Google Scholar]
- 35.Guo M, Zhang H, Zheng J, Liu Y. Glypican-3: a new target for diagnosis and treatment of hepatocellular carcinoma. J Cancer 2020;11:2008. [DOI] [PMC free article] [PubMed] [Google Scholar]
- 36.Castillo LF, Tascon R, Lago Huvelle MR, et al. Glypican-3 induces a mesenchymal to epithelial transition in human breast cancer cells. Oncotarget 2016;7:60133–60154. [DOI] [PMC free article] [PubMed] [Google Scholar]
- 37.Han S, Ma X, Zhao Y, et al. Identification of Glypican-3 as a potential metastasis suppressor gene in gastric cancer. Oncotarget 2016;7:44406–44416. [DOI] [PMC free article] [PubMed] [Google Scholar]
- 38.Höpfner M, Huether A, Sutter AP, Baradari V, Schuppan D, Scherübl H. Blockade of IGF-1 receptor tyrosine kinase has antineoplastic effects in hepatocellular carcinoma cells. Biochem Pharmacol 2006;71:1435–1448. [DOI] [PubMed] [Google Scholar]
- 39.Hsiao C-C, Chen P-H, Cheng C-I, et al. Toll-like receptor-4 is a target for suppression of proliferation and chemoresistance in HepG2 hepatoblastoma cells. Cancer Lett 2015;368:144–152. [DOI] [PubMed] [Google Scholar]
- 40.Pan Z, Chen C, Long H, et al. Overexpression of GPC3 inhibits hepatocellular carcinoma cell proliferation and invasion through induction of apoptosis. Mol Med Rep 2013;7:969–974. [DOI] [PubMed] [Google Scholar]
- 41.Wang S, Chen N, Chen Y, Sun L, Li L, Liu H. Elevated GPC3 level promotes cell proliferation in liver cancer. Oncol Lett 2018;16:970–976. [DOI] [PMC free article] [PubMed] [Google Scholar]
- 42.Zhang Y, Zhou M, Wei H, et al. Furin promotes epithelial-mesenchymal transition in pancreatic cancer cells via Hippo-YAP pathway. Int J Oncol 2017;50:1352–1362. [DOI] [PubMed] [Google Scholar]
- 43.Kacprzak MM, Peinado JR, Than ME, et al. Inhibition of Furin by Polyarginine-Containing Peptides. J Biol Chem 2004;279:36788e36794. [DOI] [PubMed] [Google Scholar]
- 44.Yu X, Liang X, Xie H, et al. Improved delivery of Cas9 protein/gRNA complexes using lipofectamine CRISPRMAX. Biotechnol Lett 2016;38:919–929. [DOI] [PMC free article] [PubMed] [Google Scholar]
- 45.Bobadilla AVP, Arévalo J, Sarró E, et al. In vitro cell migration quantification method for scratch assays. J R Soc Interf 2019;16:20180709. [DOI] [PMC free article] [PubMed] [Google Scholar]
- 46.Bondoc A, Glaser K, Jin K, et al. Identification of distinct tumor cell populations and key genetic mechanisms through single cell sequencing in hepatoblastoma. Commun Biol 2021;4:1049. [DOI] [PMC free article] [PubMed] [Google Scholar]
- 47.Yu M, Luo H, Fan M, et al. Development of GPC3-specific chimeric antigen receptor-engineered natural killer cells for the treatment of hepatocellular carcinoma. Mol Ther 2018;26:366–378. [DOI] [PMC free article] [PubMed] [Google Scholar]
- 48.Ho M Advances in liver cancer antibody therapies: a focus on glypican-3 and mesothelin. BioDrugs 2011;25:275–284. [DOI] [PMC free article] [PubMed] [Google Scholar]
- 49.Wadhwani N, Marayati R, Beierle EA. Novel therapeutics in hepatoblastoma. Med Res Arch 2020;8:2375–2924. [Google Scholar]
- 50.Jiang Z, Jiang X, Chen S, et al. Anti-GPC3-CAR T cells suppress the growth of tumor cells in patient-derived xenografts of hepatocellular carcinoma. Front Immunol 2017;7:690. [DOI] [PMC free article] [PubMed] [Google Scholar]
Associated Data
This section collects any data citations, data availability statements, or supplementary materials included in this article.
Supplementary Materials
Data Availability Statement
Data sharing is not applicable to this article; findings are reported in article figures.


