

Abstract
What is already known about this topic?
The mortality rate due to pneumonia varies depending on the infectious agents present in a low- temperature environment.
What is added by this report?
This study aimed to examine the relationship between low temperatures and cold waves and the risk of mortality from infectious pneumonia in the elderly. The findings indicate a significant increase in the risk of infectious pneumonia, specifically bacterial pneumonia, during periods of low temperatures and cold waves.
What are the implications for public health practice?
This study presents compelling evidence that highlights the importance of proactive public responses to infectious pneumonia among the elderly population during periods of cold waves.
Keywords: cold wave, elderly, infectious pneumonia, time-stratified case-crossover study
Infectious pneumonia is the leading cause of death among the elderly population ( 1– 2). Previous studies have shown that low temperatures increase the risk of pneumonia-related deaths in the elderly ( 3). A study conducted in China ( 4) found that pneumonia patients have different demographic characteristics and varying risks of mortality related to infectious causes during non-optimal temperatures. However, there is a lack of research on the risk of elderly infectious pneumonia-related deaths during extremely low temperatures and cold waves. The National Health Commission of the People’s Republic of China has reported an increase in elderly pneumonia cases since the winter of 2023 ( 5). Therefore, this study conducted a time-stratified case-crossover study in Jinan City to investigate the risk of mortality from infectious pneumonia in the elderly during the cold months from 2014 to 2022. Our findings showed an increased risk of mortality due to infectious pneumonia, particularly bacterial pneumonia, during low temperatures and cold waves, with a higher risk observed in males and rural populations. This highlights the need to prioritize public health interventions for infectious pneumonia-related deaths in the elderly during the cold season.
Death records of individuals aged 65 years and older who died from infectious pneumonia in China between 2014 and 2022 (November to March) were collected from the death registration system of the National Health Commission (NHC). The study extracted specific causes of infectious pneumonia based on the International Classification of Diseases, 10th revision (ICD-10) codes, including viral pneumonia (J10–J12), bacterial pneumonia (J13–J15), chlamydia pneumonia (J16), fungus pneumonia (J17), and other infectious pneumonia (J18). Additional data on the date of death, residential addresses, age, and gender were obtained. Information on daily minimum temperature, other air pollutants, and meteorological factors during the study period was also collected ( Supplementary Material, available at https://weekly.chinacdc.cn).
The definition for low temperatures and cold waves can be found in the Supplementary Material. In our analysis, we conducted a three-stage process. First, we performed descriptive analysis on the collected data, using indicators such as minimum (Min), maximum (Max), median (M), first quartile (P 25), and third quartile (P 75). Second, we tested the Spearman correlation between air pollutants and meteorological factors. Third, we explored the relationship between low temperature and the risk of infectious pneumonia deaths using exposure-response relationship curves. To compare the differences in elderly infectious pneumonia deaths during low temperatures and cold waves with other days, we used t-tests after confirming normality and adherence to the normal distribution ( 4). We then conducted a time-stratified case-crossover study using a conditional logistic regression model to examine the association between infectious pneumonia deaths and low temperatures and cold waves. We also applied an exploratory analysis with an 8-day lag (Lag8) to estimate the pattern of pneumonia mortality in relation to lower temperatures and cold waves ( 6). The effect estimates were presented as odds ratios ( ORs) with corresponding 95% confidence intervals ( CIs). Furthermore, we investigated the specific causes of pneumonia (bacterial, viral, and other infectious pneumonia) and the vulnerability of sub-populations based on gender (male and female) and resident area type (urban and rural). Sensitivity analysis can be found in the Supplementary Materials. We performed the statistical analysis using R software (version 4.2.0; RStudio Inc; the USA). Statistical significance was considered at a P-value <0.05.
A total of 8,685 deaths due to infectious pneumonia occurred among elderly individuals from 2014 to 2022, with 4,284 (49.33%) of these deaths occurring during cold months. Table 1 provides details regarding the demographic characteristics of the deceased, as well as information on meteorological factors and air pollutants. Among the infectious pneumonia cases, 8.71% were caused by viral pneumonia, 23.74% were attributed to bacterial pneumonia, and 65.59% were classified as other types of infectious pneumonia. In terms of population composition, 54.27% were males and 75.84% lived in urban areas. The average daily minimum temperature was 1.10 ℃, ranging from −18.30 ℃ to 19.60 ℃. Temperature showed a negative association with pressure and a positive association with relative humidity, wind speed, PM 2.5, and O 3 ( Supplementary Table S1, available at https://weekly.chinacdc.cn). A total of 47 episodes of cold wave events were observed during the study period, spanning 151 days and accounting for 9.93% of the total research period ( Supplementary Table S2, available at https://weekly.chinacdc.cn).
Table 1. Descriptive statistics of daily infectious pneumonia deaths in the elderly population, meteorological factors, and air pollutants in Jinan City from 2014 to 2022 (November to March).
| Variables | n (%) | Min | P 25 | M | P 75 | Max |
| Infectious pneumonia death counts | ||||||
| Abbreviation: Min=minimum; P
25=first quartile; M=median; P
75=third quartile; Max=maximum; T.=temperature; WS=wind speed; RH=relative humidity; PM
2.5=fine particulate matter; O
3=ozone.
| ||||||
| All pathogen | 4,284 (100.00) | 0 | 2 | 3 | 5 | 12 |
| Viral | 373 (8.71) | 0 | 0 | 0 | 0 | 4 |
| Bacterial | 1,017 (23.74) | 0 | 0 | 1 | 1 | 6 |
| Chlamydia | 7 (0.16) | 0 | 0 | 0 | 0 | 3 |
| Fungus | 77 (1.80) | 0 | 0 | 0 | 0 | 3 |
| Other infectious | 2,810 (65.59) | 0 | 1 | 2 | 3 | 11 |
| Death counts classified by gender | ||||||
| Male | 2,325 (54.27) | 0 | 1 | 2 | 3 | 8 |
| Female | 1,959 (45.73) | 0 | 0 | 1 | 2 | 8 |
| Death counts classified by area type | ||||||
| Urban | 3,249 (75.84) | 0 | 1 | 2 | 4 | 9 |
| Rural | 1,035 (24.16) | 0 | 0 | 1 | 1 | 6 |
| Meteorological factors | ||||||
| Min T. (℃) | 1,300 | −18.3 | -2.3 | 1.1 | 5.5 | 19.6 |
| Mean T. (℃) | 1,300 | −13.6 | 1.1 | 4.8 | 9.5 | 23.1 |
| WS (m/s) | 1,300 | 0.2 | 1.6 | 2.1 | 2.7 | 7.3 |
| RH (%) | 1,300 | 15 | 35 | 46 | 62 | 100 |
| Pressure (hPa) | 1,300 | 984 | 1,000 | 1,005 | 1,009 | 1,022 |
| Air pollution (μg/m 3) | ||||||
| PM 2.5 | 1,300 | 7 | 45 | 68 | 104 | 424 |
| O 3 | 1,300 | 5 | 46 | 63 | 87 | 243 |
Figure 1 illustrates exposure-response curves that depict the correlation between ambient temperature and pneumonia mortality. It shows an increased risk of pneumonia mortality with decreasing temperature. Specifically, at the threshold temperature of 5 ℃, there is a significant increase in the risk of all pathogens and viral pneumonia. As the temperature declines to −2 ℃, there is a higher risk of other infectious pneumonia. Furthermore, at −4 ℃, the risk of bacterial pneumonia becomes statistically significant. The differences in elderly pneumonia deaths under different scenarios of low temperatures and cold waves are shown in Supplementary Table S3 (available at https://weekly.chinacdc.cn). The study found a higher risk of elderly infectious pneumonia deaths during low-temperature days and cold waves compared to other days.
Figure 1.

Exposure-response curves of daily minimum temperature in relation to infectious pneumonia in Jinan City from 2014 to 2022 (November to March). (A) All pathogen pneumonia; (B) Viral pneumonia; (C) Bacterial pneumonia; (D) Other infectious pneumonia.
Note: The blue solid lines represent the mean risk estimates, and the light blue areas represent their 95% CIs. The red vertical lines indicate the threshold temperatures (5 ℃, 5 ℃, −4 ℃, and −2 ℃) that showed the lowest statistically significant mortality risk.
Abbreviation: OR=odds ratio; CI=confidence interval; T.=temperature.
Figure 2 shows the lag effects on mortality from infectious pneumonia in the elderly. There is a significant increase in the risk of mortality from all-pathogen pneumonia at Lag5 ( OR=1.39, 95% CI: 1.04–1.87) and Lag5 ( OR=1.67, 95% CI: 1.06–2.61) for temperatures of −7 ℃ and −10 ℃, respectively. Similarly, the risk of mortality from bacterial pneumonia follows the same pattern, with significant effects observed at Lag6 ( OR=2.07, 95% CI: 1.17–3.37) and Lag6 ( OR=2.53, 95% CI: 1.08–5.62) for temperatures of −7 ℃ and −10 ℃, respectively. The risk of mortality from other infectious pneumonia shows a significant effect at Lag4 ( OR=1.48, 95% CI: 1.02–2.16) at −7 ℃. However, there was no significant effect observed for mortality from viral pneumonia.
Figure 2.

The lag effects of all pathogens, including viral, bacterial, and other infectious pneumonia deaths, on the elderly population under the scenario of low temperatures and cold waves in Jinan City from 2014 to 2022 (November to March). (A) All pathogen pneumonia; (B) Viral pneumonia; (C) Bacterial pneumonia; (D) Other infectious pneumonia.
Note: The red asterisk (*) indicates statistical significance.
Abbreviation: OR=odds ratio; CI=confidence interval; T.=temperature.
Figure 3 presents the acute impacts of elderly pneumonia mortality under various demographic characteristics are presented. At −7 ℃, males showed a significant risk of mortality from Lag4 to Lag6, while elderly individuals living in urban areas experienced a significant risk from Lag5 to Lag6. At −10 ℃, there was an earlier and higher emerging pattern of lag effects for infectious pneumonia deaths observed in males (from Lag3 to Lag6), females (Lag2), urban elderly individuals (Lag6), and rural elderly individuals (Lag3 to Lag5). Sensitivity analysis of the effect on all pathogens, viruses, bacteria, and other infectious pneumonia among the elderly showed robust results ( Supplementary Figure S1, available at https://weekly.chinacdc.cn).
Figure 3.

Subgroup analysis of the acute effects on mortality in the elderly population due to pneumonia during the period of low temperatures and cold waves in Jinan City from 2014 to 2022 (November to March).
Note: The red asterisk (*) indicates statistical significance.
Abbreviation: OR=odds ratio; CI=confidence interval; T.=temperature.
DISCUSSION
The study found that low temperatures and cold waves have a significant impact on the mortality rates of pneumonia caused by various pathogens in the elderly population during cold months. The risk patterns of infectious pneumonia mortality in the elderly population in Jinan City varied depending on the specific pathogen, with increased severity observed during periods of low temperatures and cold waves. Furthermore, the study identified that males and individuals residing in rural areas were more vulnerable to mortality from infectious pneumonia in the elderly population.
In colder months, with temperatures dropping to 5 ℃, there is an increased risk of all-pathogen pneumonia. However, as the temperature continues to decrease, there is no threshold increase in the risk of elderly death from bacterial pneumonia. This finding is consistent with a nationwide study ( 4) and could be attributed to a negative correlation between ambient temperature and the incidence of bacterial infections ( 7). The National Disease Control and Prevention Administration has published the “Cold Wave Public Health Protection Guidelines”, emphasizing the vulnerability of the elderly during cold waves and the need for special attention ( 8). The higher risk of mortality from infectious pneumonia in elderly individuals residing in rural areas may be attributed to limited awareness of health risks, lack of heating facilities, and limited accessibility to medical resources ( 9).
Our study presents evidence that low temperatures and cold waves increase the mortality risk of infectious pneumonia among the elderly, with varying risks based on different status categories. However, there are several limitations to our study. First, we were unable to obtain individual temperature exposure data as our study was conducted using a population-based case-crossover design. Second, due to the small sample size, we were unable to analyze pneumonia caused by chlamydia and fungus. Lastly, we grouped infectious pneumonia into three categories (bacterial, viral, and other) without further discussion on specific diseases. In summary, our study investigated the immediate impact of low temperatures and cold waves on the risk of mortality from infectious pneumonia in the elderly. Therefore, it is crucial to raise awareness among the elderly about infectious pneumonia and encourage pneumonia vaccination before the onset of colder months. Additionally, healthcare facilities should ensure sufficient resource reserves.
Conflicts of interest
No conflicts of interest.
SUPPLEMENTARY MATERIAL
METHODS
Data Collection
Daily measurements of fine particulate matter (PM 2.5) and 8-hour ozone (O 3-8h, referred to as O 3) levels were collected from the Jinan Ecological Environmental Protection Bureau ( http://jnepb.jinan.gov.cn/). Meteorological data, including daily mean minimum temperature (℃), daily mean temperature (℃), relative humidity (%), pressure (hPa), and wind speed (m/s), were obtained from the China Meteorological Data Service Centre ( http://data.cma.gov.cn/).
Definition of Low Temperatures and Cold Waves
Currently, there is no standard definition for low temperatures and cold waves in China. In this study, we used a combination of threshold temperature and duration to define low temperatures and cold waves. The study period was chosen as the cold season (November to March), and the daily minimum temperature during this period was used. Cold waves were defined as two or more consecutive days with daily minimum temperature equal to or below the 10th (−5 ℃), 5th (−7 ℃), and 1st (−10 ℃) percentiles (1–2). Threshold temperature was determined based on the exposure-response relationship between daily minimum temperature and pneumonia mortality, using statistically significant values. The duration used for the definition of low temperatures was consistent with the definition of cold waves.
Study Design
We utilized a time-stratified case-crossover study design, combined with a conditional logistic regression model, to examine the association between pneumonia deaths caused by different infections from low temperatures and cold waves. The time-stratified case-crossover study design involves dividing the study period into time strata, with the case phase and control phase occurring within the same stratum. For instance, if a pneumonia death occurs on January 15, 2014 (a Wednesday), other Wednesdays in January 2014 would be selected as control days. Each event day was matched with 3 to 4 control days. To account for confounding factors, we included relative humidity (RH) and holidays as covariates in the regression model.
Sensitivity Analyses
We performed multiple sensitivity analyses to evaluate the reliability of our primary results. We adjusted the primary model by incorporating specific air pollutants and additional meteorological factors individually, focusing on the periods when these factors had the greatest impact.
Table S1. Spearman correlation coefficient ( r s value) between meteorological factors and air pollutants in Jinan City from 2014 to 2022 (November to March).
| Variables | RH | Pressure | WS | PM 2.5 | O 3 |
| Abbreviation: Min T.=minimum temperature; RH=relative humidity; WS=wind speed.
* Iindicates statistical significance. | |||||
| Min T. | 0.05* | −0.07* | 0.26* | 0.06* | 0.49* |
| RH | −0.05* | −0.26* | 0.41* | −0.39* | |
| Pressure | −0.28* | −0.12* | −0.41* | ||
| WS | −0.26* | 0.41* | |||
| PM 2.5 | −0.30* | ||||
Table S2. The basic information of low temperature and cold wave definitions in Jinan City from 2014 to 2022 (November to March).
| Definitions | T. (℃) | Duration (d) | Frequency (times) | Days (d) |
| Abbreviation: T.=temperature.
* Represents the threshold of significant low temperature for all pathogen, viral, bacterial and other infectious pneumonia, based on exposure-response relationship curve. | ||||
| Low temperature* | ≤5 | ≥2 | 51 | 915 |
| ≤−2 | ≥2 | 67 | 311 | |
| ≤−4 | ≥2 | 45 | 144 | |
| Cold wave | ≤−5 | ≥2 | 29 | 97 |
| ≤−7 | ≥2 | 14 | 41 | |
| ≤−10 | ≥2 | 4 | 13 | |
Table S3. The daily average numbers of elder pneumonia death under different scenarios of low temperatures and cold waves in Jinan City from 2014 to 2022 (November to March) (mean±SD).
| Death counts | T.≤5 ℃ and ≥2 days | T.≤−2 ℃ and ≥2 days | T.≤−4 ℃ and ≥2 days | T.≤−5 ℃ and ≥2 days | T.≤−7 ℃ and ≥2 days | T.≤−10 ℃ and ≥2 days | |||||||||||
| Yes | No | Yes | No | Yes | No | Yes | No | Yes | No | Yes | No | ||||||
| Abbreviation: T.=temperature.
* Represents that the daily number of deaths in the group is significantly higher than in the other group. | |||||||||||||||||
| Infectious pneumonia | |||||||||||||||||
| All pathogen | 3.51±2.16* | 2.82±1.88 | 3.68±2.23* | 3.19±2.05 | 3.88±2.34* | 3.23±2.06 | 3.85±2.19* | 3.26±2.09 | 3.63±2.30* | 3.29±2.10 | 3.23±1.54 | 3.31±2.11 | |||||
| Viral | 0.33±0.60 | 0.18±0.46 | 0.35±0.60 | 0.27±0.55 | 0.34±0.60* | 0.28±0.56 | 0.35±0.60 | 0.28±0.56 | 0.32±0.65* | 0.29±0.56 | 0.46±0.78* | 0.29±0.56 | |||||
| Bacterial | 0.83±0.93* | 0.67±0.90 | 0.89±0.98* | 0.75±0.90 | 0.92±0.96 | 0.77±0.92 | 0.91±0.91 | 0.77±0.92 | 0.88±0.78* | 0.78±0.93 | 0.85±0.80* | 0.78±0.92 | |||||
| Other infectious | 2.27±1.73* | 1.89±1.49 | 2.37±1.78* | 2.10±1.63 | 2.56±1.91* | 2.11±1.63 | 2.55±1.86* | 2.13±1.65 | 2.39±1.88* | 2.15±1.67 | 1.92±1.19 | 2.16±1.68 | |||||
| Gender | |||||||||||||||||
| Male | 1.89±1.47* | 1.57±1.35 | 2.05±1.56* | 1.72±1.39 | 2.16±1.63* | 1.75±1.41 | 2.15±1.52* | 1.77±1.43 | 2.17±1.51* | 1.78±1.44 | 1.92±1.26* | 1.79±1.44 | |||||
| Female | 1.62±1.41* | 1.25±1.18 | 1.64±1.43 | 1.47±1.33 | 1.72±1.49 | 1.48±1.34 | 1.69±1.51 | 1.50±1.34 | 1.46±1.52 | 1.51±1.35 | 1.31±1.80 | 1.51±1.35* | |||||
| Residential area | |||||||||||||||||
| Urban | 2.64±1.77* | 2.18±1.64 | 2.74±1.86 | 2.43±1.70 | 2.89±1.97 | 2.46±1.71 | 2.91±1.98* | 2.47±1.72 | 2.80±2.17* | 2.50±1.73 | 2.15±1.41 | 2.51±1.75* | |||||
| Rural | 0.87±0.98* | 0.63±0.82 | 0.94±0.98 | 0.75±0.93 | 0.99±1.03 | 0.77±0.93 | 0.94±0.99 | 0.79±0.94 | 0.83±1.02* | 0.80±0.94 | 1.08±1.19* | 0.80±0.94 | |||||
Figure S1.
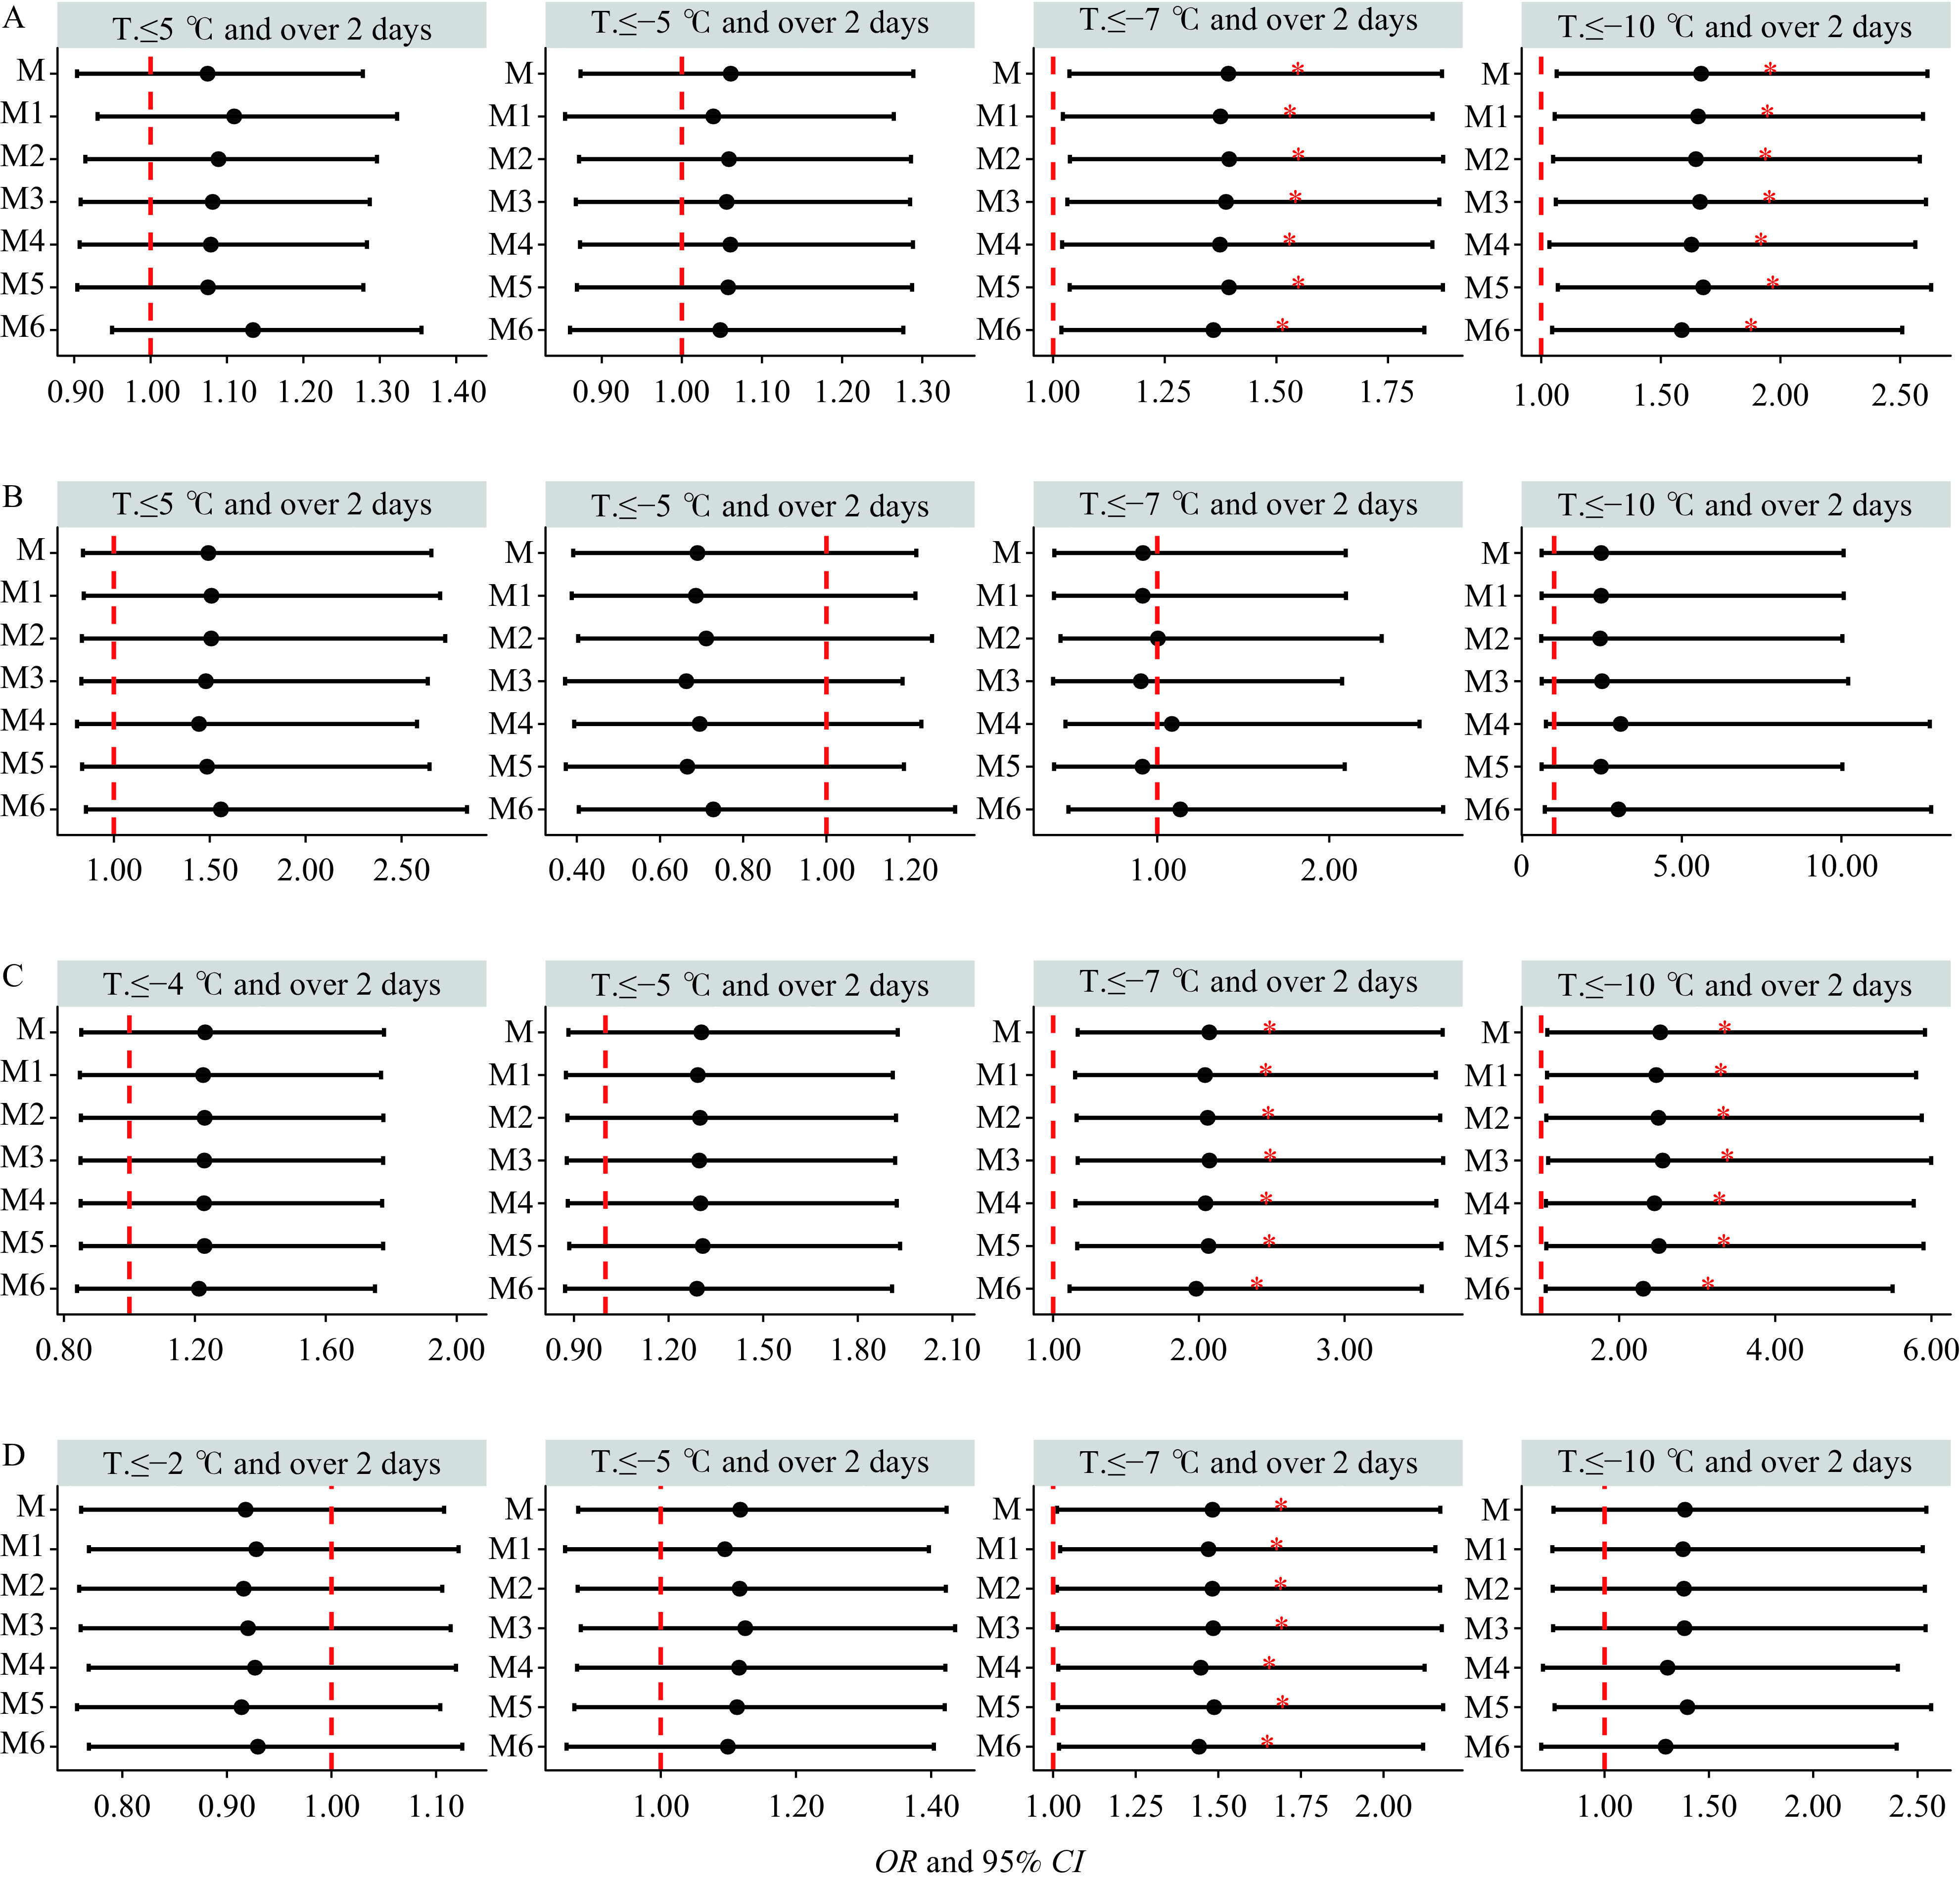
Sensitivity analysis of the effect on elder pneumonia death for all pathogen, viral, bacterial and other infectious pneumonia in Jinan City from 2014 to 2022 (November to March). (A) All pathogen pneumonia; (B) Viral pneumonia; (C) Bacterial pneumonia; (D) Other infectious pneumonia.
Note: The red asterisk (*) indicates statistical significance; M for main model; M1 for adjustment of PM 2.5; M2 for adjustment of O 3; M3 for adjustment of daily mean temperature; M4 for adjustment of wind speed; M5 for adjustment of pressure; M6 for adjustment of PM 2.5, O 3, wind speed, daily mean temperature, and pressure.
Abbreviation: OR=odds ratio; CI=confidence interval; T.=temperature.
REFERENCES
Lane MA, Walawender M, Brownsword EA, Pu SY, Saikawa E, Kraft CS, et al. The impact of cold weather on respiratory morbidity at Emory Healthcare in Atlanta. Sci Total Environ 2022;813:152612. http://dx.doi.org/10.1016/j.scitotenv.2021.152612.
Du JP, Cui LL, Ma YW, Zhang XH, Wei JL, Chu N, et al. Extreme cold weather and circulatory diseases of older adults: a time-stratified case-crossover study in Jinan, China. Environ Res, 2022;214:114073. http://dx.doi.org/10.1016/j.envres.2022.114073.
Funding Statement
Supported by the 34th Batch of Jinan Science and Technology Innovation Development Plan (Clinical Medicine Science and Technology Innovation Plan) Projects (grant number 202134008), and the Special Funds for High-Level Talents of Jinan Healthcare Industry
References
- 1.Torres A, Cilloniz C, Niederman MS, Menéndez R, Chalmers JD, Wunderink RG, et al Pneumonia. Nat Rev Dis Primers. 2021;7(1):25. doi: 10.1038/s41572-021-00259-0. [DOI] [PubMed] [Google Scholar]
- 2.Liu YN, Zhang YF, Xu Q, Qiu Y, Lu QB, Wang T, et al Infection and co-infection patterns of community-acquired pneumonia in patients of different ages in China from 2009 to 2020: A national surveillance study. Lancet Microbe. 2023;4(5):e330–9. doi: 10.1016/S2666-5247(23)00031-9. [DOI] [PMC free article] [PubMed] [Google Scholar]
- 3.Bunker A, Wildenhain J, Vandenbergh A, Henschke N, Rocklöv J, Hajat S, et al Effects of air temperature on climate-sensitive mortality and morbidity outcomes in the elderly; a systematic review and meta-analysis of epidemiological evidence. eBioMedicine. 2016;6:258–68. doi: 10.1016/j.ebiom.2016.02.034. [DOI] [PMC free article] [PubMed] [Google Scholar]
- 4.He QL, Liu YN, Yin P, Gao Y, Kan HD, Zhou MG, et al Differentiating the impacts of ambient temperature on pneumonia mortality of various infectious causes: a nationwide, individual-level, case-crossover study. eBioMedicine. 2023;98:104854. doi: 10.1016/j.ebiom.2023.104854. [DOI] [PMC free article] [PubMed] [Google Scholar]
- 5.Chinanews.com. How do older people cope with high respiratory disease seasons. https://interview.chinanews.com/sh/2023/11-26/10118226.shtml. (2023-11-26). [2023-12-15].
- 6.Du JP, Cui LL, Ma YW, Zhang XH, Wei JL, Chu N, et al Extreme cold weather and circulatory diseases of older adults: a time-stratified case-crossover study in Jinan, China. Environ Res, 2022;214:114073. doi: 10.1016/j.envres.2022.114073. [DOI] [PubMed] [Google Scholar]
- 7.Nascimento-Carvalho CM, Cardoso MRA, Barral A, Araújo-Neto CA, Oliveira JR, Sobral LS, et al Seasonal patterns of viral and bacterial infections among children hospitalized with community-acquired pneumonia in a tropical region. Scand J Infect Dis. 2010;42(11-12):839–44. doi: 10.3109/00365548.2010.498020. [DOI] [PubMed] [Google Scholar]
- 8.National Disease Control and Prevention Administration. Cold Wave Public Health Protection Guidelines. https://www.ndcpa.gov.cn/jbkzzx/yqxxxw/common/content/content_1734760100001665024.html. (2023-12-13). [2023-12-15].
- 9.Liu XJ, Du CL, Hu FY, Zhao YF, Zhou JT, Wang Q, et al. Management of acute exacerbation of chronic obstructive pulmonary disease under a tiered medical system in China. Ther Adv Respir Dis 2022;16:17534666221075499. http://dx.doi.org/10.1177/17534666221075499.