

Significance
Metabolism of glucose and amino acids is critical to the growth of many cancers, including glioblastoma, but treatments to target tumor metabolism remain understudied. By analyzing The Cancer Genome Atlas, we found that glioblastoma exhibits the highest expression of cysteine and methionine metabolic genes of 32 human cancers. We found that cysteine compounds, including N-acetylcysteine (NAC), kill GBM cells by reducing mitochondrial oxygen consumption and membrane potential, leading to mitochondrial cristae dissolution. These effects are exacerbated by glucose starvation. NAC drives mitochondrial hydrogen peroxide to induce reductive stress, a process reversed by administration of mitochondrial electron acceptors and mitochondrial redox enzyme overexpression. We uncovered a unique susceptibility of glioblastoma to cysteine that may be targetable by FDA-approved therapies.
Keywords: glioblastoma, reductive stress, cysteine, hydrogen peroxide, mitochondrial metabolism
Abstract
Glucose and amino acid metabolism are critical for glioblastoma (GBM) growth, but little is known about the specific metabolic alterations in GBM that are targetable with FDA-approved compounds. To investigate tumor metabolism signatures unique to GBM, we interrogated The Cancer Genome Atlas for alterations in glucose and amino acid signatures in GBM relative to other human cancers and found that GBM exhibits the highest levels of cysteine and methionine pathway gene expression of 32 human cancers. Treatment of patient-derived GBM cells with the FDA-approved single cysteine compound N-acetylcysteine (NAC) reduced GBM cell growth and mitochondrial oxygen consumption, which was worsened by glucose starvation. Normal brain cells and other cancer cells showed no response to NAC. Mechanistic experiments revealed that cysteine compounds induce rapid mitochondrial H2O2 production and reductive stress in GBM cells, an effect blocked by oxidized glutathione, thioredoxin, and redox enzyme overexpression. From analysis of the clinical proteomic tumor analysis consortium (CPTAC) database, we found that GBM cells exhibit lower expression of mitochondrial redox enzymes than four other cancers whose proteomic data are available in CPTAC. Knockdown of mitochondrial thioredoxin-2 in lung cancer cells induced NAC susceptibility, indicating the importance of mitochondrial redox enzyme expression in mitigating reductive stress. Intraperitoneal treatment of mice bearing orthotopic GBM xenografts with a two-cysteine peptide induced H2O2 in brain tumors in vivo. These findings indicate that GBM is uniquely susceptible to NAC-driven reductive stress and could synergize with glucose-lowering treatments for GBM.
Glioblastoma (GBM) is one of the most lethal human cancers, with a median overall survival of just 14 to 16 mo despite surgical resection, chemotherapy, and radiation (1, 2). Increased flux through glucose and amino acid metabolic pathways is central to GBM proliferation (3) and is regulated primarily through oncogene-controlled membrane transporters and metabolic enzymes (4–6). These nutrients facilitate energy production through ATP generation and also protect against oxidative stress through the generation of NADPH (3).
Unlike systemic cancers, GBM is adapted to the nutrient pool available within the central nervous system. Because the brain uses 20% of the body’s glucose (7), GBM cells can access a vast supply of glucose for growth. In these cells, glucose is preferentially used for mitochondrial glucose oxidation, indicating a dependency on mitochondrial-generated ATP production in GBM (8). The excess of certain amino acids, such as glutamate, in the brain also fuels GBM growth by killing surrounding neurons, promoting inflammation, and inducing brain edema (9–13). These studies support the targeting of brain-associated nutrient metabolism in GBM.
Cysteine is a sulfur-containing amino acid that is required for glutathione production. Cysteine levels are regulated through a variety of membrane-bound amino acid transporters, including the cystine-glutamate antiporter system Xc−, which plays a critical role in the oxidative stress response in GBM and other cancers (14, 15). The oxidation and reduction status of intracellular cysteine is also an indicator of the cellular redox status and can control survival from oxidative stress (16). Likewise, the intracellular redox environment can greatly affect the function of metabolic enzymes through direct interaction with reactive cysteine residues (17–19). Yet, the role of cysteine in mediating nutrient metabolism and cell growth in GBM remains largely unexplored.
We demonstrate that GBM exhibits a unique susceptibility to the amino acid, cysteine, and a variety of compounds that contain cysteine. This susceptibility is the result of direct mitochondrial toxicity, produced by paradoxical reductive stress that triggers production of mitochondrial hydrogen peroxide. This toxicity is exacerbated by glucose deprivation, making strategies that lower serum glucose, including antihyperglycemic agents and the ketogenic diet, potentially synergistic with cysteine-containing compounds to treat GBM.
Results
L-Cysteine Induces Cytotoxicity in Patient-Derived Glioma Cells.
As a precursor to the antioxidant glutathione, cysteine protects against harmful reactive oxygen species (ROS) that induce oxidative stress, inflammation, and aging (20). Likewise, in cancer, cysteine can fuel tumor growth (21). However, recent studies have demonstrated that cysteine compounds induce hydrogen sulfide production, reductive mitochondrial stress, and apoptosis (22–26). These findings indicate a context-specific role of cysteine-promoting compounds on cell survival in cancer.
We examined the cysteine and methionine pathway in four patient-derived glioma cell lines (603, anaplastic oligodendroglioma; 667, GBM, IDH wild type; MGG119, astrocytoma, IDH1 R132H+; MGG152, astrocytoma, IDH1 R132H+). 603 cells contain 1p/19q codeletion and IDH1 R132H mutation, and 667 cells contain Chromosome 7 gain, PTEN deletion, CDKN2A/B loss, and PDGFRA amplification. MGG119 cells have TP53 mutation, ATRX deletion, CDKN2A alteration, and MET fusion. MGG152 cells have TP53 mutation, ATRX mutation, BRCA2 mutation, and N-MYC amplification. All of the above cells are grown in the absence of serum but with growth factors (EGF and FGF) to better recapitulate the tumor environment. We starved these cells of cysteine and methionine and added increasing doses of L-cysteine and L-methionine to the tissue culture medium. We found that these cells grew less when starved of cysteine and methionine and paradoxically, also when treated with >5 mM L-cysteine (Fig. 1 A and C). Addition of L-methionine did not have a major effect on growth (Fig. 1B). Treatment with L-cysteine and L-methionine in combination recapitulated the effects of L-cysteine treatment alone.
Fig. 1.
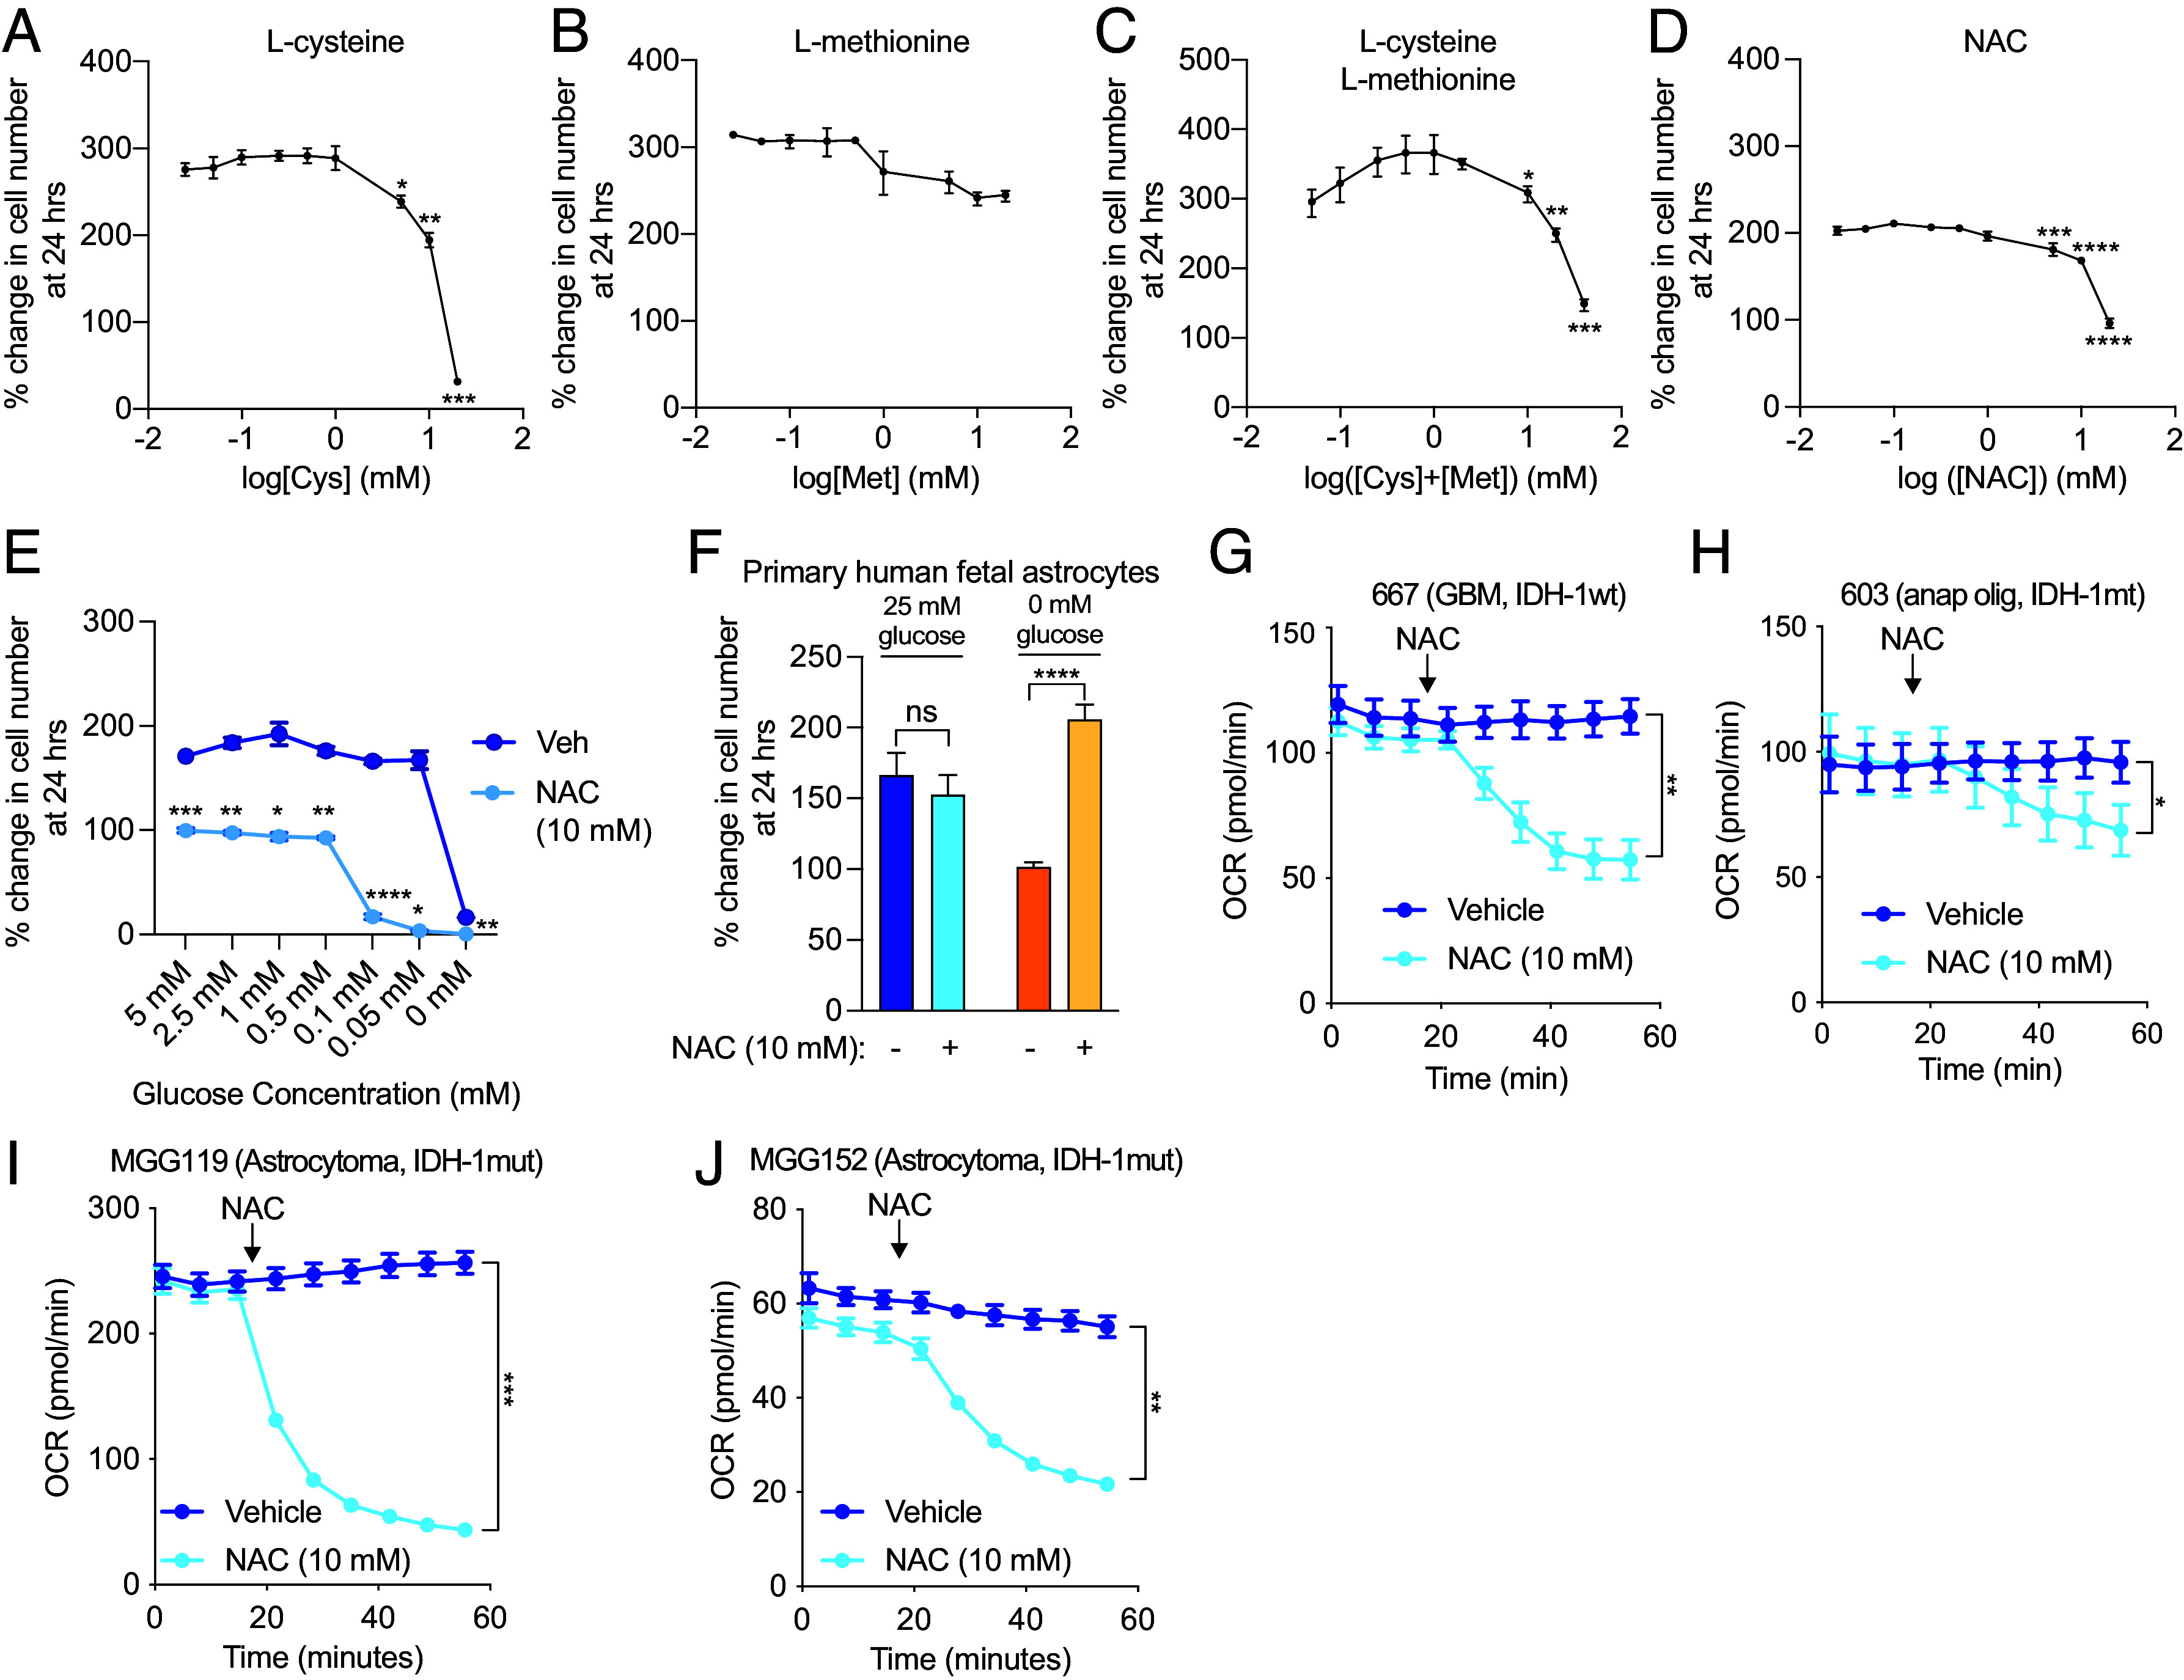
Cysteine induces cytotoxicity and reduces oxygen consumption in glioma cells. 667 cells were starved of cysteine and methionine, and growth was measured after treatment with L-cysteine (A), L-methionine (B), or the combination (C). 667 cells in cysteine- and methionine-containing media were treated with 10 mM NAC, and growth was measured at 24 h (D). 667 cells were treated with vehicle or 10 mM NAC and subjected to the indicated glucose concentrations (0 to 5 mM) for growth measurement at 24 h (E). Primary human fetal astrocytes were treated with 10 mM NAC under normal glucose conditions (25 mM) or glucose starvation (0 mM), and growth was measured at 24 h (F). 667 cells (G), 603 cells (H), MGG119 (I), and MGG152 (J) cells were treated with 10 mM NAC, and the OCR was measured using the Agilent Seahorse assay. *P < 0.05; **P < 0.01; ***P < 0.001; ****P < 0.0001.
N-acetylcysteine (NAC), an FDA-approved drug to treat acetaminophen overdose and asthma, is a cysteine-containing prodrug that possesses greater solubility than L-cysteine under physiological conditions. We chose to use NAC in subsequent experiments as a putative cysteine-containing compound. NAC administration resulted in reduced growth at doses of 5, 10, and 20 mM (Fig. 1D). L-cysteine, L-cystine, and D-cysteine also reduced growth of 667 cells, as did reduced glutathione (GSH) and glutathione reduced ethyl ester (GREE), which more readily crosses the cell membrane (SI Appendix, Fig. S1 A–E). Inclusion of serum in growth media did not affect NAC-induced growth inhibition (SI Appendix, Fig. S1F). Knockdown of the cystine-glutamate antiporter SLC7A11 did not affect NAC-induced cytotoxicity, which is expected given that NAC is thought to be freely permeable to cells (SI Appendix, Fig. S1 G and H). NAC treatment also exhibited a dose-dependent toxicity with glucose starvation, with a marked reduction in growth noted at glucose concentrations less than 0.5 mM (Fig. 1E). 2-deoxyglucose (2-DG), which prevents glucose oxidation and subsequent entry into glycolysis, recapitulated the synergistic effect of glucose starvation on NAC-induced cytotoxicity (SI Appendix, Fig. S1I). Notably, primary human fetal astrocytes (PHFA) were unaffected by NAC treatment (Fig. 1F). In fact, NAC treatment improved growth when PHFA were starved of glucose. Likewise, nonglioma cells, including A549 (lung), H1975 (lung), HCC2935 (lung), MCF-7 (breast), and HT-29 (colon) cells were all unaffected by NAC treatment (SI Appendix, Fig. S1J), demonstrating a unique susceptibility of GBM to cysteine compounds.
Since cysteine compounds have been shown to modulate mitochondrial metabolism in cancer cells (23), we examined mitochondrial oxygen consumption in the presence of NAC. Treatment with 10 mM NAC induced rapid reduction in mitochondrial oxygen consumption in 667, 603, MGG119, and MGG152 cells (Fig. 1 G–J). L-cysteine, D-cysteine, GSH, and GREE also caused a similar reduction in oxygen consumption rate (OCR); the effect of GREE was likely more pronounced than GSH because of more efficient cell entry (SI Appendix, Fig. S1 K–N). A549, H1975, and HCC2935 cells exhibited no reduction in OCR (SI Appendix, Fig. S2 A–C).
Cysteine and Methionine Metabolic Genes Are Up-Regulated in Glioblastoma.
To determine whether GBM exhibits unique cysteine metabolism as compared to other human cancers, we conducted a Kyoto Encyclopedia of Genes and Genomes (KEGG) analysis on glucose and amino acid pathways in GBM using The Cancer Genome Atlas (TCGA) database. We found that GBM exhibits the highest expression of cysteine and methionine pathway gene expression of 32 human cancers and that this gene expression is increased in GBM versus WHO grade 2 and 3 glioma (Fig. 2 A and B and SI Appendix, Fig. S3A). There was no significant difference in the cysteine-methionine signature among brain regions (SI Appendix, Fig. S3B), and normal brain tissue exhibited a similar level of this signature as other organs, with the liver having the highest level (SI Appendix, Fig. S3C).
Fig. 2.

Cysteine and methionine genes and metabolites are overexpressed in glioma. (A) Cysteine-methionine KEGG signature in 32 human cancers obtained from The Cancer Genome Atlas (TCGA). (B) Cysteine-methionine KEGG signature in glioma based on the WHO grade. (C) Cysteine metabolite abundance was obtained from the cancer metabolite database (27), and significantly different metabolites among WHO grade 2, 3, and 4 gliomas are presented. **P < 0.01; ***P < 0.001; ****P < 0.0001.
We next examined metabolite levels in human glioma using the Pan-cancer Metabolism Data Explorer. When we compared metabolite levels among WHO grade 2, 3, and 4 gliomas, we found that hypotaurine, S-adenosylhomocysteine, and cysteine sulfinic acid increased with grade, whereas cystathionine, homocysteine, and S-methylcysteine decreased with grade (Fig. 2C). These findings reinforce that cysteine metabolic genes are not only up-regulated in GBM but also contribute to alterations in levels of cysteine metabolites.
N-Acetylcysteine Induces Mitochondrial Toxicity in Glioma Cells.
Because NAC caused a rapid reduction in mitochondrial oxygen consumption in GBM cells, we characterized additional metabolic deficits induced by NAC. NAC caused a reduction in mitochondrial membrane potential within 6 h of treatment (Fig. 3A). Likewise, NAC induced a reduction in the NADPH/NADP+ ratio and reduced glutathione (GSH)/oxidized glutathione (GSSG) ratio within 5 min of treatment. Even though NAC is a known antioxidant, GBM cells exhibited a rapid oxidized state with NAC treatment, indicating a differential response in these cells. To determine the extent to which cysteine was metabolized to downstream metabolites, we treated 667 GBM cells with 10 mM 13C3-L-cysteine for 5 min and measured metabolic flux. We found that 13C3-L-cysteine treatment predominantly led to labeled L-cystine, L-cystathionine, and reduced and oxidized glutathione but did not find any significant difference in the fractions of 13C3-derived oxidized and reduced glutathione in treated cells (SI Appendix, Fig. S4A). Metabolic flux analysis using U-13C6-glucose (10 mM) in the presence of 10 mM NAC for 5 min demonstrated that upper glycolysis was not largely affected by NAC (SI Appendix, Fig. S4B). In fact, lower glycolytic metabolites, such as pyruvate (m + 3) and lactate (m + 3), and 3-phosphoglycerate derivates, such as serine (m + 3) and glycine (m + 2) were significantly reduced, suggesting that glucose may be shunted toward the pentose phosphate pathway to produce NADPH that would facilitate glutathione production. Administration of 10 mM NAC and U-13C5-glutamine (1 mM) for 5 min led to an increase in m + 5 labeled cis-aconitate, likely indicating that NAC induces reductive carboxylation (SI Appendix, Fig. S4C).
Fig. 3.

NAC induces mitochondrial toxicity in glioma cells. (A) 667 cells were treated with 10 mM NAC, and mitochondrial membrane potential was measured using tetramethylrhodamine (TMRE). 667 cells were treated with 10 mM NAC for 5 min, and NADPH/NADP+ levels (B) and reduced glutathione (GSH)/oxidized glutathione (GSSG) (C) were measured. (D) 667 cells were treated with 10 mM NAC for 2 h, and Annexin V and 7-AAD levels were measured by flow cytometry. (E) 667 cells were treated with 10 mM NAC for 8 h, and activated Caspase 3 levels were measured by fluorescence. (F) 667 cells were treated with 10 mM NAC for 8 h, and cytochrome C release from the mitochondria to the cytosol was measured through mitochondrial immunoprecipitation and subsequent mitochondrial and cytoplasmic lysate preparation followed by immunoblot. Quantification of three independent experiments is shown in (G). (H) 667 cells were treated with 10 mM NAC for 2 h, and cells were prepared for transmission electron microscopy. The number of visible cristae per mitochondria was counted from 312.5 µm2 area and quantified in (I). Results are indicative of four biological replicates. (Scale bars: 500 nm.) *P < 0.05; ****P < 0.0001.
Cells treated with NAC exhibited significantly higher levels of Annexin V and 7-aminoactinomycin D (7-AAD), indicators of apoptosis and necrosis, respectively (Fig. 3D). Eight-hour NAC treatment also increased activated caspase 3 levels (Fig. 3E) and induced cytochrome c released into the cytosol, an indication of mitochondrial membrane damage (Fig. 3 F and G). Finally, 2-h NAC treatment led to dissolution of mitochondrial cristae as assessed by transmission electron microscopy (Fig. 3 H and I).
NAC Induces Hydrogen Peroxide and Reductive Stress in Glioma Cells.
Prior studies have shown that reducing agents like NAC induce reductive stress by depleting oxidized electron acceptors (glutathione and thioredoxin), thereby allowing reduction of O2 to H2O2 (28). Given the rapid reduction in OCR induced by NAC and given the sensitivity of mitochondrial respiration to changes in the redox state, we hypothesized that the mechanism of NAC toxicity involved a rapid change in the mitochondrial redox state that induces mitochondrial toxicity. We isolated GBM mitochondria from 667 cells using a well-validated HA-tag-based method (29) and demonstrated immunoprecipitation of mitochondria with the matrix marker, citrate synthase (SI Appendix, Fig. S5 A and B). We confirmed that isolated mitochondria from 667 cells are still affected by NAC by showing a dose-dependent reduction in maximal OCR with NAC (SI Appendix, Fig. S5 C and D). Isolated mitochondria from A549 and H1975 lung cancer cells did not show an NAC-induced OCR reduction (SI Appendix, Fig. S5 E–H). In fact, A549 cells showed a significant increase in maximal OCR after NAC treatment.
To define the effect of NAC on mitochondrial electron transport chain complex expression, we treated 667 GBM and 603 glioma cells with NAC and measured complex expression by western blot. We found that NAC did not alter mitochondrial complex expression in either cell type (SI Appendix, Fig. S5 I and J). We then measured individual complex activity in response to NAC in 667 GBM cells. We isolated mitochondria and performed an electron flow assay after incubation with pyruvate, malate, and ADP. We found that NAC did not significantly reduce complex I or complex II activity but induced a reduction in complex IV-dependent OCR, which was inhibited by azide, a complex IV inhibitor (SI Appendix, Fig. S5 K–M).
Using the fluorescent probe, Amplex UltraRed, we measured H2O2 production in isolated alamethicin-permeabilized mitochondria and found that NAC rapidly increased the rate of H2O2 production, which was suppressed by H2O2 detoxification with catalase (Fig. 4A). Though antioxidants like NAC are known to induce spontaneous H2O2 production in tissue culture medium and buffers, rates of H2O2 production were higher in NAC-treated cells than in mitochondrial assay buffer alone (SI Appendix, Fig. S6A). In addition, NAC induced a similar reduction in OCR as 100 µM H2O2 (SI Appendix, Fig. S6B), indicating that NAC produces higher levels of H2O2 than have been shown to be produced in tissue culture medium alone. We also measured mitochondrial H2O2 production by direct visualization using the Mito-PY1 probe, a mitochondrial permeable reactive oxygen species fluorescent probe that specifically reports mitochondrial H2O2. 2-h treatment with NAC led to significantly higher levels of mitochondrial H2O2 than vehicle (Fig. 4 B and C). Together, these results indicate that NAC induces rapid mitochondrial H2O2 production in GBM cells, leading to eventual cytotoxicity.
Fig. 4.
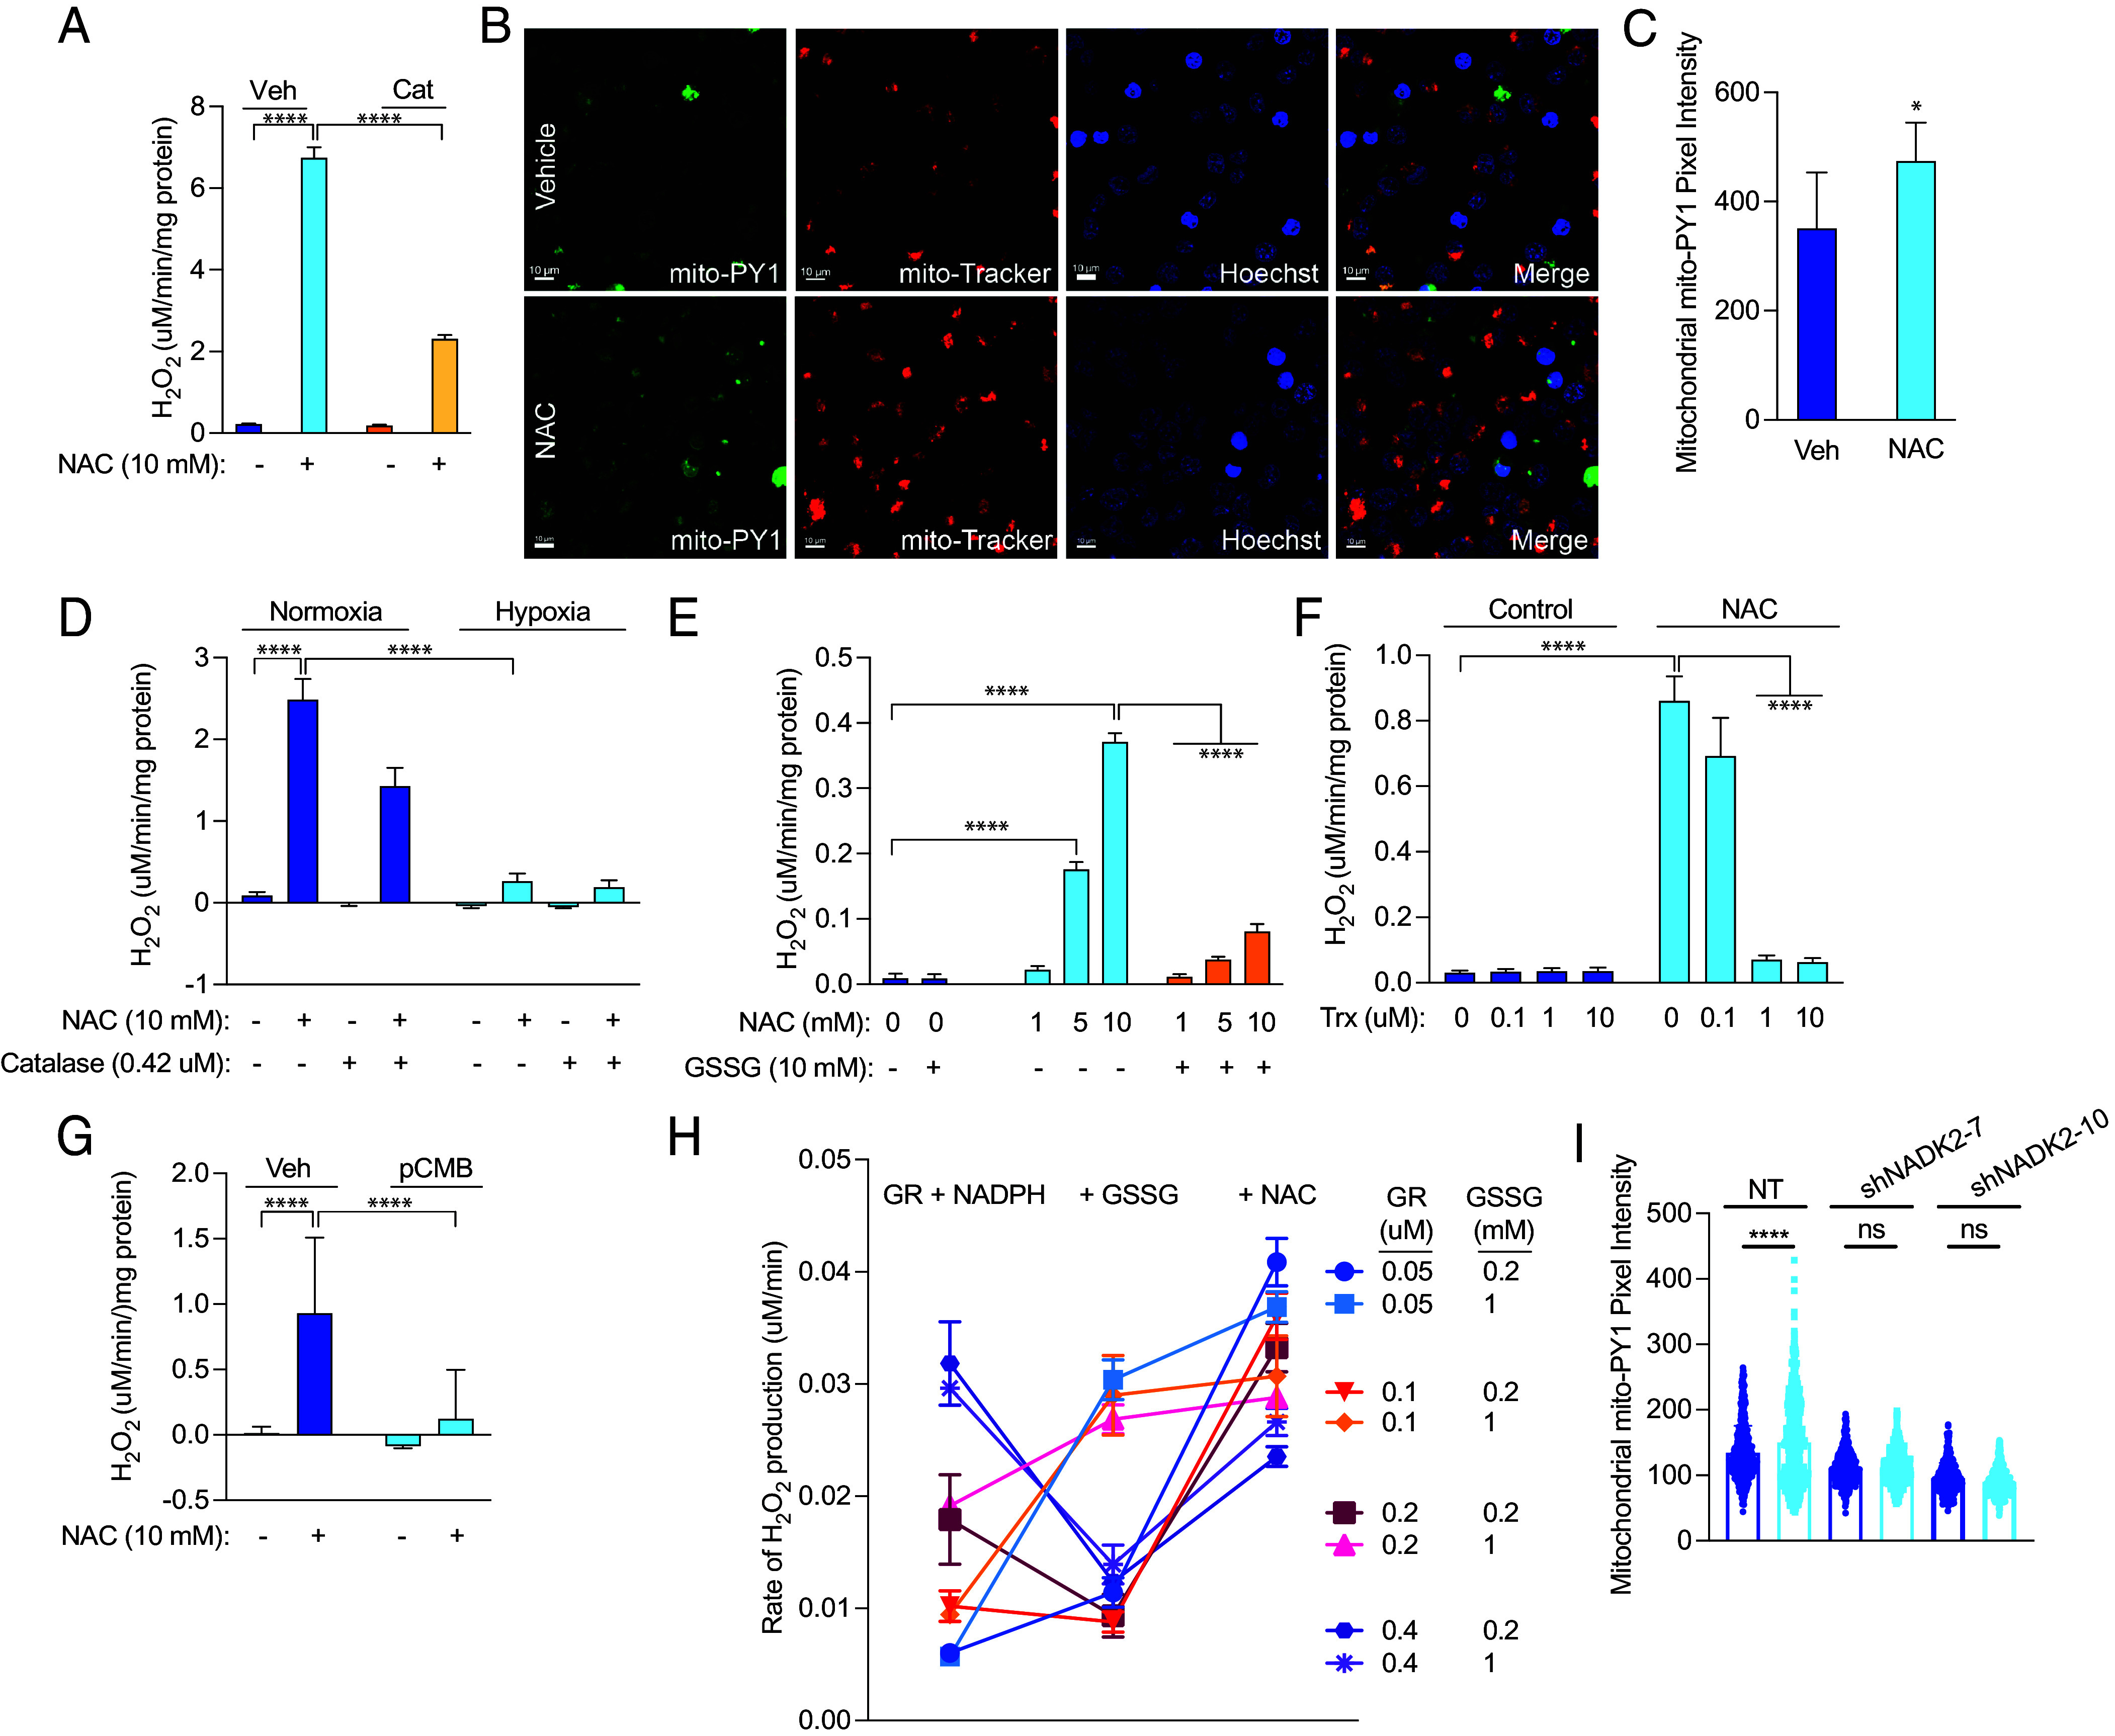
NAC induces hydrogen peroxide production in glioma cells. (A) Mitochondria were isolated from 667 cells, permeabilized with 10 µM alamethicin, and treated with vehicle or 10 mM NAC. The rate of H2O2 production was measured, and 0.42 µM catalase was used to detoxify H2O2. (B) 667 cells were treated with 10 mM NAC for 2 h, and mitochondrial H2O2 was measured by confocal microscopy using the mito-PY1 dye. Mitotracker was used to determine mitochondrial localization. Mito-PY1 intensity was quantified in (C), with results indicating three independent experiments. 667 mitochondria were treated as in (A) but exposed to normoxia or 1% hypoxia in a modular hypoxia chamber (D), treated with oxidized glutathione (GSSG) (E), recombinant human Trx (F), or 50 µM perchlorobenzoic acid (pCMB) (G), after which time the rate of H2O2 production was measured. (H) H2O2 production was measured by Amplex Ultra Red in cell-free conditions by incubation with glutathione reductase (GR) at the indicated concentrations along with 100 µM NADPH, followed by addition of oxidized glutathione (GSSG) at the indicated concentrations and then 10 mM NAC. (I) Mito-PY1 intensity was quantified from confocal microscopy from three independent experiments of 667 cells treated with 10 mM NAC for 30 min. Mitotracker was used to determine mitochondrial localization. *P < 0.05; **P < 0.01; ***P < 0.001; ****P < 0.0001.
Because oxygen serves as an electron acceptor to facilitate reductive stress, we examined the effect of hypoxia (1% O2) on NAC-driven H2O2 production. When we treated isolated mitochondria with NAC and exposed them to normoxia or immediate hypoxia, we found significantly reduced H2O2 production (Fig. 4D). These findings indicate that NAC-induced mitochondrial reductive stress likely occurs through electron overflow that converts oxygen into an alternate electron acceptor.
Electron acceptor deficiency is a critical determinant of reductive stress (28). By providing alamethicin-permeabilized mitochondria from 667 cells with oxidized glutathione (GSSG) or recombinant thioredoxin (Trx), we nearly completely rescued NAC-induced H2O2 production (Fig. 4 E and F). Thiol-reactive compounds can also alter electron flow from reducing agents to available acceptors. Because we hypothesize that NAC causes reduction of reactive thiols, coadministration of thiol-reactive agents should decrease the effect of NAC. We found that p-chloromercuribenzoic acid (pCMB) decreased NAC-induced H2O2 production (Fig. 4G). In cell-free conditions, we also found that NAC induces H2O2 production from glutathione reductase (GR) and NADPH, likely by interfering with electron transfer to GSSG, as previously shown by Korge et al. (28) (Fig. 4H). In addition, knockdown of mitochondrial nicotinamide adenine dinucleotide kinase (NADK2), which phosphorylates NAD+ to produce NADP+, abrogates H2O2 production in the presence of NAC (Fig. 4I and SI Appendix, Fig. S7A). Together, these data indicate that NADPH is required as the electron donor for reductive stress and that a shortage of oxidized electron acceptors mediates cysteine susceptibility in GBM cells.
Redox Enzyme Overexpression Rescues NAC-Induced Mitochondrial H2O2 Production.
The glutathione/glutathione peroxidase 3 (Gpx)/glutathione reductase (GR) and the peroxiredoxin 3 (Prx)/thioredoxin 2 (Trx)/thioredoxin reductase (TrxR2) systems are the major mitochondrial matrix H2O2 scavenging systems and are regulated by the redox environment within the matrix. We hypothesized that cysteine susceptibility in GBM is due to a specific deficiency in mitochondrial redox enzymes. Therefore, we investigated the effect of genetic overexpression of redox enzymes on NAC-induced cytotoxicity and H2O2 production. Thioredoxin-2 (Trx2) is the mitochondrial thioredoxin that acts as the electron acceptor for mitochondrial thioredoxin reductase (TrxR2). We genetically overexpressed cytoplasmic Trx and mitochondrial Trx2 in our GBM cells (SI Appendix, Fig. S7 B and C) and found that Trx2 overexpression accelerated GBM growth in untreated cells and reduced cytotoxicity after NAC treatment (Fig. 5A). Likewise, Trx2 overexpression decreased NAC-induced H2O2 production and protected against OCR reduction (Fig. 5 B and C).
Fig. 5.
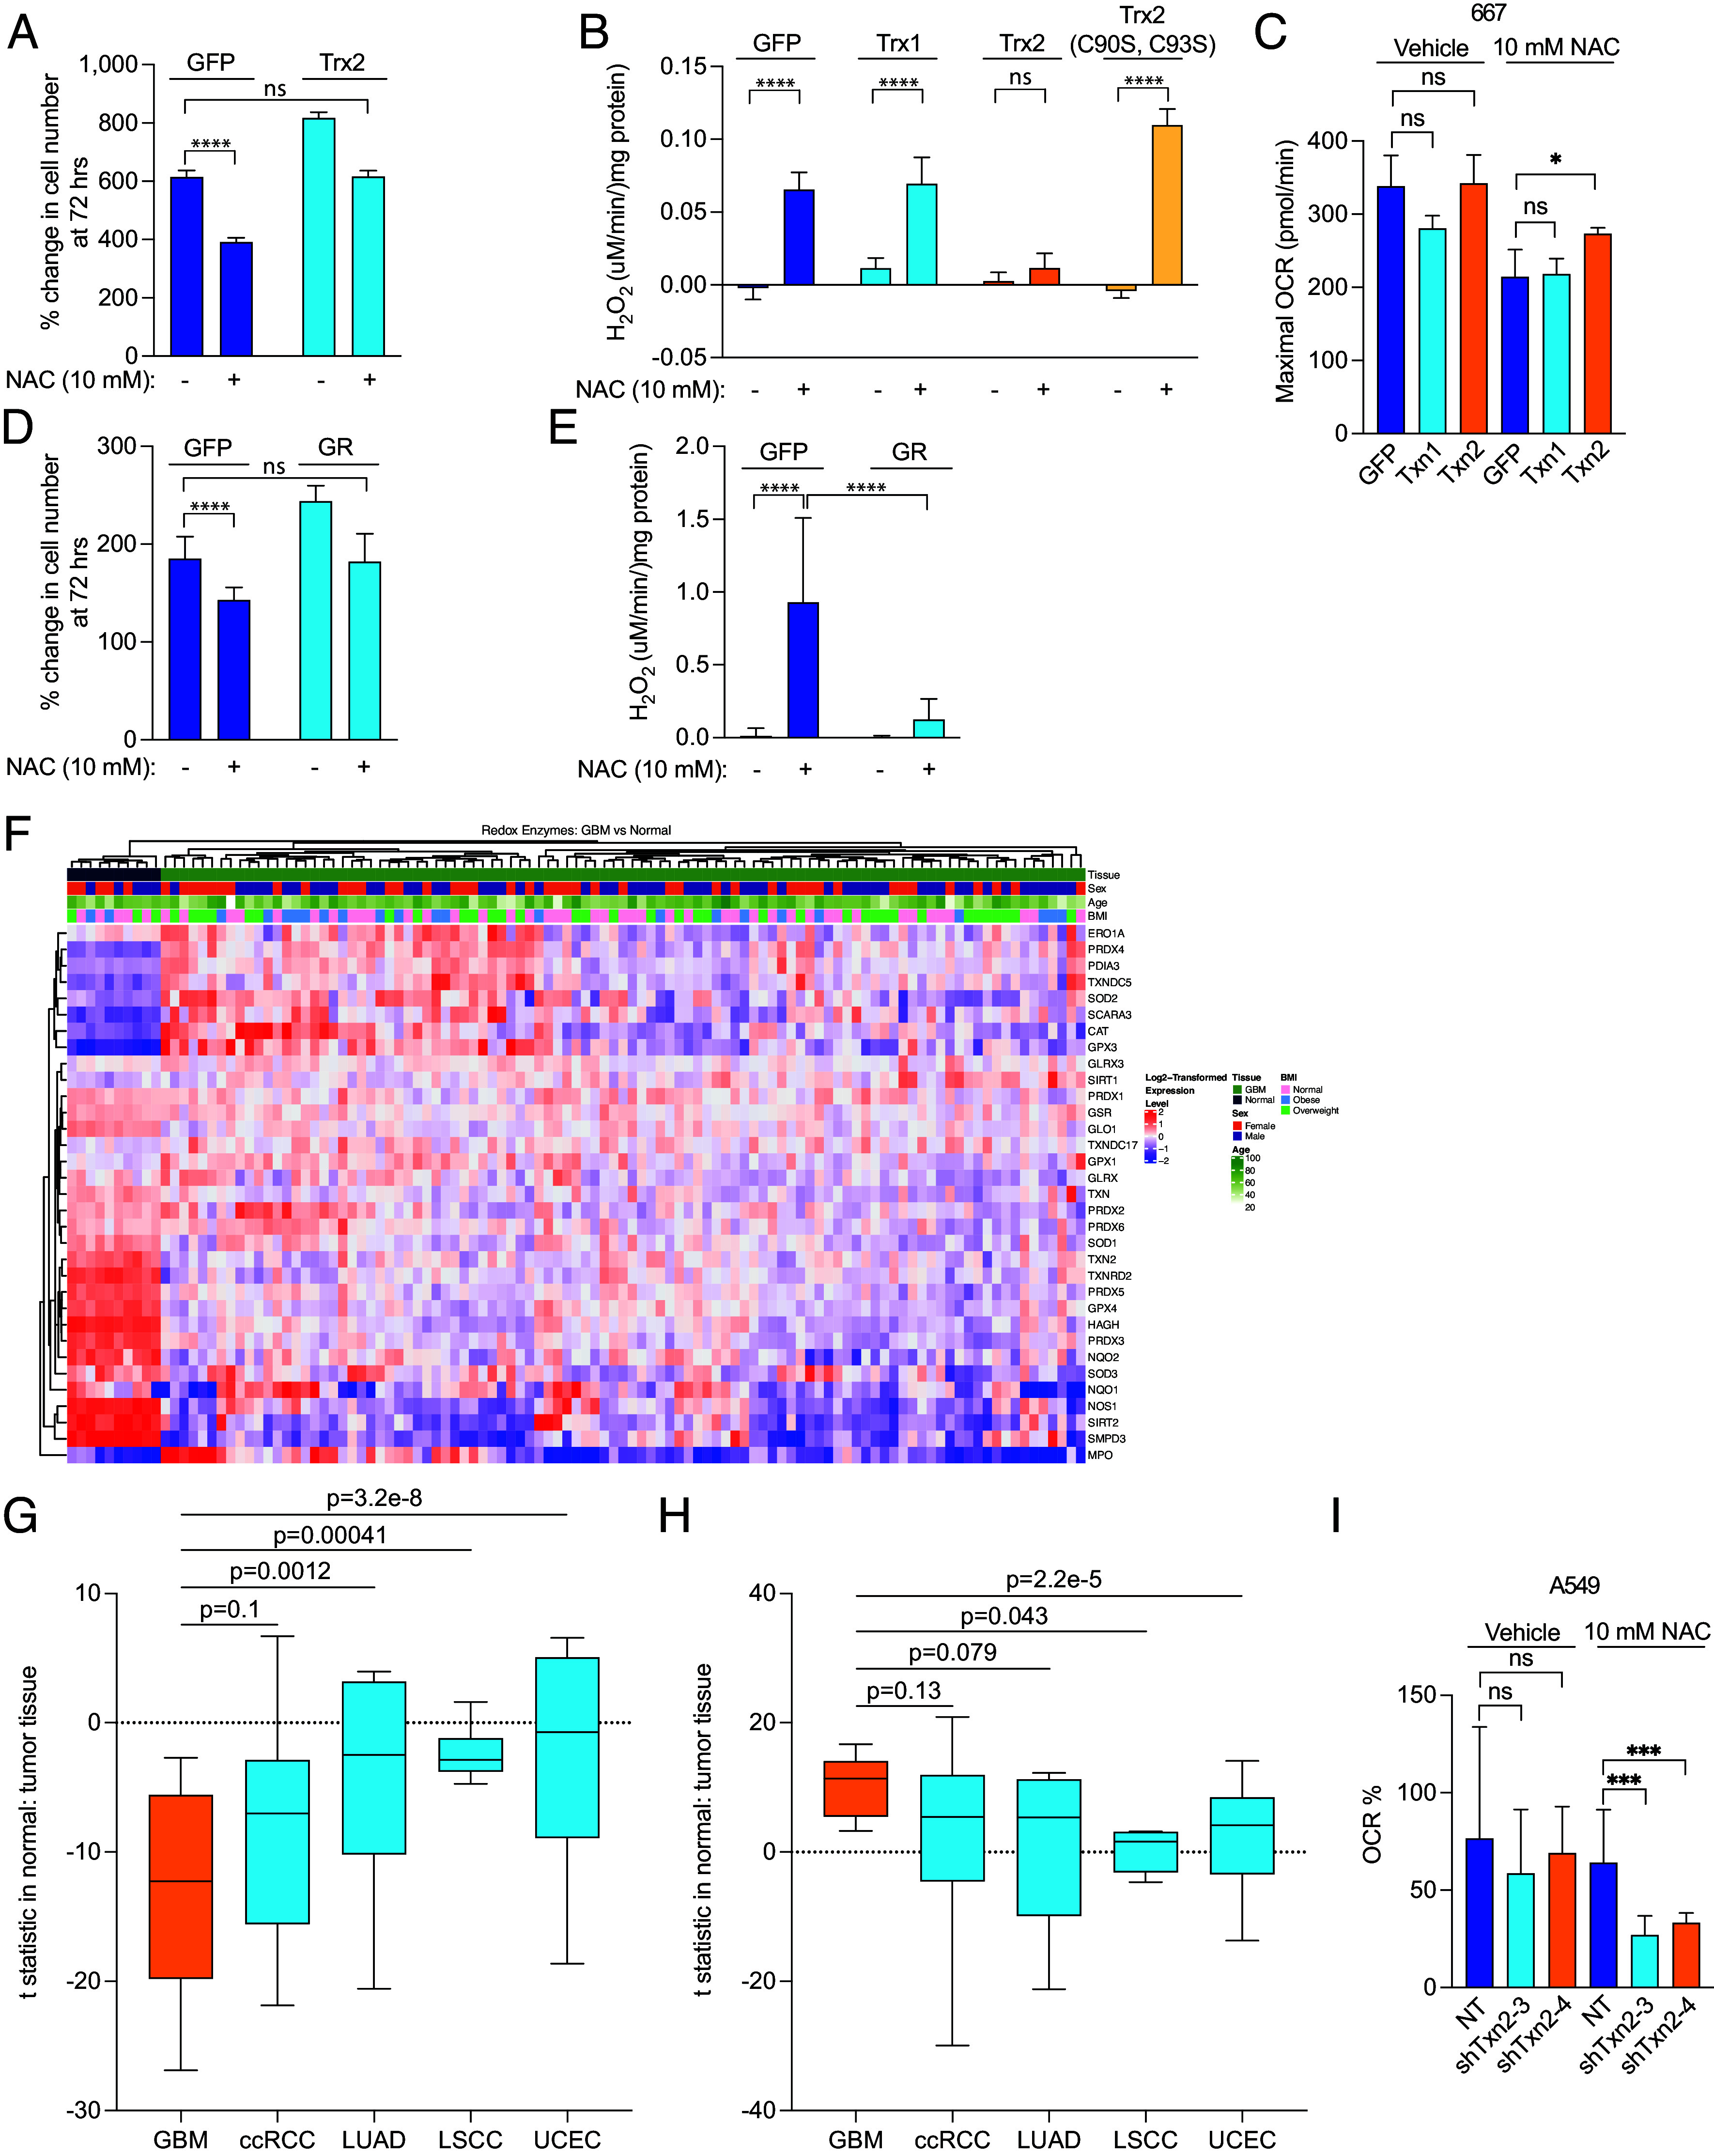
Redox enzyme overexpression ameliorates NAC-induced reductive stress in GBM. (A) GFP- and Trx-2-expressing 667 cells were treated with 10 mM NAC for 72 h, and growth was measured. (B) Mitochondria were isolated from 667 cells expressing GFP, Trx1, Trx2, or Trx2 C90S/C93S, permeabilized with 10 µM alamethicin, and treated with vehicle or 10 mM NAC, after which time the rate of H2O2 production was measured. (C) Mitochondria were isolated from 667 cells expressing GFP, Trx1, and Trx2, and maximal OCR was measured after treatment with 10 mM NAC. (D) GFP- and GR-expressing 667 cells were treated with 10 mM NAC for 72 h, and growth was measured. (E) Mitochondria were isolated from 667 cells expressing GFP or GR, permeabilized with 10 µM alamethicin, and treated with vehicle or 10 mM NAC, after which time the rate of H2O2 production was measured. (F) GBM and normal brain tissue proteomics data were obtained from the CPTAC database, and the database was interrogated based on a signature of 39 known redox enzymes. An unsupervised hierarchically clustered heatmap was generated. A signature of either significantly down-regulated (G) or significantly up-regulated (H) proteins was assayed among GBM, clear cell renal cell carcinoma, lung squamous cell carcinoma, lung adenocarcinoma, and uterine corpus endometrial carcinoma available from CPTAC. (I) Mitochondria were isolated from A549 cells expressing nontargeting shRNA (NT) and two shRNAs targeting txn2 (shtxn2-3 and shtxn2-4), and percent change in maximal OCR was measured after treatment with 10 mM NAC. ***P < 0.001; ****P < 0.0001.
Trx and Trx2 contain a dithiol active site motif (Cys-Gly-Pro-Cys) that is conserved from archaea to mammals. In Trx2, these cysteine residues occur at amino acid positions 90 and 93. To study the importance of these cysteine residues in the electron acceptor function of Trx2, we mutated these residues to serine, thereby abrogating its reactivity. We found that mutation of both cysteine residues to serine abolished Trx2’s rescue of H2O2 production, indicating that the enzymatic function of Trx2 is critical for its rescue of reductive stress (Fig. 5B). Trx overexpression did not affect H2O2 production or OCR, but Trx2 overexpression partially rescued the reduction in OCR induced by NAC (Fig. 5C and SI Appendix, Fig. S7F).
Glutathione reductase (GR) is an NADPH-dependent oxidoreductase enzyme containing FAD and a redox disulfide catalytic domain. GR regenerates GSH from GSSG to detoxify ROS but also facilitates reductive stress when GSSG is in short supply. Therefore, we sought to investigate the effect of GR overexpression on reductive stress in GBM cells. We genetically overexpressed GR (SI Appendix, Fig. S7D) and found that this overexpression accelerated GBM growth and reduced NAC-induced cytotoxicity (Fig. 5D). Similar to Trx2 overexpression, GR overexpression also nearly completely blocked NAC-induced H2O2 production (Fig. 5E). These findings indicate that a relative GR deficiency may promote reductive stress in response to NAC.
To determine whether GBM exhibits a relative deficiency of redox enzymes in comparison to other cancers, we investigated the National Cancer Institute’s Clinical Proteomic Tumor Analysis Consortium (CPTAC) using a redox enzyme signature composed of 39 proteins known to be involved in redox enzyme function. From this analysis, we found that GBM exhibited a lower redox enzyme signature than normal brain (Fig. 5F). Within this redox enzyme signature, 19 proteins were significantly down-regulated and 10 were significantly up-regulated compared to normal brain tissue (Table 1). Txn2 (Trx2), Txnrd2 (TrxR2), and GSR (GR) were all significantly down-regulated in GBM tissue as compared to the normal brain.
Table 1.
Proteomics analysis of proteins in GBM versus normal brain tissue from the CPTAC Database
| Gene name | P-value | Median difference in expression | Direction of regulation |
|---|---|---|---|
| CAT | 1.01E−05 | 0.85 | Up |
| GPX3 | 2.34E−07 | 1.70 | Up |
| MPO | 0.0236873 | 0.91 | Up |
| PDIA3 | 1.03E−06 | 0.61 | Up |
| PRDX4 | 2.93E−07 | 1.00 | Up |
| SCARA3 | 1.14E−06 | 1.15 | Up |
| SIRT1 | 0.0003511 | 0.35 | Up |
| SOD2 | 0.0019225 | 0.70 | Up |
| TXNDC17 | 0.0011165 | 0.25 | Up |
| TXNDC5 | 4.82E−07 | 0.83 | Up |
| GLO1 | 2.62E−07 | −0.60 | Down |
| GLRX | 0.0318177 | −0.30 | Down |
| GPX4 | 2.21E−07 | −1.16 | Down |
| GSR | 4.97E−05 | −0.31 | Down |
| HAGH | 2.09E−07 | −1.62 | Down |
| NOS1 | 3.27E−07 | −2.06 | Down |
| NQO2 | 9.73E−07 | −1.12 | Down |
| PRDX1 | 0.0060504 | −0.29 | Down |
| PRDX2 | 0.0099638 | −0.45 | Down |
| PRDX3 | 2.09E−07 | −1.39 | Down |
| PRDX5 | 2.09E−07 | −1.06 | Down |
| PRDX6 | 0.0066567 | −0.24 | Down |
| SIRT2 | 8.29E−07 | −2.30 | Down |
| SMPD3 | 2.48E−07 | −2.63 | Down |
| SOD1 | 7.57E−06 | −0.63 | Down |
| SOD3 | 0.0008276 | −0.74 | Down |
| TXN | 6.21E−06 | −0.59 | Down |
| TXN2 | 2.93E−07 | −0.86 | Down |
| TXNRD2 | 2.09E−07 | −1.34 | Down |
We then developed a signature containing either all significantly up-regulated or all significantly down-regulated proteins in GBM as compared to four other cancers whose proteomic data was available from CPTAC, including clear cell renal cell carcinoma (ccRCC), lung squamous cell carcinoma (LSCC), lung adenocarcinoma (LUAD), and uterine corpus endometrial carcinoma (UCEC). Among the down-regulated protein signature, GBM’s signature was significantly lower than 3 of the other tumor types (P-value for ccRCC was 0.1). Among the up-regulated protein signature, GBM’s signature was significantly higher than 2 of the other tumor types (P-value for LUAD and ccRCC was 0.079 and 0.13, respectively). Analysis of TCGA and the Rembrandt database (30), a separate cohort of 671 patients with malignant brain tumors, showed that high-grade gliomas have lower expression of Txn2 and Txnrd2 than low-grade glioma (SI Appendix, Fig. S7H). These proteomics and genomics results suggest that deficiency of specific redox enzymes, including 3 of the most common enzymes involved in redox susceptibility, may underlie GBM’s unique susceptibility to cysteine.
To test whether higher expression of mitochondrial redox proteins is critical for protection of other cancer cells against NAC-induced reductive stress, we knocked down expression of Trx2 in A549 lung cancer cells (SI Appendix, Fig. S7E). We found that isolated mitochondria from A549 cells with reduced Trx2 expression exhibited a near-complete elimination of oxygen consumption after NAC addition and were insensitive to FCCP (Fig. 5I and SI Appendix, Fig. S7G). These data suggest that susceptibility to cysteine-induced reductive stress is at least partially determined by the relative abundance of mitochondrial electron acceptors and that modulating expression or activity of this system may enhance cysteine susceptibility in other cancer cells.
A Cysteine Peptide Induces H2O2 Production in An Orthotopic Model of GBM.
NAC has limited blood–brain permeability, though several modifications, including amidation, have improved its efficacy in a mouse model of neurological disease. A four-amino-acid peptide containing the active motif of thioredoxin, C-P-G-C, with two cysteine residues critical to thioredoxin’s catalytic activity, was developed for use in preclinical mouse models (31–33). We hypothesized that the reactive cysteine residues in this peptide would elicit a similar cytotoxic effect as NAC when used in our mouse model. We first assessed the effect of CB4, a thioredoxin-mimetic peptide, on oxygen consumption in 667 cells in vitro (34) (Fig. 6A). We found that CB4 was 100-200X more potent than NAC in reducing OCR in these cells (Fig. 6B).
Fig. 6.

A cysteine-containing peptide induces H2O2 in an orthotopic GBM mouse model. (A) Structure of the TXM-CB4 peptide. (B) The OCR was measured in 667 cells in the presence of H2O2, NAC, and CB4 at the indicated concentrations. (C) Schematic of preclinical orthotopic GBM mouse model treated with CB4 peptide. H2O2 bioluminescence was measured in orthotopic GBM xenografts in vivo using H2O2 luciferin at days 7 to 10 after treatment initiation with vehicle, 2-DG (1,000 mg/kg), or 2-DG (1,000 mg/kg) and CB4 (500 mg/kg) intraperitoneally twice daily 5 d a week, with quantification shown in (D) and bioluminescent images shown in (E).
To assess the effect of NAC on H2O2 production in vivo, we developed a preclinical orthotopic GBM xenograft model (Fig. 6C). We implanted luciferase-expressing 667 cells into the brains of NSG mice and allowed tumors to grow until reaching prespecified bioluminescence intensity. We then began intraperitoneal treatment with vehicle, 2-DG (1,000 mg/kg), or 2-DG and CB4 (500 mg/kg) twice daily, 5 d per week. We evaluated tumor H2O2 production using the bioluminescent probe, peroxy-caged luciferin. We found that combined 2-DG and CB4 administration induced significantly greater H2O2 bioluminescence in orthotopic xenografts than 2-DG or vehicle alone (Fig. 6 D and E). These data demonstrate that treatment of mice with cysteine-containing peptides induces reductive stress in intracranial xenografts. However, we did not observe a significant reduction in orthotopic tumor growth or enhanced survival with this treatment combination.
Discussion
Altered redox homeostasis is a hallmark of cancer. Cancer cells must maintain sufficient ROS to grow by inactivating phosphotyrosine phosphatases to facilitate receptor tyrosine kinase signaling but minimizing excessive ROS that hampers mitochondrial biogenesis. Though oxidative stress has been well explored in cancer, reductive stress is being increasingly recognized as an alternative mechanism of ROS generation that involves reductive overflow to alternate electron acceptors, such as O2 (28).
We found that the amino acid cysteine induces cytotoxic stress in GBM cells, driven by rapid reduction of oxygen consumption, depletion of intracellular NADPH and glutathione, and mitochondrial cristae dissolution. In GBM mitochondria, the cysteine prodrug NAC induced rapid H2O2 production, an effect blocked by catalase, hypoxia, oxidized glutathione, and thioredoxin. In other cancer cell lines, including breast, lung, colon, and pancreas, NAC had no effect on growth or oxygen consumption. We found that treatment of mice bearing orthotopic GBM xenografts with a cysteine-containing peptide CB4 induced H2O2 in these brain tumors in vivo. Though NAC is mostly known as a cellular antioxidant, these results demonstrate that its function depends on the cell type and state in which it is used. For example, the process of reductive stress depends on excess mitochondrial reducing equivalents that overwhelm available electron acceptors. As a result, cells with sufficient electron acceptors will exhibit resistance to reductive stress. In our GBM cells, genetic overexpression of several redox enzymes, including Trx2 and GR, rescued NAC-induced H2O2 production. Trx2 overexpression also prevented OCR reduction induced by NAC. These findings suggest that redox enzyme deficiency supports cysteine susceptibility in GBM. Indeed, from an analysis of CPTAC data, we found that GBM exhibits lower levels of Trx2, TrxR2, and GR as compared to normal brain and other human cancers.
These results also add to a growing body of literature investigating cysteine metabolism in cancer. Most recent studies evaluating cysteine metabolism in cancer have focused on the dependency of cysteine for glutathione biosynthesis to buffer ROS, which is largely driven by the cystine-glutamate antiporter, system Xc (35–39). In this context, either extracellular cysteine depletion or intracellular glutamate depletion sensitizes cells to oxidative stress and subsequent death. Alternatively, some groups have found that cysteine abundance leads to cell death. For example, Prabhu et al. found that cysteine-containing compounds, such as cysteine sulfinic acid (CSA), cause cytotoxicity in GBM cells, which they attributed to CSA-mediated inhibition of pyruvate dehydrogenase and reduction of mitochondrial pyruvate metabolism (40). Other studies have found that cysteine administration contributes to accumulation of intracellular reduced glutathione that triggers reductive stress (22, 23, 41). Our data, on the other hand, show that cysteine susceptibility does not depend on any particular cysteine metabolic pathway but rather is a feature of cysteine’s ability to alter the intracellular redox state. Indeed, we did not find evidence of accumulation of cysteine by-products in our cells after labeling with 13C3-L-cysteine. Additionally, we found immediate depletion of intracellular NADPH and reduced glutathione, arguing that intracellular cysteine in these cells consumes rather than produces glutathione. Our findings that mutation of two reactive cysteine residues in Trx2, cysteine 90 and 93, abrogate its rescue of NAC-induced H2O2 production suggest that reactive cysteine residues on redox enzymes are required for cysteine-induced reductive stress. Therefore, it is likely that intracellular cysteine accumulation drives a reductive phenotype that overwhelms electron acceptors. This phenomenon is similar to the susceptibility of cysteine residues on numerous metabolic enzymes to the redox state of the cell. For example, several enzymes involved in glucose and amino acid metabolism, including pyruvate dehydrogenase, mitochondrial pyruvate carrier, aconitase, and phosphoglycerate dehydrogenase, have all been shown to be inhibited by oxidation of reactive cysteine residues (42–45). In our studies, metabolic tracing experiments suggest that the effects of NAC on these pathways are minimal and do not adequately explain the rapid and severe reduction in mitochondrial metabolism. Therefore, it is likely that the predominant mechanism of cysteine toxicity in our cells is through mitochondrial reductive stress that drives H2O2 production.
Our results also demonstrate that cysteine susceptibility synergizes with glucose starvation in GBM cells, providing therapeutic avenues to leverage synergistic regimens. Because detoxification of mitochondrial H2O2 depends on NADPH availability, glucose starvation depletes pentose phosphate-derived NADPH, thereby potentiating cysteine-induced toxicity. NAC is FDA-approved for several indications, including acetaminophen toxicity, contrast-induced nephropathy, and as an inhalational asthma treatment (46–48). It has been tested as a treatment, either alone or in combination with other cysteine-promoting drugs, to prevent oxidative stress that occurs after hypoxic-ischemic brain damage in stroke (49–52). Glucose starvation strategies, from antihyperglycemic drugs to the ketogenic diet, have also been tested alone and in combination with putative synergistic regimens for cancer treatment (53, 54). Therefore, rational combination of cysteine compounds with glucose-lowering treatments may enhance cysteine toxicity in GBM and spare normal cells since primary human fetal astrocytes were unaffected by this regimen.
Several important questions remain unanswered from this work. Why does GBM express higher levels of cysteine and methionine metabolic genes than every other cancer? One explanation may be that GBM depends to a greater extent on cystine uptake to release glutamate through Xc activity, causing excitotoxicity and death of surrounding cells that supports expansion within the skull case (9). GBM cells might also be dependent on cystine uptake to fuel glutathione production, which is especially important to mitigate the effects of ROS production under hypoxia (14, 55). The gasotransmitter hydrogen sulfide (H2S) is formed from cysteine-derived 3-mercaptopyruvate and serves as a potent activator of mitochondrial ATP production at low levels and inhibitor at high levels (56). Though the role of cysteine-derived H2S in mediating GBM growth and metabolic fitness remains controversial (57–60), GBM cells may depend on sufficient cystine uptake to maintain H2S-mediated energy production.
It is also unclear why GBM expresses lower levels of several mitochondrial redox enzymes than normal brain and several other cancers. Prior studies have shown that the brain may produce less ROS than other organs in response to ROS-inducing compounds and during aging (61). Therefore, GBM may not require comparably high levels of redox enzyme expression as other organs. It is also possible that high levels of intracellular cysteine compensate for reduced redox enzyme expression and are sufficient to detoxify ROS associated with GBM growth. Because therapeutic resistance to the alkylating agent temozolomide involves genomic instability and hypermutation (62–64), GBM may also require low levels of redox enzyme activity to maintain a high ROS burden. Fortunately, this simultaneous cystine avidity and reduced redox enzyme expression provide a unique opportunity to leverage susceptibility to reductive stress using cysteine-promoting compounds for GBM treatment.
In summary, we have shown that GBM possesses a unique susceptibility to the amino acid cysteine, which induces mitochondrial reductive stress that drives toxic accumulation of mitochondrial H2O2. This susceptibility is exacerbated by glucose starvation, making strategies to lower glucose levels synergistic with cysteine-promoting therapy. Future studies will evaluate the impact of these compounds on orthotopic GBM growth and survival in animal models of GBM.
Methods
Western Blot.
Whole-cell lysates were prepared in CST buffer (Cell Signaling Technology) containing protease inhibitor (Sigma) and were rotated at 4 °C for 30 min before DNA was pelleted. Samples (60 µg) were mixed with 50 mM DTT (Thermo Scientific) and loaded on 4 to 12% Tris-Glycine gels (Thermo-Fisher) for SDS-PAGE before being transferred onto 0.2 µm or 0.45 µm nitrocellulose membrane with wet transfer cells (Bio-Rad Laboratories). After 30 min of blocking with 10% milk, blots were incubated with primary antibodies diluted to 1:500 either at room temperature for 2 h or overnight at 4 °C. Blots were then incubated in either mouse or rabbit secondary antibody for 1 h at room temperature before being developed using Dura or Femto enhanced chemiluminescence (Pierce) and imaged with ChemiDoc XRS+ and ImageLab Software version 6.1 (both from Bio-Rad Laboratories).
Cell Proliferation Assay.
Cell proliferation was measured using the Cell Titer Glo reagent (Promega) according to the manufacturer’s instructions. Briefly, 10,000 cells were plated in a white-bottom 96-well plate. Drugs relevant to each experiment were added to corresponding wells, and the plate was placed in the incubator for 24 to 72 h based on the specific experiment performed. Cells were incubated with Cell Titer Glo reagent for 10 min on a rocking platform, and luminescence was measured on a Synergy Neo 2 plate reader (BioTek Instruments).
OCR Measurement.
The OCR was measured using the Seahorse XFe96 analyzer (Agilent) according to the manufacturer’s instructions. Briefly, 50,000 cells were plated in each well of a 96-well Seahorse plate. Adherent cells were plated the night prior to the assay, and nonadherent cells (603 and 667) were plated on Cell-Tak-coated (Corning) plates on the day of the assay according to the manufacturer’s instructions. At least 6 h prior to the assay, the assay cartridge was hydrated in water in a non-CO2 incubator at 37 °C. Cells were incubated in a non-CO2 incubator for 45 min. 10 mM NAC pH 7.4 was loaded into appropriate wells of the flux pack and placed into the XFe96 analyzer. The plate containing cells was subsequently loaded into the XFe96 analyzer, and OCR was analyzed using Seahorse Wave software.
For the electron flow assay, the experiment was performed as above except that isolated mitochondria were adhered to Cell-Tak-coated (Corning) plates, followed by incubation in 10 mM pyruvate, 2 mM malate, and 4 mM ADP for 30 min prior to the assay in a non-CO2 incubator at 37 °C. Injections were as follows: 100 µM rotenone (10 µM final concentration in well), 100 mM succinate (10 mM final concentration in well), 40 µM antimycin A (4 µM final concentration in well), and 100 mM ascorbate (10 mM final concentration in well) with 1 mM TMPD (100 µM final concentration in well). Inhibitors used for this assay were antimycin A (4 µM final concentration in well), sodium azide (20 mM final concentration in well), malonate (10 mM final concentration in well), oligomycin (2.5 µg/mL final concentration in well), and rotenone (10 µM final concentration in well).
Mitochondrial Isolation.
Mitochondrial isolation was performed as described previously (29). Briefly, cells were transduced with lentivirus expressing either 3X-Myc-EGFP-OMP25 or 3X-HA-EGFP-OMP25 and selected in puromycin-containing medium for at least 1 wk. Twenty to twenty-five million cells were harvested, washed with KPBS, and subjected to homogenization in a glass homogenizer with 10 strokes without rotation. After homogenization, lysates were centrifuged at 2,000 × g for 2 min, and the supernatant was added to HA magnetic beads (Pierce) for mitochondrial immunoprecipitation followed by three washes in KPBS. Lysates were prepared by adding Triton X-100 buffer to the beads according to the protocol, and whole mitochondria were isolated by adding HA peptide (Thermo Fisher) to the beads and incubating the bead mixtures at 37 °C for 10 min.
Hydrogen Peroxide Measurement.
Mitochondrial hydrogen peroxide levels were measured using the Amplex Red reagent (Thermo Fisher) according to the manufacturer’s instructions. Briefly, whole mitochondria were isolated using the method described above. Briefly, 400,000 whole-cell equivalents were added to each well of a 96-well plate. Mitochondria were permeabilized with 2 µg/mL Alamethicin (Sigma, A4665), and either vehicle or 100 mM NAC pH 7.4 was added to the wells. The Amplex Red reagent, mixed with 200 mU/mL horseradish peroxidase (Thermo Fisher, 31491), was added to each well, and fluorescence was read at an excitation wavelength of 544 nm and emission wavelength of 590 nm for 45 min at room temperature on a Synergy Neo 2 plate reader (BioTek Instruments). For cell-free H2O2 measurement, Amplex Ultra Red was used as above to detect H2O2 in KCl buffer (110 mM KCl, 10 mM HEPES, pH 7.4 with KOH) after combination of recombinant GR (0.05 to 0.4 µM) with 100 µM NADPH, followed by addition of oxidized glutathione (GSSG) (0.2 or 1 mM) and then 10 mM NAC.
Mitochondrial Membrane Potential Measurement.
Mitochondrial membrane potential was measured using the TMRE kit (Abcam) according to the manufacturer’s instructions. Briefly, 200,000 cells were treated with 10 mM NAC for the indicated time periods followed by incubation in 500 nM TMRE reagent. Fluorescence was read at an excitation wavelength of 544 nm and emission wavelength of 590 nm for 30 min at room temperature on a Synergy Neo 2 plate reader (BioTek Instruments).
Glutathione Measurement.
Glutathione was measured using the Glutathione Glo reagent (Promega) according to the manufacturer’s instructions. Briefly, 20,000 cells were plated in a 96-well plate, treated with 10 mM NAC pH 7.4 for the indicated time periods, and incubated with either Total Glutathione Lysis Reagent or Oxidized Glutathione Lysis Reagent before luminescence was read on a Synergy Neo 2 plate reader (BioTek Instruments).
NADPH Measurement.
NADPH was measured using the NADPH assay kit (Abcam) according to the manufacturer’s instructions. Briefly, 2 million cells were treated with either vehicle or 10 mM NAC. Six replicates were used for each condition. At 5 min after treatment, cells were extracted in NADP/NADPH extraction buffer, and samples were deproteinated using 10 kD spin columns (ab93349). Total NADP/NADPH and NADPH levels were measured as per the protocol, and readings were taken 1 h after NADPH reaction mix incubation at OD450 nm on a Synergy Neo 2 plate reader (BioTek Instruments).
Apoptosis and Necrosis Measurement.
Apoptosis and necrosis were measured using the apoptosis/necrosis detection kit (Enzo). Briefly, 200,000 cells were treated with 10 mM NAC pH 7.4 for the indicated time periods before being incubated with the apoptosis (Annexin V) and necrosis (7-AAD) detection reagents according to the protocol. Fluorescence was detected on an Attune (BD Biosciences) with Attune Cytometric software 6.0.
Caspase Measurement.
Caspase activity measurements were made using the Caspase assay kit (Abcam) according to the manufacturer’s instructions. Briefly, 2 million cells were treated with either vehicle or 10 mM NAC pH 7.4. Caspase 3 assay solution was added to each well, and fluorescence was measured at an excitation wavelength of 544 nm and an emission wavelength of 620 nm on a Synergy Neo 2 plate reader (BioTek Instruments).
Mitochondrial EM.
One million 667 cells in suspension were washed once with PBS and then fixed in vitro with a modified Karnovsky’s fix (65) and a secondary fixation in reduced osmium tetroxide (66). Following dehydration, the monolayers were embedded in an epon analog resin. En face ultrathin sections (65 nm) were contrasted with lead citrate (67) and viewed on a JEM 1400 electron microscope (JEOL, USA Inc.) operated at 100 kV. Digital images were captured on a Veleta 2K × 2K CCD camera (EMSIS, Muenster, Germany). The number of visible cristae per mitochondria and total mitochondria were quantified from 312.5 µm2 area.
Cytochrome C Release Assay.
Cytosolic Cytochrome C release from the mitochondria was measured by immunoblot of cytoplasmic and mitochondrial lysates. Briefly, whole mitochondria were isolated as above and lysed in 1× CST buffer from HA magnetic beads. Cytoplasmic proteins were isolated by collecting supernatant after incubation of cellular homogenates with HA magnetic beads. The cytoplasmic fraction was cleared with 25 µL additional HA magnetic beads for 3.5 min with rotation at 4 °C to further purify the cytoplasmic fraction. Lysates were prepared by adding 10× CST containing protease inhibitor to this fraction. Mitochondrial and cytoplasmic fractions were subjected to SDS-PAGE followed by immunoblot with Cytochrome C antibody (Abcam) at 1:500 dilution.
Confocal Microscopy.
For confocal microscopy of 667 cells, cells were plated on PDL-coated coverslips and centrifuged at 200 × g for 2 min. Cells were incubated with 100 nM Mitotracker and 1 µg/mL Hoechst stain, and imaged using a Zeiss LSM990 microscope fit with a camera and analyzed with Zeiss software.
For mitochondrial hydrogen peroxide microscopy, 200,000 667 cells were plated on PDL-coated glass coverslips or on glass-bottom dishes and attached by centrifugation at 200 × g for 1 min. Then, 100 nM Mitotracker Red (Thermo), 1 µg/mL Hoechst stain, and 10 µM Mito-PY1 were added to each well and incubated at 37 °C for 30 min. Cells on coverslips were washed once in fresh PBS, and cells attached to plates were incubated in normal cell culture media. Then 10 mM NAC or vehicle was added to each well and incubated for 2 h at 37 °C. Cells were imaged using a Zeiss LSM990 microscope fit with a camera and analyzed with Imaris software.
Orthotopic GBM Mouse Model.
All animal studies were conducted following IACUC-approved animal protocols at Weill Cornell Medicine. Ethical requirements for the treatment of animals were followed for all the animal studies as per institutional guidelines set by the Principles of Laboratory Animal Care (NIH, Bethesda, MD). Mice were maintained in temperature- and humidity-controlled specific pathogen-free conditions on a 12-h light/dark cycle and received a normal chow diet (PicoLab Rodent 20 5053 lab Diet St. Louis, MO) unless otherwise specified with free access to drinking water. NSG mice were purchased from Jax. 25,000 667 cells expressing a luciferase construct were injected intracranially into the brains of mice at the following coordinates relative to bregma (1.6 mm right, 0.5 mm posterior, 3 mm dorsal). Bioluminescence imaging was performed beginning at day 7, and mice whose bioluminescence intensity was 3,000 to 12,000 relative luciferase units were begun on treatment. Mice began either twice daily intraperitoneal treatment with vehicle, 2-deoxyglucose (1,000 mg/kg), or combination 2-DG (1,000 mg/kg) and CB4 (500 mg/kg). Mice were imaged using peroxycaged luciferin at days 7 to 10 after treatment initiation. Per WCM IACUC guidelines, mice were euthanized if they exhibited 25% weight loss, reduced spontaneous activity, unkempt coat, paralysis, or death.
Tumor and H2O2 Bioluminescence.
Mice were injected subcutaneously with 200 µL of D-luciferin (150 mg/kg) and subjected to bioluminescence imaging using an IVIS CT Spectrum instrument (Perkin Elmer) at day 7 (timepoint 1) and then to visualize H2O2 at 8 to 10 d after treatment initiation (timepoint 2). For tumor bioluminescence, images were taken 7 min after injection, acquired for 5 min for timepoint 1, and analyzed using Living Image Software v.2.50. 2 × 2 cm ROIs were traced around brain tumor bioluminescent signal, and an identical 2 × 2 cm ROI placed over the mouse abdomen was used as background correction. For H2O2 bioluminescence, mice were injected with 50 µL of PCL-1 (0.5 µmol per mouse injection), and images were taken immediately and then every 5 min for 30 min. Bioluminescence intensities were taken from 2 × 2 ROIs as above and plotted over the 30-min time period. The area under the curve was calculated for each mouse.
Cysteine and Methionine Gene Expression Analysis.
RNAseq-based gene expression profiles normalized as Fragments Per Kilobase of transcript per Million mapped reads (FPKMs) were downloaded from the Genomic Data Commons (GDC) Data Portal (https://portal.gdc.cancer.gov). These FPKMs were quantified from the BAMs realigned to the GRCh38 genome build and reprocessed using the GDC’s standardized pipelines (https://gdc.cancer.gov/about-data/gdc-data-harmonization). The cysteine methionine metabolic signature genes were obtained from the Molecular Signature Database (MSigDB) Gene Set KEGG_CYSTEINE_AND_METHIONINE_METABOLISM (68). Single Sample Gene Set Enrichment Analysis (ssGSEA) was applied to score the metabolic signature in each tumor sample using their RNAseq expression profiles (69). ssGSEA was implemented using the “gsva” package (v1.30.0) in R.
Differential Proteomics Analysis.
The samples in this study comprise data from the National Cancer Institute’s Clinical Proteomic Tumor Analysis Consortium (CPTAC) (70, 71). We generated a list of redox proteins based on known redox enzymes compiled by surveying publicly available resources (https://www.rndsystems.com/research-area/redox-enzymes) and added glutathione reductase given its role in reductive stress. We generated two unsupervised hierarchically clustered heatmaps for each cancer type. All code for this analysis has been deposited at https://github.com/Ekn2484/Glioma-Cysteine-Metabolism (72).
Differential Metabolomics Analysis.
Raw metabolomics ion counts were taken from Chinnaiyan et al. (27) The original dataset included 69 samples from patients with glioma WHO grades 2 (n = 18), 3 (n = 18), and 4 (n = 33). Metabolite abundances were first corrected for run-day batch effects using median scaling, normalized using the probabilistic quotient normalization (73) using metabolites with less than 20% missing values to generate the reference sample, and log2 transformed. Twelve metabolites annotated with the pathway “Cysteine, methionine, SAM, taurine metabolism” (2-hydroxybutyrate, cystathionine, cysteine, cysteine sulfinic acid, cystine, homocysteine, hypotaurine, methionine, N-acetylmethionine, S-adenosylhomocysteine, S-methylcysteine, taurine) were considered for statistical analysis. Associations between metabolite abundance and tumor grade were estimated using Kendall’s correlation, and P-values were corrected for multiple testing using the Benjamini–Hochberg method for controlling the false discovery rate (74). Metabolites with adjusted P-values less than 0.05 were considered significant. All code for this analysis has been deposited at https://github.com/krumsieklab/glioma-cysteine (72).
Statistical Analysis.
Statistical analyses were conducted using GraphPad Prism version 8.0. Data are mean ± SD unless otherwise stated. t tests were used to measure significance between two samples, and ANOVA was used to measure significance between three or more groups, with results being adjusted for multiple comparisons. All error bars indicate the mean ± SD unless otherwise specified.
Supplementary Material
Appendix 01 (PDF)
Acknowledgments
We thank the Metabolomics Core Facility at Weill Cornell Medicine for their assistance in the performance and analysis of metabolomics experiments. We acknowledge the Electron Microscopy and Histology services of the Weill Cornell Medicine Microscopy and Image Analysis Core and thank EM Specialist Juan Jimenez and the Core’s Co-Director Leona Cohen-Gould for their assistance. We appreciate the help of Valerie Longo and Pat Zanzonico at the Memorial Sloan Kettering Cancer Center small animal imaging core facility. This work was supported by the National Institutes of Neurological Disorders and Stroke (NINDS) K08NS128283 (E.K.N.), Roland and Gladys Harriman Foundation Bridge Fund (E.K.N.), NIH R35 CA197588 (L.C.C.), SU2C-AACR-DT22-17 (L.C.C.), and institutional funds from Weill Cornell Medicine. The transmission electron microscope was purchased with funds from an NIH Shared Instrumentation Grant (S10RR027699) for Shared Resources. O.E. has received funding from Eli Lilly, Janssen, and Sanofi. L.C.C. has received research funding from Ravenna Pharmaceuticals.
Author contributions
E.K.N. and L.C.C. designed research; E.K.N., L.P., I.Y., N.B., D.B., A.W., B.B., E.B., J.G., and S.K. performed research; E.K.N. and D.A. contributed new reagents/analytic tools; E.K.N., L.P., I.Y., N.B., D.B., A.W., B.B., E.B., J.K., J.G., S.K., D.A., and O.E. analyzed data; and E.K.N. wrote the paper.
Competing interests
E.K.N. is founder/CEO of Destroke. L.C.C. is a founder, shareholder, and member of the scientific advisory board of Agios Pharmaceuticals and a founder and former member of the scientific advisory board of Ravenna Pharmaceuticals. L.C.C. has received research funding from Ravenna Pharmaceuticals. L.C.C. is a co-founder and shareholder of Faeth Therapeutics. L.C.C and O.E. are co-founders of Volastra Therapeutics. L.C.C. is a paid advisor to and stockholder in EIP Pharmaceuticals, Cell Signaling Technologies, and Larkspur. O.E. is equity holder in or paid advisor to OneThree Bio, Owkin, Freenome, Champions Oncology, Pionyr Immunotherapeutics, Harmonic Discovery, Acuamark, and Genetic Intelligence.
Footnotes
This article is a PNAS Direct Submission.
Data, Materials, and Software Availability
All code for this analysis has been deposited at https://github.com/Ekn2484/Glioma-Cysteine-Metabolism (72). All other data are included in the manuscript and/or SI Appendix.
Supporting Information
References
- 1.Stupp R., et al. , Radiotherapy plus concomitant and adjuvant temozolomide for glioblastoma. N Engl. J. Med. 352, 987–996 (2005). [DOI] [PubMed] [Google Scholar]
- 2.Stupp R., et al. , Maintenance therapy with tumor-treating fields plus temozolomide vs. temozolomide alone for glioblastoma: A randomized clinical trial. JAMA 314, 2535–2543 (2015). [DOI] [PubMed] [Google Scholar]
- 3.Zhu J., Thompson C. B., Metabolic regulation of cell growth and proliferation. Nat. Rev. Mol. Cell Biol. 20, 436–450 (2019). [DOI] [PMC free article] [PubMed] [Google Scholar]
- 4.Barthel A., et al. , Regulation of GLUT1 gene transcription by the serine/threonine kinase Akt1. J. Biol. Chem. 274, 20281–20286 (1999). [DOI] [PubMed] [Google Scholar]
- 5.Yang W., et al. , ERK1/2-dependent phosphorylation and nuclear translocation of PKM2 promotes the Warburg effect. Nat. Cell Biol. 14, 1295–1304 (2012). [DOI] [PMC free article] [PubMed] [Google Scholar]
- 6.Ilic N., et al. , PIK3CA mutant tumors depend on oxoglutarate dehydrogenase. Proc. Natl. Acad. Sci. U.S.A. 114, E3434–E3443 (2017). [DOI] [PMC free article] [PubMed] [Google Scholar]
- 7.Mink J. W., Blumenschine R. J., Adams D. B., Ratio of central nervous system to body metabolism in vertebrates: Its constancy and functional basis. Am. J. Physiol. 241, R203–R212 (1981). [DOI] [PubMed] [Google Scholar]
- 8.Marin-Valencia I., et al. , Analysis of tumor metabolism reveals mitochondrial glucose oxidation in genetically diverse human glioblastomas in the mouse brain in vivo. Cell Metab. 15, 827–837 (2012). [DOI] [PMC free article] [PubMed] [Google Scholar]
- 9.Noch E., Khalili K., Molecular mechanisms of necrosis in glioblastoma: The role of glutamate excitotoxicity. Cancer Biol. Ther. 8, 1791–1797 (2009). [DOI] [PMC free article] [PubMed] [Google Scholar]
- 10.Ye Z. C., Sontheimer H., Glioma cells release excitotoxic concentrations of glutamate. Cancer Res. 59, 4383–4391 (1999). [PubMed] [Google Scholar]
- 11.Venkatesh H. S., et al. , Electrical and synaptic integration of glioma into neural circuits. Nature 573, 539–545 (2019). [DOI] [PMC free article] [PubMed] [Google Scholar]
- 12.Venkataramani V., et al. , Glutamatergic synaptic input to glioma cells drives brain tumour progression. Nature 573, 532–538 (2019). [DOI] [PubMed] [Google Scholar]
- 13.Long Y., et al. , Dysregulation of glutamate transport enhances Treg function that promotes VEGF blockade resistance in glioblastoma. Cancer Res. 80, 499–509 (2019), 10.1158/0008-5472.CAN-19-1577. [DOI] [PubMed] [Google Scholar]
- 14.Chung W. J., et al. , Inhibition of cystine uptake disrupts the growth of primary brain tumors. J. Neurosci. 25, 7101–7110 (2005). [DOI] [PMC free article] [PubMed] [Google Scholar]
- 15.Robert S. M., et al. , SLC7A11 expression is associated with seizures and predicts poor survival in patients with malignant glioma. Sci. Transl. Med. 7, 289ra286 (2015). [DOI] [PMC free article] [PubMed] [Google Scholar]
- 16.Banjac A., et al. , The cystine/cysteine cycle: A redox cycle regulating susceptibility versus resistance to cell death. Oncogene 27, 1618–1628 (2008). [DOI] [PubMed] [Google Scholar]
- 17.Weerapana E., et al. , Quantitative reactivity profiling predicts functional cysteines in proteomes. Nature 468, 790–795 (2010). [DOI] [PMC free article] [PubMed] [Google Scholar]
- 18.Fu L., et al. , Systematic and quantitative assessment of hydrogen peroxide reactivity with cysteines across human proteomes. Mol. Cell Proteomics 16, 1815–1828 (2017). [DOI] [PMC free article] [PubMed] [Google Scholar]
- 19.Kuljanin M., et al. , Reimagining high-throughput profiling of reactive cysteines for cell-based screening of large electrophile libraries. Nat. Biotechnol. 39, 630–641 (2021). [DOI] [PMC free article] [PubMed] [Google Scholar]
- 20.Shahripour R. B., Harrigan M. R., Alexandrov A. V., N-acetylcysteine (NAC) in neurological disorders: Mechanisms of action and therapeutic opportunities. Brain Behav. 4, 108–122 (2014). [DOI] [PMC free article] [PubMed] [Google Scholar]
- 21.Combs J. A., DeNicola G. M., The non-essential amino acid cysteine becomes essential for tumor proliferation and survival. Cancers (Basel) 11, 678 (2019). [DOI] [PMC free article] [PubMed] [Google Scholar]
- 22.Zhang H., et al. , Glutathione-dependent reductive stress triggers mitochondrial oxidation and cytotoxicity. FASEB J. 26, 1442–1451 (2012). [DOI] [PMC free article] [PubMed] [Google Scholar]
- 23.Kolossov V. L., et al. , Thiol-based antioxidants elicit mitochondrial oxidation via respiratory complex III. Am. J. Physiol. Cell Physiol. 309, C81–C91 (2015). [DOI] [PMC free article] [PubMed] [Google Scholar]
- 24.Tsai J. C., et al. , Induction of apoptosis by pyrrolidinedithiocarbamate and N-acetylcysteine in vascular smooth muscle cells. J. Biol. Chem. 271, 3667–3670 (1996). [PubMed] [Google Scholar]
- 25.Finn N. A., Kemp M. L., Pro-oxidant and antioxidant effects of N-acetylcysteine regulate doxorubicin-induced NF-kappa B activity in leukemic cells. Mol. Biosyst. 8, 650–662 (2012). [DOI] [PMC free article] [PubMed] [Google Scholar]
- 26.Yang G., et al. , Hydrogen sulfide protects against cellular senescence via S-sulfhydration of Keap1 and activation of Nrf2. Antioxid Redox Signal 18, 1906–1919 (2013). [DOI] [PubMed] [Google Scholar]
- 27.Chinnaiyan P., et al. , The metabolomic signature of malignant glioma reflects accelerated anabolic metabolism. Cancer Res. 72, 5878–5888 (2012). [DOI] [PMC free article] [PubMed] [Google Scholar]
- 28.Korge P., Calmettes G., Weiss J. N., Increased reactive oxygen species production during reductive stress: The roles of mitochondrial glutathione and thioredoxin reductases. Biochim. Biophys. Acta 1847, 514–525 (2015). [DOI] [PMC free article] [PubMed] [Google Scholar]
- 29.Chen W. W., Freinkman E., Sabatini D. M., Rapid immunopurification of mitochondria for metabolite profiling and absolute quantification of matrix metabolites. Nat. Protoc. 12, 2215–2231 (2017). [DOI] [PMC free article] [PubMed] [Google Scholar]
- 30.Gusev Y., et al. , The REMBRANDT study, a large collection of genomic data from brain cancer patients. Sci. Data 5, 180158 (2018). [DOI] [PMC free article] [PubMed] [Google Scholar]
- 31.Baratz-Goldstein R., et al. , Thioredoxin-mimetic-peptides protect cognitive function after mild traumatic brain injury (mTBI). PLoS One 11, e0157064 (2016). [DOI] [PMC free article] [PubMed] [Google Scholar]
- 32.Lejnev K., et al. , Thioredoxin-mimetic peptides (TXM) inhibit inflammatory pathways associated with high-glucose and oxidative stress. Free Radic. Biol. Med. 99, 557–571 (2016). [DOI] [PubMed] [Google Scholar]
- 33.Kronenfeld G., Engelman R., Weisman-Shomer P., Atlas D., Benhar M., Thioredoxin-mimetic peptides as catalysts of S-denitrosylation and anti-nitrosative stress agents. Free Radic. Biol. Med. 79, 138–146 (2015). [DOI] [PubMed] [Google Scholar]
- 34.Bachnoff N., Trus M., Atlas D., Alleviation of oxidative stress by potent and selective thioredoxin-mimetic peptides. Free Radic. Biol. Med. 50, 1355–1367 (2011). [DOI] [PubMed] [Google Scholar]
- 35.Lin W., et al. , SLC7A11/xCT in cancer: Biological functions and therapeutic implications. Am. J. Cancer Res. 10, 3106–3126 (2020). [PMC free article] [PubMed] [Google Scholar]
- 36.Shin C. S., et al. , The glutamate/cystine xCT antiporter antagonizes glutamine metabolism and reduces nutrient flexibility. Nat. Commun. 8, 15074 (2017). [DOI] [PMC free article] [PubMed] [Google Scholar]
- 37.Koppula P., Zhang Y., Shi J., Li W., Gan B., The glutamate/cystine antiporter SLC7A11/xCT enhances cancer cell dependency on glucose by exporting glutamate. J. Biol. Chem. 292, 14240–14249 (2017). [DOI] [PMC free article] [PubMed] [Google Scholar]
- 38.Briggs K. J., et al. , Paracrine induction of HIF by glutamate in breast cancer: EglN1 senses cysteine. Cell 166, 126–139 (2016). [DOI] [PMC free article] [PubMed] [Google Scholar]
- 39.LeBoeuf S. E., et al. , Activation of oxidative stress response in cancer generates a druggable dependency on exogenous non-essential amino acids. Cell Metab. 31, 339–350.e334 (2020). [DOI] [PMC free article] [PubMed] [Google Scholar]
- 40.Prabhu A., et al. , Cysteine catabolism: A novel metabolic pathway contributing to glioblastoma growth. Cancer Res. 74, 787–796 (2014). [DOI] [PMC free article] [PubMed] [Google Scholar]
- 41.Singh F., et al. , Reductive stress impairs myoblasts mitochondrial function and triggers mitochondrial hormesis. Biochim. Biophys. Acta 1853, 1574–1585 (2015). [DOI] [PubMed] [Google Scholar]
- 42.Mullarky E., et al. , Identification of a small molecule inhibitor of 3-phosphoglycerate dehydrogenase to target serine biosynthesis in cancers. Proc. Natl. Acad. Sci. U.S.A. 113, 1778–1783 (2016). [DOI] [PMC free article] [PubMed] [Google Scholar]
- 43.Halestrap A. P., The mechanism of the inhibition of the mitochondrial pyruvate transportater by alpha-cyanocinnamate derivatives. Biochem. J. 156, 181–183 (1976). [DOI] [PMC free article] [PubMed] [Google Scholar]
- 44.Hurd T. R., et al. , Inactivation of pyruvate dehydrogenase kinase 2 by mitochondrial reactive oxygen species. J. Biol. Chem. 287, 35153–35160 (2012). [DOI] [PMC free article] [PubMed] [Google Scholar]
- 45.Han D., et al. , Sites and mechanisms of aconitase inactivation by peroxynitrite: Modulation by citrate and glutathione. Biochemistry 44, 11986–11996 (2005). [DOI] [PubMed] [Google Scholar]
- 46.Smilkstein M. J., Knapp G. L., Kulig K. W., Rumack B. H., Efficacy of oral N-acetylcysteine in the treatment of acetaminophen overdose. Analysis of the national multicenter study (1976 to 1985). N Engl. J. Med. 319, 1557–1562 (1988). [DOI] [PubMed] [Google Scholar]
- 47.Conrad C., et al. , Long-term treatment with oral N-acetylcysteine: Affects lung function but not sputum inflammation in cystic fibrosis subjects. A phase II randomized placebo-controlled trial. J. Cyst. Fibros 14, 219–227 (2015). [DOI] [PubMed] [Google Scholar]
- 48.Xu R., Tao A., Bai Y., Deng Y., Chen G., Effectiveness of N-acetylcysteine for the prevention of contrast-induced nephropathy: A systematic review and meta-analysis of randomized controlled trials. J. Am. Heart Assoc. 5, e003968 (2016). [DOI] [PMC free article] [PubMed] [Google Scholar]
- 49.Krzyzanowska W., et al. , Ceftriaxone- and N-acetylcysteine-induced brain tolerance to ischemia: Influence on glutamate levels in focal cerebral ischemia. PLoS One 12, e0186243 (2017). [DOI] [PMC free article] [PubMed] [Google Scholar]
- 50.Sabetghadam M., Mazdeh M., Abolfathi P., Mohammadi Y., Mehrpooya M., Evidence for a beneficial effect of oral N-acetylcysteine on functional outcomes and inflammatory biomarkers in patients with acute ischemic stroke. Neuropsychiatr. Dis. Treat. 16, 1265–1278 (2020). [DOI] [PMC free article] [PubMed] [Google Scholar]
- 51.Karuppagounder S. S., et al. , N-acetylcysteine targets 5 lipoxygenase-derived, toxic lipids and can synergize with prostaglandin E2 to inhibit ferroptosis and improve outcomes following hemorrhagic stroke in mice. Ann. Neurol. 84, 854–872 (2018). [DOI] [PMC free article] [PubMed] [Google Scholar]
- 52.Krzyzanowska W., Pomierny B., Budziszewska B., Filip M., Pera J., N-acetylcysteine and ceftriaxone as preconditioning strategies in focal brain ischemia: Influence on glutamate transporters expression. Neurotox Res. 29, 539–550 (2016). [DOI] [PMC free article] [PubMed] [Google Scholar]
- 53.Hopkins B. D., et al. , Suppression of insulin feedback enhances the efficacy of PI3K inhibitors. Nature 560, 499–503 (2018). [DOI] [PMC free article] [PubMed] [Google Scholar]
- 54.Noch E. K., et al. , Insulin feedback is a targetable resistance mechanism of PI3K inhibition in glioblastoma. Neuro. Oncol. 25, 2165–2176 (2023). [DOI] [PMC free article] [PubMed] [Google Scholar]
- 55.Ogunrinu T. A., Sontheimer H., Hypoxia increases the dependence of glioma cells on glutathione. J. Biol. Chem. 285, 37716–37724 (2010). [DOI] [PMC free article] [PubMed] [Google Scholar]
- 56.Bonifacio V. D. B., Pereira S. A., Serpa J., Vicente J. B., Cysteine metabolic circuitries: Druggable targets in cancer. Br. J. Cancer 124, 862–879 (2021). [DOI] [PMC free article] [PubMed] [Google Scholar]
- 57.Silver D. J., et al. , Severe consequences of a high-lipid diet include hydrogen sulfide dysfunction and enhanced aggression in glioblastoma. J. Clin. Invest. 131, e138276 (2021), 10.1172/JCI138276. [DOI] [PMC free article] [PubMed] [Google Scholar]
- 58.Bronowicka-Adamska P., Bentke A., Wrobel M., Hydrogen sulfide generation from l-cysteine in the human glioblastoma-astrocytoma U-87 MG and neuroblastoma SHSY5Y cell lines. Acta Biochim. Pol. 64, 171–176 (2017). [DOI] [PubMed] [Google Scholar]
- 59.Zhao L., et al. , Exogenous hydrogen sulfide exhibits anti-cancer effects though p38 MAPK signaling pathway in C6 glioma cells. Biol. Chem. 396, 1247–1253 (2015). [DOI] [PubMed] [Google Scholar]
- 60.Wrobel M., et al. , Is development of high-grade gliomas sulfur-dependent? Molecules 19, 21350–21362 (2014). [DOI] [PMC free article] [PubMed] [Google Scholar]
- 61.Tokumaru S., Iguchi H., Kojo S., Change of the lipid hydroperoxide level in mouse organs on ageing. Mech. Ageing Dev. 86, 67–74 (1996). [DOI] [PubMed] [Google Scholar]
- 62.Salazar-Ramiro A., et al. , Role of redox status in development of glioblastoma. Front. Immunol. 7, 156 (2016). [DOI] [PMC free article] [PubMed] [Google Scholar]
- 63.Choi S., et al. , Temozolomide-associated hypermutation in gliomas. Neuro Oncol. 20, 1300–1309 (2018). [DOI] [PMC free article] [PubMed] [Google Scholar]
- 64.Yu Y., et al. , Temozolomide-induced hypermutation is associated with distant recurrence and reduced survival after high-grade transformation of low-grade IDH-mutant gliomas. Neuro. Oncol. 23, 1872–1884 (2021), 10.1093/neuonc/noab081. [DOI] [PMC free article] [PubMed] [Google Scholar]
- 65.Ito S., Karnovsky M., Formaldehyde glutaraldehyde fixatives containing trinitro compounds. J. Cell Biol. 39, 168A–169A (1968). [Google Scholar]
- 66.De Bruijn W., Glycogen its chemistry and morphologic appearance in the electron microscope. J. Ultrastruct. Res. 42, 29–50 (1973). [DOI] [PubMed] [Google Scholar]
- 67.Venable J. H., Coggeshall R., A simplified lead citrate stain for use in electronmicroscopy. J. Cell Biol. 25, 407–408 (1965). [DOI] [PMC free article] [PubMed] [Google Scholar]
- 68.Subramanian A., et al. , Gene set enrichment analysis: a knowledge-based approach for interpreting genome-wide expression profiles. Proc. Natl. Acad. Sci. U.S.A. 102, 15545–15550 (2005). [DOI] [PMC free article] [PubMed] [Google Scholar]
- 69.Barbie D. A., et al. , Systematic RNA interference reveals that oncogenic KRAS-driven cancers require TBK1. Nature 462, 108–112 (2009). [DOI] [PMC free article] [PubMed] [Google Scholar]
- 70.Edwards N. J., et al. , The CPTAC data portal: A resource for cancer proteomics research. J. Proteome Res. 14, 2707–2713 (2015). [DOI] [PubMed] [Google Scholar]
- 71.Ellis M. J., et al. , Connecting genomic alterations to cancer biology with proteomics: The NCI Clinical proteomic tumor analysis consortium. Cancer Discov. 3, 1108–1112 (2013). [DOI] [PMC free article] [PubMed] [Google Scholar]
- 72.Noch E., Benedetti E., Krumsiek J., Gurvitch J., Cantley L. C., Glioma cysteine metabolism. Github. https://github.com/Ekn2484/Glioma-Cysteine-Metabolism. Deposited 18 January 2024.
- 73.Dieterle F., Ross A., Schlotterbeck G., Senn H., Probabilistic quotient normalization as robust method to account for dilution of complex biological mixtures. Application in 1H NMR metabonomics. Anal. Chem. 78, 4281–4290 (2006). [DOI] [PubMed] [Google Scholar]
- 74.Benjamini Y., Hochberg Y., Controlling the false discovery rate: A practical and powerful approach to multiple testing. J. R Stat. Soc. 57, 289–300 (1995). [Google Scholar]
Associated Data
This section collects any data citations, data availability statements, or supplementary materials included in this article.
Supplementary Materials
Appendix 01 (PDF)
Data Availability Statement
All code for this analysis has been deposited at https://github.com/Ekn2484/Glioma-Cysteine-Metabolism (72). All other data are included in the manuscript and/or SI Appendix.