Abstract
Although it is known that household infections drive the transmission of dengue virus (DENV), it is unclear how household composition and the immune status of inhabitants affect the individual risk of infection. Most population-based studies to date have focused on paediatric cohorts because more severe forms of dengue mainly occur in children, and the role of adults in dengue transmission is understudied. Here we analysed data from a multigenerational cohort study of 470 households, comprising 2,860 individuals, in Kamphaeng Phet, Thailand, to evaluate risk factors for DENV infection. Using a gradient-boosted regression model trained on annual haemagglutination inhibition antibody titre inputs, we identified 1,049 infections, 90% of which were subclinical. By analysing imputed infections, we found that individual antibody titres, household composition and antibody titres of other members in the same household affect an individual’s risk of DENV infection. Those individuals living in households with high average antibody titres, or households with more adults, had a reduced risk of infection. We propose that herd immunity to dengue acts at the household level and may provide insight into the drivers of the recent change in the shifting age distribution of dengue cases in Thailand.
The number of individuals infected with dengue virus (DENV) ranges from 100 to 400 million per year1–3, primarily in tropical and subtropical regions of the world. A substantial proportion of DENV transmission occurs in and around the home, with infections having a high likelihood of being spatiotemporally correlated4–9. However, individuals living in neighbouring but separate households can experience persistent differences in risk of infection4,5,9. The drivers of heterogeneity in risk of DENV infection among households and villages are unknown, potentially limiting the capacity for targeted interventions. There is evidence supporting focal transmission at either the school10,11 or household level4–7,9. Immunity, or susceptibility, of household members may impact the individual risk of infection.
Analysing the role of immunity in household transmission is complicated. This is because most infections are subclinical and are therefore missed by surveillance systems12,13. Studies characterizing risk factors for DENV infection are therefore biased towards symptomatic infections rather than the entire population of infected individuals. In addition, DENV has historically been concentrated in children so most studies have focused on understanding infection dynamics in this subpopulation2,14. This has resulted in large gaps in knowledge about risk factors for DENV infection in either adults or entire households. There have been recent shifts in the average age of dengue cases towards adults in several countries in South Asia15–19. For example, the mean age of individuals with dengue haemorrhagic fever has risen in Thailand from approximately 8 years to 24 years between 1981 and 2017 (ref. 15), making the understanding of risk factors for DENV infection in adults now more pressing than ever.
Identifying subclinical DENV infections in individuals is difficult because it requires data either from the longitudinal serological testing of large cohorts20–23 or from the follow-up of index cases and their close contacts at the household level24–28. Estimates of the proportion of subclinical cases vary substantially29 in published observational studies, owing to differences in how susceptible the population is to the major circulating DENV serotype, definitions of symptomatic and subclinical infections, and differences among follow-up monitoring protocols. Most studies that have analysed longitudinal serological data to identify subclinical infections have defined infections as ‘a fourfold increase in antibody levels between two samples for both haemagglutination inhibition (HAI)20,22,30 and enzyme-linked immunosorbent assays (ELISAs)’21,23. However, while there is good support for using cut-off points in the context of acute and convalescent samples obtained weeks apart, their accuracy in identifying infections from samples obtained months or years apart in this way is unclear. Due to antibody decay in the months following an acute infection31, the sensitivity of the ‘fourfold’ approach to identifying infection is likely to diminish over time, resulting in underestimates of the true number of infections. In addition, it is unclear whether the ‘fourfold’ method underperforms in individuals with high initial antibody titres. Other approaches have reconstructed subclinical infections by fitting full probabilistic models that simultaneously characterize antibody kinetics and infection histories, but this method is data intensive, requiring large numbers of longitudinal serum samples collected frequently and virologically confirmed infections to estimate antibody kinetics32. Such detailed and prospective datasets are not commonly available, and therefore, alternative approaches are needed to study the transmission of dengue, understand its drivers and quantify the impact of interventions including vaccines.
Here we analyse data from an ongoing longitudinal study in Kamphaeng Phet, Thailand, to characterize risk factors of DENV infection and disease. A key feature of our longitudinal study is that it enrolled multigenerational households, which enabled us to study the risk profiles of children, adults and full households in parallel33. Instead of relying on fixed cut-points, such as the fourfold approach, we applied a flexible classification algorithm that takes yearly paired antibody titres to determine whether an individual was infected between sampling events. Using confirmed DENV infections to train this algorithm, we characterized the dynamics of DENV infections in this cohort, including the association between infection and individual and household factors, and report our findings here.
Cohort description
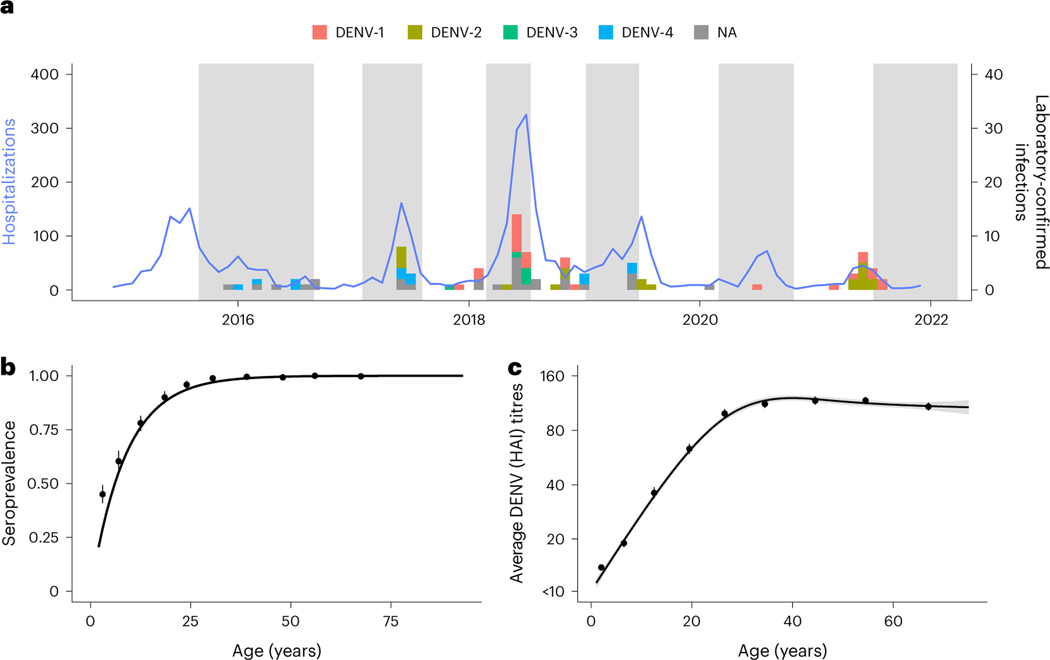
This study used data from an ongoing cohort study in Kamphaeng Phet, Thailand, that has enrolled 3,514 individuals living in 515 households (Supplementary Fig. 1). The study started in September 2015 with the aim of defining immunological correlates of protection from DENV and illness as well as factors shaping DENV transmission in multigenerational households. A second stage of this cohort is planned to continue through 2028. This study included yearly follow-up of participants in which serum samples were obtained as well as active illness investigations and household investigations triggered whenever a participant reported a fever (defined as an index case). Yearly serum samples were tested using HAI, and illness and household investigations included multiple assays (reverse-transcriptase polymerase chain reaction (RT-PCR), immunoglobulin M, immunoglobulin G and HAI). Our analysis included 2,868 individuals within 470 households who had been followed up at least once after enrollment and before March 2022. The analysed dataset contains data on 11,131 ‘yearly’ intervals, with an average of 3.90 intervals per enrolled individual (95% confidence interval (CI) 1–6). Characteristics of the analysed intervals are reported in Table 1, and the age pyramid is shown in Extended Data Fig. 1a. The intervals were an average of 407.8 days long (95% CI 229–642.75) and took place over 6 sampling periods (Fig. 1a). Not all individuals in a household consented to being sampled at every visit, such that approximately 80% of potential individuals were sampled. Over the study period, there were 469 index cases, which resulted in laboratory confirmation of 90 infections between paired yearly samples. These 90 infections consisted of 61 PCR-positive individuals, and the remaining 29 cases were identified using serological evidence and constitute the gold standard data used in model training.
Table 1 |.
Covariates and infection prediction
| Covariate | No infection (n = 10,082) | Symptomatic infection (n = 77) | Subclinical infection (n = 972) | Overall (n = 11,131) | |
|---|---|---|---|---|---|
| Sex | Male | 4,192 (41.6%) | 39 (50.6%) | 425 (43.7%) | 4,656 (41.8%) |
| Female | 5,890 (58.4%) | 38 (49.4%) | 547 (56.3%) | 6,475 (58.2%) | |
| Age (years) | Mean (s.d.) | 29.6 (22.2) | 14.5 (11.1) | 22.5 (20.8) | 28.9 (22.2) |
| Median [minimum, maximum] | 26.2 [1.00, 100] | 12.4 [1.18, 57.3] | 14.8 [1.02, 88.3] | 25.0 [1.00,100] | |
| [1, 5) | 1,696 (16.8%) | 16 (20.8%) | 229 (23.6%) | 1,941 (17.4%) | |
| [6, 18) | 2,166 (21.5%) | 38 (49.4%) | 310 (31.9%) | 2,514 (22.6%) | |
| [18, 30) | 1,732 (17.2%) | 17 (22.1%) | 153 (15.7%) | 1,902 (17.1%) | |
| [30, 50) | 2,121 (21.0%) | 5 (6.5%) | 135 (13.9%) | 2,261 (20.3%) | |
| 50+ | 2,367 (23.5%) | 1 (1.3%) | 145 (14.9%) | 2,513 (22.6%) | |
| JEV vaccination in interval | Yes | 453 (4.5%) | 1 (1.3%) | 68 (7.0%) | 522 (4.7%) |
| No | 9,629 (95.5%) | 76 (98.7%) | 904 (93.0%) | 10,609 (95.3%) | |
| Pre-interval titre (HAI) | Mean (s.d.) | 117.0 (200.0) | 31.1 (37.0) | 55.8 (83.6) | 111.0 (193.0) |
| Median [IQR] | 67.3 [14.1, 134.5] | 14.1 [10, 33.6] | 28.3 [10, 67.3] | 56.6 [14.1, 134.5] |
Predicted infections are subdivided into symptomatic and subclinical infections. Japanese encephalitis virus is denoted as JEV.
Fig. 1 |. Cohort data summary (n = 11,131).
a, Hospitalization counts for Kamphaeng Phet from 2015 to 2021 (blue solid line). The bars represent the timing of the confirmed DENV infections used to train the model (n = 90). Serotype information was ascertained via RT-PCR with those confirmed using only serology labeled as NA. The shaded time periods represent active sampling periods during the cohort study when yearly blood draws were taken. b, Age-stratified seropositive individuals at enrollment for participants enrolled before 2017. The points are mean seroprevalence found at each tenth percentile age bin, and the line is the resulting fit using the serocatalytic model for non-newborns below 30 years old (n = 6,197; details found in Supplementary Information). c, Average DENV HAI titres at enrollment age binned into each tenth percentile. Confidence bounds (95%) for b and c are found using a basic non-parametric bootstrap, while a generalized linear model is fit in black. Mean and 95% confidence interval are presented as the line and shaded region.
Model performance
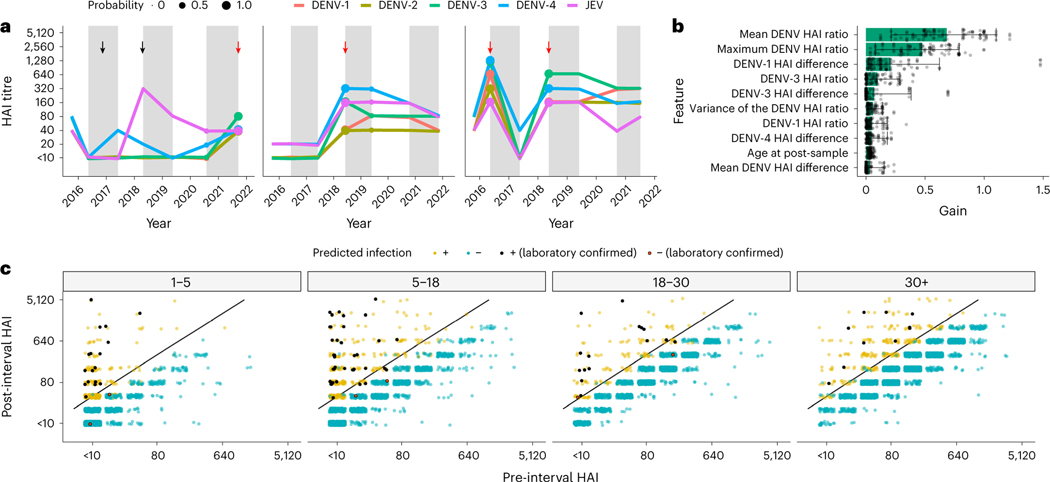
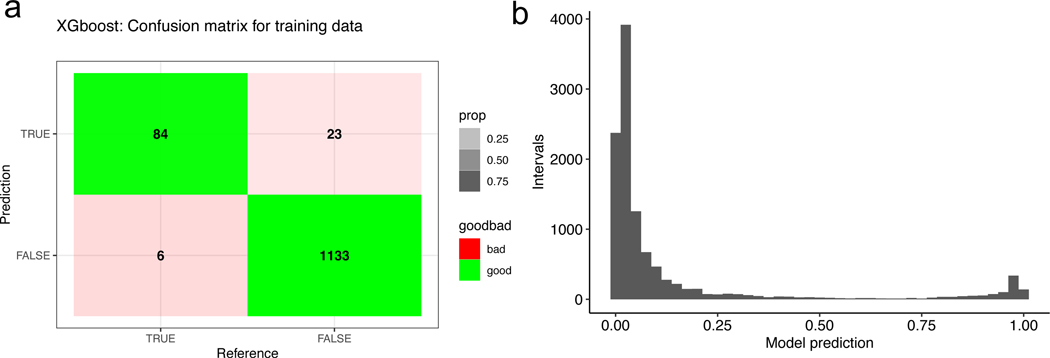
We fit gradient-boosted regression models to infer subclinical infections in individuals, from antibody titres measured during yearly visits after training on gold standard infections. Our best-fitting model was able to classify our training data with 93.3% sensitivity and 98.0% specificity (Extended Data Fig. 2a). The longitudinal design of the cohort study allows visualization of HAI trajectories across time for enrolled individuals. Figure 2a illustrates imputed infections for three individuals enrolled in the cohort. The average and maximum ratios of pre- to post-interval HAI titres are the features of greatest importance for accurate classification defined by the information gain metric (Fig. 2b).
Fig. 2 |. Model performance and fit.
a, Three examples of HAI titre trajectories for all four DENV serotypes and JEV in three participants. Alternating white and grey time periods represent distinct intervals, separated by the sampled HAIs. The imputed probability of an infection having occurred within an interval is represented by point size at the post-interval sample date, and red arrows represent an imputed infection. The black arrows represent JEV vaccination events. b, Feature importance for model fits (n = 100). Gain represents the relative contribution of each feature. The bars represent the mean, and the whiskers represent the 95% credible intervals. c, Pre- and post-interval HAI titres for the DENV serotype with the largest ratio grouped by age at the post-interval sampling event and coloured by whether the model predicted a seroconversion. The yellow and blue dots represent points that were or were not identified as infections, respectively, by the model, and the black and red points represent a similar dichotomy but in laboratory-confirmed seroconversions. A fourfold increase in titres between samples is represented by the black diagonal line.
Characterizing subclinical infections
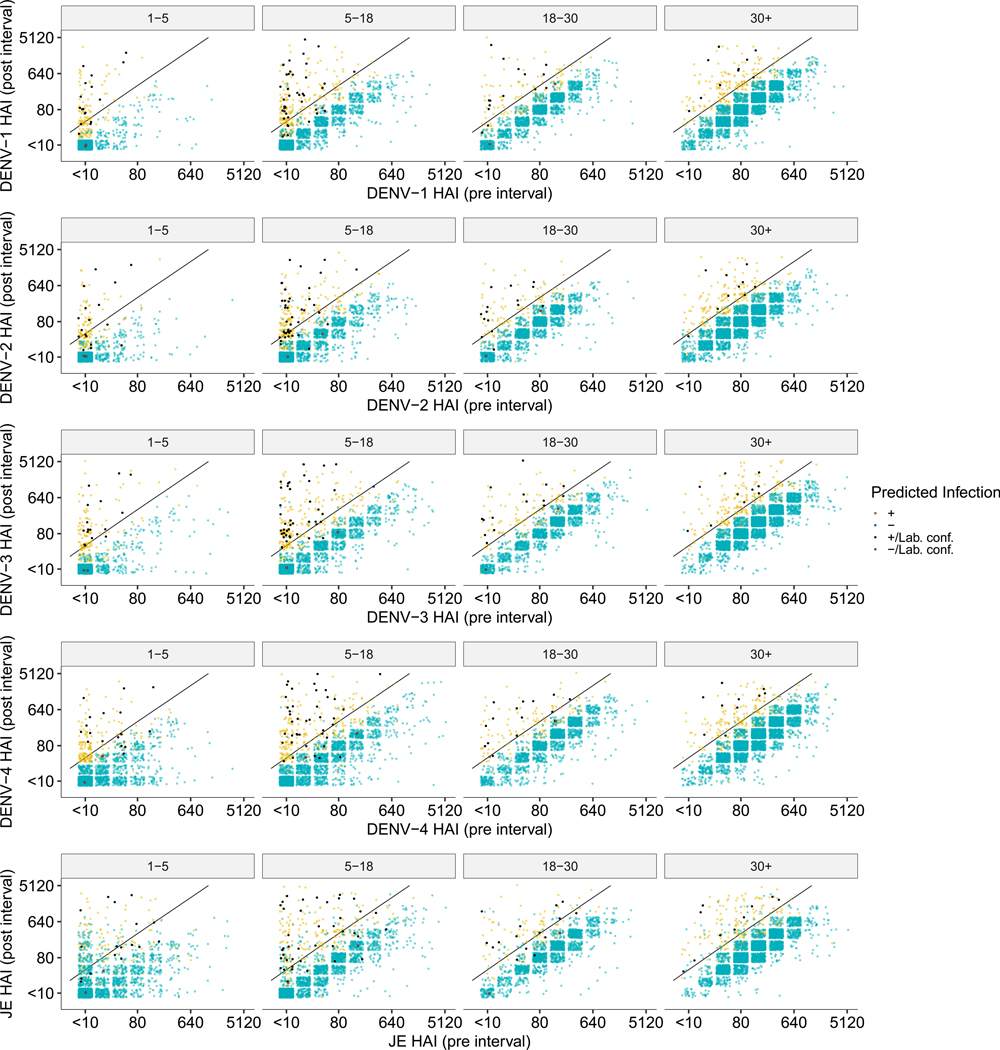
Using our best-fitting prediction models on the evaluation dataset (n = 9,885), we imputed 959 subclinical infections. When incorporating the 90 laboratory-confirmed infections, a total of 1,049 infections are identified in 11,131 intervals of observation, or 9.4% of intervals. This translates to 12.44 infections per 100 susceptible people per year (95% CI 11.01–13.88). Application of the fourfold increase in antibody levels to infer infections, as done previously to interpret paired serological data, identified a total of 956 infections, suggesting that our method identifies ~10% more infections. This is similar to an estimated annual proportion of seronegative individuals being infected per year of 10.8% derived using a serocatalytic model from age-stratified seroprevalence data (95% CI 9.9–11.8%, using seropositive cut-off as HAI ≥ 20) (Fig. 1b). We note that the model had high certainty in the assigning of infections for the majority of infections, with 673 of the 1,049 intervals with infection being given a probability of greater than 90%. Similarly, the model had high certainty for the absence of infections in the remaining intervals, with 8,458 of the 11,131 intervals being assigned a probability of less than 10% (Extended Data Fig. 2b). Figure 2c shows where these imputed infections fall when comparing the average HAI across all four DENV serotypes pre- and post-interval while a breakdown by serotype can be found in Extended Data Fig. 3.
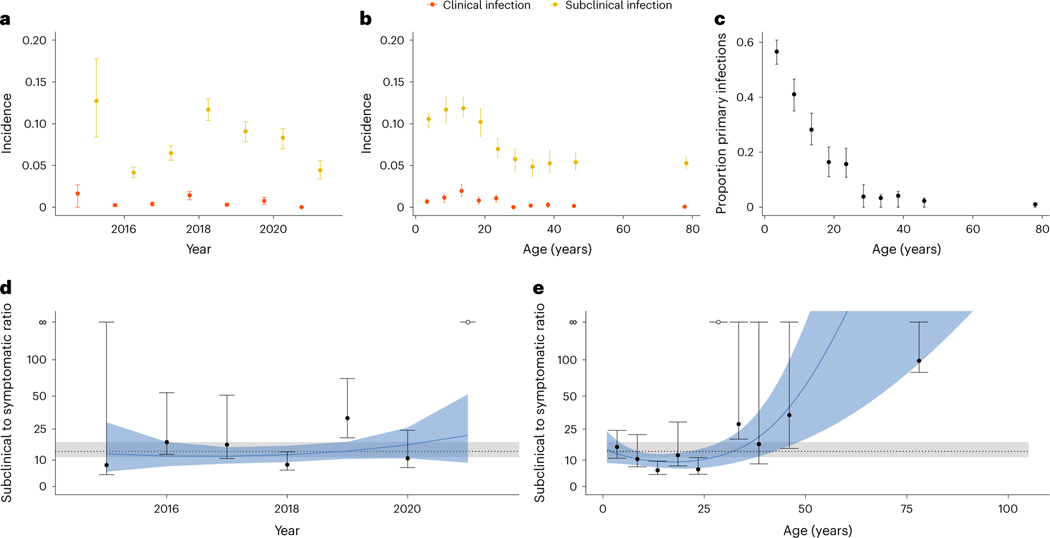
We found that the incidence of infections varied by year, with 2018 having higher incidence (Fig. 3a). Hospitalizations peaked in Kamphaeng Phet in 2018 during the analysed study period (Fig. 1a). The incidence of infection rates peaked among school-aged children (Fig. 3b). As expected, the proportion of primary infections (infections occurring in individuals without detectable antibodies to any serotype in any previous visit) was directly related to age, with almost all infections being post-primary (occurring in individuals with HAI antibody titres against at least one serotype greater than 20) after age 25. The ratio of subclinical to symptomatic infections was 13.8:1 (95% CI 10.0–17.8:1) in the cohort. There was some variability across years and age, with the highest risk of symptomatic disease occurring between the ages of 15 and 25 (Fig. 3d,e). We note that there were only 77 symptomatic infections out of 1,049 total infections, leading to wide confidence intervals for these ratios, particularly for years of age groups with few cases. It is possible that additional mildly symptomatic infections were missed by the surveillance platform during yearly follow-up, and in turn, these estimates probably represent lower bounds on the true number of symptomatic infections. Out of these 1,049 infections, 139 individuals had multiple infection events throughout the study (Supplementary Fig. 3a), with the average time between infections found to be 733 (95% CI 677–791). The probability of having a second or third infection, given that the individual had a previous infection, peaks between the ages of 10 and 15, similar to the age range of highest incidence (Supplementary Fig. 3b).
Fig. 3 |. Incidence, proportion of primary infections and ratio of subclinical to symptomatic cases.
a,b Incidence (infections per person–year) of both symptomatic (red, n = 77) and subclinical (yellow, n = 972) infections across interval year (a) and age (b). c, Proportion of primary infections as a function of age. d,e, Ratio of subclinical to symptomatic DENV incidence in the cohort as a function of interval year (d) and age (e). The mean and 95% CIs for the ratio of subclinical to symptomatic DENV incidence are represented by the dotted lines and grey regions, respectively. The mean and 95% CIs for polynomial fits to time and age are represented by the solid blue lines and blue regions, respectively.
Risk factors for DENV infection
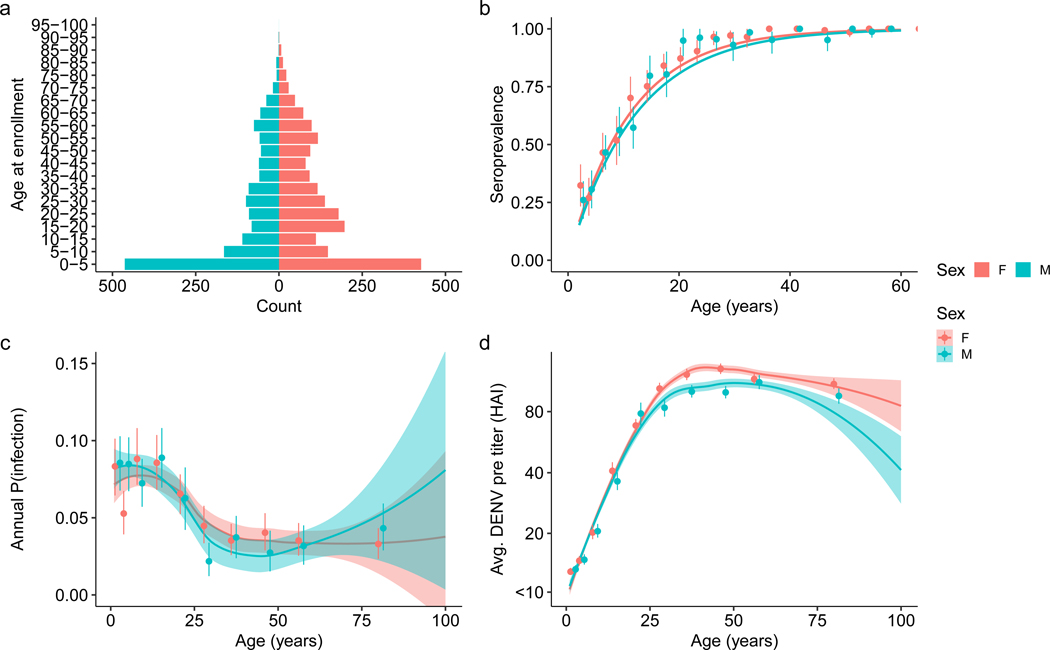
Using imputed infections from our classification algorithm, we investigated which individual and household risk factors were associated with infection risk. We found that individuals aged between 5 and 18, and between 18 and 30, were at higher risk of infection, with an adjusted odds ratio (aOR) of 1.44 (95% CI 1.16–1.77) and 1.41 (95% CI 1.06–1.89), respectively, compared with children aged 1–5 years. In an unadjusted analysis, there was no significant difference in odds of infection by sex (odds ratio (OR) 1.11, 95% CI 0.98–1.27). However, our data are consistent with an observed interaction between age and sex in infection risk of women between the ages of 18 and 40, who had an increased risk of infection compared with their male counterparts (Extended Data Fig. 1c). We also found no significant association between occupation and risk of infection in an adjusted analysis (Supplementary Table 2).
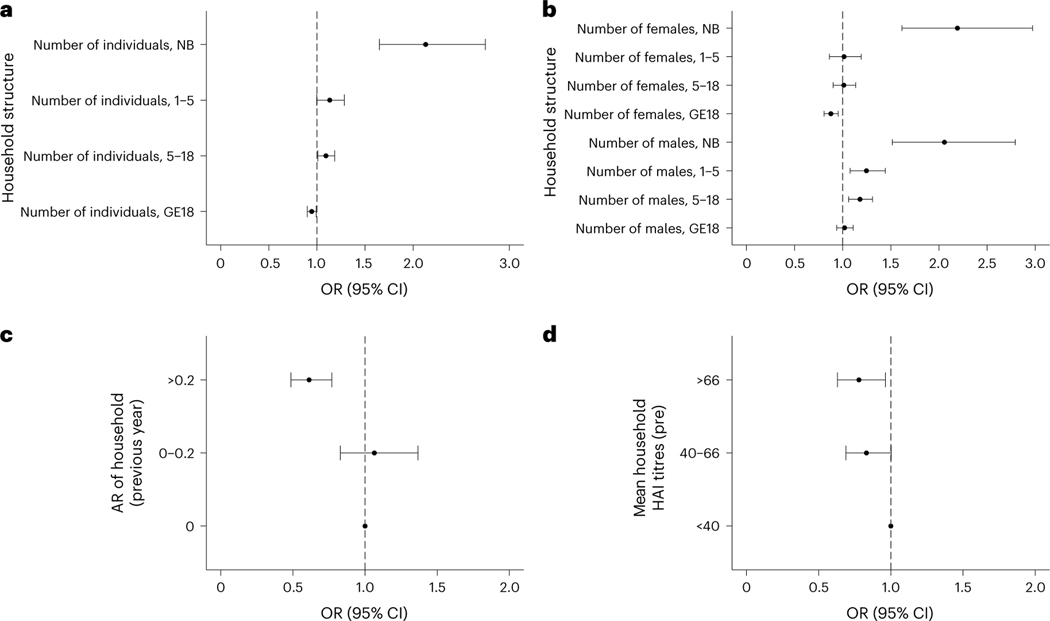
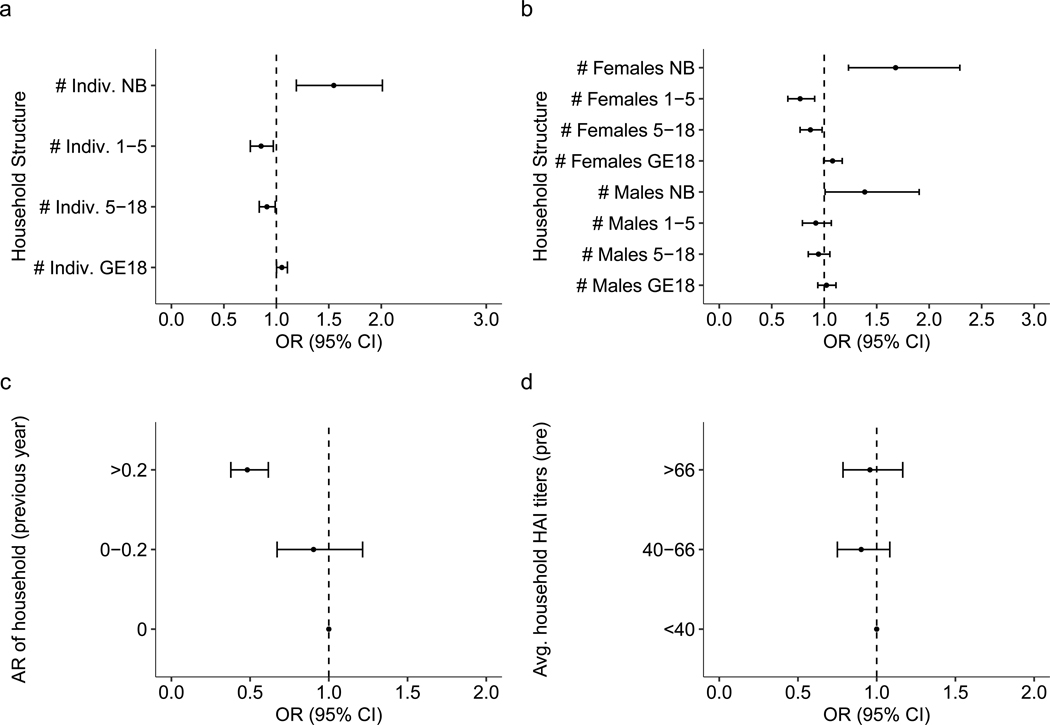
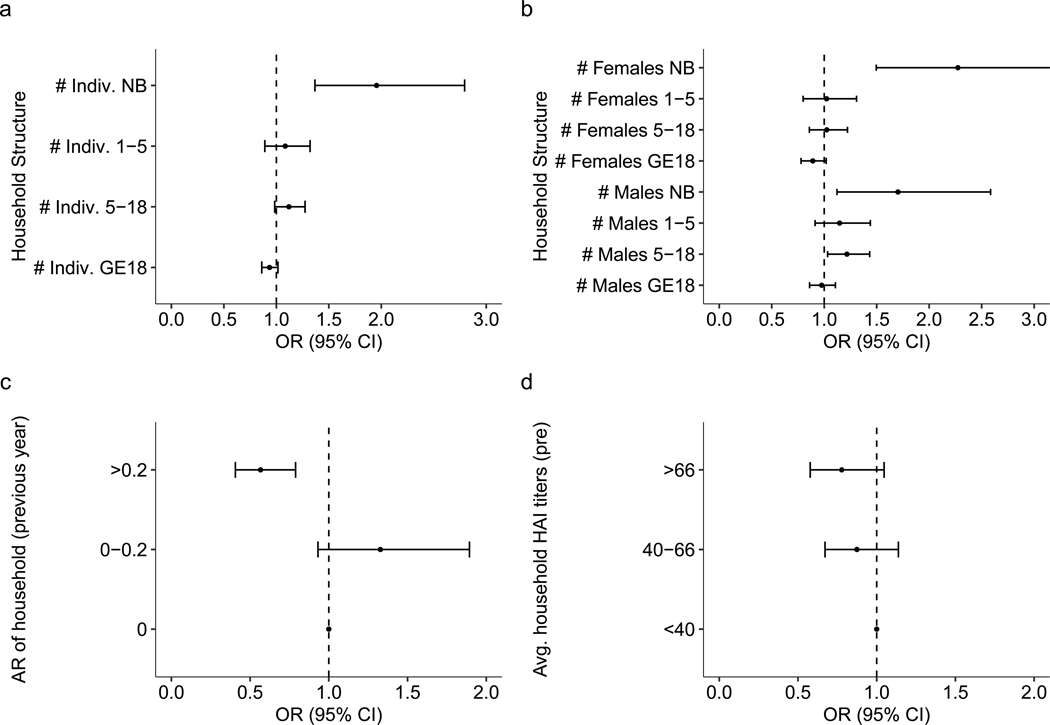
We studied how household-level factors affect an individual’s risk of infection. No covariates describing the surrounding built environment had a significant impact on dengue risk. However, we found strong associations between household composition and risk of infection. While the number of individuals living in the household was not associated with risk of infection (aOR 1.00, 95% CI 0.97–1.04), we found that each additional adult in the household reduced the likelihood of infection in the other household members, with an aOR of 0.95 (95% CI 0.90–0.99). The presence of each additional newborn and individual between the ages of 5 and 18 increased the odds of infection for the other household members, with an aOR of 2.13 (95% CI 1.65–2.75) and 1.09 (95% CI 1.01–1.19), respectively. Although not significant, the presence of each additional individual aged between 1 and 5 increased the odds of infection for household members, with an aOR of 1.13 (95% CI 1.00–1.28; Fig. 4a). Analyses stratified by sex revealed a more complex association between household composition and risk. For either sex, each additional newborn increased infection risk for the other individuals living in that household. For older-age groups, however, the associations varied by sex. Each additional male between the ages of 1 and 5 and between 5 and 18 increased risk, with an aOR of 1.25 (95% CI 1.08–1.44) and 1.18 (95% CI 1.06–1.31), respectively, while additional adult males had no impact on risk. Additional females provided no changes in risk except for adults, in which each additional female adult reduced risk, with an aOR of 0.88 (95% CI 0.81–0.95; Fig. 4b).
Fig. 4 |. Household composition and risk of infection across n = 11,131 intervals.
a–d, Household composition (a,b), infection history (c) and immunity (d) and their impact on the risk of infection are shown across n = 11,131 intervals. In a, the odds ratio is shown for the total number of individuals in various age bins (newborn (NB), 1–5 years, 5–18 years, and 18 years or older (GE18)) defined at the time of the post-interval sample. In b, the odds ratio is shown for the number of males and females of various age bins (NB, 1–5 years, 5–18 years, and 18 years or older (GE18)) defined at the time of the post-interval sample. In c, the previous interval’s attack rate (AR) and the subsequent odds ratio of infection risk relative to having no infections in the previous interval are shown. In d, the geometric mean of DENV HAI titres is shown for the rest of the household members and subsequent odds ratio of infection risk relative to having a mean household HAI titre under 40. All models are adjusted for household random effects, individual pre-interval titres and the year and month of post-interval sample; both means and 95% CIs are presented. The vertical dashed line represents an aOR of 1 (no significant impact on risk).
Beyond characterizing the association between household characteristics and composition on dengue risk, we sought to understand the impact of individual and household immunity. Consistent with previous findings, the most important predictor of infection risk during an interval was an individual’s HAI titres at the beginning of the interval (Fig. 5). In our analysis, the magnitude of average HAI log2 titres was inversely associated with risks of both subclinical and symptomatic infections. On average, each log2 increase in titres was associated with a 26.4% (95% CI 23.5–29.2%) decrease in risk of infection and a 38.7% (95% CI 27.9–47.9%) decrease in having a symptomatic infection. Interestingly, we also found that household immunity impacted an individual’s risk of infection even when accounting for that individual’s antibody titre. The distribution of these variables is found in Supplementary Fig. 4. Individuals living in households with high immunity (average HAI titres greater than 66) had decreased risk, with an aOR of 0.78 (95% CI 0.63–0.96) when compared with those with an average below 40 (Fig. 4d). As household titres are likely to be associated with recent household infection history, we also investigated how household attack rates during a preceding interval (the proportion of individuals within a household that had an imputed DENV infection in the preceding interval) impact future risk. Individuals living in households that had moderate to high attack rates (greater than 20% of household members experiencing an infection) during the previous year were at decreased risk of infection, with an aOR of 0.61 (95% aOR CI 0.49–0.77), compared with individuals coming from a household with no infections in the previous year (Fig. 4c). We also found that higher proportions of immune individuals at the household level decreased the risk of infection for household members (Supplementary Fig. 5).
Fig. 5 |. Impact of pre-interval DENV titres and probability of infection and symptoms across n = 11,131 intervals.
We first calculated the annualized probability of infection and then fit splines of order three to the data using a generalized logistic regression with 95% confidence intervals presented as shaded regions. All panels also contain means and 95% confidence intervals derived from basic non-parametric bootstraps. a, The annual probability of infection is a function of their pre-interval DENV titres. b, The annual probability that an individual is symptomatic is a function of their pre-interval DENV titres. c, The annual probability that an individual is symptomatic given that they were infected is a function of their pre-interval DENV titres.
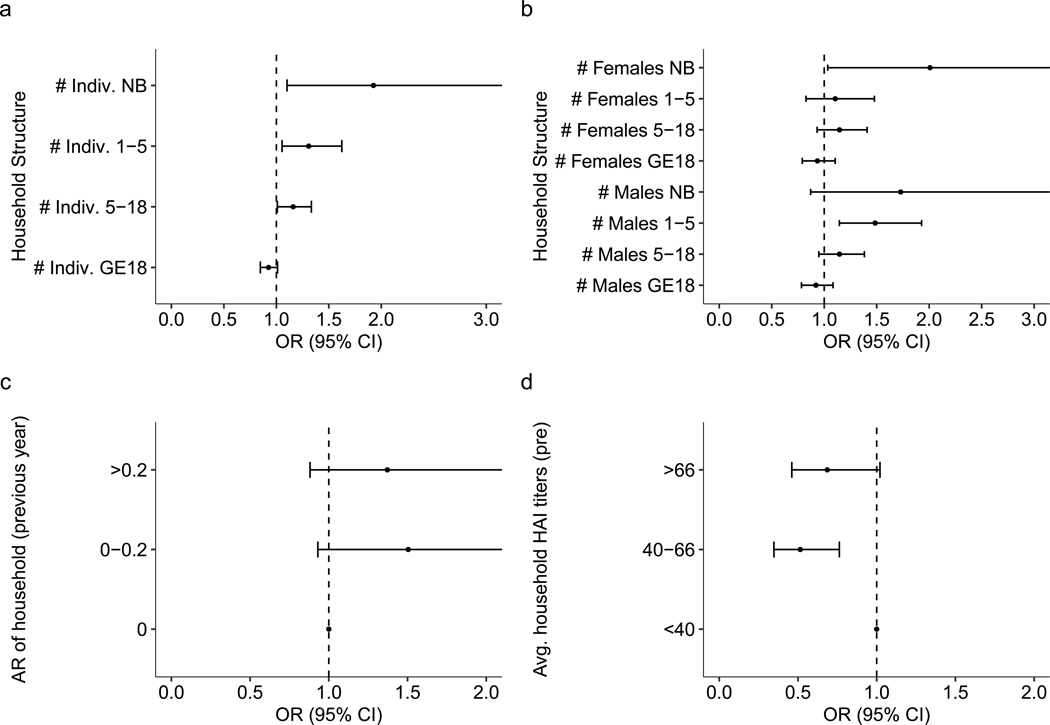
Sensitivity analyses were generally consistent with original findings. We want to highlight that if infections are imputed using a fourfold increase in any DENV serotype HAI titre, instead of the classification model developed here, the protective association between individual and household titres and infection risk remains (Extended Data Fig. 4). Specifically, for each log2 increase in an individual’s titres, there was an associated 28.5% (95% CI 25.5–31.4%) decrease in risk of infection and a 40.1% (95% CI 2.1–50.7%) decrease in having a symptomatic infection. Sensitivity analyses in which we restrict the data to households with more than 80% of individuals sampled and just seronaive individuals were also consistent with the main findings (Extended Data Figs. 5 and 6).
Discussion
We developed a classification algorithm using longitudinal data from a multigenerational cohort in Kamphaeng Phet, Thailand, to reconstruct subclinical DENV infections. Inferring subclinical infections with more precision enabled us to analyse individual- and household-level factors that affect risk of DENV infection. We report a protective effect of higher HAI titres at both the individual and household levels. Although previous work has shown that higher antibody titres protect individuals against infection32,34,35, we report an independent indirect effect of household immunity and composition on infection risk.
We studied how several household factors including composition, immunity and infection history each independently affect risk of infection with DENV. We found that all three factors determine an individual’s risk. When analysing household composition, we found that each additional adult reduced the likelihood of an infection, while each additional young child (1–5 years old) increased the likelihood of infection. These findings might be explained by the fact that children are more susceptible to infection than their adult counterparts who have already experienced infection and developed immunity in the past. We also found that higher levels of household immunity, and higher attack rates in the previous year, have protective effects against infection. These associations were evident even though there are other potential locations in an individual’s daily routine outside the home that impact risk of DENV infection, limiting the indirect protection in the home. Taken together, households with more adults or more recent infections will have more immunity to DENV and in turn reduce subsequent infection risk for household members.
At the individual level, our results are consistent with those of previous studies showing that individual antibody titres are the most important predictor of future DENV infection risks32,34,35. How this relationship varies across adults is less understood. Here we find that the risk of infection for adults over the age of 30 remains high, at approximately half that of younger individuals. These infections occur in individuals who have been infected two or more times and are in turn multi-typically protected. This is particularly relevant to the open question of how long boosting post-infection confers immunity and protection from clinical manifestations. For these same individuals, we find a higher subclinical to symptomatic ratio, suggesting that these adults are probably exposed to DENV while simultaneously not experiencing symptoms.
We hypothesized previously that the aging population of Thailand resulted in a decrease in the force of infection, potentially driven by longer-living adults that have multitypic immunity who reduce the risk that younger individuals living in the same household experience an infection15,36. Our results lead us to propose that a combination of immunity and recent infection history in a household can confer a form of ‘herd immunity’ for an individual, regardless of their own immune status. Children are more likely to be seronaive than adults and may present a means by which DENV can be introduced into the household. Introduction of DENV would subsequently increase the risk that the virus will be transmitted (by mosquitoes) to others in the household, a mechanism that would explain some of the spatial correlations found in another study of the same population37. It is intriguing that household composition, immunity and infection history have a significant impact on infection risk, whereas covariates measuring the surrounding built environment do not.
Our work provides a framework upon which machine learning classification models could be used to predict infection events from yearly serological data. Although application of a fourfold rise in titres as a barometer for infection can be useful when analysing acute and convalescent titres, our approach is a more robust and sensitive way to characterize subclinical infections. Previously, Bayesian-based approaches have been successful at reconstructing dengue infection events32,38, but they require substantial temporal information to inform the underlying mechanistic model of antibody kinetics. Our method provides a flexible framework that removes some of the bias of potential model misspecification and instead takes a fully data-driven approach to reconstruct infection events. This methodology could more broadly be applied to other infectious diseases in which longitudinal serological data are collected.
Our results highlight the importance of multigenerational household studies to fully understand the population dynamics of infectious diseases. The protective effects of household immunity had been hidden in previous analyses, some in the same setting, that have focused on children. However, our work has some limitations. Our model training is limited by the fact that there are only 90 data points used to inform the classification algorithm. If these illness investigations are biased, this would propagate to our predictions. In particular, as primary and subclinical DENV infections are underrepresented, then we may be less capable of identifying these DENV infections. In addition, development of the training data required that we define individuals who had no infection event during an interval, a difficult task that could further limit our approach. We were unable to differentiate between homologous and heterologous infections owing to HAI data being cross-reactive across DENV serotypes (Supplementary Fig. 6). Instead, we are only able to determine whether an individual had an exposure or not during a given interval. If plaque reduction neutralization test data were used instead, it is possible some additional serotype-specific information could be elucidated; however, cross-reactivity is also an issue for plaque reduction neutralization tests in post-primary infections. Another limitation of the study was the fact that serum samples were taken at yearly intervals. This made it impossible to fully disentangle the timing of infections that would provide important information on how infections propagate in a household. Incorporating additional active sampling events throughout the year in household studies like this one could provide important temporal information to understand this further. Finally, due to study design, most female participants of reproductive age give birth upon enrollment. We are therefore not in a position to examine whether the sex differences found between the ages of 18 and 40 are due to age or to other biological or behavioural factors (Extended Data Fig. 1) related to pregnancy and giving birth. Further work must be done to fully understand this relationship.
There is a critical need to better understand how immunity impacts the spread of infectious diseases like DENV. With DENV infections being highly spatiotemporally correlated in endemic settings, the success of future intervention efforts hinges on the ability to accurately quantify infection risk. Disentangling risk into the component contributions from individual-, household- and community-level factors could help direct these efforts. Individuals with higher immunity are protected from infection and disease, while entire populations can also experience similar protective effects from population-level immunity. Here we show evidence of protective effects of immunity at the household level.
If household immunity is a major driver of spatiotemporal clustering, interventions may be effectively targeted towards households with lower immunity. Considering immunity at multiple scales when mapping dengue risk and making public health decisions is important.
Methods
Kamphaeng Phet family-based cohort study
This study used data from an ongoing family-based longitudinal cohort study in Kamphaeng Phet, Thailand. Details of the design have been previously described33. Briefly, we enrolled pregnant mothers and their multigenerational households. Per the inclusion criteria, a household was eligible for enrollment if a minimum of three members in addition to the newborn consented or assented to participation: the pregnant woman, another child and an older adult aged at least 50 years. Active surveillance began with the birth of the newborn, with enrollment specimens for the remainder of the household collected before the birth of the newborn. To ascertain subclinical infections, serum samples were obtained from all participants roughly annually after enrollment. Acute febrile illness events were detected through a combination of active and passive surveillance strategies. Individuals were instructed to notify study staff if an acute febrile illness event occurred. In addition, participants were contacted by the study team on a weekly basis to determine if any member of the household had been febrile since the last contact. Upon discovery of a febrile episode, an illness investigation was triggered, in which acute and convalescent blood samples were obtained from the febrile case. If the illness investigation identified a PCR-confirmed case, a household investigation was triggered in which acute and convalescent samples were taken for the remaining household members. The convalescent samples were taken at 14 and 28 days after the acute sample collection.
This study was approved by the Thailand Ministry of Public Health Ethical Research Committee; Siriraj Ethics Committee on Research Involving Human Subjects; Institutional Review Board for the Protection of Human Subjects, State University of New York Upstate Medical University; and Walter Reed Army Institute of Research Institutional Review Board (protocol number 2119).
Laboratory methods
All samples obtained during routine visits were tested using HAIs to quantify antibody titres against all four DENV serotypes and Japanese encephalitis virus (JEV)39. In addition, all acute and convalescent samples were tested using HAI for all four DENV serotypes and JEV as well as immunoglobulin M and immunoglobulin G capture ELISAs for DENV and JEV40. All acute samples also underwent DENV RT-PCR41. For the purpose of this analysis, we defined a confirmed DENV infection as any case that is RT-PCR positive for any DENV serotype or in which both HAI and ELISA results using the acute and convalescent samples were diagnostic of an infection33. Further details on the specific laboratory methods used have been described in previous work42–44 and are summarized in Supplementary Information.
Statistical analysis
The purpose of this analysis was to investigate individual and household risk factors for DENV infection in this multigenerational cohort. To do this, we first fit a classification algorithm to the yearly HAI data to identify subclinical infections. We then used these imputed infections to investigate individual- and household-level drivers of infection.
Training data
We define a positive- and negative-person period as follows: a total of 90 confirmed DENV infections were identified through the case investigations. Data from the yearly HAIs surrounding these confirmed DENV infections were defined as the positive-person periods. For negative-person periods, we took the remaining full dataset and removed any interval in which an individual had a confirmed DENV infection via the illness investigation, or in which individuals had a larger-than-fourfold increase in any one of their yearly DENV serotype HAIs. We then removed any individuals living in the same household during these aforementioned intervals as DENV transmission is known to be clustered within households. This left 3,466 intervals that could potentially be used as negative controls from the available 11,131 observed intervals (Supplementary Fig. 1). We randomly sampled a third of these to be added to the training data, creating a total of 1,246 intervals in our training set. The first interval of sampling for newborns was excluded in this analysis because of limited representation in the serologically supported infections that could provide information on maternal antibody kinetics.
Prediction model
Using training data described above, we ran a gradient-boosted regression using the R package xgboost45,46. Unlike in random forest models in which multiple independently trained decision trees are combined to determine the overall likelihood of a model, in gradient-boosted regression, each decision tree is fit on what the previous trained ensemble of trees have misclassified, allowing for refinement on difficult classification problems. The candidate predictors we used to train this model are listed in Supplementary Table 1. Variables used to summarize the ratio and difference between pre- and post-interval DENV titres across serotypes (maximum, minimum, geometric mean and variance) were calculated at the individual serotype level, and then the summary statistic of interest was quantified across all four serotypes.
Model fit
For hyperparameter tuning, we used a random-search approach within a nested cross-validation approach in which we initially split the training data into four cross-validation sets and subsequently performed hyperparameter tuning on each subset using fivefold cross-validation. Model performance was quantified using the hold-out set. Before each random-search run, we randomly downsampled the dataset to balance the number of positive- and negative-person periods. We performed this random-search approach a total of 5,000 times and saved the top 100 performing models evaluated on the held-out cross-validation set with the lowest log-loss value. The average predicted classification score (bounded between 0 and 1) for these 100 runs was taken to be the probability the individual was infected in that yearly interval. Intervals assigned a value greater than or equal to 0.5 were considered to be DENV infections.
Predicting subclinical DENV infections
We subsequently fit the models with the lowest log-loss values on the entire training dataset and predicted the presence or absence of infections in the remaining intervals that make up the evaluation dataset. We used the training labels as ground truth and subsequently analysed risk factors for the entire dataset.
Characterizing risk factors of DENV infection and disease
We fit a series of univariate and adjusted logistic regressions to characterize how DENV infection risk is a function of temporal, individual and household factors. These models were run using the glmmTMB function found within the glmmTMB package in R47,48. We fit all models using a binomial GLM with a logit link function. All generalized linear models were optimized using the nlminb method found in the stats package. Only household random effects were incorporated into the model as the inclusion of both household and individual random effects led to singular fits.
Individual- and household-level risk
We first tested whether demographic factors were associated with risk, including age, sex and employment. We binned individuals into five age bins (1–5, 5–18, 18–30, 30–50 and 50+). Individuals under 1 year were excluded as they will usually have maternal antibodies, which would complicate this analysis owing to different kinetics. Sex was defined upon enrollment into the cohort. Further information on individual- and household-related covariates can be found in Supplementary Information.
We subsequently performed analyses to quantify how household composition and infection history impacted risk for an individual. Data on household composition consisted of the number of newborns, individuals between 1 and 5, individuals between 5 and 18, and adults, all of whom were broken down by sex. We fit models to estimate how the number of individuals in each of these bins impacted infection risk. For the analysis on infection history, we fit models to assess how the attack rate, the proportion of the household members who were inferred to have an infection, in the previous interval (categorized into three sets defined as containing strictly 0, (0.2) and [0.2,1]) impacted the infection risk. The distribution of these values was zero inflated and skewed right owing to many households having no infections in the previous interval. Note that we removed the individual of interest in determining both the household composition and attack rate of the household to isolate how the household is impacting risk. For both of these covariates, we fit three logistic regression models, a univariate model, a univariate model with random effects and a multivariate model with random effects. As the goal of these models was to characterize the independent effect of the household-level covariates, each of these multivariate models also accounts for the individual’s average pre-interval HAI titre as well as the month and year of sampling as these have been shown to be important predictors of risk. This ensured that the individual’s age, titres and infection history did not impact subsequent calculations. Confounding effects of household-related factors were accounted for in adjusted analyses in which household random effects were incorporated. Note that as this analysis required at least two consecutive intervals, around 25% of the intervals were not included leaving 6,913 intervals.
We then performed logistic regressions to understand how individual and household immunity impact DENV infection risk. We defined individual immunity to be the geometric mean of HAI titres transformed into log2 space. We defined household immunity for a particular individual to be the geometric mean of HAI titres of the household transformed into log2 space with the individual of interest removed from the calculation. HAI cutoffs of 40 and 66 were chosen for the household immunity covariate as these constituted the 33rd and 66th percentiles. Similar to the previous analysis, we fit three logistic regressions for each, a univariate model, a univariate model with random effects and a multivariate model with random effects. In addition to these random effects and the covariate of interest, each multivariate model also accounts for the month and year of sampling. The household immunity adjusted model also accounted for the individual’s average pre-interval HAI titre.
Sensitivity analysis
To assess whether our main findings were robust to methodological assumptions or potential biases in the data, we performed three sensitivity analyses. The first sensitivity analysis that we performed was based on the fact that at times not all individuals in a household were sampled. Those that went unsampled in a household were more likely to be adult males potentially leading to confounding effects of households with more missing data. We, in turn, reran the analyses with the fourfold increase in titres rule often used as the standard in longitudinal serological studies. This sensitivity analysis allows for the direct comparison between our prediction algorithm and the most commonly implemented approach in the literature (Extended Data Fig. 4). We also conducted analyses on all intervals taken from households with more than 80% of their members sampled, limiting the analysis to 6,453 intervals (Extended Data Fig. 5). Lastly, we reran the analyses in individuals who were seronaive at the beginning of the interval to investigate whether the identified associations were also observable in the fully susceptible subpopulation, limiting the analysis to 2,066 intervals (Extended Data Fig. 6). Further descriptions of these results can be found in the ‘Sensitivity analysis‘ section of Supplementary Information.
Data exclusion
Note that we excluded data from newborns in the analysis to avoid potential biases from maternal antibodies49.
Reporting summary
Further information on research design is available in the Nature Portfolio Reporting Summary linked to this article.
Extended Data
Extended Data Fig. 1 |. Cohort age distribution and various characteristics broken apart by sex.
(a) Age pyramid of enrolled subjects in five-year bins separated by sex (n = 3539). (b) Seroprevalence curve for subjects enrolled before 2017 in solid line, the analysis was conducted separately by sex. Points are mean seroprevalence in each fifth percentile for non-newborns under 30 years old (n = 6197). Confidence bounds are found using a basic nonparametric bootstrap. (c) Pre-interval DENV titers averaged across all four serotypes and their impact on probability of infection. (d) Relationship between pre-interval DENV titers averaged across all four serotypes and age. Both analyses included n = 11131 intervals with points and intervals representing the mean and 95% confidence interval. Shaded regions represent the 95% confidence intervals of fits.
Extended Data Fig. 2 |. Model training information and resulting probability of infection distribution.
(a) Confusion matrix for XGBoost model on training data. Reference values are found as outlined in the Methods section titled Training data while prediction values are found using the approach outlined in the Model fit section of the methods section. (b) Histogram of model predictions for probability of infection between sequential blood draws conducted on the full dataset.
Extended Data Fig. 3 |. Pre and post interval HAI titers by DENV serotype and JEV.
Pre and post interval HAI titers for all DENV serotypes and JEV grouped by age at post interval age and colored by whether the model predicted a DENV infection. Yellow and blue dots represent points that were or were not identified as infections respectively by the model while black and red points represent a similar dichotomy but in laboratory confirmed seroconversions. A four-fold increase in titers between samples is represented by the black diagonal line.
Extended Data Fig. 4 |. Sensitivity analysis on household related factors when utilizing the four-fold increase in DENV antibodies.
Sensitivity analysis on how household composition (a, b), infection history (c) and immunity (d) impact risk of infection when infections are defined to occur if there is a four-fold increase in antibody levels between paired serological samples (n = 11131). (a) Odds ratio for the number of total individuals in various age bins (newborn [NB], from 1–5 years old, from 5 to 18, and those 18 years or older [GE18]) defined at the time of the post-interval sample. (b) Odds ratio for the number of males and females of various age bins (newborn [NB], from 1–5 years old, from 5 to 18, and those 18 years or older [GE18]) defined at the time of the post-interval sample. (c) Previous interval’s attack rate (AR) and subsequent odds ratio of infection risk relative to having no infections in the previous interval. (d) Geometric mean of DENV HAI titers for the rest of the household and subsequent odds ratio of infection risk relative to having an average household HAI titer under 40. All models are adjusted for household random effects, individual pre-interval titers, as well as the year and month of post-interval sample. The vertical dashed line represents an aOR of 1 (no significant impact on risk).
Extended Data Fig. 5 |. Sensitivity analysis on household related factors in households with high sampling rates.
Sensitivity analysis on how household composition (a, b), infection history (c) and immunity (d) impact risk of infection in households where more than 80% of samples are recorded (n = 6435). (a) Odds ratio for the number of total individuals in various age bins (newborn [NB], from 1–5 years old, from 5 to 18, and those 18 years or older [GE18]) defined at the time of the post-interval sample. (b) Odds ratio for the number of males and females of various age bins (newborn [NB], from 1–5 years old, from 5 to 18, and those 18 years or older [GE18]) defined at the time of the post-interval sample. (c) Previous interval’s attack rate (AR) and subsequent odds ratio of infection risk relative to having no infections in the previous interval. (d) Geometric mean of DENV HAI titers for the rest of the household and subsequent odds ratio of infection risk relative to having an average household HAI titer under 40. All models are adjusted for household random effects, individual pre-interval titers, as well as the year and month of post-interval sample. The vertical dashed line represents an aOR of 1 (no significant impact on risk).
Extended Data Fig. 6 |. Sensitivity analysis on household related factors in seronaive individuals.
Sensitivity analysis on how household composition (a, b), infection history (c) and immunity (d) impact risk of infection in individuals who were seronaive at the start of an interval (n = 2066). (a) Odds ratio for the number of total individuals in various age bins (newborn [NB], from 1–5 years old, from 5 to 18, and those 18 years or older [GE18]) defined at the time of the post-interval sample. (b) Odds ratio for the number of males and females of various age bins (newborn [NB], from 1–5 years old, from 5 to 18, and those 18 years or older [GE18]) defined at the time of the post-interval sample. (c) Previous interval’s attack rate (AR) and subsequent odds ratio of infection risk relative to having no infections in the previous interval. (d) Geometric mean of DENV HAI titers for the rest of the household and subsequent odds ratio of infection risk relative to having an average household HAI titer under 40. All models are adjusted for household random effects, individual pre-interval titers, as well as the year and month of post-interval sample. The vertical dashed line represents an aOR of 1 (no significant impact on risk).
Supplementary Material
Acknowledgements
We thank the data collection team as well as the children and adults involved in the study for all their efforts. We were supported in this work by the following: the National Institutes of Health (NIH) Grant 5P01AI034533–22: entire team; Military Infectious Disease Research Program (MIDRP): D.B., S.F., A.F. and K.B.A.; NIH 1R01AI175941–01: entire team; European Research Council 804744: H.S.; and NIH 1R35GM138361–01: M.H.-P. and I.R.-B. The funders had no role in the study design, data collection and analysis, decision to publish or preparation of the paper.
Footnotes
Competing interests
The authors declare no competing interests.
Additional information
Extended data is available for this paper at https://doi.org/10.1038/s41564-023-01543-3.
Supplementary information The online version contains supplementary material available at https://doi.org/10.1038/s41564-023-01543-3.
Reprints and permissions information is available at www.nature.com/reprints.
Data availability
The dataset analysed in this study is available at https://github.com/marcohamins/role-of-HH-immunity.
Code availability
All code associated with the work is available at https://github.com/marcohamins/role-of-HH-immunity.
References
- 1.Cattarino L, Rodriguez-Barraquer I, Imai N, Cummings DAT & Ferguson NM. Mapping global variation in dengue transmission intensity. Sci. Transl. Med. 12, eaax4144 (2020). [DOI] [PubMed] [Google Scholar]
- 2.Wilder-Smith A, Ooi E-E, Horstick O & Wills B. Dengue. Lancet 393, 350–363 (2019). [DOI] [PubMed] [Google Scholar]
- 3.Bhatt S et al. The global distribution and burden of dengue. Nature 496, 504–507 (2013). [DOI] [PMC free article] [PubMed] [Google Scholar]
- 4.Dos Santos GR et al. Individual, household, and community drivers of dengue virus infection risk in Kamphaeng Phet Province, Thailand. J. Infect. Dis. 226, 1348–1356 (2022). [DOI] [PMC free article] [PubMed] [Google Scholar]
- 5.Salje H et al. Dengue diversity across spatial and temporal scales: local structure and the effect of host population size. Science 355, 1302–1306 (2017). [DOI] [PMC free article] [PubMed] [Google Scholar]
- 6.Yoon I-K et al. Fine scale spatiotemporal clustering of dengue virus transmission in children and Aedes aegypti in rural Thai villages. PLoS Negl. Trop. Dis. 6, e1730 (2012). [DOI] [PMC free article] [PubMed] [Google Scholar]
- 7.Anders KL et al. Households as foci for dengue transmission in highly urban Vietnam. PLoS Negl. Trop. Dis. 9, e0003528 (2015). [DOI] [PMC free article] [PubMed] [Google Scholar]
- 8.Cuong HQ et al. Spatiotemporal dynamics of dengue epidemics, southern Vietnam. Emerg. Infect. Dis. 19, 945–953 (2013). [DOI] [PMC free article] [PubMed] [Google Scholar]
- 9.Salje H et al. Revealing the microscale spatial signature of dengue transmission and immunity in an urban population. Proc. Natl Acad. Sci. USA 109, 9535–9538 (2012). [DOI] [PMC free article] [PubMed] [Google Scholar]
- 10.Ratanawong P et al. Spatial variations in dengue transmission in schools in Thailand. PLoS ONE 11, e0161895 (2016). [DOI] [PMC free article] [PubMed] [Google Scholar]
- 11.Chen Y et al. Measuring the effects of COVID-19-related disruption on dengue transmission in Southeast Asia and Latin America: a statistical modelling study. Lancet Infect. Dis. 22, 657–667 (2022). [DOI] [PMC free article] [PubMed] [Google Scholar]
- 12.Undurraga EA, Halasa YA & Shepard DS. Use of expansion factors to estimate the burden of dengue in Southeast Asia: a systematic analysis. PLoS Negl. Trop. Dis. 7, e2056 (2013). [DOI] [PMC free article] [PubMed] [Google Scholar]
- 13.Clapham HE, Cummings DAT & Johansson MA. Immune status alters the probability of apparent illness due to dengue virus infection: evidence from a pooled analysis across multiple cohort and cluster studies. PLoS Negl. Trop. Dis. 11, e0005926 (2017). [DOI] [PMC free article] [PubMed] [Google Scholar]
- 14.Stanaway JD et al. The global burden of dengue: an analysis from the Global Burden of Disease Study 2013. Lancet Infect. Dis. 16, 712–723 (2016). [DOI] [PMC free article] [PubMed] [Google Scholar]
- 15.Huang AT et al. Assessing the role of multiple mechanisms increasing the age of dengue cases in Thailand. Proc. Natl Acad. Sci. USA 119, e2115790119 (2022). [DOI] [PMC free article] [PubMed] [Google Scholar]
- 16.Limkittikul K, Brett J & L’Azou M. Epidemiological trends of dengue disease in Thailand (2000–2011): a systematic literature review. PLoS Negl. Trop. Dis. 8, e3241 (2014). [DOI] [PMC free article] [PubMed] [Google Scholar]
- 17.Chareonsook O, Foy HM, Teeraratkul A & Silarug N. Changing epidemiology of dengue hemorrhagic fever in Thailand. Epidemiol. Infect. 122, 161–166 (1999). [DOI] [PMC free article] [PubMed] [Google Scholar]
- 18.Rodríguez-Barraquer I et al. Revisiting Rayong: shifting seroprofiles of dengue in Thailand and their implications for transmission and control. Am. J. Epidemiol. 179, 353–360 (2014). [DOI] [PMC free article] [PubMed] [Google Scholar]
- 19.Yang X, Quam MBM, Zhang T & Sang S. Global burden for dengue and the evolving pattern in the past 30 years. J. Travel Med. 28, taab146 (2021). [DOI] [PubMed] [Google Scholar]
- 20.Endy TP et al. Epidemiology of inapparent and symptomatic acute dengue virus infection: a prospective study of primary school children in Kamphaeng Phet, Thailand. Am. J. Epidemiol. 156, 40–51 (2002). [DOI] [PubMed] [Google Scholar]
- 21.Kuan G et al. The Nicaraguan pediatric dengue cohort study: study design, methods, use of information technology, and extension to other infectious diseases. Am. J. Epidemiol. 170, 120–129 (2009). [DOI] [PMC free article] [PubMed] [Google Scholar]
- 22.Endy TP et al. Determinants of inapparent and symptomatic dengue infection in a prospective study of primary school children in Kamphaeng Phet, Thailand. PLoS Negl. Trop. Dis. 5, e975 (2011). [DOI] [PMC free article] [PubMed] [Google Scholar]
- 23.Gordon A et al. The Nicaraguan pediatric dengue cohort study: incidence of inapparent and symptomatic dengue virus infections, 2004–2010. PLoS Negl. Trop. Dis. 7, e2462 (2013). [DOI] [PMC free article] [PubMed] [Google Scholar]
- 24.Ly S et al. Asymptomatic dengue virus infections, Cambodia, 2012–2013. Emerg. Infect. Dis. 25, 1354–1362 (2019). [DOI] [PMC free article] [PubMed] [Google Scholar]
- 25.Reyes M et al. Index cluster study of dengue virus infection in Nicaragua. Am. J. Trop. Med. Hyg. 83, 683–689 (2010). [DOI] [PMC free article] [PubMed] [Google Scholar]
- 26.Beckett CG et al. Early detection of dengue infections using cluster sampling around index cases. Am. J. Trop. Med. Hyg. 72, 777–782 (2005). [PubMed] [Google Scholar]
- 27.Mammen MP et al. Spatial and temporal clustering of dengue virus transmission in Thai villages. PLoS Med. 5, e205 (2008). [DOI] [PMC free article] [PubMed] [Google Scholar]
- 28.Yoon I-K et al. Underrecognized mildly symptomatic viremic dengue virus infections in rural Thai schools and villages. J. Infect. Dis. 206, 389–398 (2012). [DOI] [PMC free article] [PubMed] [Google Scholar]
- 29.Asish PR, Dasgupta S, Rachel G, Bagepally BS & Girish Kumar CP. Global prevalence of asymptomatic dengue infections—a systematic review and meta-analysis. Int. J. Infect. Dis. 134, 292–298 (2023). [DOI] [PubMed] [Google Scholar]
- 30.Endy TP et al. Spatial and temporal circulation of dengue virus serotypes: a prospective study of primary school children in Kamphaeng Phet, Thailand. Am. J. Epidemiol. 156, 52–59 (2002). [DOI] [PubMed] [Google Scholar]
- 31.Sabin AB. Research on dengue during World War II. Am. J. Trop. Med. Hyg. 1, 30–50 (1952). [DOI] [PubMed] [Google Scholar]
- 32.Salje H et al. Reconstruction of antibody dynamics and infection histories to evaluate dengue risk. Nature 557, 719–723 (2018). [DOI] [PMC free article] [PubMed] [Google Scholar]
- 33.Anderson KB et al. An innovative, prospective, hybrid cohort–cluster study design to characterize dengue virus transmission in multigenerational households in Kamphaeng Phet, Thailand. Am. J. Epidemiol. 189, 648–659 (2020). [DOI] [PMC free article] [PubMed] [Google Scholar]
- 34.Moodie Z et al. Neutralizing antibody correlates analysis of tetravalent dengue vaccine efficacy trials in Asia and Latin America. J. Infect. Dis. 217, 742–753 (2018). [DOI] [PMC free article] [PubMed] [Google Scholar]
- 35.Katzelnick LC, Montoya M, Gresh L, Balmaseda A & Harris E. Neutralizing antibody titers against dengue virus correlate with protection from symptomatic infection in a longitudinal cohort. Proc. Natl Acad. Sci. USA 113, 728–733 (2016). [DOI] [PMC free article] [PubMed] [Google Scholar]
- 36.Cummings DAT et al. The impact of the demographic transition on dengue in Thailand: insights from a statistical analysis and mathematical modeling. PLoS Med. 10.1371/journal.pmed.1000139 (2009). [DOI] [PMC free article] [PubMed] [Google Scholar]
- 37.Ribeiro Dos Santos G et al. Estimating the effect of the wMel release programme on the incidence of dengue and chikungunya in Rio de Janeiro, Brazil: a spatiotemporal modelling study. Lancet Infect. Dis. 22, 1587–1595 (2022). [DOI] [PMC free article] [PubMed] [Google Scholar]
- 38.Salje H et al. Evaluation of the extended efficacy of the Dengvaxia vaccine against symptomatic and subclinical dengue infection. Nat. Med. 27, 1395–1400 (2021). [DOI] [PMC free article] [PubMed] [Google Scholar]
- 39.Clarke DH & Casals J. Techniques for hemagglutination and hemagglutination–inhibition with arthropod-borne viruses. Am. J. Trop. Med. Hyg. 7, 561–573 (1958). [DOI] [PubMed] [Google Scholar]
- 40.Innis BL et al. An enzyme-linked immunosorbent assay to characterize dengue infections where dengue and Japanese encephalitis co-circulate. Am. J. Trop. Med. Hyg. 40, 418–427 (1989). [DOI] [PubMed] [Google Scholar]
- 41.Lanciotti RS, Calisher CH, Gubler DJ, Chang GJ & Vorndam AV. Rapid detection and typing of dengue viruses from clinical samples by using reverse transcriptase-polymerase chain reaction. J. Clin. Microbiol. 10.1128/jcm.30.3.545-551.1992 (1992). [DOI] [PMC free article] [PubMed] [Google Scholar]
- 42.Nisalak A. Laboratory diagnosis of dengue virus infections. Southeast Asian J. Trop. Med. Public Health 46, 55–76 (2015). [PubMed] [Google Scholar]
- 43.Sirikajornpan K et al. Comparison of anti-DENV/JEV Ig-A enzyme-linked immunosorbent assay and hemagglutination inhibition assay. Southeast Asian J. Trop. Med. Public Health 49, 629–638 (2018). [Google Scholar]
- 44.Sirikajornpan K et al. Standardization and evaluation of an anti-ZIKV IgM ELISA assay for the serological diagnosis of zika virus infection. Am. J. Trop. Med. Hyg. 105, 936–941 (2021). [DOI] [PMC free article] [PubMed] [Google Scholar]
- 45.Chen T et al. xgboost: extreme gradient boosting (2022); https://CRAN.R-project.org/package=xgboost [Google Scholar]
- 46.Chen T & Guestrin C XGBoost. In Proc. 22nd ACM SIGKDD Int. Conf. on Knowledge Discovery and Data Mining (ed Krishnapuram B) 785–794 (ACM, 2016); 10.1145/2939672.2939785 [DOI] [Google Scholar]
- 47.R: a language and environment for statistical computing. R Core Team; https://www.R-project.org/ (2022). [Google Scholar]
- 48.Brooks M et al. glmmTMB balances speed and flexibility among packages for zero-inflated generalized linear mixed modeling. R J. 9, 378–400 (2017). [Google Scholar]
- 49.O’Driscoll M et al. Maternally derived antibody titer dynamics and risk of hospitalized infant dengue disease. Proc. Natl Acad. Sci. USA 120, e2308221120 (2023). [DOI] [PMC free article] [PubMed] [Google Scholar]
Associated Data
This section collects any data citations, data availability statements, or supplementary materials included in this article.
Supplementary Materials
Data Availability Statement
The dataset analysed in this study is available at https://github.com/marcohamins/role-of-HH-immunity.
All code associated with the work is available at https://github.com/marcohamins/role-of-HH-immunity.


