Abstract
A wide range of endogenous and xenobiotic organic ions require facilitated transport systems to cross the plasma membrane for their disposition. In mammals, organic cation transporter (OCT) subtypes 1 and 2 (OCT1 and OCT2, also known as SLC22A1 and SLC22A2, respectively) are polyspecific transporters responsible for the uptake and clearance of structurally diverse cationic compounds in the liver and kidneys, respectively. Notably, it is well established that human OCT1 and OCT2 play central roles in the pharmacokinetics and drug-drug interactions (DDI) of many prescription medications, including metformin. Despite their importance, the basis of polyspecific cationic drug recognition and the alternating access mechanism for OCTs have remained a mystery. Here, we present four cryo-electron microscopy structures of apo, substrate-bound, and drug-bound OCT1 and OCT2 consensus variants, in outward-facing and outward-occluded states. Together with functional experiments, in silico docking, and molecular dynamics simulations, these structures uncover general principles of organic cation recognition by OCTs and provide insights into extracellular gate occlusion. Our findings set the stage for a comprehensive structure-based understanding of OCT-mediated drug-drug interactions, which will prove critical in the preclinical evaluation of emerging therapeutics.
Introduction
Organic cation transporters (OCTs) are members of the solute carrier 22 (SLC22) transporter family. OCT subtype 1 (OCT1; SLC22A1) is highly expressed in the liver, whereas OCT2 (SLC22A2) is primarily expressed in the kidney1. OCT1 and OCT2 exhibit similar substrate specificity, transporting various endogenous cationic compounds such as thiamine, uremic solutes, and biogenic amines (for example, epinephrine, serotonin, and dopamine)2–5. Notably, OCT1 and OCT2 respectively mediate the hepatic uptake and renal secretion of a wide range of cationic drugs and play critical roles in drug disposition and response6. Case in point, the gold standard type II anti-diabetic drug metformin is principally taken up into the liver and kidneys by OCT1 and OCT2, respectively. Consequently, many genetic variants of slc22a1 and slc22a2 are associated with decreased metformin responses and altered pharmacokinetics7–9. Likewise, recent studies of genetic polymorphisms demonstrate the key role of OCT1 and OCT2 in the pharmacokinetics of many drugs and controlled substances6,10–13. There are currently well over 250 identified prescription drugs that are either substrates or inhibitors of OCT1 and OCT2, with a growing list that includes diphenhydramine (DPH) (antihistamine), fluoxetine and imipramine (antidepressants), and imatinib (IMB) (anticancer)14–16.
The polyspecificity of hOCT1 and hOCT2, and the fact that approximately 40% of prescription medicines are organic cations17, highlights their role in transporter mediated drug-drug interactions (DDIs). This suggests broad implications on drug and clinical trial design, as DDI is a critical factor in clinical drug disposition, response, and toxicity. In fact, hOCT1 and hOCT2 have been implicated in multiple DDI instances16,18–20. For example, the antihypertensive drug verapamil (VPM), which is an OCT1 inhibitor, was shown to decrease the glucose-lowering effect of metformin through DDI on hOCT121. Because untested DDIs may introduce severe adverse effects on patients, the European Medicines Agency (EMA), the US Food and Drug Administration (FDA), and the International Transporter Consortium recommend in vitro testing of new therapeutics for potential interaction with hOCT1 and hOCT26,22,23.
Over the past few decades, a wealth of functional studies have uncovered several key features of substrate recognition and drug interaction with hOCT1 and hOCT224–32. However, the structural basis of substrate recognition, transport inhibition, DDI, and the transport mechanism of hOCT1 and hOCT2 remain elusive. The polyspecificity of hOCT1 and hOCT2 is in stark contrast with a majority of other SLC transporters, making it challenging to postulate a common binding mode and their transport mechanism in the absence of structural information. This ultimately hinders the development of more accurate methods to critically evaluate novel therapeutics for their interaction with hOCT1 and hOCT2 at the preclinical stage14,33. In this Article, we sought to investigate the structures, drug binding mechanism and conformational transitions of OCT1 and OCT2 by cryo-EM, functional experiments, in silico docking and molecular dynamics (MD) simulations.
Results
Structure determination of OCT1 and OCT2
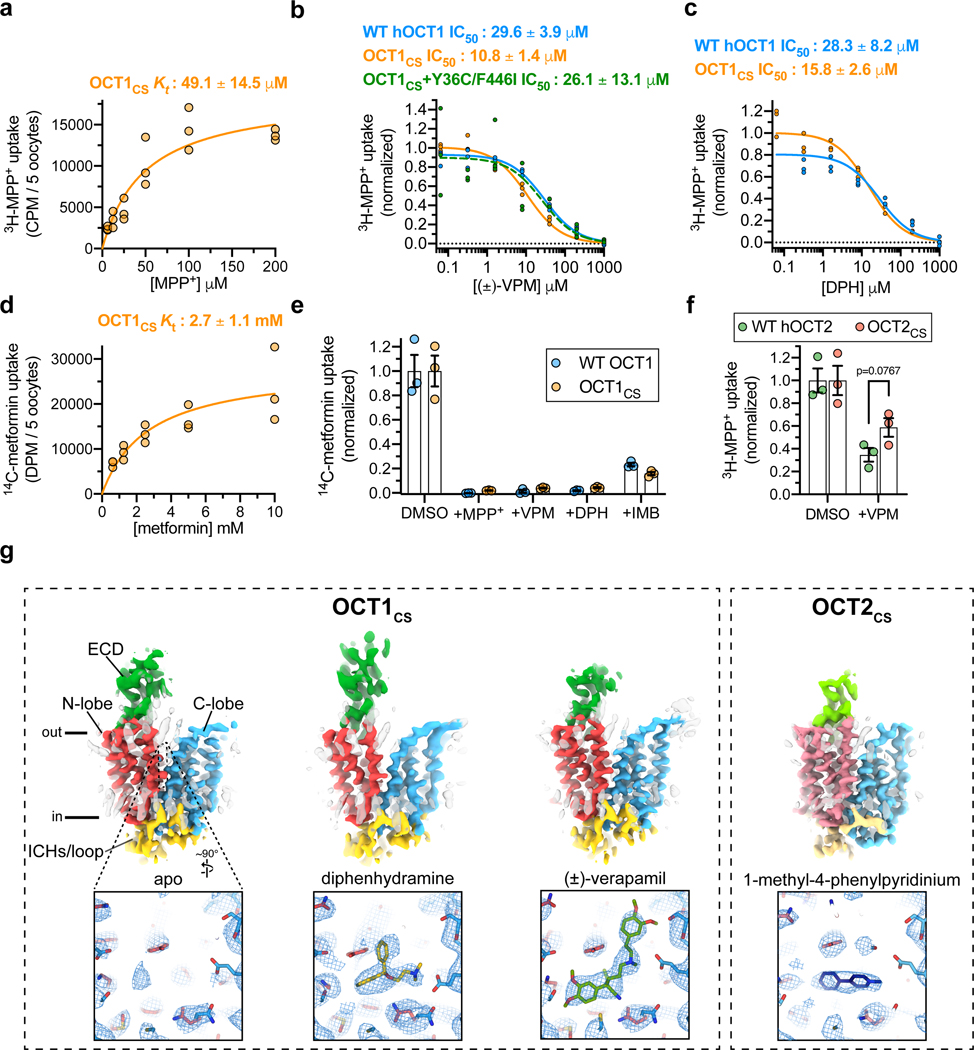
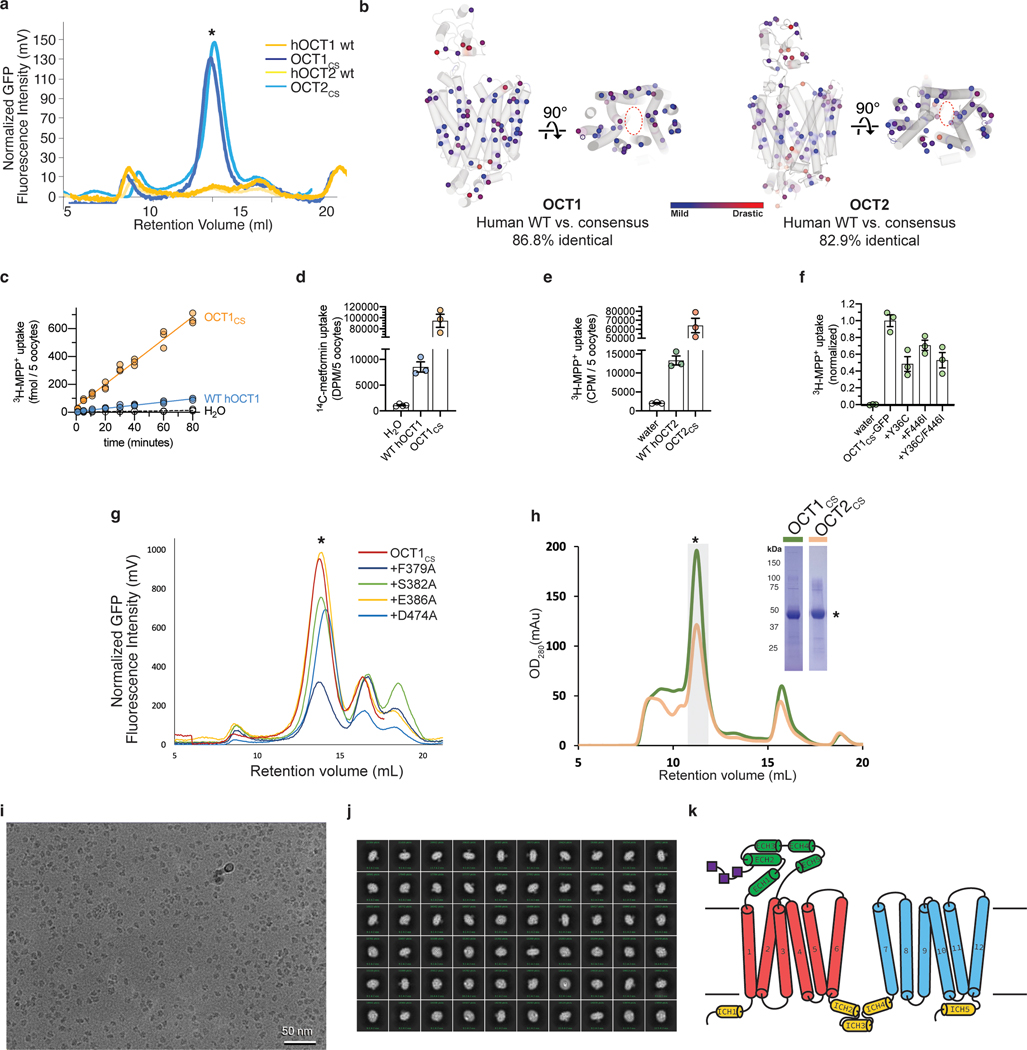
Wild type human OCT1 and OCT2 (WT hOCT1 and WT hOCT2) express poorly in transiently transfected HEK293T cells, which prohibited biochemical optimization (Extended Data Fig. 1a). To enable structural studies, we turned to consensus mutagenesis34,35. This approach resulted in two engineered OCT proteins, which we term OCT1CS and OCT2CS (see Methods). Exhibiting sequence identities of 87% and 83% to WT, respectively (Extended Data Fig. 1b, Supplementary Fig. 1), both constructs express well in transiently transfected HEK293T cells and exhibit monodisperse behavior in fluorescence size exclusion chromatography (FSEC) analysis (Extended Data Fig. 1a). When expressed in Xenopus laevis oocytes, OCT1CS mediates accumulation of tritiated 1-methyl-4-phenylpyridinium (3H-MPP+) to levels higher than WT hOCT1 (Extended Data Fig. 1c), while retaining intrinsic transport properties similar to wild type (WT). This is evidenced by a determined Michaelis constant for transport (Kt) value of ~50 μM for MPP+ transport by OCT1CS, which is consistent with previous reports for WT hOCT1 (Fig. 1a)4,36,37. Also, IC50 (half maximal inhibitory concentration) values for verapamil (VPM) or the antihistamine diphenhydramine (DPH) are similar for WT hOCT1 and OCT1CS, based on cold competition of [3H]-MPP+ uptake in oocytes (Fig.1b, c). Furthermore, the OCT1CS Kt value of ~3 mM for metformin (Fig. 1d) is within range of previous reports for WT hOCT1 (1–5 mM)8,38. Finally, WT and OCT1CS are functionally similar in cold-competition experiments against 14C-metformin transport with MPP+, VPM, DPH, and imatinib (IMB) (Fig 1e, Extended Data Fig. 1d). OCT2CS is also functionally competent, exhibiting higher raw [3H]-MPP+ uptake relative to WT hOCT2 with similar levels of block by racemic VPM (Fig. 1f, Extended Data Fig. 1e). It is important to point out that OCT1CS bears the nonhuman substitutions of C36Y and I446F, positions that have previously been implicated in substrate recognition in WT hOCT1 and rat OCT124,39. We back-mutated OCT1CS at these positions to assess the effects substitutions at these positions would have on the functional properties of OCT1CS and found modest reductions in raw uptake levels of [3H]-MPP+ (Extended Data Fig. 1f), with the OCT1CS-Y36C/F446I double mutant exhibiting a similar IC50 value for racemic VPM compared to both WT and OCT1CS (Fig. 1b).
Figure 1 |. Cryo-EM structures of organic cation transporters 1 and 2.
a, Kt determination for 3H-MPP+ uptake mediated by X. laevis oocytes expressing OCT1CS (30 min uptake; n=3 biologically independent replicates, individual replicates shown, Kt ± s.e.m.) b, Cold-competition inhibition of WT hOCT1, OCT1CS or OCT1CS-Y36C/F446I mutant mediated 3H-MPP+ uptake by (±)-VPM (30 min uptake with 100 nM 3H-MPP+; n=3 biologically independent replicates, individual replicates shown, IC50 ± s.e.m.). c, Cold-competition inhibition of WT hOCT1 or OCT1CS mediated 3H-MPP+ uptake by DPH (30 min uptake with 100 nM 3H-MPP+; n=3 biologically independent replicates, individual replicates shown, IC50 ± s.e.m.). d, Kt determination for 14C-metformin uptake mediated by OCT1CS (n=3 biologically independent replicates, individual replicates shown, Kt ± s.e.m.). e, Single concentration-point cold-competition block of 14C-metformin uptake (2 hour uptake with 83.3 μM radiotracer) by WT hOCT1 or OCT1CS with 1 mM cold MPP+, VPM, or DPH, or 0.231 mM cold IMB (n=3 biologically independent replicates shown along with mean ± s.e.m.; data background corrected using water injected controls, and normalized to their respective DMSO control conditions; unnormalized water, WT and OCT1CS injected controls shown in Extended Data Fig. 1d for reference). f, WT hOCT2 or OCT2CS mediated 3H-MPP+ uptake (1 h uptake with 100 nM 3H-MPP+; n=3 biologically independent replicates shown along with mean ± s.e.m.; data background corrected using water injected controls, and normalized to their respective DMSO control conditions; unnormalized values for water, WT and OCT2CS injected controls shown in Extended Data Fig. 1e for reference; P-value from an unpaired two-tailed t-test shown). g, Cryo-EM reconstructions of apo-OCT1CS, DPH-OCT1CS, VPM-OCT1CS, or MPP-OCT2CS (top), with cryo-EM densities of the central cavity shown at bottom (map thresholds are set at 0.45, 0.25, 0.30, or 0.25 for apo-OCT1CS, DPH-OCT1CS, VPM-OCT1CS, or MPP+-OCT2CS ligand densities, respectively).
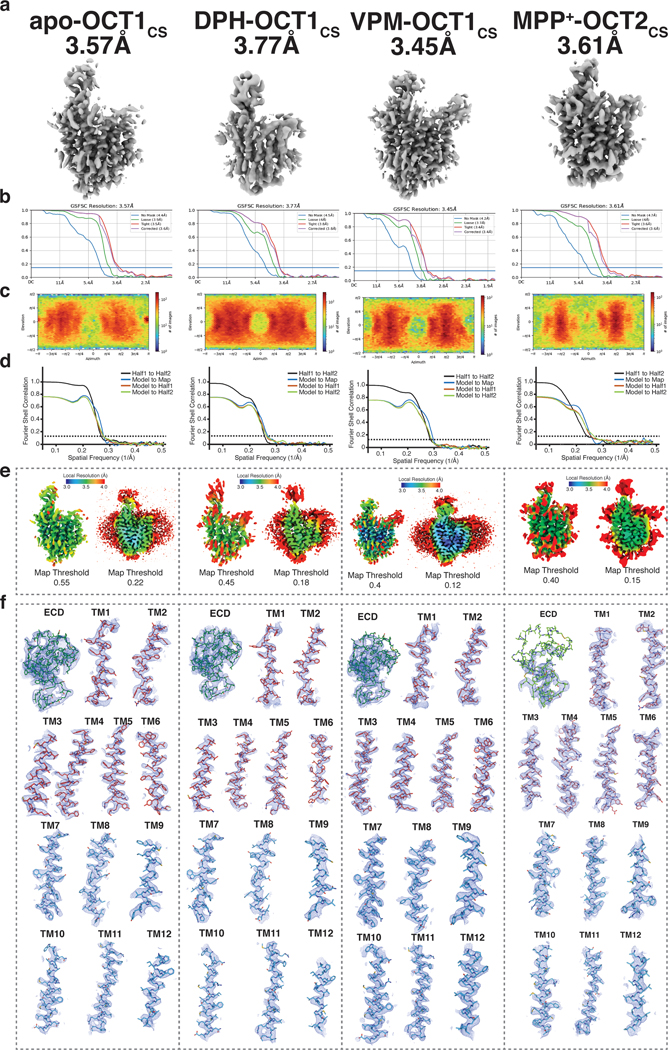
Owing to the enhanced expression level and biochemical stability of OCT1CS and OCT2CS, (Extended Data Fig. 1a, g, h), we then solved three cryo-electron microscopy (cryo-EM) structures of OCT1CS: in the absence of added ligand to 3.57 Å resolution (apo-OCT1CS), with (±)-VPM bound to 3.45 Å resolution (VPM-OCT1CS), and with DPH bound to 3.77 Å resolution (DPH-OCT1CS; Fig. 1g, Table 1 and Extended Data Figs. 1i–j, 2 and 3). We also solved one structure of OCT2CS: with MPP+ bound to 3.61 Å resolution (Fig. 1g, Table 1 and Extended Data Figs. 2 and 3). The local resolutions for the ligand/ligand binding regions for apo-OCT1cs, VPM-OCT1CS, DPH-OCT1CS, and MPP+-OCT2CS are ~3.2, ~3.1, ~3.3, and ~3.3, respectively (Fig. 1g and Extended Data Figs. 2 and 3).
Table 1 |.
Cryo-EM data collection, refinement, and validation statistics
| Apo-OCT1CS (EMD-28586) (PDB 8ET6) | DPH-OCT1CS (EMD-28587) (PDB 8ET7) | VPM-OCT1CS (EMD-28588) (PDB 8ET8) | MPP+-OCT2CS (EMD-28589) (PDB 8ET9) | |
|---|---|---|---|---|
|
| ||||
| Data collection and processing | ||||
| Magnification | 81,000 | 81,000 | 45,000 | 81,000 |
| Voltage (kV) | 300 | 300 | 200 | 300 |
| Electron exposure (e–/Å2) | 60 | 60 | 40 | 60 |
| Defocus range (μm) | −0.8 to −1.8 | −0.8 to −1.8 | −0.6 to −1.6 | −0.8 to −2.0 |
| Pixel size (Å) | 1.08 | 1.08 | 0.88 | 0.5347 |
| Symmetry imposed | C1 | C1 | C1 | C1 |
| Initial particle images (no.) | 5,515,896 | 5,495,544 | 1,794,057 | 1,141,906 |
| Final particle images (no.) | 102,580 | 189,183 | 89,771 | 73,474 |
| Map resolution (Å) | 3.57 | 3.77 | 3.45 | 3.61 |
| FSC threshold | 0.143 | 0.143 | 0.143 | 0.143 |
| Map resolution range (Å) | 3.17–9.80 | 3.33–6.71 | 3.05–7.22 | 3.29–8.17 |
| Refinement | ||||
| Initial model used (PDB code) | VPM-OCT1CS | VPM-OCT1CS | − | VPM-OCT1CS |
| Map sharpening B factor (Å2) | −152.3 | −164.4 | −121.1 | −141.9 |
| Model composition | ||||
| Non-hydrogen atoms | 8,117 | 8,157 | 8,188 | 7,697 |
| Protein residues | 532 | 532 | 532 | 517 |
| Ligands | NAG:2 | DPH:1, NAG:2 | VPM:1, NAG:2 | MPP:1 |
| B factors (Å2) | ||||
| Protein | 67.72 | 84.59 | 59.60 | 113.01 |
| Ligand | 132.52 | 111.90 | 81.89 | 93.91 |
| R.m.s. deviations | ||||
| Bond lengths (Å) | 0.003 | 0.002 | 0.003 | 0.005 |
| Bond angles (°) | 0.521 | 0.468 | 0.569 | 0.610 |
| Validation | ||||
| MolProbity score | 1.49 | 1.38 | 1.47 | 1.46 |
| Clashscore | 4.90 | 3.91 | 4.39 | 8.46 |
| Poor rotamers (%) | 0.00 | 0.00 | 0.00 | 0.52 |
| Ramachandran plot | ||||
| Favored (%) | 96.42 | 96.79 | 96.23 | 98.24 |
| Allowed (%) | 3.58 | 3.21 | 3.77 | 1.76 |
| Disallowed (%) | 0.00 | 0.00 | 0.00 | 0.00 |
The overall OCT fold can be divided into three parts – an extracellular domain (ECD), a transmembrane (TM) domain consisting of 12 transmembrane (TM) helices and an intracellular helical (ICH) bundle composed of four short helices (Fig. 1g, Extended Data Fig. 1k). The 12 TM helices form a 6+6 pseudosymmetrical arrangement with TMs 1–6 composing the N-terminal lobe, and TMs 7–12 the C-terminal lobe. The reconstructions obtained in the presence of ligand feature well-defined densities in the central cavity between the N- and C- domains, while the apo-OCT1CS reconstruction lacks such density (Fig. 1g).
The interface between the N- and C-lobes of OCTs form a highly conserved cavity in which substrates bind (Fig. 2a and Supplemental Fig. 1). All three OCT1CS reconstructions adopt an apparent outward-facing open conformation, as the opening at the extracellular side is large enough to readily accommodate substrate entry. A feature unique to OCT1 is an extended extracellular domain (ECD) located between TM 1 and TM 2. The ~90 residue ECD forms a cap-like structure that sits atop the N-lobe and interacts with the TM3-TM4 and TM5-TM6 loops. Compared to the TMs, the ECD is suboptimally resolved due to its relative flexibility (Fig. 1g).
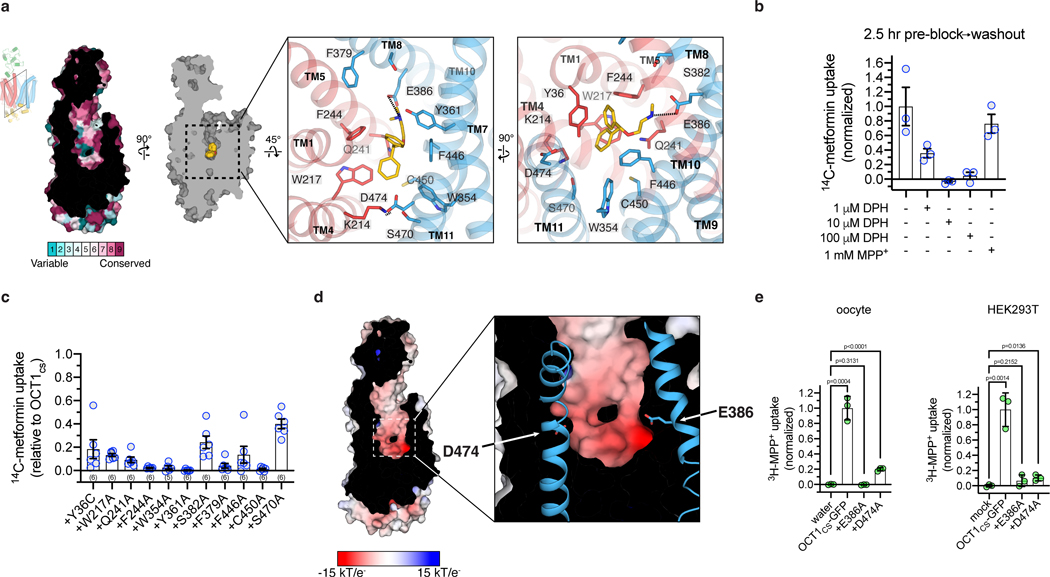
Figure 2 |. Diphenhydramine recognition by OCT1.
a, ConSurf54 analysis of the OCT1CS central cavity (left). Residue Y36 in the central cavity shows high variability across OCT1 orthologs in the multiple sequence alignment. Detailed DPH-OCT1 interactions in the binding cavity (right), highlighting interacting residues. b, Residual cold competition block of 14C-metformin uptake mediated by OCT1CS. 2.5 h pre-treatment with cold competitor performed at the noted concentration, followed by rapid and extensive oocyte washing in ligand-free buffer immediately before initiation of the uptake assay (10 μM 14C-metformin in 30 min into OCT1CS expressing oocytes; data background corrected using the water injected controls, and normalized to none-added control condition; n=3 biologically independent replicates shown along with mean ± s.e.m.). c, Functional evaluation of mutants in the OCT1CS background (accumulation of 10 μM 14C-metformin in 1 h into mutant-expressing oocytes; ; n=3 biologically independent replicates shown along with mean ± s.e.m.). d, APBS55 surface electrostatic calculation of the OCT1CS central cavity (see Methods). e, Left, uptake of 3H-MPP+ by OCT1CS-GFP or mutants in the OCT1CS-GFP background in oocytes (accumulation of 100 nM 3H-MPP+ in 1 h into mutant-expressing oocytes; n=3 biologically independent replicates shown along with mean ± s.e.m. Data background corrected using the water injected condition, and normalized to the OCT1CS-GFP uptake condition). Right, uptake of 3H-MPP+ by OCT1CS-GFP or mutants in the OCT1CS-GFP background expressed in HEK293T cells (accumulation of 10 nM 3H-MPP+ in 40 min into mutant-expressing HEK293T cells; n=3 biologically independent replicates shown along with mean ± s.e.m, data background corrected using the mock-transfected condition and normalized to the OCT1CS-GFP uptake condition). P-values from an unpaired two-tailed t-tests are shown.
DPH binding to OCT1
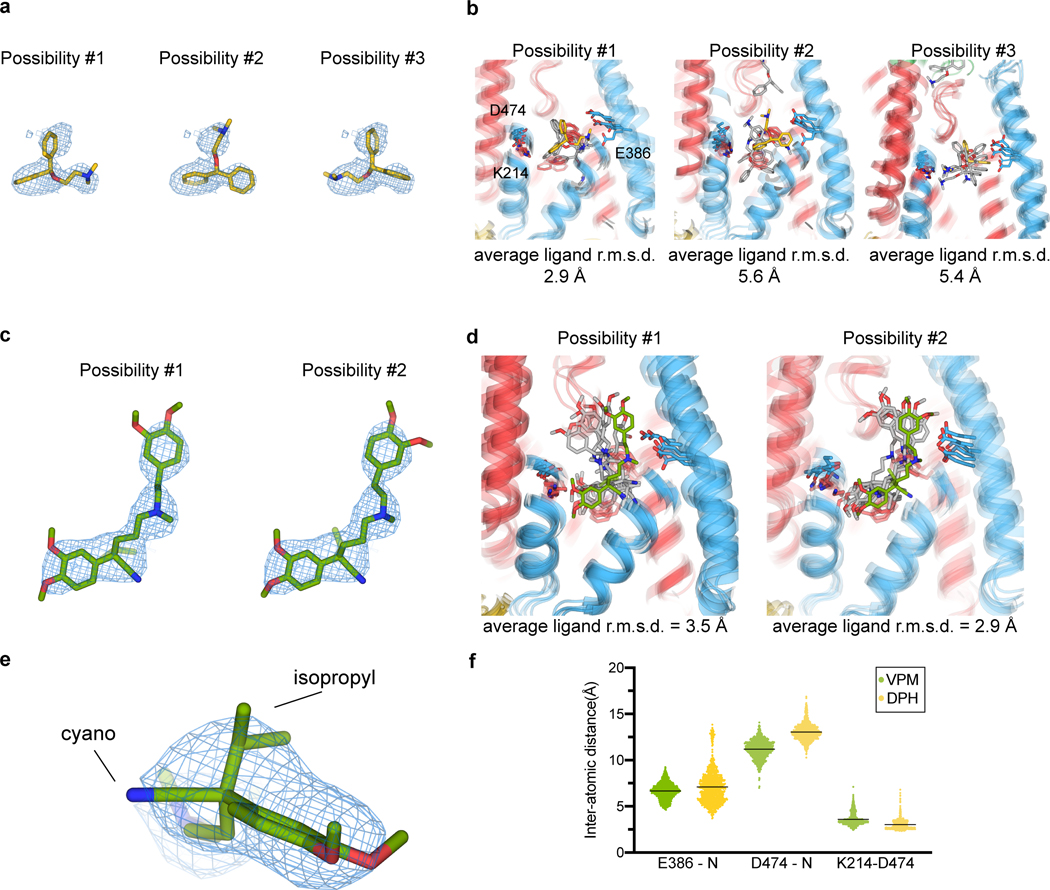
The robust cryo-EM density and molecular dynamics (MD) simulations of three possible binding poses allowed us to assign the DPH molecule in DPH-OCT1CS without ambiguity (Extended Data Fig. 4a,b). The DPH molecule is stabilized by several hydrophobic residues (Fig. 2a), in particular W217 (TM4) and F244 (TM5) on the N-lobe, as well as W354 (TM7) and F446 (TM10) on the C-lobe (F446 is isoleucine in hOCT1). These four residues form opposing ‘walls’ of the binding pocket, with the only two acidic residues within the cavity, E386 (TM8) and D474 (TM11), defining the other two sides (Fig 2a). The positively charged dimethylethanamine group is proximal to E386, while D474 (TM11) forms a charge-pair with neighboring K214 (TM4) (Fig. 2a). Y36 (TM1) and Y361 (TM7) line the cavity above the plane of the four hydrophobic residues. Typically, major facilitator superfamily (MFS) transporters bind ligand with residues on TMs 1, 4, 7, 10 (known as A helices)40,41, however OCT1 also recruits TMs 5 and 8 (known as B helices) to bind DPH. Only two residues differ in the ligand binding cavity between OCT1CS and hOCT1 - Y36 (C36 in hOCT1) and F446 (I446 in hOCT1) (Fig. 2a and Extended Data. Fig. 1b). As stated earlier, backmutation of these positions to what is present in WT hOCT1 in the OCT1CS background (Y36C and F446I) resulted in small differences in raw [3H]-MPP+ uptake activities, with the double mutant exhibiting an IC50 for VPM similar to both WT hOCT1 and OCT1CS (Fig. 1b, Extended Data Fig. 1f).
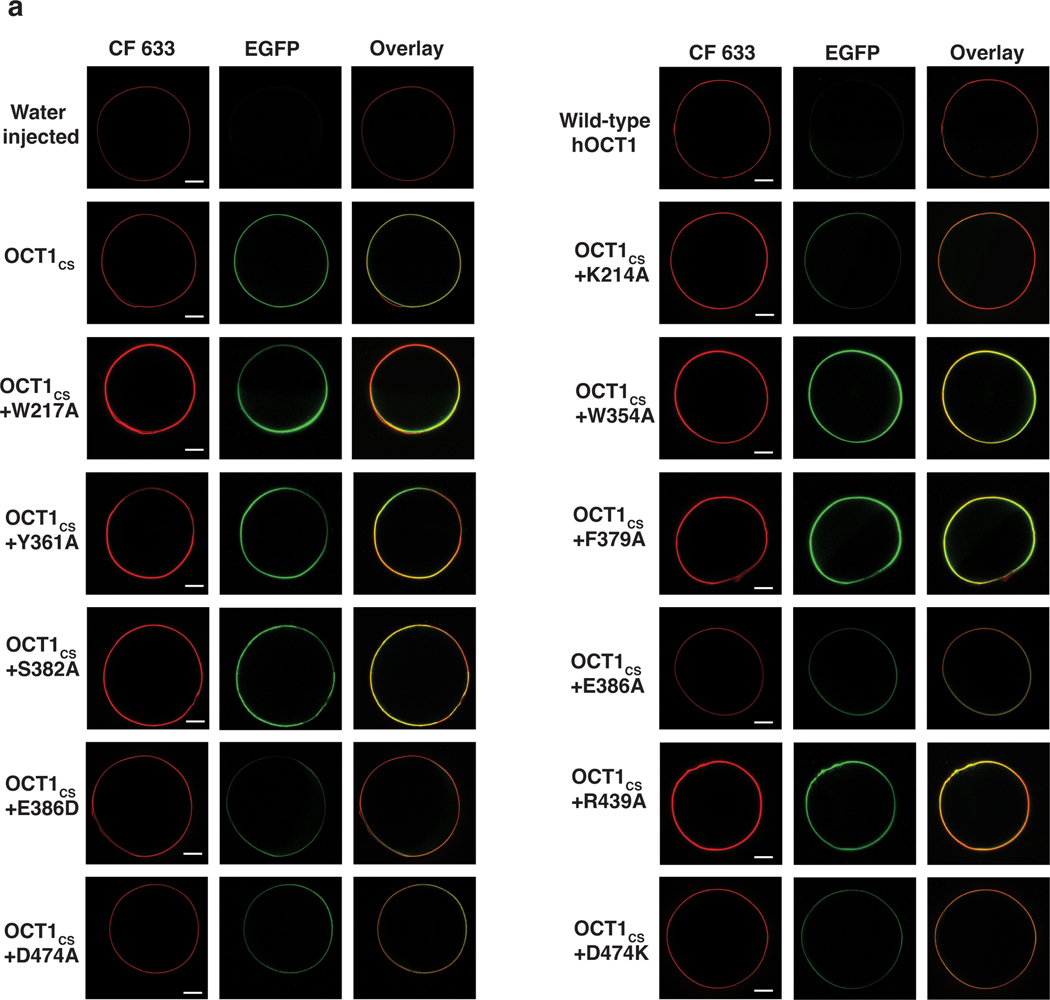
It is not well established whether DPH is a transported substrate or inhibitor of OCT1. The quantity of radioactive DPH required for uptake experiments prohibited direct testing for OCT1CS uptake of DPH, so we instead pursued cold ligand wash-out experiments. Unlike the OCT1 substrate MPP+, DPH exhibits apparently slow off-rate kinetics since substantial residual block of [14C]-metformin uptake remained after washing out external cold DPH (Fig. 2b). These data suggests DPH is a nontransported inhibitor of OCT1CS. Therefore, for further functional interrogation of OCT1CS, [14C]-metformin uptake measurements were performed on alanine mutants of residues lining the central cavity (Fig. 2c). We found that the aromatic and aliphatic residues interacting with DPH are also critical for metformin transport, as their alanine mutants show substantial reductions in transport activity. Mutants resulting in complete ablation of transport activity were verified to be properly membrane localized and folded, as evident by their surface expression on oocytes (Extended Data Fig. 5). A select subset of alanine mutants were expressed in HEK293T cells, and their proper folding and membrane trafficking is evidenced by monodisperse behavior in FSEC analysis (Extended Data Fig. 1g)
Electrostatic surface potential calculations show that the central cavity is anionic, with E386 appearing to make the greatest contribution (Fig. 2d). While previous studies have implicated D474 (numbering consistent with hOCT1) as being critical for cation binding and translocation in OCT125,28,39, the role of E386 has never been interrogated to the best of our knowledge. We measured [3H]-MPP+ uptake activity of E386A and D474A in the OCT1CS-GFP background expressed in oocytes, and while D474A retains ~20% activity, E386A exhibits no measurable uptake activity above water injected controls (Fig. 2e). The oocyte surface expression of these constructs was confirmed by confocal microscopy (Extended Data Fig. 5). To further validate this finding with an orthogonal assay, we also expressed the mutants in HEK293T cells and tested their ability to mediate cellular uptake of [3H]-MPP+ (Fig. 2e) and found E386A exhibits no measurable uptake activity above mock transfected controls. Both of these mutants are properly folded based on the basis of monodisperse FSEC behaviors (Extended Data Fig. 1g). The structural and functional observations reported here reveal the previously unrecognized importance of E386 in cation drug recognition by OCT1 (Fig 2a,d,e).
OCT1 inhibition by VPM
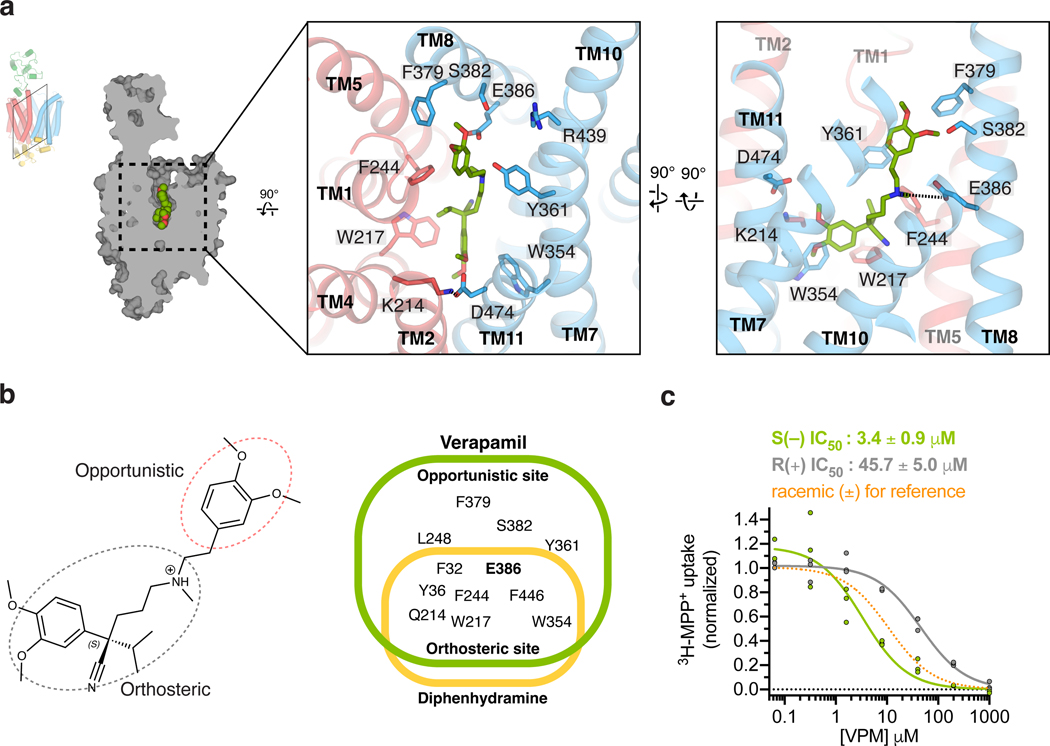
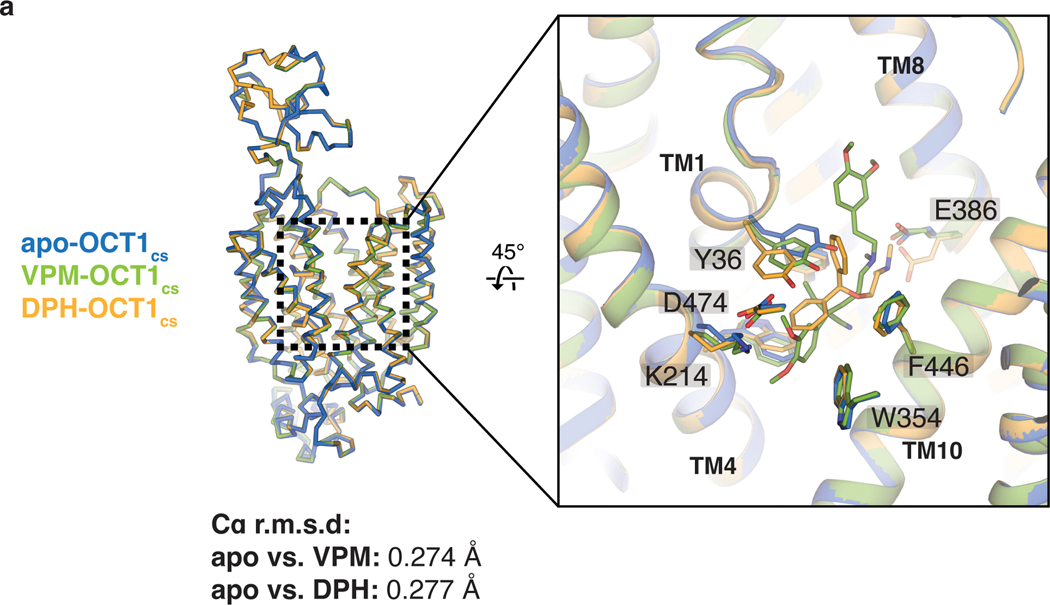
VPM is a nonselective inhibitor of OCT1, CYP3A4 and P-glycoprotein and is thus involved in multiple DDI cases42,43. As an OCT1 inhibitor, VPM creates a DDI with metformin via its inhibition of OCT121. The high quality cryo-EM density for VPM, together with all-atom MD simulations of two possible binding poses, allowed us to model the VPM molecule in the central cavity of OCT1CS with good confidence (Fig. 1g and Extended Data Fig. 4c,d). VPM consists of 3,4-dimethoxyphenyl, isopropyl pentanenitrite, and 3,4-dimethoxyphenylethylmethylamino groups. Binding of the dimethoxyphenyl and isopropyl pentanenitrite groups of VPM to OCT1 is analogous to that of diphenylmethoxy group of DPH by interacting with the hydrophobic portion of the central cavity formed by the plane of four residues W217, F244, W354 and F446 (Fig 3a). Notably, the cationic tertiary amine group of VPM is proximal to E386, similar to what was observed for DPH. Superposition of apo, DPH-, and VPM-bound OCT1 structures show rearrangements of Y36 in TM1 (cysteine in hOCT1 and tyrosine in rat OCT1) upon binding of different ligands, but only minor deviation for the hydrophobic plane residues (W217, F244, W354, and F446) and E386 (Extended Data Fig. 6).
Figure 3 |. Verapamil recognition by OCT1.
a, Detailed VPM-OCT1 interactions in the binding cavity, highlighting interacting residues. b, Orthosteric and allosteric moieties of VPM (left), with shared and distinct interacting residues between VPM and DPH (right). c, Enantiospecific recognition of VPM by OCT1CS, as shown by IC50 measurements of S(–) or R(+) VPM against OCT1CS mediated 3H-MPP+ uptake activity (30 min uptake with 100 nM 3H-MPP+; n=3 biologically independent replicates shown, IC50 ± s.e.m.).
The striking similarity of binding modes between VPM and DPH, and the fact that E386A is devoid of MPP+ uptake activity despite its surface expression and proper folding, led us to hypothesize the general roles of acidic residue E386 in charge stabilization and aromatic/aliphatic residues W217, F244, W354 and F446 in hydrophobic packing of OCT1-bound cationic compounds. We term the binding site formed by these residues the orthosteric site. The 3,4-dimethoxyphenylethylmethylamino group of VPM extends toward the extracellular side of OCT1 (Fig 3a–b). The 3-methoxy group forms a hydrogen bond with S382 in TM8, and the phenyl group interacts with Y361 in TM7. This site, which we term the opportunistic site, is distinct from the orthosteric site as only larger substrates and/or inhibitors would presumably occupy it. Because the opportunistic site is proximal to the extracellular side of the transporter, binding of moieties to this site probably prevents the conversion from outward-facing open to outward-facing occluded, which may explain the inhibition of OCT1 by VPM. Similar modes of inhibition have been observed in other MFS transporters35,44,45.
In addition, it is worth noting that clinically utilized VPM is a racemic mixture, which we used for our cryo-EM sample preparation. There are many studies describing stereoselectivity-dependent target activity, pharmacokinetics, and pharmacodynamics of VPM46–48. The high quality ligand density in our cryo-EM reconstruction (Fig. 1g, Extended Data Fig. 4e) as well as the chemical environment of the orthosteric binding site supports binding of the S(–)-VPM enantiomer. In stereoselectivity experiments we found that S(–)-verapamil is ~10 times more potent than R(+)-VPM in inhibiting [3H]-MPP+ uptake in oocytes expressing our consensus construct (Fig. 3c), thus indicating that OCT1 preferably binds S(–)-VPM. Consistent with this observation, it was reported that the hepatic bioavailability of S(–)-VPM is lower than R(+)-VPM due to stereoselective first-pass metabolism47,48. It is worthwhile to note a recent study that reports stereoselective interaction of hOCT1 and hOCT2 with the β2 receptor agonist fenoterol, highlighting the importance of considering individual stereoisomers for their drug interaction at OCTs49.
Insights into polyspecific organic cation recognition by OCT
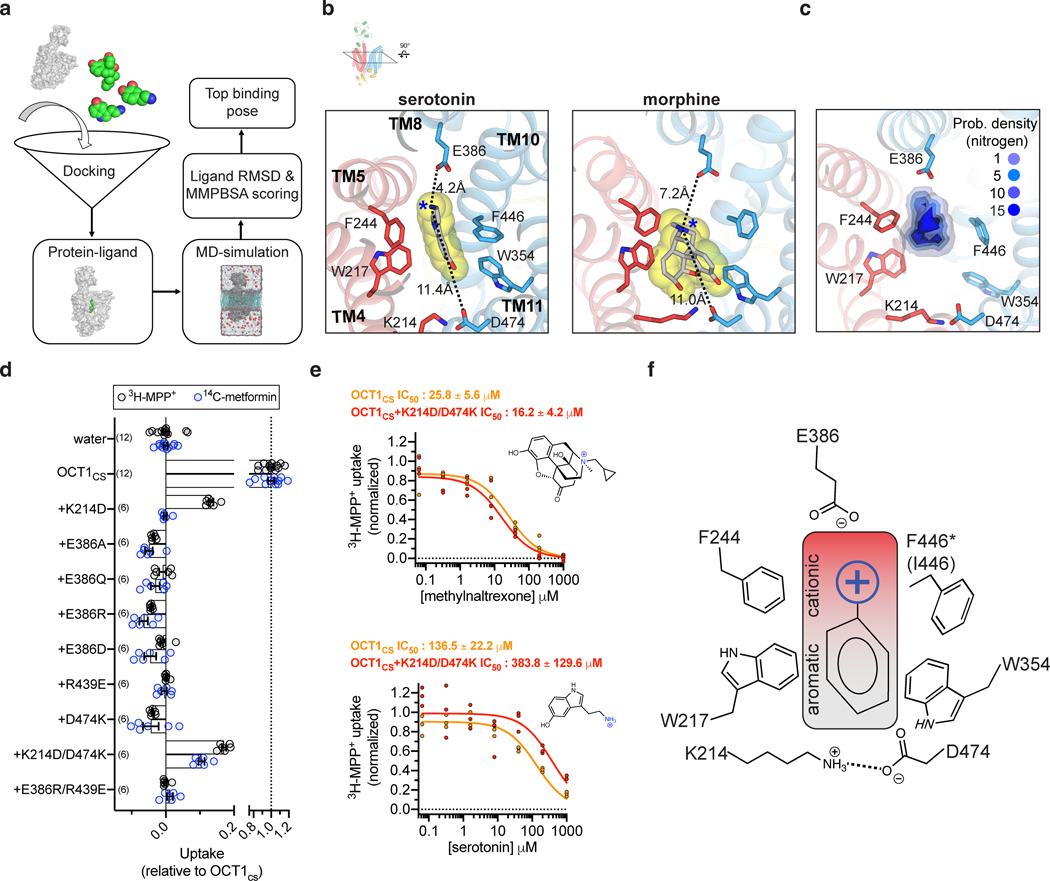
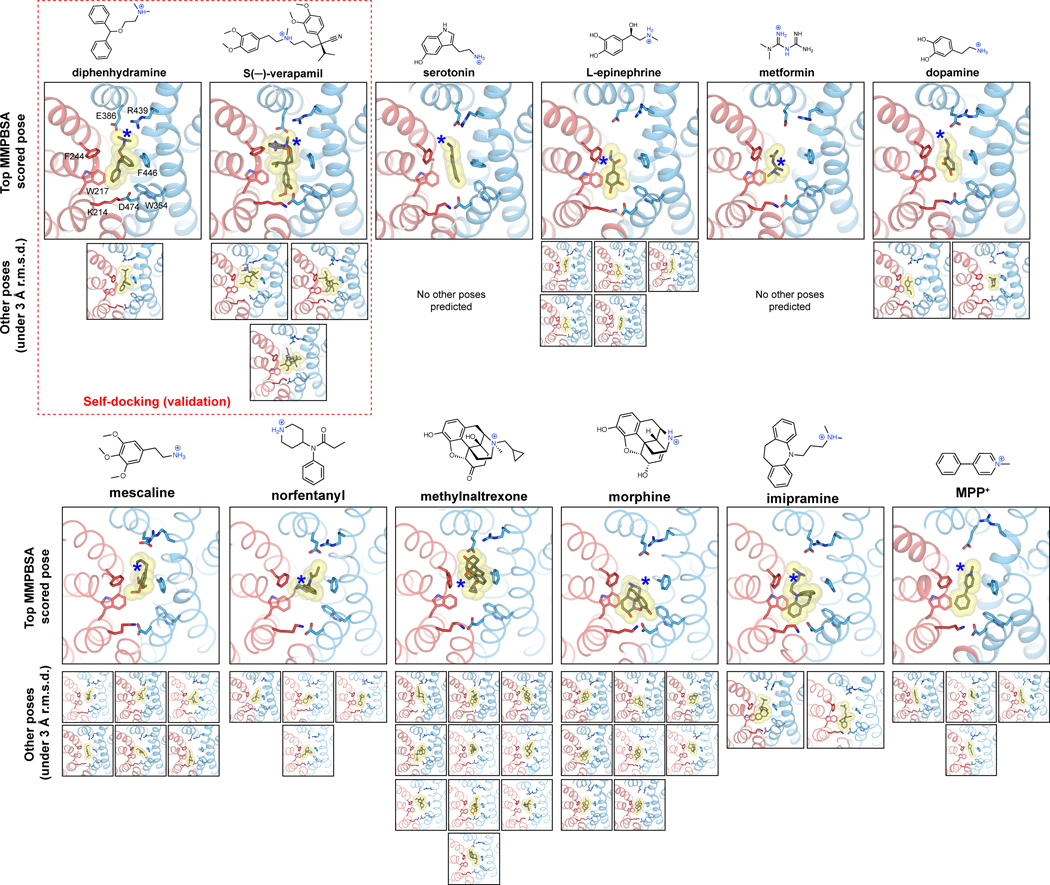
OCT1-interacting drugs are structurally diverse, but all feature the presence of one or more basic nitrogen groups connected to additional aromatic/aliphatic moieties. We sought to utilize the OCT1CS structures reported here for in silico binding mode prediction studies. To increase the prediction accuracy, our in silico binding prediction method is composed of three stages. First, ligand binding mode is predicted via docking to our holo structures. Second, stability of predicted poses are ascertained by all-atom MD simulations of the top ten predicted poses. Third, molecular mechanics with Poisson-Boltzmann electrostatic continuum solvation and surface area (MMPBSA) free energy calculations of stable binding poses (ligand root-mean-square deviation from the starting pose, termed henceforth ligand r.m.s.d. - < 3 Å) allow selection of a single top binding pose per ligand50,51(Fig. 4a). Using this strategy, we were able to predict binding poses of VPM and DPH similar to those observed in the cryo-EM structures (Extended Data Fig. 7 and Supplementary Data 1). We then predicted the binding modes of a small, diverse subset of known OCT1 ligands (Fig. 4b, Extended Data Fig. 7, Extended Data Table 1, Supplementary Data 1).
Figure 4 |. General principles of organic cation recognition by OCT1.
a, Scheme for docking-MD predictions of drug binding poses. b, Final MD frames of top scored binding poses for two representative drugs, serotonin and morphine. c, Probability density for basic-nitrogen atom positions in the ten interrogated drugs, from the final MD frame of top scored binding poses (threshold value is arbitrary) d, Uptake measurements for charged position mutants in the OCT1CS background in oocytes (either 10 μM 14C-metformin or 10 nM 3H-MPP+ uptake in 1 h; n biologically independent replicates are shown with n-value indicated in parenthesis, with mean ± s.e.m. also shown). e, Inhibition of OCT1CS or charge-swap double mutant (OCT1cs+K214D/D474K) by methylnaltrexone (top panel) or serotonin in oocytes (bottom panel; n=3 biologically independent replicates shown, IC50 ± s.e.m.). f, A general model for organic cation recognition by outward-facing OCT1.
In most cases, the top scored pose from our docking-MD-free energy calculation strategy predicts that the aromatic/aliphatic groups pack against the aromatic residues proximal to the K214-D474 charge pair (Extended Data Fig. 7, Supplementary Data 1). Universally, however, the basic nitrogen of the drug is offset toward E386 or equidistant from D474 and E386 (Fig. 4c, Extended Data Fig. 7, Supplementary Data 1). Further, in the top poses of serotonin, mescaline, methylnaltrexone, imipramine, and MPP+, the basic nitrogen atom is closer to E386 than D474 in the predicted pose. It is also worthwhile to note that the VPM-OCT1CS or DPH-OCT1CS all-atom MD simulations resulted in, on average, closer inter-atomic distance values between the cationic drug moiety and E386 compared to D474 (Extended Data Fig. 4f). During these MD simulations, D474 appeared to be more closely associated with the neighboring residue K214 (Extended Data Fig. 4f). To further probe the role of these two acidic residues, we systematically mutated both positions in the OCT1CS background and performed radiotracer uptake assays in oocytes for both [14C]-metformin and [3H]-MPP+ (Fig. 4d). Notably, E386 is intolerant to mutation, as no E386 mutant yielded measurable signals in the OCT1CS background (Fig. 4d). It is worthwhile to reiterate our finding that D474A retains some [3H]-MPP+ uptake activity while E386A is nonfunctional, with both exhibiting comparable levels of surface expression in oocytes (Fig. 2e and Extended Data Fig. 5). Consistent with this finding, previous studies have also showed that substitutions at D474 are still functional in rat OCT1 (D475 in rat)28,52. To probe the charge-pair between K214 and D474, we assessed the charge-swap double mutant (K214D/D474K) in the OCT1CS background and found that it partially rescues the loss of activity of D474K for both [14C]-metformin and [3H]-MPP+ uptake activity in oocytes (Fig. 4d). This contrasts with the E386R/R439E double mutant (~9 Å apart in the VPM structure), which could not restore the activity of E386R. Furthermore, the K214D/D474K charge-swap mutant exhibited similar IC50 values for methylnaltrexone and serotonin (representative large and small OCT1 substrates, respectively), relative to OCT1CS (Fig. 4e). These data further validate a charge pair between D474 and K214, while also suggesting there is low stringency for the precise positioning of the acidic residue at this side of the central cavity. We also tested the K214D/D474N double mutant and found that while it ablated metformin uptake activity, it retained reasonable levels of MPP+ uptake activity. This further suggests there are no strict requirements for net negative charge or acidic residue positioning at the cavity end proximal to the K214/D474 pair (Fig. 4d). Taken together, it is reasonable to suggest that D474 does not form a conserved, direct interaction with cationic substrates of OCT1 in the outward-facing state – rather, D474 appears to help maintain structural integrity of the substrate binding site during transport while fine-tuning cavity electrostatics.
Therefore, drug recognition by OCT1 in the outward-facing conformation involves the acidic residue E386 and aromatic/hydrophobic positions (217, 244, 354 and 446) (Fig. 4f), all of which provide the appropriate chemical environment capable of accommodating a wide range of cationic substrates. Like the needle of a compass, the cationic moiety of the drug orients in the OCT1 cavity toward E386 (Fig. 4f). Our model is consistent with recent studies that identify high lipophilicity and a cationic charge as the main features required for drug binding to OCT114,32, features complementary to the binding site revealed by our structures. Multiple functional studies have suggested that OCT1 contains multiple binding sites that are either overlapping or allosteric1,14. Our structural and functional studies demonstrate a core binding site of OCT1 in the outward facing state with the ability to accommodate extra moieties within an opportunistic site outside the orthosteric site.
MPP+-bound OCT2 adopts the outward-facing occluded state
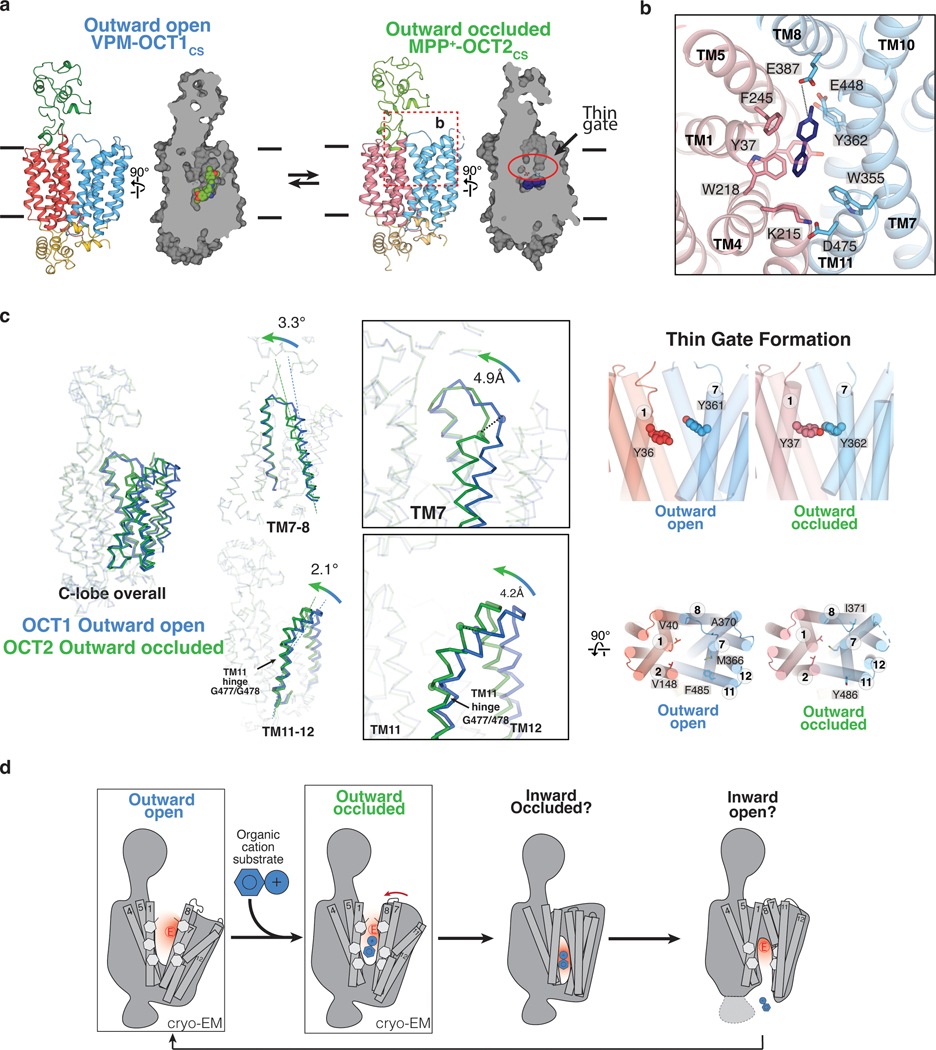
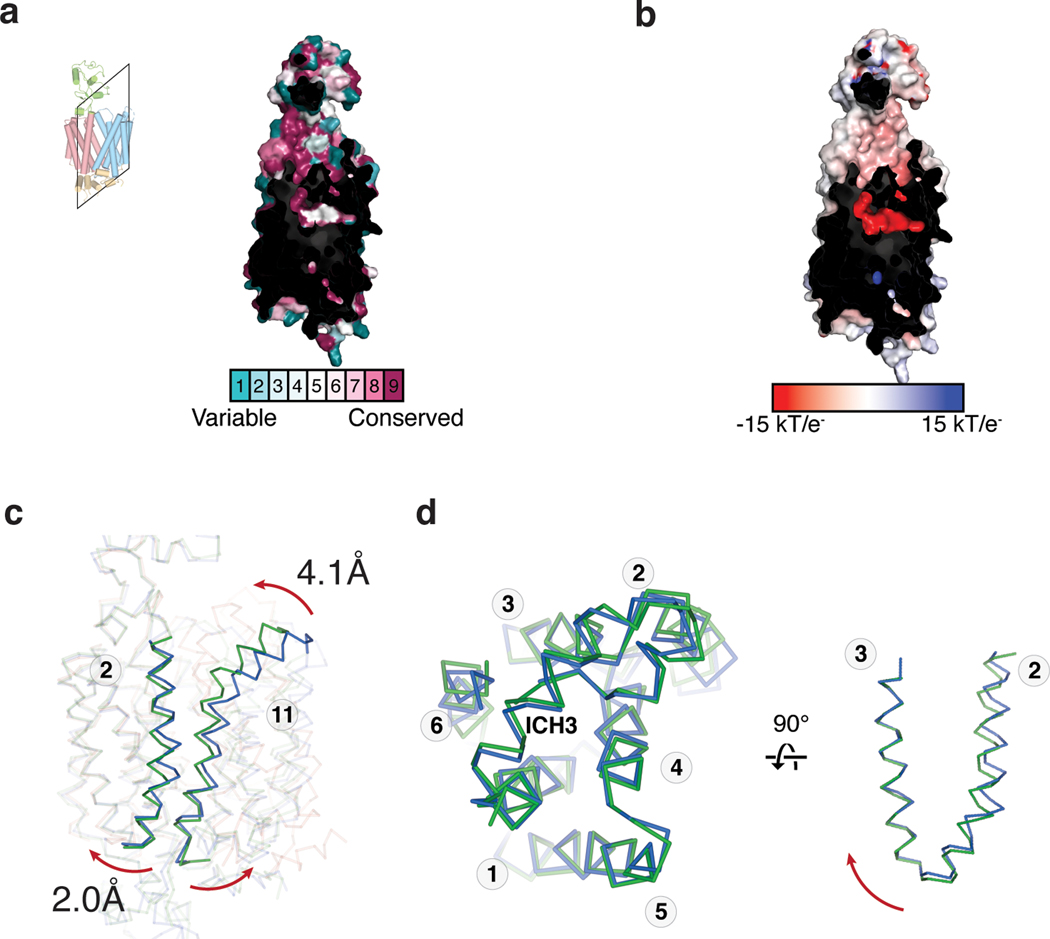
Unlike DPH and VPM, which inhibit transport, MPP+ is a well-established substrate of all OCT subtypes (Fig. 1a,f)1,39. Notably, compared to the outward-facing open OCT1CS structures the MPP+-OCT2CS structure is more compact, adopting an outward-facing occluded conformation, (Fig. 5a). The high conservation is apparent in the central cavity between the two subtypes (Fig. 5b and Supplementary Fig. 1). MPP+ occupies space within the OCT2CS central cavity that is analogous to the OCT1 orthosteric site. The clear cryo-EM density and limited number of possible ligand poses allowed us to model MPP+ confidently (Fig. 1g). While the 4-phenyl group packs against OCT2 residues W218, F245, W355, and F447 (analogous to positions 217, 244, 354, and 446 in hOCT1), the cationic 1-methylpyridinium group points toward E387 (E386 in hOCT1), with the charged nitrogen ~4.8 Å from this acidic residue (Fig. 5a,b). OCT2 features an additional cavity lining acidic residue compared to OCT1, E448 (Q447 in hOCT1), which is also ~5 Å from the charged nitrogen of MPP+ (Fig. 5b). Interestingly, the MPP+ binding pose observed here is consistent with what is predicted by in silico docking with OCT1 (Extended Data Fig. 7 and Supplementary Data 1). MFS transporters form a thin gate upon the transition from outward-open to outward-occluded states, a transition that precedes the isomerization to inward facing states via extracellular thick gate formation35. Extracellular egress of MPP+ is blocked by Y37 (TM1) and Y362 (TM7; Fig. 5 a,b,c) – therefore these residues define the thin gate in the outward-occluded state of MPP+-OCT2CS. Consistent with this observation, thin gate formation would be obstructed in the VPM and DPH bound outward-open states of OCT1CS, due to inhibitor interactions with Y36 and Y361 (Fig. 2a, 3a, 5c and Extended Data Fig. 6).
Fig. 5 |. Extracellular gate closure in OCTs.
a, Overview of the two distinct OCT conformations: outward open (VPM-OCT1CS) and outward occluded (MPP+-OCT2CS) b, Ligand binding pose for MPP+-OCT2CS, showing MPP+ (navy blue), and interacting residues of OCT2. N- and C- domains are colored pink and light blue, respectively. c, Structural comparisons among the two observed conformations. Overall C-domain changes, as well as TM7–8 and TM11–12 conformational changes, shown at left and center. Conformational changes that result in the formation of the thin gate shown at right. d, Proposed alternate access transport mechanism for OCTs based on the structural observations presented in this study.
Insights into the OCT alternating access mechanism
Our structures of outward-open OCT1CS and outward-occluded OCT2CS allow us to gain initial insights into the alternating access mechanism exhibited by OCTs. The conformational changes from the outward-open to the outward-occluded states may involve many local fold changes of both lobes. Specifically, TM7 in the OCT2CS outward-occluded state is rotated relative to the OCT1CS outward-open state, forming the extracellular thin gate in OCT2CS (Fig. 5c). TM11 appears to form a ‘latch’ that clamps over TM7, with helical differences located about a hinge point located at OCT1 G447 (G448 in OCT2) (Fig. 5c). A previous voltage-clamp fluorometry study implicated TM11 movements with MPP+ binding to rat OCT129.
In addition to the apparent conformational differences at TM7, TM8, and TM11, TM2 is substantially different in the outward-open OCT1CS and outward-occluded OCT2CS structures. As TM2 packs against TM11, it appears the slightly rotated and offset TM2 position in outward-occluded OCT2CS is correlated to the different TM11 conformation (Extended Data Fig. 8c). The interactions between the TM2–3 turn, TM4, TM11, ICH2, and ICH3 in the outward facing structures stabilize the outward conformation (Extended Data Fig. 8d).
Discussion
Altogether, our cryo-EM structures, in silico drug docking-MD-free energy calculations, and functional experiments shed considerable insight into important features of both ligand recognition and the transport mechanism exhibited by OCTs. First, we discovered a shared motif of ligand recognition among the chemically diverse substrates of OCT1, in the context of the OCT1 outward-facing conformation. Considering the high tissue expression of OCT1 in the liver, this transporter conformation is relevant to first-pass metabolism of xenobiotics - where outward-facing OCT1 is poised to accept cationic drugs from the sinusoid. We suggest that OCT2 probably has similar cation recognition mode as OCT1 because (1) the mode of MPP+ binding to OCT2CS is similar to what we observe in DPH and VPM bound OCT1CS and (2) OCT2 has an additional acidic residue (E448) near E387 (E386 in OCT1), thus increasing electronegative surface potential at this side of the transporter central cavity. Second, with our OCT1CS and OCT2CS structures we can infer rearrangements associated with outward thin gate formation for OCTs.
Our engineered OCT1CS and OCT2CS enabled the technical feasibility of the structural and functional studies presented here. The use of engineered constructs is not without its drawbacks – for example, OCT1CS and OCT2CS both bear two nonhuman substitutions in the substrate binding cavity (C36Y and I446F in OCT1CS, Y245F and Y447F in OCT2CS). To mitigate these drawbacks, we functionally interrogated the engineered constructs in uptake assays (Fig. 1a–f) and found that, aside from differences in gross surface expression and raw uptake levels (Extended Data Fig. 1c–e, Extended Data Fig. 5), they exhibit similar functional features of ligand recognition compared the WT carriers. We would anticipate modest functional differences to be apparent for a particular organic cationic substrate in the consensus variants versus the WT transporters, such as those seen among naturally occurring orthologs, owing to the sequence differences24. Furthermore, because C36 is probably involved in the thin gate formation in hOCT1, we expect a modest difference in gating dynamics between OCT1CS and hOCT1. Notwithstanding this currently unavoidable technical limitation, we believe our studies provide a glimpse into general and important principles of drug interaction at OCT1 and OCT2, and the conformational changes associated with extracellular gate closure.
The cryo-EM structures of outward-open WT hOCT3 in complex with decydium-22 (D22) and corticosterone were published during the review of this manuscript53. In agreement with our proposed model of organic cation recognition by OCT1 and OCT2, the hallmark cationic OCT inhibitor decydium-22 occupies the transporter central cavity with the orthosteric cationic quinoline group offset toward E390 (E386 in hOCT1, E387 in hOCT2) and E451 (Q447 in hOCT1, E448 in hOCT2).
Strategies for predicting the potential of new molecular entities for unwanted DDI are a critical aspect of therapeutic development33. The data presented here, including the in silico drug binding workflow utilized, could greatly accelerate drug development efforts. In total, our work sets the stage for structure-informed prediction of drug interactions with these two pharmacologically important polyspecific transporters at the preclinical stage.
Methods
Consensus mutagenesis design
Consensus constructs were designed in a similar manner to what has been previously reported in 34, with the following modifications. First, PSI-BLAST using WT hOCT1 or WT hOCT2 as the input (UniProt ID O15245 for hOCT1; UniProt ID O15244 for hOCT2) was performed to identify 250 OCT1 or OCT2 sequence hits from the UniProt database (nr90 – 90% similarity cutoff to reduce redundancy)56. To focus the sequence list to specific subtypes only, the sequence outputs were manually curated to select the top hits scored by sequence percentage identity to either subtype, that were also annotated in the database as the particular subtype of interest. The remaining 58 sequences for OCT1 or 121 sequences for OCT2 were subjected to sequence alignment in MAFFT57. The consensus sequence was then extracted in JalView58, and aligned to the WT sequence in MAFFT. Sequence elements present in the WT sequence but not the consensus sequence (gaps in alignment present in loops and areas of low conservation) were then removed and replaced with WT sequence elements. The final constructs feature sequence registers consistent with WT.
Oocyte radiotracer uptake assays
14C-metformin (115 Ci/mmol) was purchased from Moravek, and 3H-MPP+ (80 Ci/mmol) was purchased from American Radiolabeled Chemicals. Uptake assays were performed similarly to a previous report59. Injections of 30 ng complementary RMA (cRNA) were performed, with 2–4 day expression at 17°C. Specific radioactivities of 0.06 and 5 Ci/mmol were used for 3H-MPP+ and 14C-metformin for Kt measurements shown in Fig. 1a and Fig. 1d, respectively. Full specific radioactivities were used for mutant uptake assessments in Fig. 1f, 2c,e and 4d. For IC50 experiments, specific radioactivities of 80 Ci/mmol were used for all constructs, except for OCT1CS for which a specific radioactivity of 8 Ci/mmol was used. Water-injected oocytes were used for background correction.
HEK293T radiotracer uptake assays
HEK293T cells were purchased from American Type Culture Collection and cultured in Dulbecco’s modified Eagle medium (Gibco) supplemented with 10% (v/v) fetal bovine serum (Gibco) and Anti-Anti (Gibco). The full-length consensus OCT1 sequence was codon-optimized for Homo sapiens and cloned into the BacMam vector60, and mutants were introduced in this background with site-directed mutagenesis. Cells were transfected with respective constructs using polyethyleneimine (PEI 25K, Polysciences) at 50–70% confluency. Two days after transfection, the cells were detached, and washed twice in KRH uptake assay buffer (25 mM HEPES pH 7.4, 125 mM NaCl, 4.8 mM KCl, 5.6 mM glucose, 1.2 mM CaCl2, 1.2 mM KH2PO4 and 1.2 mM MgSO4). Accumulation of 10 nM 3H-MPP+ (80 Ci/mmol) into the transfected cells was measured at room temperature. Uptake was terminated by transferring cells to a glass fiber filter (Whatman WF-B) mounted on filter holder. The filter was subsequently rinsed with 10 mL KRH buffer and subjected to liquid scintillation counting.
Oocyte Fluorescence Microscopy
The method for fluorescence microscopy of oocytes was adopted from Löbel et al.61 with minor modifications. Oocytes were injected with either water or 30 ng of cRNA with protein expression occurring over 2 days at 17°C. Oocytes were collected, washed twice with phosphate-buffer saline (PBS), then stained with 0.05 mg ml−1 CF633-conjugated wheat germ agglutinin (Biotium) in PBS for 5 min at room temperature. Oocytes were then washed with PBS. CF633 and eGFP fluorescence were measured using a Leica SP8 upright confocal microscope equipped with a 10× objective lens, using He-Ne (633 nm) and argon (488 nm) lasers, for CF633 and eGFP, respectively.
OCT1/2 Protein expression and purification
Full-length consensus OCT1 and OCT2 sequences were codon-optimized for Homo sapiens and cloned into the BacMam vector60, in-frame with a PreScission cleavage site, followed by eGFP, FLAG-tag and 10× His-tag at the C-terminus. Baculovirus was generated according to manufacturer’s protocol and amplified to P3. For protein expression, HEK293S GnTI− cells (American Type Culture Collection) was cultured in Freestyle 293 medium (Life Technologies) supplemented with 2% (v/v) fetal bovine serum (Gibco) and 0.5% (v/v) PenStrep (Gibco). Cells were infected with 10% (v/v) P3 baculovirus at 2.5–3×10⁶ ml−1 density. After 20 hours shaking incubation at 37°C in the presence of 8% CO2, 10 mM sodium butyrate (Sigma-Aldrich) was added to the cell culture and the incubation temperature was lowered to 30°C to boost protein expression. After 44–48 hours, the cells were collected by centrifugation at 550 × g, and was subsequently resuspended with lysis buffer (20 mM Tris pH 8, 150 mM NaCl, 10 μg mL−1 leupeptin, 10 μg mL−1 pepstatin, 1 μg mL−1 aprotinin and 1 mM phenylmethylsulphonyl fluoride (PMSF, Sigma). The cells were lysed by probe sonication (45 pulses, 3 cycles). The membranes were subsequently solubilized by addition of 40 mM DDM (n-Dodecyl-β-D-Maltopyranoside, Anatrace) and 4 mM CHS (Cholesteryl Hemisuccinate, Anatrace), followed by gentle agitation at 4°C for 1 hour. The solubilized lysate was cleared by centrifugation at 16,000 × g for 30 min to remove insoluble material. The supernatant was subsequently incubated with anti-FLAG M2 resin (Sigma-Aldrich) at 4°C for 1 hour. The resin was then packed onto a gravity-flow column and washed with 10 column volumes of high-salt wash buffer (20 mM Tris pH 8, 300 mM NaCl, 5 mM ATP, 10 mM MgSO4, 0.07% digitonin), followed by 10 column volumes of wash buffer (20 mM Tris pH 8, 150 mM NaCl, 0.07% digitonin). Protein was then eluted with 5 column volumes of elution buffer (20 mM Tris pH 8, 150 mM NaCl, 0.07% digitonin, 100 μg mL−1 FLAG peptide). The eluted protein was concentrated with a 100 kDa-cutoff spin concentrator (Millipore), after which 1:10 (w/w) PreScission protease was added to the eluted protein and incubated at 4°C for 1 h to cleave C-terminal tags. The mixture was further purified by injecting onto a Superdex 200 Increase (Cytiva) size-exclusion column equilibrated with GF buffer (20 mM Tris pH 8, 150 mM NaCl, 0.07% digitonin). The peak fractions were pooled and concentrated for cryo-EM sample preparation.
Cryo-EM sample preparation
The peak fractions from final size exclusion chromatography were concentrated to 4–8 mg ml−1. For apo-OCT1CS sample, a final concentration of 2% DMSO was added. For VPM-OCT1CS, 1 mM racemic VPM (Sigma) was added to the sample approximately 30 min before vitrification. For DPH-OCT1CS sample, 1mM DPH (Sigma) was added to the protein sample ~30 min before vitrification. For MPP+-OCT2CS sample, 1 mM MPP+ iodide (Sigma) was added to the protein sample ~45 min before vitrification. All liganded samples maintain a 2% (v/v) DMSO concentration. Using Leica EM GP2 Plunge Freezer operated at 4°C and 95% humidity, 3 μL sample was applied to a freshly glow-discharged UltrAuFoil R1.2/1.3 300 mesh grids (Quantifoil), blotted with Whatman No. 1 filter paper for 1–1.5 s, then plunge-frozen in liquid-ethane cooled by liquid nitrogen.
Cryo-EM data collection
Apo-OCT1CS, DPH-OCT1CS and MPP+-OCT2CS datasets were collected using a Titan Krios (Thermo Fisher) transmission electron microscope operating at 300 kV equipped with a K3 (Gatan) detector in counting mode behind a BioQuantum GIF energy filter with slit width of 20 eV, using Latitude S (Gatan) single particle data acquisition program. For Apo-OCT1CS , DPH-OCT1CS, movies were collected at a nominal magnification of 81,000× with a pixel size of 1.08 Å per pixel at specimen level. Each movie contains 60 frames over 3.7 s exposure time, using a nominal dose rate of 20 e− per pixel per second, resulting a total accumulated dose of ~60e−/Å2. For MPP+-OCT2CS, movies were collected at a nominal magnification of 81,000× with a pixel size of 1.08 Å per pixel at specimen level. Each movie contains 40 frames over 2.4 s exposure time, using a nominal dose rate of 30 e−/px/ּּּּּs, resulting a total accumulated dose of ~60e−/Å2. The nominal defocus range was set from −0.8 to –1.8 μm.
VPM-OCT1CS dataset was collected using a Talos Arctica (Thermo Fisher) operating at 200 kV equipped with a K3 (Gatan) detector operated in counting mode, using SerialEM62 automated data acquisition program with modifications to achieve high speed63. Movies were collected at a nominal magnification of 45,000× with a pixel size of 0.88 Å per pixel at specimen level. Each movie contains 60 frames over 2.7 s exposure time, using a dose rate of 14 e− per pixel per second, resulting in a total accumulated dose of ~40 e−/Å2. The nominal defocus range was set from −0.6 to −1.2 μm.
Cryo-EM data processing
Apo-OCT1CS
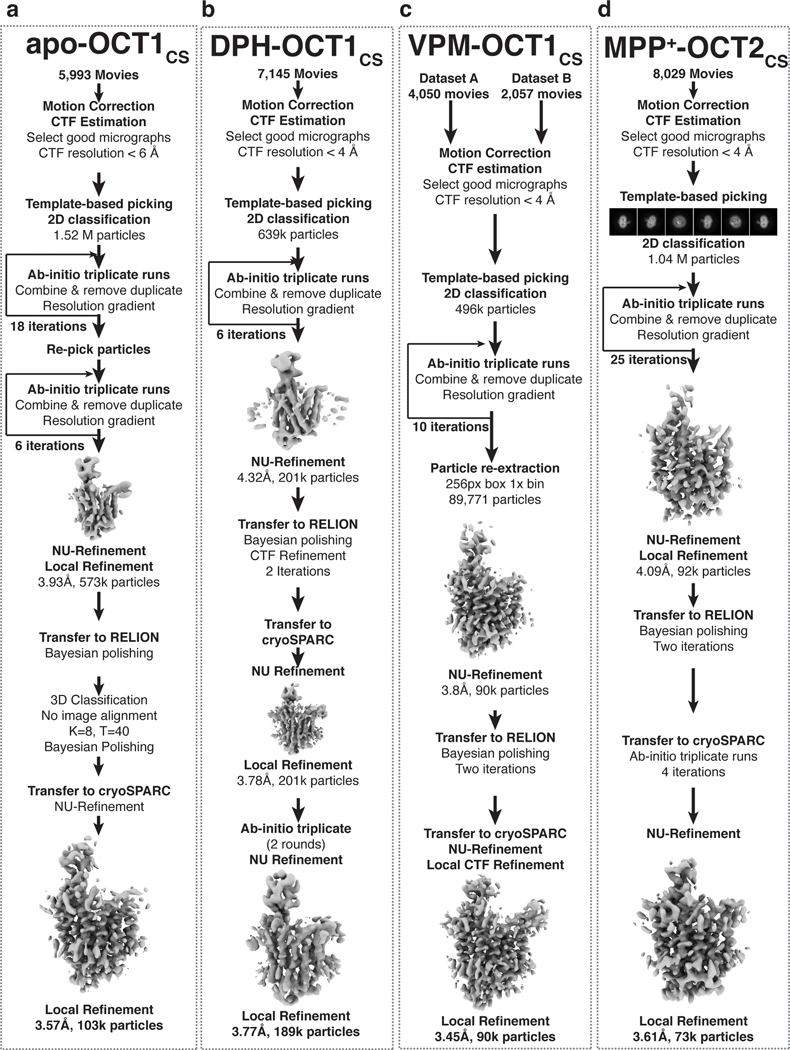
Beam-induced motion correction and dose-weighing for a total of 5,993 movies were performed using MotionCor264. Contrast transfer function parameters were estimated using Gctf65 or CTFFIND466. Micrographs showing less than 6 Å estimated CTF (contrast transfer function) resolution were discarded, leaving 5,304 micrographs. A subset of 100 micrographs were used for blob picking in cryoSPRAC67,68, followed by 2D classification to generate templates for template-based particle picking. A total of 5.51 million particles were picked, followed by particle extraction with a 64-pixel box size at 4× binning (4.32 Å/pixel). A reference-free 2D classification was performed to remove obvious junk classes, resulting in a particle set of 1.52 million particles. Followed by 2D clean-up, an iterative ab initio triplicate procedure was performed in cryoSPARC, as described previously59. Specifically, three parallel ab initio reconstructions jobs were performed using identical settings (two-class, initial minibatch size 150, final minibatch size 600, class similarity 0, default settings were used unless otherwise noted). After the three parallel jobs conclude, particles from the class showing better protein features were selected from each job and combined, duplicates removed, then subjected to the next round of ab initio reconstruction triplicates with iteratively higher resolution limits. The same process was repeated multiple times until a reasonable reconstruction, showing acceptable protein features, was obtained. After one initial iteration in triplicate (initial resolution 20 Å, final resolution 10 Å), the remaining 1.34 million particles were re-extracted, re-centered using a 200 pixel box size, 2× binning (2.16 Å/pixel), resulting in a 100 pixel particle box size. The same iterative triplicate ab initio reconstruction procedure was performed for 11 iterations, with incrementally increasing initial/final resolutions (from 12 Å initial/8 Å final to 6 Å initial/4.5 Å final). The 11-iteration run was chosen because subsequent 12th and 13th iterations failed to improve map quality. A total of 458,246 particles were subsequently re-extracted and re-centered without binning with a 200 pixel box size (1.08 Å/pixel), followed by seven rounds of ab initio reconstruction triplicates, resulting in 243,986 particles. A 3D volume (from earlier an ab initio) showing clear protein features was used as a projection template for a second round of particle picking. A 1.69 million particle set was picked using template-based picking in cryoSPARC, and a similar 2D-classification followed by iterative ab initio reconstruction triplicates as described before were performed, except that only six iterations were performed this time, as the particle set were considerably more homogenous. The resulting 415,943 particles were combined with the initial clean stack (243,986 particles), with duplicates removed for a total of 573,089 distinct particles. These particles were subjected to nonuniform (NU) refinement and local refinement, resulting in a 3.93 Å resolution reconstruction. To further improve map quality and resolution, the particle set was transferred to RELION 3.169 and subjected to Bayesian polishing, followed by 3D classification without image alignment (K=8, T=40). One good class, containing 102,607 particles and exhibiting the best OCT1 features was selected and subjected to 3D refinement and Bayesian polishing. Polished particles were then imported to cryoSPARC and subjected to NU-refinement followed by local refinement, resulting in a 3.57 Å final reconstruction. Local resolution was estimated using cryoSPARC.
DPH-OCT1CS
DPH-OCT1CS dataset was processed similarly to that for Apo-OCT1CS with minor modifications. Beam-induced motion correction and dose-weighing for a total of 7,145 movies were performed using MotionCor264. Contrast transfer function parameters were estimated using Gctf 65or CTFFIND466. Micrographs showing less than 4 Å estimated CTF resolution were discarded, leaving 2,233 micrographs. Template picking was performed in cryoSPRAC67,68, using templates generated from a 3D volume obtained from earlier processing attempts. A total of 693,720 particles were picked, followed by particle extraction with a 64-pixel box size at 4× binning (4.32 Å/pixel). A reference-free 2D classification was performed to remove obvious junk classes, resulting in a particle set of 638,957 particles. Followed by 2D clean-up, then iterative ab initio reconstruction triplicate runs were performed as described in the previous section. After six iterations with a progressively increasing resolution range, a 201,100 particle set was obtained, producing a 4.32 Å resolution reconstruction from NU-refinement. The particle set was subsequently imported to RELION69, and subjected to Bayesian polishing, followed by CTF refinement (beam tilt refinement only), followed by another Bayesian polishing job. The polished particles were transferred to cryoSPARC and subjected to two iterations of ab initio triplicates. The resulting 189,183 particles were subjected to NU-refinement and local refinement, producing the final map at 3.77 Å. Local resolution was estimated using cryoSPARC.
VPM-OCT1CS
VPM-OCT1CS dataset was processed similarly to that for Apo-OCT1CS and DPH-OCT1CS with minor modifications. Two datasets from two distinct grids, containing 4,050 and 2,057 movies, were subjected to beam-induced motion correction and dose-weighing in MotionCor264. Contrast transfer function parameters were estimated using CTFFIND466. Micrographs showing less than 4.0 Å estimated CTF resolution were discarded, leaving 3,249 micrographs. Template picking was performed in cryoSPARC67,68, followed by particle extraction with a 64-pixel box size (4x binning, 3.52 Å/pixel) and 2D classification. A total of 495,998 particles corresponding to good 2D classes were selected, followed by particle extraction with a slightly larger box size (80-pixel box size at 4× binning; 3.52 Å/pixel). Following 2D clean-up and particle re-extraction, then iterative ab initio reconstruction triplicate runs were performed as described in the previous section. A total of 10 iterations were performed, followed by particle re-extraction with a 256-pixel box size (1x binning, 0.88 Å/pixel) and NU-refinement, producing 3.8 Å resolution reconstruction containing 89,771 particles. The stack was then transferred to RELION69 for two consecutive Bayesian polishing runs that helped boost resolution. The stack was then transferred back to cryoSPARC for final runs of NU refinement and local refinement, resulting in a 3.45 Å map. Local resolution was estimated using cryoSPARC.
MPP+-OCT2CS
MPP+-OCT2CS dataset was processed similarly to that for Apo-OCT1CS with minor modifications. Beam-induced motion correction and dose-weighing for a total of 8,029 movies were performed using MotionCor264. Contrast transfer function parameters were estimated using Gctf 65or CTFFIND466. Micrographs showing less than 4 Å estimated CTF resolution were discarded, leaving 3,366 micrographs. Template-based picking was performed in cryoSPRAC67,68, using templates projected from a 3D volume obtained from earlier processing attempts on this dataset. A total of 1,141,906 particles were picked, followed by particle extraction with a 64-pixel box size at 4× binning (4.32 Å/pixel). A reference-free 2D classification was performed to remove obvious junk classes, resulting in a particle set of 1,044,268 particles. Following 2D clean-up, iterative ab initio reconstruction triplicate runs were performed as described in the previous section. After 25 iterations with a progressively increasing resolution range, a 92,217-particle set was obtained, producing a 4.09 Å resolution reconstruction from Local Refinement. The particle set was subsequently imported to RELION69, and subjected to two successive iterations of Bayesian polishing. The polished particles were transferred to cryoSPARC and subjected to four more iterations of ab initio triplicates. The resulting 73,474 particles were subjected to NU-refinement and local refinement, producing the final map at 3.61 Å resolution. Local resolution was estimated using cryoSPARC.
Model Building and Refinement
All manual model building was performed in Coot70 with ideal geometry restraints. A de novo initial model was built to a 3D reconstruction of VPM-OCT1CS cryo-EM map, followed by further manual model building and adjustment. Idealized CIF restraints for ligands were generated in eLBOW (in PHENIX software suite71) from isomeric SMILES strings. Further manual adjustments were performed on both protein and ligands after placement, to ensure correct stereochemistry and good geometries. The manually refined coordinates were subjected to phenix-real.space.refine in PHENIX with global minimization, local grid search and secondary structure restraints. MolProbity72 was used to help identify errors and problematic regions. The refined VPM-OCT1CS cryo-EM structure was then rigid-body fit into the apo-OCT1CS, DPH-OCT1CS maps, followed by manual coordinate adjustments and ligand placement and adjustments for DPH-OCT1CS, followed by phenix-real.space.refine in PHENIX. Moreover, the VPM-OCT1CS was rigid-body fit into MPP+-OCT2CS with proper adjustments to the sequence, followed by manual adjustments, ligand placement, followed by phenix-real.space.refine in PHENIX. The Fourier shell correlation (FSC) of the half- and full-maps against the model, calculated in Phenix, was in good agreement for all four structures, indicating that the models did not suffer from over-refinement (Extended Data Figure 3). Structural analysis and illustrations were performed using Open Source PyMOL, UCSF Chimera73 and UCSF Chimera X74. Local map resolution ranges reported in Table 1 were calculated using local resolution estimation in cryoSPARC67 and the ‘Values at atom positions’ tool in UCSF Chimera73.
Molecular Dynamics Simulations and docking
All-atom molecular dynamics (MD) simulations in explicit solvents and POPC (1-palmitoyl-2-oleoylphosphatidylcholine) bilayer membranes were performed using the cryo-EM structures of OCT1CS in two holo states containing DPH (two different conformations) and VPM (two possible poses). The systems were assembled using the CHARMM-GUI web server75–77. Each system was solvated in TIP3P (transferable intermolecular potential with 3 points) water and neutralized with Na+ and Cl- ions at 0.15 M78. Five independent replicates were simulated for each system. Non-bonded van der Waals interactions were truncated between 10 Å and 12 Å using a force-based switching method79. The long-range electrostatic interactions were calculated using the particle-mesh Ewald summation80. The systems were equilibrated following the CHARMM-GUI Membrane Builder protocol76,77. The production runs were performed in the NPT (constant particle number, pressure, and temperature) for 500 ns at 303.15 K and 1 bar with hydrogen mass repartitioning81,82 using the CHARMM36m force field (protein and lipid) and CGenFF (DPH and VPM)83,84. All simulations were performed with the OpenMM package85.
Ligand binding stability was evaluated using ligand r.m.s.d. by superimposing the transmembrane coordinates of the protein structure throughout MD trajectory and calculating ligand r.m.s.d. using CHARMM86. Probability density maps of the amine nitrogen atom were calculated using Chimera73.
A docking/MD simulation workflow to determine the ligand binding pose of ten ligands in the binding pocket of hOCT1 was performed following the CHARMM-GUI High-Throughput Simulator protocol (Figure 4a)50,51. Two structures were used, OCT1CS-DPH and OCT1CS-VPM. Rigid docking was conducted using AutoDock Vina87. The center-of-mass coordinate of the bound ligand (DPH and VPM) were used to determine the docking search space. Ligand docking was performed on a cubic box search space with 22.5 Å edges. For each ligand, top ten binding poses based on docking scores were collected for subsequent high-throughput MD simulations and rescoring using MD ligand r.m.s.d. & molecular mechanics with the Poisson-Boltzmann electrostatic continuum solvation and surface area (MMPBSA)88. MD simulation systems were built similarly to the protocol described above. The production runs were performed for 50 ns for each protein-ligand complex structure. Ligand r.m.s.d. was used to determine the ligand binding stability of each binding pose. Only binding poses with < 3 Å average ligand r.m.s.d. were selected as good binding modes. Subsequently, molecular mechanics with MMPBSA calculations were performed on 51 protein-ligand structures to determine the best binding pose for each ligand. MMPBSA calculations were done following the protocol previously described 51.
Extended Data
Extended Data Fig. 1. Consensus mutagenesis, protein biochemistry, and cryo-EM analysis of OCT1CS.
a, FSEC traces showing strong monodisperse peaks for OCT1CS-GFP and OCT2CS-GFP, while WT hOCT1-GFP and WT hOCT2-GFP transfected HEK293T cells did not yield any discernable peak corresponding to target protein. Asterisk indicates target protein peak in FSEC. b, Map of all residues in OCT1CS and OCT2CS that deviate from WT hOCT1. The residues are colored based on their conservation score from MAFFT alignment. Blue spheres indicate mildly changed, while red spheres indicate drastic changes. c, Time-dependent accumulation of 10 nM [3H]-MPP+ in WT hOCT1 and OCT1CS expressing oocytes (n=3 biologically independent replicates per timepoint). d, Raw uptake values for controls in the OCT1 [14C]-metformin uptake experiments, corresponding to Fig. 1e (n=3 biologically independent replicates, shown with mean ± s.e.m.). e, Raw uptake values for controls in the OCT2 [3H]-MPP+ uptake experiments, corresponding to Fig. 1f (n=3 biologically independent replicates, shown with mean ± s.e.m.). f, [3H]-MPP+ uptake in oocytes expressing Y36C, F446I, and Y36C/F446I in the OCT1CS-GFP background (n=3 biologically independent replicates, individual values and mean ± S.E.M; water injected controls used for background correction, OCT1CS uptake signal used for normalization). g, FSEC traces showing expression of selected OCT1CS mutants in HEK293T cells. Asterisk indicates target protein peak in FSEC. h, Representative size-exclusion chromatography trace (left) and SDS-PAGE (right) of purified OCT1CS or OCT2CS samples used for cryo-EM grid preparation. The experiments were repeated independently for >10 times with similar results. Asterisks indicate target protein peak (in SEC) and band (in SDS-PAGE). i, Representative micrograph of a OCT1CS sample. OCT2 CS behaves similarly on cryo-EM grids. j, Representative 2D classes from a OCT1CS dataset. k, Secondary structure topology of OCT1 and OCT2.
Extended Data Fig. 2. Cryo-EM data processing workflow.
a-d, cryo-EM data processing workflow for apo-OCT1CS, DPH-OCT1CS, VPM-OCT1CS, and MPP+-OCT2CS datasets, respectively.
Extended Data Fig. 3. Cryo-EM data validation.
a, Final cryo-EM reconstructions. b, Fourier-shell correlation for the final reconstruction, generated from cryoSPARC. c, projection orientation distribution map for the final reconstruction, generated from cryoSPARC. d, Map-to-model correlation plots. e, Local Resolution plots. f, cryo-EM maps for secondary structure segments. From left to right are cryo-EM data validations for apo-OCT1CS, DPH-OCT1CS, VPM-OCT1CS, and MPP+-OCT2CS datasets, respectively.
Extended Data Fig. 4. Validation of ligand binding poses with molecular dynamics simulations.
a, Three possible poses for DPH molecule placement based on the cryo-EM reconstruction. b, Final MD frame for 5 replicas of DPH-OCT1CS MD simulations (500ns) for the three proposed poses, where possibility #1 is more stably bound at the site. c, Two possible poses for S(–)-VPM based on the cryo-EM reconstruction. d, Final MD frame for 5 replicas of VPM-OCT1CS MD simulations (500ns), for the two proposed poses, where possibility #2 is more stable (r.m.s.d. – root mean square deviation from starting pose). e, Zoom-in view of the cryo-EM map and model of the VPM chiral center. f, Inter-atomic distances between the ionizable nitrogen of VPM or DPH and acidic residues (D474 or E386) during the MD-simulations of drug-bound OCT1CS (scatter plot showing individual values extracted per MD frame, compiled from all 5 replicas per condition, with the black line representing the mean).
Extended Data Fig. 5. Surface expression of hOCT1-WT, OCT1CS and mutants.
Representative confocal microscopy images showing surface expression of OCT1CS and relevant mutants in Xenopus laevis oocytes used for radiotracer uptake studies. Scale bars represent 200 mm. Similar results were observed in 6–8 additional biological replicates per condition.
Extended Data Fig. 6. Ligand-induced local conformational changes in OCT1CS.
a, Structural overlay of apo-OCT1CS (marine), VPM-OCT1CS (green) and DPH-OCT1CS (yellow), showing that no large conformational changes are present among the three structures. While other residues remain relatively stable, Y36 exhibits considerable rotamer movement among the three structures.
Extended Data Fig. 7. In silico ligand docking.
In-silico docking and short-time scale (50ns) MD simulations for serotonin, epinephrine, metformin, dopamine, mescaline, norfentanyl, methylnaltrexone, morphine, imipramine and MPP+, respectively. For each ligand, Top MMPBSA scored poses are shown in the large panels, with other candidate poses (under 3 Å ligand r.m.s.d. at the conclusion of the simulation) shown below. Self-docking runs of DPH and VPM shown at top left for validation. PDBs corresponding to all poses shown here are available as Source Data.
Extended Data Fig. 8. Local conformational changes associated with OCT gating.
a, ConSurf plot for OCT2cs and OCT2 homologs. b, Electrostatics surface of outward occluded OCT2, calculated by APBS. c, Concerted local conformational changes in TM2 and 11 leads to extracellular gate formation. d, Local conformational changes in the N-lobe from outward open (blue) to outward occluded (green) conformations.
Extended Data Table 1 |.
MMPBSA scores for top in silico docking posesMMBPSA scores (kcal/mol) are shown as mean ± s.d.
| Ligand | MMPBSA score for top pose (kcal/mol) |
|---|---|
| Diphenhydramine (self-docking validation) | −19.9 ± 2.2 |
| S-verapamil (self-docking validation) | −36.6 ± 5.5 |
| serotonin | −14.3 ± 3.6 |
| epinephrine | −10.8 ± 3.8 |
| metformin | −6.5 ± 2.6 |
| dopamine | −10.9 ± 3.7 |
| mescaline | −15.9 ± 2.5 |
| norfentanyl | −19.9 ± 3.1 |
| methylnaltrexone | −34.8 ± 3.7 |
| morphine | −21.3 ± 3.3 |
| imipramine | −25.4 ± 2.8 |
| MPP+ | −11.6 ± 3.5 |
Supplementary Material
Acknowledgements:
Cryo-EM data were screened and collected at the Duke University Shared Materials Instrumentation Facility (SMIF), the UNC Cryo-EM core facility, and the National Institute of Environmental Health Sciences (NIEHS). We thank Nilakshee Bhattacharya at SMIF, and Joshua Strauss of the UNC Cryo-EM Core Facility for assistance with the microscope operation. This research was supported by a National Institutes of Health (R01GM137421 to S.-Y.L and R01GM138472 to W.I.), the National Institute of Health Intramural Research Program; US National Institutes of Environmental Health Science (ZIC ES103326 to M.J.B.) and a National Science Foundation grant MCB-1810695 (W.I.). DUKE SMIF is affiliated with the North Carolina Research Triangle Nanotechnology Network, which is in part supported by the NSF (ECCS-2025064). The UNC CryoEM core facility is supported by NIH grant P30CA016086.
Footnotes
Competing Interests: The authors declare no competing interests.
Data Availability
Atomic coordinates have been deposited in the Protein Data Bank with the PDB IDs 8ET6 (Apo-OCT1CS), 8ET7 (DPH-OCT1CS), and 8ET8 (VPM-OCT1CS), 8ET9 (MPP+-OCT2CS), respectively. The reconstructed cryo-EM maps have been deposited in the Electron Microscopy Data Bank with the IDs EMD-28586 (Apo-OCT1CS), EMD-28587 (DPH-OCT1CS), and EMD-28588 (VPM-OCT1CS), EMD-28589 (MPP+-OCT2CS), respectively. Source data are provided with the paper online, and additional data pertinent to this paper are available upon reasonable request to S-Y. L.
References
- 1.Koepsell H Organic cation transporters in health and disease. Pharmacological reviews 72, 253–319 (2020). [DOI] [PubMed] [Google Scholar]
- 2.Chen L. et al. OCT1 is a high-capacity thiamine transporter that regulates hepatic steatosis and is a target of metformin. Proc Natl Acad Sci U S A 111, 9983–9988, doi: 10.1073/pnas.1314939111 (2014). [DOI] [PMC free article] [PubMed] [Google Scholar]
- 3.Cheung KWK et al. The Effect of Uremic Solutes on the Organic Cation Transporter 2. J Pharm Sci 106, 2551–2557, doi: 10.1016/j.xphs.2017.04.076 (2017). [DOI] [PubMed] [Google Scholar]
- 4.Boxberger KH, Hagenbuch B. & Lampe JN Common drugs inhibit human organic cation transporter 1 (OCT1)-mediated neurotransmitter uptake. Drug Metab Dispos 42, 990–995, doi: 10.1124/dmd.113.055095 (2014). [DOI] [PMC free article] [PubMed] [Google Scholar]
- 5.Bacq A. et al. Organic cation transporter 2 controls brain norepinephrine and serotonin clearance and antidepressant response. Mol Psychiatry 17, 926–939, doi: 10.1038/mp.2011.87 (2012). [DOI] [PubMed] [Google Scholar]
- 6.Zamek-Gliszczynski MJ et al. Transporters in drug development: 2018 ITC recommendations for transporters of emerging clinical importance. Clinical Pharmacology & Therapeutics 104, 890–899 (2018). [DOI] [PMC free article] [PubMed] [Google Scholar]
- 7.Shu Y. et al. Effect of genetic variation in the organic cation transporter 1 (OCT1) on metformin action. The Journal of clinical investigation 117, 1422–1431 (2007). [DOI] [PMC free article] [PubMed] [Google Scholar]
- 8.Ahlin G. et al. Genotype-dependent effects of inhibitors of the organic cation transporter, OCT1: predictions of metformin interactions. The pharmacogenomics journal 11, 400–411 (2011). [DOI] [PubMed] [Google Scholar]
- 9.Song IS et al. Genetic variants of the organic cation transporter 2 influence the disposition of metformin. Clin Pharmacol Ther 84, 559–562, doi: 10.1038/clpt.2008.61 (2008). [DOI] [PubMed] [Google Scholar]
- 10.Tzvetkov MV et al. Increased systemic exposure and stronger cardiovascular and metabolic adverse reactions to fenoterol in individuals with heritable OCT1 deficiency. Clinical Pharmacology & Therapeutics 103, 868–878 (2018). [DOI] [PubMed] [Google Scholar]
- 11.Stamer UM et al. Loss-of-function polymorphisms in the organic cation transporter OCT1 are associated with reduced postoperative tramadol consumption. Pain 157, 2467–2475 (2016). [DOI] [PubMed] [Google Scholar]
- 12.Tzvetkov MV et al. Morphine is a substrate of the organic cation transporter OCT1 and polymorphisms in OCT1 gene affect morphine pharmacokinetics after codeine administration. Biochemical pharmacology 86, 666–678 (2013). [DOI] [PubMed] [Google Scholar]
- 13.Zazuli Z. et al. The Impact of Genetic Polymorphisms in Organic Cation Transporters on Renal Drug Disposition. Int J Mol Sci 21, doi: 10.3390/ijms21186627 (2020). [DOI] [PMC free article] [PubMed] [Google Scholar]
- 14.Chen EC et al. Discovery of competitive and noncompetitive ligands of the organic cation transporter 1 (OCT1; SLC22A1). Journal of medicinal chemistry 60, 2685–2696 (2017). [DOI] [PubMed] [Google Scholar]
- 15.Jensen O, Brockmöller J. r. & Dücker C. Identification of novel high-affinity substrates of OCT1 using machine learning-guided virtual screening and experimental validation. Journal of medicinal chemistry 64, 2762–2776 (2021). [DOI] [PubMed] [Google Scholar]
- 16.Kido Y, Matsson P. & Giacomini KM Profiling of a prescription drug library for potential renal drug-drug interactions mediated by the organic cation transporter 2. J Med Chem 54, 4548–4558, doi: 10.1021/jm2001629 (2011). [DOI] [PMC free article] [PubMed] [Google Scholar]
- 17.Neuhoff S, Ungell A-L, Zamora I. & Artursson P. pH-dependent bidirectional transport of weakly basic drugs across Caco-2 monolayers: implications for drug–drug interactions. Pharmaceutical research 20, 1141–1148 (2003). [DOI] [PubMed] [Google Scholar]
- 18.Shibata M, Toyoshima J, Kaneko Y, Oda K. & Nishimura T. A drug–drug interaction study to evaluate the impact of peficitinib on OCT1-and MATE1-mediated transport of metformin in healthy volunteers. European journal of clinical pharmacology 76, 1135–1141 (2020). [DOI] [PMC free article] [PubMed] [Google Scholar]
- 19.Cho S. et al. Rifampin enhances the glucose-lowering effect of metformin and increases OCT1 mRNA levels in healthy participants. Clinical Pharmacology & Therapeutics 89, 416–421 (2011). [DOI] [PubMed] [Google Scholar]
- 20.Koepsell H. Update on drug-drug interaction at organic cation transporters: Mechanisms, clinical impact, and proposal for advanced in vitro testing. Expert Opinion on Drug Metabolism & Toxicology 17, 635–653 (2021). [DOI] [PubMed] [Google Scholar]
- 21.Cho SK, Kim CO, Park ES & Chung JY Verapamil decreases the glucose-lowering effect of metformin in healthy volunteers. British journal of clinical pharmacology 78, 1426–1432 (2014). [DOI] [PMC free article] [PubMed] [Google Scholar]
- 22.EMA. Guideline on the investigation of drug interactions. Guid Doc 44, 59 (2012). [Google Scholar]
- 23.Food, U. & Administration, D. In vitro drug interaction studies—cytochrome P450 enzyme-and transporter-mediated drug interactions guidance for industry. Center for Drug Evaluation and Research, US Food and Drug Administration, Silver Spring, MD. https://www.fda.gov/media/134582/download (2020). [Google Scholar]
- 24.Meyer MJ et al. Amino acids in transmembrane helix 1 confer major functional differences between human and mouse orthologs of the polyspecific membrane transporter OCT1. Journal of Biological Chemistry 298 (2022). [DOI] [PMC free article] [PubMed] [Google Scholar]
- 25.Popp C. et al. Amino acids critical for substrate affinity of rat organic cation transporter 1 line the substrate binding region in a model derived from the tertiary structure of lactose permease. Molecular pharmacology 67, 1600–1611 (2005). [DOI] [PubMed] [Google Scholar]
- 26.Zhang X, Shirahatti NV, Mahadevan D. & Wright SH A conserved glutamate residue in transmembrane helix 10 influences substrate specificity of rabbit OCT2 (SLC22A2). Journal of Biological Chemistry 280, 34813–34822 (2005). [DOI] [PubMed] [Google Scholar]
- 27.Harper JN & Wright SH Multiple mechanisms of ligand interaction with the human organic cation transporter, OCT2. Am J Physiol Renal Physiol 304, F56–67, doi: 10.1152/ajprenal.00486.2012 (2013). [DOI] [PMC free article] [PubMed] [Google Scholar]
- 28.Gorboulev V, Volk C, Arndt P, Akhoundova A. & Koepsell H. Selectivity of the polyspecific cation transporter rOCT1 is changed by mutation of aspartate 475 to glutamate. Molecular pharmacology 56, 1254–1261 (1999). [DOI] [PubMed] [Google Scholar]
- 29.Gorbunov D. et al. High-affinity Cation Binding to Transporter OCT1 Induces Movement of Helix 11 and Blocks Transport after Mutations in a Modelled Interaction Domain between Two Helices. Molecular Pharmacology (2007). [DOI] [PubMed] [Google Scholar]
- 30.Sturm A. et al. Identification of cysteines in rat organic cation transporters rOCT1 (C322, C451) and rOCT2 (C451) critical for transport activity and substrate affinity. American Journal of Physiology-Renal Physiology 293, F767–F779 (2007). [DOI] [PubMed] [Google Scholar]
- 31.Pelis RM, Zhang X, Dangprapai Y. & Wright SH Cysteine accessibility in the hydrophilic cleft of human organic cation transporter 2. J Biol Chem 281, 35272–35280, doi: 10.1074/jbc.M606561200 (2006). [DOI] [PubMed] [Google Scholar]
- 32.Ahlin G. et al. Structural requirements for drug inhibition of the liver specific human organic cation transport protein 1. Journal of medicinal chemistry 51, 5932–5942 (2008). [DOI] [PubMed] [Google Scholar]
- 33.Wright SH Molecular and cellular physiology of organic cation transporter 2. Am J Physiol Renal Physiol 317, F1669–F1679, doi: 10.1152/ajprenal.00422.2019 (2019). [DOI] [PMC free article] [PubMed] [Google Scholar]
- 34.Cirri E. et al. Consensus designs and thermal stability determinants of a human glutamate transporter. Elife 7 (2018). [DOI] [PMC free article] [PubMed] [Google Scholar]
- 35.Wright NJ & Lee S-Y Structures of human ENT1 in complex with adenosine reuptake inhibitors. Nature structural & molecular biology 26, 599–606 (2019). [DOI] [PMC free article] [PubMed] [Google Scholar]
- 36.Tu M. et al. Organic cation transporter 1 mediates the uptake of monocrotaline and plays an important role in its hepatotoxicity. Toxicology 311, 225–230 (2013). [DOI] [PubMed] [Google Scholar]
- 37.Zhang L. et al. Cloning and functional expression of a human liver organic cation transporter. Molecular pharmacology 51, 913–921 (1997). [DOI] [PubMed] [Google Scholar]
- 38.Choi MK et al. Effects of tetraalkylammonium compounds with different affinities for organic cation transporters on the pharmacokinetics of metformin. Biopharmaceutics & drug disposition 28, 501–510 (2007). [DOI] [PubMed] [Google Scholar]
- 39.Keller T. et al. Rat organic cation transporter 1 contains three binding sites for substrate 1-methyl-4-phenylpyridinium per monomer. Molecular pharmacology 95, 169–182 (2019). [DOI] [PubMed] [Google Scholar]
- 40.Quistgaard EM, Low C, Guettou F. & Nordlund P. Understanding transport by the major facilitator superfamily (MFS): structures pave the way. Nat Rev Mol Cell Biol 17, 123–132, doi: 10.1038/nrm.2015.25 (2016). [DOI] [PubMed] [Google Scholar]
- 41.Drew D, North RA, Nagarathinam K. & Tanabe M. Structures and general transport mechanisms by the major facilitator superfamily (MFS). Chemical Reviews 121, 5289–5335 (2021). [DOI] [PMC free article] [PubMed] [Google Scholar]
- 42.Sakugawa T. et al. Enantioselective disposition of fexofenadine with the P-glycoprotein inhibitor verapamil. British journal of clinical pharmacology 67, 535–540 (2009). [DOI] [PMC free article] [PubMed] [Google Scholar]
- 43.Choi D-H, Chung J-H & Choi J-S Pharmacokinetic interaction between oral lovastatin and verapamil in healthy subjects: role of P-glycoprotein inhibition by lovastatin. European journal of clinical pharmacology 66, 285–290 (2010). [DOI] [PubMed] [Google Scholar]
- 44.Wang N. et al. Structural basis of human monocarboxylate transporter 1 inhibition by anti-cancer drug candidates. Cell 184, 370–383. e313 (2021). [DOI] [PubMed] [Google Scholar]
- 45.Wright NJ & Lee S-Y Recent advances on the inhibition of human solute carriers: Therapeutic implications and mechanistic insights. Current Opinion in Structural Biology 74, 102378 (2022). [DOI] [PMC free article] [PubMed] [Google Scholar]
- 46.Piascik MT, Collins R. & Butler BT Stereoselective and nonstereoselective inhibition exhibited by the enantiomers of verapamil. Canadian journal of physiology and pharmacology 68, 439–446 (1990). [DOI] [PubMed] [Google Scholar]
- 47.Eichelbaum M. Stereoselective first-pass metabolism of highly cleared drugs: studies of the bioavailability of l-and d-verapamil examined with a stable isotope technique. Br J Clin Pharmacol 58, S805 (2004). [DOI] [PMC free article] [PubMed] [Google Scholar]
- 48.Hanada K, Ikemi Y, Kukita K, Mihara K. & Ogata H. Stereoselective first-pass metabolism of verapamil in the small intestine and liver in rats. Drug metabolism and disposition 36, 2037–2042 (2008). [DOI] [PubMed] [Google Scholar]
- 49.Gebauer L, Arul Murugan N, Jensen O, Brockmoller J. & Rafehi M. Molecular basis for stereoselective transport of fenoterol by the organic cation transporters 1 and 2. Biochem Pharmacol 197, 114871, doi: 10.1016/j.bcp.2021.114871 (2022). [DOI] [PubMed] [Google Scholar]
- 50.Guterres H. & Im W. Improving protein-ligand docking results with high-throughput molecular dynamics simulations. Journal of Chemical Information and Modeling 60, 2189–2198 (2020). [DOI] [PMC free article] [PubMed] [Google Scholar]
- 51.Guterres H. et al. CHARMM-GUI high-throughput simulator for efficient evaluation of protein–ligand interactions with different force fields. Protein Science 31, e4413 (2022). [Google Scholar]
- 52.Gorboulev V. et al. Assay conditions influence affinities of rat organic cation transporter 1: analysis of mutagenesis in the modeled outward-facing cleft by measuring effects of substrates and inhibitors on initial uptake. Molecular pharmacology 93, 402–415 (2018). [DOI] [PubMed] [Google Scholar]
- 53.Khanppnavar B. et al. Structural basis of organic cation transporter-3 inhibition. Nat Commun 13, 6714, doi: 10.1038/s41467-022-34284-8 (2022). [DOI] [PMC free article] [PubMed] [Google Scholar]
- 54.Ashkenazy H. et al. ConSurf 2016: an improved methodology to estimate and visualize evolutionary conservation in macromolecules. Nucleic Acids Res 44, W344–350, doi: 10.1093/nar/gkw408 (2016). [DOI] [PMC free article] [PubMed] [Google Scholar]
- 55.Jurrus E. et al. Improvements to the APBS biomolecular solvation software suite. Protein Science 27, 112–128 (2018). [DOI] [PMC free article] [PubMed] [Google Scholar]
Methods-only references
- 56.Gabler F. et al. Protein Sequence Analysis Using the MPI Bioinformatics Toolkit. Curr Protoc Bioinformatics 72, e108, doi: 10.1002/cpbi.108 (2020). [DOI] [PubMed] [Google Scholar]
- 57.Katoh K, Rozewicki J. & Yamada KD MAFFT online service: multiple sequence alignment, interactive sequence choice and visualization. Brief Bioinform 20, 1160–1166, doi: 10.1093/bib/bbx108 (2019). [DOI] [PMC free article] [PubMed] [Google Scholar]
- 58.Waterhouse AM, Procter JB, Martin DM, Clamp M. & Barton GJ Jalview Version 2—a multiple sequence alignment editor and analysis workbench. Bioinformatics 25, 1189–1191 (2009). [DOI] [PMC free article] [PubMed] [Google Scholar]
- 59.Wright NJ et al. Methotrexate recognition by the human reduced folate carrier SLC19A1. Nature, 1–7 (2022). [DOI] [PMC free article] [PubMed] [Google Scholar]
- 60.Goehring A. et al. Screening and large-scale expression of membrane proteins in mammalian cells for structural studies. Nature protocols 9, 2574–2585 (2014). [DOI] [PMC free article] [PubMed] [Google Scholar]
- 61.Löbel M. et al. Structural basis for proton coupled cystine transport by cystinosin. Nature communications 13, 1–12 (2022). [DOI] [PMC free article] [PubMed] [Google Scholar]
- 62.Mastronarde DN Automated electron microscope tomography using robust prediction of specimen movements. Journal of structural biology 152, 36–51 (2005). [DOI] [PubMed] [Google Scholar]
- 63.Peck JV, Fay JF & Strauss JD High-speed high-resolution data collection on a 200 keV cryo-TEM. IUCrJ 9 (2022). [DOI] [PMC free article] [PubMed] [Google Scholar]
- 64.Zheng SQ et al. MotionCor2: anisotropic correction of beam-induced motion for improved cryo-electron microscopy. Nature methods 14, 331–332 (2017). [DOI] [PMC free article] [PubMed] [Google Scholar]
- 65.Zhang K. Gctf: Real-time CTF determination and correction. Journal of structural biology 193, 1–12 (2016). [DOI] [PMC free article] [PubMed] [Google Scholar]
- 66.Rohou A. & Grigorieff N. CTFFIND4: Fast and accurate defocus estimation from electron micrographs. J Struct Biol 192, 216–221, doi: 10.1016/j.jsb.2015.08.008 (2015). [DOI] [PMC free article] [PubMed] [Google Scholar]
- 67.Punjani A, Rubinstein JL, Fleet DJ & Brubaker MA cryoSPARC: algorithms for rapid unsupervised cryo-EM structure determination. Nat Methods 14, 290–296, doi: 10.1038/nmeth.4169 (2017). [DOI] [PubMed] [Google Scholar]
- 68.Punjani A, Zhang H. & Fleet DJ Non-uniform refinement: adaptive regularization improves single-particle cryo-EM reconstruction. Nature methods 17, 1214–1221 (2020). [DOI] [PubMed] [Google Scholar]
- 69.Zivanov J. et al. New tools for automated high-resolution cryo-EM structure determination in RELION-3. Elife 7, doi: 10.7554/eLife.42166 (2018). [DOI] [PMC free article] [PubMed] [Google Scholar]
- 70.Emsley P. & Cowtan K. Coot: model-building tools for molecular graphics. Acta Crystallogr D Biol Crystallogr 60, 2126–2132, doi: 10.1107/S0907444904019158 (2004). [DOI] [PubMed] [Google Scholar]
- 71.Liebschner D. et al. Macromolecular structure determination using X-rays, neutrons and electrons: recent developments in Phenix. Acta Crystallographica Section D: Structural Biology 75, 861–877 (2019). [DOI] [PMC free article] [PubMed] [Google Scholar]
- 72.Williams CJ et al. MolProbity: More and better reference data for improved all-atom structure validation. Protein Science 27, 293–315 (2018). [DOI] [PMC free article] [PubMed] [Google Scholar]
- 73.Pettersen EF et al. UCSF Chimera—a visualization system for exploratory research and analysis. Journal of computational chemistry 25, 1605–1612 (2004). [DOI] [PubMed] [Google Scholar]
- 74.Pettersen EF et al. UCSF ChimeraX: Structure visualization for researchers, educators, and developers. Protein Science 30, 70–82 (2021). [DOI] [PMC free article] [PubMed] [Google Scholar]
- 75.Jo S, Kim T, Iyer VG & Im W. CHARMM-GUI: a web-based graphical user interface for CHARMM. Journal of computational chemistry 29, 1859–1865 (2008). [DOI] [PubMed] [Google Scholar]
- 76.Wu EL, et al. (Wiley Online Library, 2014).
- 77.Lee J. et al. CHARMM-GUI membrane builder for complex biological membrane simulations with glycolipids and lipoglycans. Journal of chemical theory and computation 15, 775–786 (2018). [DOI] [PubMed] [Google Scholar]
- 78.Jorgensen WL, Chandrasekhar J, Madura JD, Impey RW & Klein ML Comparison of simple potential functions for simulating liquid water. The Journal of chemical physics 79, 926–935 (1983). [Google Scholar]
- 79.Steinbach PJ & Brooks BR New spherical-cutoff methods for long-range forces in macromolecular simulation. Journal of computational chemistry 15, 667–683 (1994). [Google Scholar]
- 80.Essmann U. et al. A smooth particle mesh Ewald method. The Journal of chemical physics 103, 8577–8593 (1995). [Google Scholar]
- 81.Hopkins PF A new class of accurate, mesh-free hydrodynamic simulation methods. Monthly Notices of the Royal Astronomical Society 450, 53–110 (2015). [Google Scholar]
- 82.Gao Y. et al. Charmm-gui supports hydrogen mass repartitioning and different protonation states of phosphates in lipopolysaccharides. Journal of chemical information and modeling 61, 831–839 (2021). [DOI] [PMC free article] [PubMed] [Google Scholar]
- 83.Huang J. et al. CHARMM36m: an improved force field for folded and intrinsically disordered proteins. Nature methods 14, 71–73 (2017). [DOI] [PMC free article] [PubMed] [Google Scholar]
- 84.Vanommeslaeghe K. et al. CHARMM general force field: A force field for drug-like molecules compatible with the CHARMM all-atom additive biological force fields. Journal of computational chemistry 31, 671–690 (2010). [DOI] [PMC free article] [PubMed] [Google Scholar]
- 85.Eastman P. et al. OpenMM 7: Rapid development of high performance algorithms for molecular dynamics. PLoS computational biology 13, e1005659 (2017). [DOI] [PMC free article] [PubMed] [Google Scholar]
- 86.Brooks BR et al. CHARMM: the biomolecular simulation program. Journal of computational chemistry 30, 1545–1614 (2009). [DOI] [PMC free article] [PubMed] [Google Scholar]
- 87.Trott O. & Olson AJ AutoDock Vina: improving the speed and accuracy of docking with a new scoring function, efficient optimization, and multithreading. Journal of computational chemistry 31, 455–461 (2010). [DOI] [PMC free article] [PubMed] [Google Scholar]
- 88.Miller III BR et al. MMPBSA. py: an efficient program for end-state free energy calculations. Journal of chemical theory and computation 8, 3314–3321 (2012). [DOI] [PubMed] [Google Scholar]
Associated Data
This section collects any data citations, data availability statements, or supplementary materials included in this article.
Supplementary Materials
Data Availability Statement
Atomic coordinates have been deposited in the Protein Data Bank with the PDB IDs 8ET6 (Apo-OCT1CS), 8ET7 (DPH-OCT1CS), and 8ET8 (VPM-OCT1CS), 8ET9 (MPP+-OCT2CS), respectively. The reconstructed cryo-EM maps have been deposited in the Electron Microscopy Data Bank with the IDs EMD-28586 (Apo-OCT1CS), EMD-28587 (DPH-OCT1CS), and EMD-28588 (VPM-OCT1CS), EMD-28589 (MPP+-OCT2CS), respectively. Source data are provided with the paper online, and additional data pertinent to this paper are available upon reasonable request to S-Y. L.


