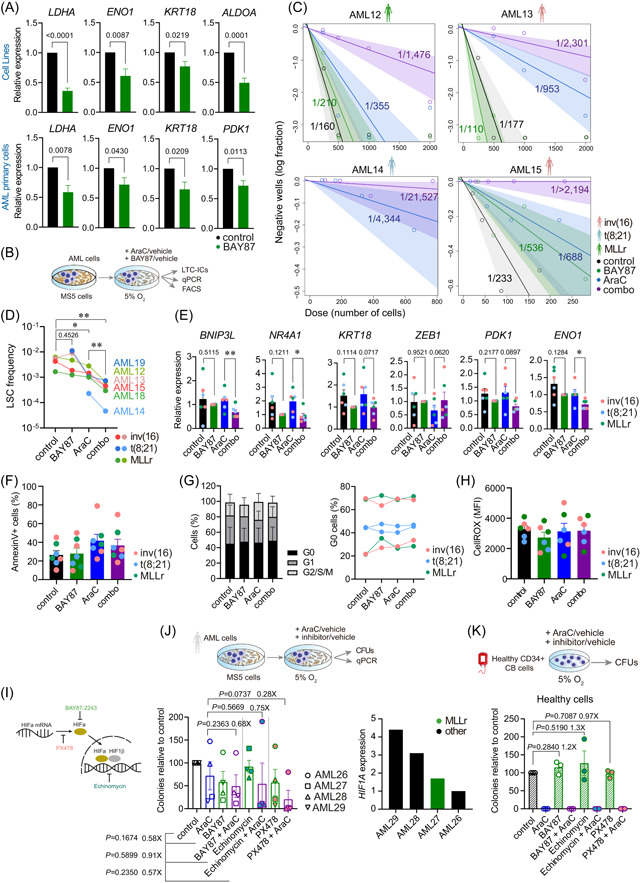
Figure 6.

Inhibition of the hypoxia inducible factor (HIF) pathway sensitizes acute myeloid leukemia (AML)‐leukemia stem cells (LSCs) to chemotherapy in vitro. (A) Expression of the indicated HIF target genes after 48 h treatment at 5% O2 in n = 5 cell lines (ME1, Kasumi1, THP1, MV[4;11], and Molm13; upper panels) and in n = 8–9 AML primary samples (lower panels). Statistical significance was calculated using the paired Student's t‐test. Expression is normalized with respect to control samples. (B) Experimental overview for (C–H). Human AML primary cells were cultured over MS5 cells for 4 days and treated afterward with the indicated drugs for 48 h at 5% O2. After the treatment, cells were used for gene expression, flow cytometry, or long‐term culture‐initiating cells (LTC‐IC) assays (n = 15 wells/treatment and AML sample). (C) Estimation of the LSC frequency after the LTC‐IC assay was calculated using the ELDA software. (D) Impact of the indicated treatment on the LSC frequency for all the analyzed samples (n = 6) using data from the LTC‐IC assays. Statistical significance was calculated using the Ratio paired Student's t‐test. p‐Values are indicated for the AraC‐combo groups comparison. (E) Expression of the indicated HIF target genes identified in the scRNA‐seq analysis to be overexpressed in the LSC cluster after 48 h treatment with the indicated drugs at 5% O2 (n = 6 samples, AML03, AML16‐AML20; 2 per cytogenetic group). Statistical significance was calculated using the paired Student's t‐test. Expression is normalized with respect to the BAY87 samples. (F–H) Apoptosis quantification with Annexin V staining (F), cell cycle analysis by fluorescence‐activated cell sorting (FACS) (G), and reactive oxygen species (ROS) content measured using CellROX staining (H), in AML cells treated with the indicated drugs for 48 h at 5% O2 (n = 6 samples, AML03, AML16‐AML20). (I) Scheme depicting the mechanisms of action of the HIF inhibitor drugs used in (J, K). (J) Colony unit forming (CFU)‐assays from AML primary cells (n = 4) treated during 48 h with the indicated drugs at 5% O2. Right plot shows the HIF1A expression levels of each of the four AMLs used for this assay. (K) CFU‐assays from healthy CD34+ cord blood HSPCs (n = 3 donors) treated during 48 h with the indicated drugs at 5% O2. Data are shown as mean ± SEM. *p < 0.1, **p < 0.01, ***p < 0.001. Student's t‐test analysis.
