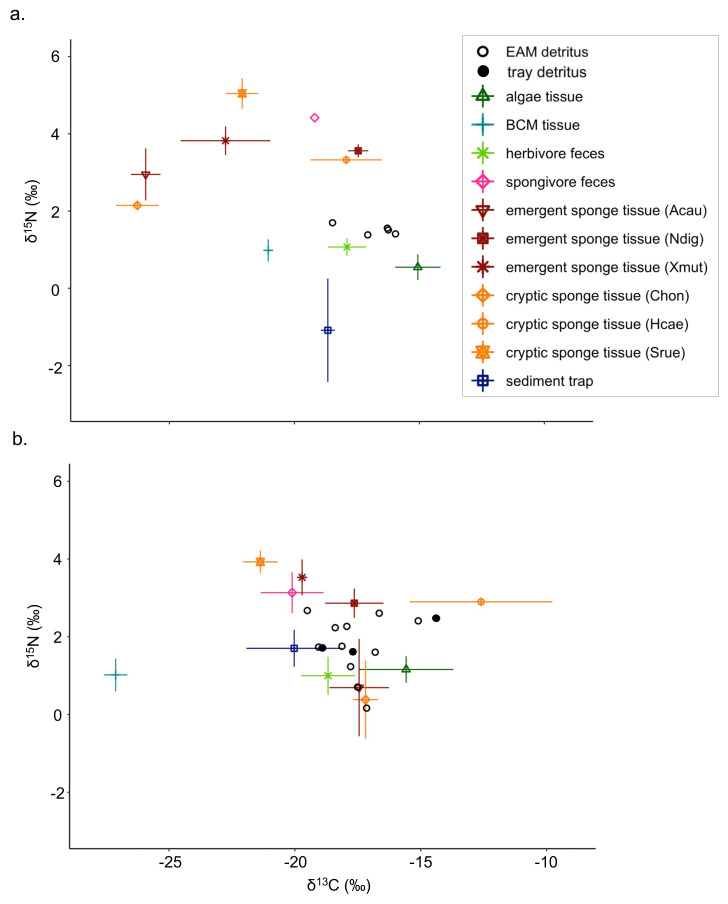
Figure 1. Isotope biplots of samples collected in (A) July 2018 and (B) March 2019.
Detritus samples, including EAM and tray detritus, are represented by open and filled circles, respectively, that denote the values of individual samples. All other symbols represent the average ± SD of source samples.

