

Abstract
The epigenetic mechanisms that maintain differentiated cell states remain incompletely understood. Here, we employed histone mutants to uncover a crucial role for H3K36-methylation in the maintenance of cell identities across diverse developmental contexts. Focusing on the experimental induction of pluripotency, we show that H3K36M-mediated depletion of H3K36-methylation endows fibroblasts with a plastic state poised to acquire pluripotency in nearly all cells. At a cellular level, H3K36M facilitates epithelial plasticity by rendering fibroblasts insensitive to TGFb signals. At a molecular level, H3K36M enables the decommissioning of mesenchymal enhancers and the parallel activation of epithelial/stem cell enhancers. This enhancer rewiring is Tet-dependent and redirects Sox2 from promiscuous somatic to pluripotency targets. Our findings reveal a previously unappreciated dual role for H3K36-methylation in the maintenance of cell identity by integrating a crucial developmental pathway into sustained expression of cell type-specific programs, and by opposing the expression of alternative lineage programs through enhancer methylation.
Introduction
The process of cellular differentiation has been relatively well characterized in vivo and in vitro using animal and stem cell models in combination with genome-scale assays1–8. By contrast, the mechanisms that maintain and reinforce specialized cell states once differentiation is complete remain less well understood. Resolving this fundamental question is key not only for ensuring the continuous maintenance and functionality of adult tissues but also for dissecting oncogenesis, which is considered an aberration of normal cell states and differentiation programs9. The experimentally induced conversion of somatic cells to induced pluripotent stem cells (iPSCs) with transcription factors represents a powerful system to interrogate the mechanisms that maintain differentiated cell identities10. Induced pluripotency is typically inefficient (1–3%) and lengthy (1–2 weeks), which is thought to be due to redundant mechanisms that safeguard differentiated cell states11. Indeed, the perturbation of diverse regulatory factors enhances the generation of iPSCs by increasing cellular plasticity12. While histone-modifying enzymes are among these regulators13–16, their effects on reprogramming are often subtle, and the corresponding genes are typically underrepresented in unbiased screens14,17,18. Histone-modifying enzymes are challenging to study in cell fate regulation as they are often essential for cellular survival or compensated by redundant enzymes19. Additionally, some histone-modifying enzymes recognize non-histone substrates, complicating their functional analyses20–23. Thus, the functional roles of specific histone modifications in the maintenance of cell identity remain incompletely understood.
Lysine-to-methionine (K-to-M) mutations of histone H3 have recently been suggested as powerful tools to probe the physiological roles of specific histone marks in vitro and in vivo24. K-to-M mutants function as dominant alleles that block methylation at the respective sites across the genome25–30. In contrast to deletions of histone-modifying enzymes, K-to-M mutations function as hypomorphs31, thus solving toxicity concerns. Indeed, we recently demonstrated that introduction of specific H3 K-to-M mutants into embryonic stem cells (ESCs) and mice reveals highly specific roles of the targeted histone marks in mammalian pluripotency, tissue homeostasis and tumorigenesis32.
Here, we interrogated the molecular and functional roles of two key active and two key repressive histone modifications on cell identity maintenance by combining specific histone mutants with experimental models of cell fate conversion. We uncovered a striking effect of the H3K36M mutation, which targets H3K36 di- and trimethylation, on various lineage conversion paradigms. By elucidating the underlying mechanisms in the context of induced pluripotency, we demonstrated that H3K36-methylation plays a previously unexplored, dual role in the maintenance of cell identity. Our findings place H3K36-methylation at the nexus of a key extracellular signaling pathway and epigenetic gene regulation during the maintenance of cell state, which will advance our understanding of development, regeneration, and cancer.
Results
Key role of H3K36-methylation in cell identity maintenance
To probe the role of specific histone marks in the maintenance of cell identity, we introduced doxycycline (dox)-inducible lentiviral constructs with either wild-type histone H3.3 (WT) or H3.3 variants carrying specific K-to-M mutations at lysine residues 4, 9, 27 and 36 (K4M, K9M, K27M, K36M) (Fig. 1a,b) into murine embryonic fibroblasts (MEFs) harboring a dox-inducible polycistronic cassette encompassing the reprogramming factors Oct4, Klf4, Sox2, and c-Myc (OKSM)33. Transduced cultures were treated with dox for 12 days to induce OKSM as well as WT or mutant histone expression before counting induced pluripotent stem cell (iPSC) colonies on day 15 (Fig. 1b). We detected no iPSC colonies in K4M-transduced cells, a ~3-fold increase of iPSC colonies in K9M-transduced cells and a similar number of enlarged iPSC colonies in K27M-transduced cells compared to WT control (Fig. 1c, Extended Data Fig. 1a), confirming and extending previous observations using siRNA suppression of the respective histone-modifying enzymes13,34–39. Strikingly, K36M-transduced cells exhibited the most profound phenotype, with wells being entirely overgrown by iPSC colonies. Although certain H3K36-specific demethylases (Kdm2a/Kdm2b) have previously been implicated in reprogramming40,41, the reported effects were rather subtle compared to our K36M phenotype, probably owing to compensatory mechanisms. We conclude that disrupted H3K36-methylation most profoundly affects cell fate change during reprogramming.
Fig. 1: Histone mutant analysis reveals crucial role of H3K36-methylation in cell identity maintenance.

(a) Lysine-to-methionine (K-to-M) mutants of histone H3.3 dominantly block histone methylation at the respective residue across the genome.
(b) WT or mutant histones (K4M, K9M, K27M, and K36M) were co-expressed with OKSM in fibroblasts during reprogramming.
(c) Alkaline phosphatase (AP) staining of transgene-independent iPSC colonies. Transduced MEFs were treated with dox for 12 days, followed by 3 days of withdrawal.
(d) OKSM transgene dependency assay. MEFs were treated with dox, ascorbic acid, and CHIR99021 as indicated, and iPSCs were scored by AP staining on day 15.
(e) Marker dynamics during MEF to iPSC reprogramming.
(f) Percentage of Thy1− and SSEA1+ intermediates on day 6 of reprogramming. P values were determined by two-sided unpaired Student’s t test, error bars indicate mean ± SD (n=3 biologically independent experiments).
(g) Flow cytometry analysis of Thy1 and SSEA1 at early timepoints of reprogramming in WT and K36M cells.
(h) Abundance of intermediate populations that reprogram with high efficiency (SSEA1+/Sca1−/Epcam+) on days 4 and 6 of reprogramming. P values were determined by two-sided unpaired Student’s t test, error bars indicate mean ± SD (n=3 biologically independent experiments).
(i) Flow cytometry using the Oct4-GFP reporter as a readout for successful activation of the endogenous pluripotency network on day 4 and day 8 of reprogramming.
(j) Detection of Oct4-GFP+ cells at different timepoints of reprogramming in WT and K36M samples (ascorbic acid and CHIR99021 condition). Error bars indicate mean ± SD (n=3 biologically independent experiments).
(k) AP staining of human reprogramming cultures at the indicated timepoints. Human fibroblasts were transduced with constitutive vectors expressing H3.3 WT or K36M, and OKSM.
(l) Quantification of AP colony counts on days 9 and 12. P values were determined by two-sided unpaired Student’s t test, n=3 biologically independent experiments.
(m) qRT-PCR for epithelial and pluripotency-associated genes in human reprogramming cultures on days 9 and 12 of reprogramming. P values were determined by two-sided unpaired Student’s t test, error bars indicate mean ± SD (n=3 biologically independent experiments).
K36M drives nearly all somatic cells towards pluripotency
We generated transgenic MEFs containing the Col1a1::tetO-OKSM allele together with either the Col1a1::tetO-K36M allele (OKSM/K36M) or the Col1a1::tetO-H3.3 allele (OKSM/WT)32, allowing us to express OKSM and histones in a homogeneous, inducible and reversible manner (Extended Data Fig. 1b). Indeed, K36M and Sox2 were uniformly induced, whereas H3K36me2 and H3K36me3 were uniformly depleted in dox-treated OKSM/K36M cells (Extended Data Fig. 1c). Mass-spectrometric analysis confirmed the robust depletion of H3K36me1, H3K36me2 and H3K36me3 on canonical and variant histone H3 in OKSM/K36M cells (Extended Data Fig. 1d).
We first determined the minimally required time of OKSM expression to produce stable iPSCs (Fig. 1d). While OKSM/WT cultures gave rise to rare iPSC colonies after 6–8 days of OKSM expression consistent with previous observations42, OKSM/K36M cultures were full of iPSC colonies after as little as 4 days of OKSM expression, indicating a markedly accelerated and more uniform acquisition of pluripotency. We next assessed when K36M expression is required to boost reprogramming (Extended Data Fig. 1e). Expression of K36M in MEFs for two days prior to OKSM induction had a similar effect on iPSC formation as the co-expression of K36M and OKSM during the first two days of reprogramming, suggesting that K36M primes the MEF epigenome for an efficient acquisition of pluripotency (Extended Data Fig. 1f). Importantly, the frequency of iPSC formation further increased with prolonged K36M expression, implying an independent role at later stages of reprogramming.
We next tracked surface antigens that dynamically change with reprogramming (Fig. 1e). OKSM/WT control cells downregulated the fibroblast-associated marker Thy1 and subsequently upregulated the early pluripotency-associated marker SSEA1 in ~25% of cells by day 6 of reprogramming, paralleling prior observations42–44 (Fig. 1f,g). By contrast, OKSM/K36M cultures already expressed SSEA1 in ~10% of Thy1+ cells on day 2, and this population further increased to over 75% by day 6. When we examined surface marker combinations that identify more rare reprogramming intermediates poised to produce iPSCs at high efficiency (Fig. 1e)45, we detected these populations earlier and in a higher fraction of cells in OKSM/K36M versus OKSM/WT cultures (Fig. 1h). In agreement, the vast majority (~85%) of OKSM/K36M cultures upregulated the late pluripotency reporter Oct4-GFP46 (Fig. 1e,i) between days 4 and 8 of reprogramming while only a minor fraction (~5%) upregulated the reporter in controls, independent of culture conditions (Fig. 1j, Extended Data Fig. 1g). OKSM/K36M cultures reached over 90% Oct4-GFP positivity by day 10 of reprogramming, suggesting that almost every cell had acquired a pluripotent state (Fig. 1j). K36M induction neither affected cell proliferation (Extended Data Fig. 1h) nor cell death (Extended Data Fig. 1i), and we determined that residual Oct4-GFP− cells at day 10 likely comprise pluripotent cells in which the reporter has been switched off or cells that still have the potential to produce iPSCs (Extended Data Fig. 1j–l).
Critically, the co-expression of OKSM and K36M led to a robust increase in iPSC formation from mouse granulocyte/macrophage progenitors and keratinocytes (Extended Data Fig. 2a,b) as well as from human fibroblasts, indicating that H3K36-methylation functions as a barrier to reprogramming beyond MEFs (Fig. 1k–m).
Transgene-independent, passaged iPSCs derived from OKSM/WT and OKSM/K36M MEFs were highly similar at the transcriptomic and epigenomic level (Extended Data Fig. 2c–j). Accordingly, both OKSM/WT and OKSM/K36M iPSCs gave rise to differentiating embryoid bodies (Extended Data Fig.k,l) and well-differentiated teratomas (Extended Data Fig.2m). K36M iPSCs also contributed to adult coat color chimeras upon blastocyst injections (Extended Data Fig. 2n).
K36M confers epithelial plasticity on cells
Analysis of gene expression data from cultures undergoing reprogramming (days 2–8) revealed that OKSM/K36M intermediates were on an accelerated trajectory compared to OKSM/WT samples, with day 8 samples being closest to established iPSCs (Fig. 2a, filled circles). Notably, in MEFs expressing K36M or WT H3.3 alone, we observed only minor effects on gene expression patterns, pointing to a synergistic effect between K36M and OKSM (Fig. 2a, open circles). While day-2 reprogramming intermediates were highly similar between the OKSM/WT and OKSM/K36M conditions, starting at day 4 we observed a more robust silencing of MEF-associated genes and a more robust induction of pluripotency-associated genes in OKSM/K36M cells compared to OKSM/WT cells (Fig. 2b). In agreement, transcriptional differences between OKSM/WT and OKSM/K36M cells at day 4 were largely attributable to fibroblast genes upregulated in OKSM/WT cells, and pluripotency genes upregulated in OKSM/K36M cells (Fig. 2c).
Fig. 2: K36M endows iPSC intermediates with transcriptional homogeneity and epithelial plasticity.

(a) Multidimensional scaling (MDS) plot of RNA-seq data based on genes with most variable expression among all timepoints and conditions. Filled circles, MEFs expressing both histone genes and OKSM for indicated number of days; open circles, MEFs expressing histone genes alone for 4 days.
(b) Heatmaps showing gene expression dynamics in WT and K36M reprogramming intermediates for genes differentially expressed between MEFs and iPSCs (n=2 biologically independent replicates).
(c) Scatter plot showing gene expression differences (RPKM at log2 scale) between WT and K36M reprogramming intermediates on day 4. Genes that are upregulated in iPSCs vs. MEFs are highlighted in green, genes that are downregulated in iPSCs vs. MEFs are highlighted in brown (n=2 biologically independent replicates were integrated for this analysis).
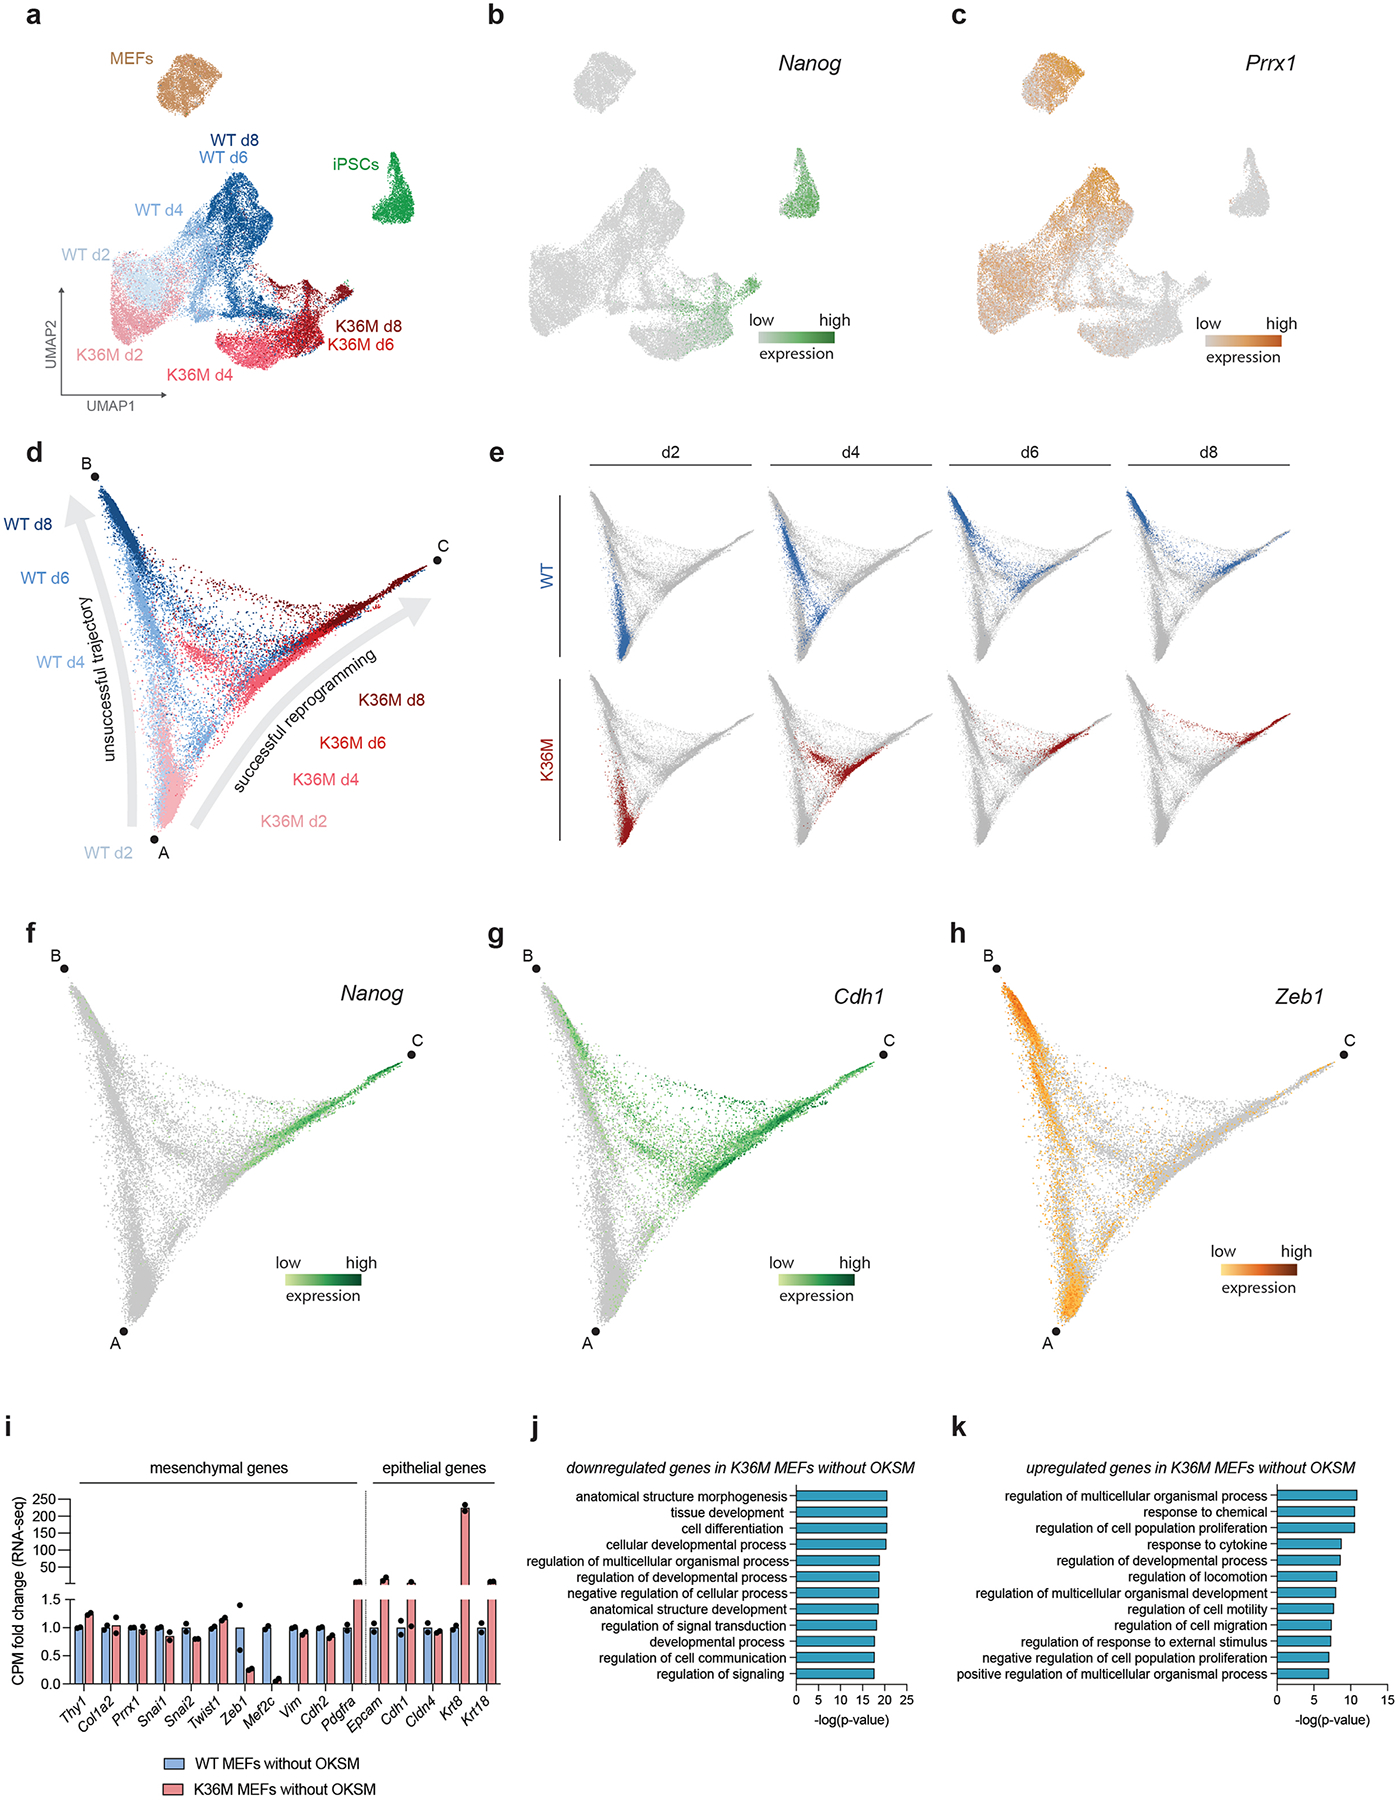
(d) UMAP embedding of single-cell RNA-seq data using MEFs, reprogramming intermediates on days 2, 4, 6, 8 for WT and K36M, as well as passaged iPSCs. For each indicated group, one sample was encapsulated leading to n=38,743 cells total.
(e) Expression of Nanog projected on the same UMAP embedding as shown in (d). Dashed circles highlight scattered expression of Nanog in WT cells (blue) on day 8 compared to homogeneous expression in K36M cells on days 6 and 8 (red).
(f) Quantification of transcriptional heterogeneity of indicated samples as measured by average distance between cells within each sample in the same UMAP embedding as shown in (d). Median values for all cells within each sample are plotted.
(g) Selected differentially expressed genes between WT and K36M samples that distinguish day 2 and day 4 intermediates.
(h) Expression of the mesenchymal regulator Zeb1 projected on the same UMAP embedding as shown in (d). Dashed circles highlight d2 and d4 samples for WT (blue) and K36M (red).
(i) Expression of epithelial gene Epcam projected on the same UMAP embedding as used in (d). Dashed circles highlight d2 and d4 samples for WT (blue) and K36M (red).
(j) Flow cytometric quantification of Epcam expression in WT vs. K36M reprogramming intermediates.
MEFs expressing OKSM exhibit a significant degree of heterogeneity with most cells undergoing cell cycle arrest or acquiring alternative fates47. To assess how K36M expression impacts these phenotypes, we performed single-cell RNA-seq of OKSM/WT and OKSM/K36M intermediates (Fig. 2d, Extended Data Fig. 3a). In agreement with our analysis of Oct4-GFP cells, we detected expression of the late pluripotency marker Nanog in only a rare subset of day-8 cells in OKSM/WT cultures whereas Nanog was already expressed in every cell at day 6 in OKSM/K36M cultures (Fig. 2e, dotted circles, Extended Data Fig. 3b). When we assessed the transcriptional similarity between single cells as a proxy for cellular heterogeneity, we found that OKSM/K36M intermediates exhibited as little heterogeneity as MEFs and established iPSCs, while OKSM/WT reprogramming intermediates exhibited an early, transient increase in heterogeneity, mirroring previous observations47 (Fig. 2f). Hence, K36M expression effectively neutralizes early reprogramming barriers typical of WT cells and prevents the formation of heterogeneous cell states refractory to iPSC formation.
Focusing on the earliest stages of reprogramming between day 2 and day 4, we noticed a marked downregulation of mesenchymal markers such as Col1a2, Zeb1 and Prrx1 and a homogeneous upregulation of epithelial markers such as Epcam, Cdh1 and Krt8 in OKSM/K36M intermediates (Fig. 2g–i, Extended Data Fig. 3c, Extended Data Fig. 4a,c–e). However, OKSM/WT cells largely maintained a mesenchymal program and only a small subset of cells expressed epithelial genes at these time points. We corroborated these observations with a diffusion model (Extended Data Fig. 3d,e), which shows that K36M cells uniformly progress along a successful reprogramming trajectory defined by Nanog and Cdh1 expression (Extended Data Fig. 3f,g), while the majority of WT cells follow an unproductive path defined by continued expression of the MEF gene Zeb1 (Extended Data Fig. 3h). Consistently, we observed a homogeneous upregulation of Epcam protein expression specifically in OKSM/K36M cells between days 2 and 4 using FACS and immunofluorescence analyses (Fig. 2j, Extended Data Fig. 4b). We note that some mesenchymal/epithelial genes (Extended Data Fig. 3i) as well as genetic programs linked to development and differentiation (Extended Data Fig. 3j,k) were already modulated in K36M MEFs without OKSM expression and likely contributed to reprogramming via the aforementioned priming effect of K36M (Extended Data Fig. 1e,f). Together, these observations suggest that K36M facilitates an efficient switch from a mesenchymal to an epithelial identity, a process previously shown to be important for the acquisition of pluripotency48,49.
K36M acts downstream of TGFβ and Smad2 but upstream of Zeb1
We next explored a possible molecular relationship between H3K36-methylation and TGFβ signaling as TGFβ ligands and downstream effectors are well-known regulators of mesenchymal identity and antagonists of epithelial identity50 (Fig. 3a). In OKSM/WT cells, inhibition of TGFβ signaling enhanced the fraction of Epcam+ and Oct4-GFP+ cells, while exposure to recombinant TGFβ abolished both Epcam and Oct4-GFP expression, confirming previous findings51 (Fig. 3b,c, Extended Data Fig. 5a,b). However, OKSM/K36M cells were insensitive to either TGFβ inhibition or recombinant TGFβ treatment, suggesting that K36M functions downstream of TGFβ signals (Fig. 3b,c, Extended Data Fig. 5a,b). Consistently, OKSM/K36M cells maintained low levels of mesenchymal genes and high levels of epithelial genes regardless of the presence of recombinant TGFβ or TGFβ inhibitor (Fig. 3d, Extended Data Fig. 5c–d), while TGFβ and TGFβ inhibitor elicited the expected mesenchymal and epithelial biased gene expression changes, respectively, in OKSM/WT cells. Furthermore, the modulation of TGFβ signaling led to a comparable change in phospho-Smad2 levels between OKSM/WT and OKSM/K36M cells, indicating that K36M exerts its effect downstream of this key TGFβ mediator (Fig. 3e).
Fig. 3: K36M acts downstream of TGFβ and Smad2 but upstream of Zeb1.

(a) Effects of TGFβ signaling on reprogramming.
(b) Flow cytometry for Epcam in day 8 reprogramming intermediates for WT and K36M samples. Untreated controls vs. cells treated with 250 nM Repsox (TGFβi) or 2.5 ng/ml recombinant TGFβ-1 or -2 (rTGFβ-1, rTGFβ-2).
(c) Fraction of Oct4-GFP+ cells in reprogramming cultures treated with TGFβi or rTGFβ-1/rTGFβ-2 on day 8. P values were determined by two-sided unpaired Student’s t test, error bars indicate mean ± SD (n=3 independent biological experiments).
(d) Heatmap showing gene expression (z-score) of mesenchymal and epithelial genes in WT and K36M reprogramming intermediates treated with either TGFβi or rTGFβ-1 (n=2 biologically independent replicates).
(e) Immunoblot analysis for phospho-Smad2, Smad2 and GAPDH in WT and K36M reprogramming intermediates treated with either TGFβi or rTGFβ-1. Blot is representative of three independent biological experiments.
(f) Epcam expression (fold-change) of WT and K36M reprogramming cultures (day 4) transfected with the indicated siRNAs relative to control. Error bars indicate mean ± SD (n=3 independent biological experiments).
(g) Fraction of Oct4-GFP+ cells in day 8 WT samples treated with control siRNA or siRNA targeting Zeb1. P values were determined by two-sided unpaired Student’s t test, error bars indicate mean ± SD (n=3 independent biological experiments).
(h) Flow cytometry for Epcam on day 4 in WT and K36M reprogramming intermediates transduced with empty vector or dox-inducible Zeb1.
(i) small RNA-seq of day-4 reprogramming intermediates. Heatmap of key pro-epithelial and pro-pluripotency miRNAs (n=2 biologically independent replicates).
(j) MEF-to-neuron conversion. Representative immunofluorescence images (scale bar = 50 μm) and quantification of Tubb3+ neurons (line = mean). P value determined by two-sided unpaired Student’s t test, n=3 biologically independent experiments.
(k) MEF-to-myotube conversion. Representative immunofluorescence images (scale bar = 50 μm) and quantification of Myh1+ myotubes (line = mean). P values determined by two-sided unpaired Student’s t test, n=3 biologically independent experiments.
(l) Epidermal stem cells exposed to recombinant TGFβ-1 (10 ng/ml). Representative images for phase and p63 immunofluorescence. Fraction of p63+ cells per field. P value determined by unpaired Student’s t test, error bars indicate mean ± SD (n=3 independent biological experiments).
To define TGFβ/Smad effector genes that are modulated by K36M, we perturbed candidate mesenchymal transcription factors with siRNAs. Suppression of Snai1, Snai2 and Twist1 levels had minimal effects on Epcam expression, whereas suppression of Zeb1 levels led to a >5-fold increase of Epcam+ cells in OKSM/WT cells and this effect was neutralized in OKSM/K36M cells (Fig. 3f). We observed a similar, albeit smaller effect when measuring Oct4-GFP expression, suggesting that K36M’s effect is in part attributable to Zeb1 downregulation (Fig. 3g). Strikingly, OKSM/K36M cells overexpressing Zeb1 failed to upregulate Epcam compared to control (Fig. 3h). These results suggest that Zeb1 is a downstream effector of H3K36-methylation critical for the maintenance of a mesenchymal state in our system. Since the effects of Zeb1 suppression on acquiring an epithelial/pluripotent state did not fully recapitulate the effects of K36M expression (Fig. 3g), we tested whether miRNAs previously implicated in both mesenchymal-to-epithelial transition (MET) and pluripotency induction may be involved. Indeed, we observed a robust upregulation of miRNAs that target mesenchymal regulators and favor an epithelial state, including miR-205 and the miR-200 family52,53, as well as of miRNAs that facilitate the acquisition of a pluripotent state, including the miR-290–295 and mirR-302 families (Fig. 3i, Extended Data Fig. 5e,f)54,55.
K36M modulates epithelial plasticity in diverse contexts
To test whether disrupted H3K36-methylation impacts mesenchymal/epithelial identity and TGFβ signaling more broadly, we measured the effects of K36M expression during MEF-to-induced neuron conversion using Brn2/Ascl1/Myt1l expression56, and during MEF-to-myocyte conversion using MyoD expression57. Consistent with the pro-epithelial effect of K36M during induced pluripotency, its forced expression led to a significant increase in the number of induced neurons from MEFs (Fig. 3j). However, K36M expression substantially reduced the formation of Myh1-positive myotubes from MEFs (Fig. 3k), indicating that a mature myogenic fate cannot be efficiently established from mesenchymal cells in the absence of H3K36-methylation. Notably, K36M expression did not interfere with the reprogramming of MEFs to muscle progenitors using a recently published protocol58,59, suggesting that H3K36-methylation is dispensable for the acquisition of a self-renewing myogenic state but essential for muscle differentiation (Extended Data Fig. 5g).
To investigate whether K36M’s effect on epithelial identity is conserved in cell fate transitions that do not involve ectopic transcription factor expression, we induced K36M in ESCs (Extended Data Fig. 5h,i) that were coaxed into gastruloids. This process mimics early stages of gastrulation and comprises an epithelial-to-mesenchymal transition (EMT)60–62. Control ESC cultures readily transitioned from a spherical to a tube-like structure typical of gastruloids, whereas K36M cultures remained spherical and failed to elongate, consistent with a requirement for H3K36-methylation to exit the pluripotent/epithelial state and acquire a differentiated/mesenchymal state (Extended Data Fig. 5j). Supporting these data, K36M also blocked EMT in a monolayer differentiation model from ESCs to pre-somitic mesoderm63, as inferred from a failure to induce N-Cadherin, Tbx6 and Msgn1 expression (Extended Data Fig. 5k). Thus, H3K36-methylation is critical in physiologically relevant models of early development involving an EMT switch.
We finally assessed whether K36M expression modulates TGFβ signaling in a physiological context that does not entail an EMT. Epidermal stem cells represent a classic type of epithelial stem cells that require TGFβ cues for proper differentiation in vivo64 and in vitro65. Thus, we generated epidermal stem cell cultures expressing either H3.3 WT or K36M. Acute withdrawal of TGFβ inhibitor and parallel addition of recombinant TGFβ led to the immediate flattening and differentiation of WT cultures as determined by the loss of cells expressing the epidermal stem cell marker p63 (Fig. 3l). By contrast, cultures expressing K36M retained p63 expression in a substantial fraction of cells, consistent with the notion that K36M partially phenocopies the effect of TGFβ inhibition.
H3K36me2 and H3K36me3 cooperatively safeguard cell identity
To determine whether K36M’s phenotype is driven by the disruption of H3K36me3, H3K36me2, or both marks, we modulated cognate histone methyltransferases/demethylases during reprogramming (Extended Data Fig. 6a). The suppression of individual methyltransferases (Nsd1/Nsd2 for H3K36me2, Setd2 for H3K36me3) had only subtle effects on the formation of Epcam+ intermediates and iPSC colonies (Extended Data Fig. 6b). By contrast, the combined suppression of Nsd1/Nsd2 and that of Nsd1/Nsd2/Setd2 had the strongest beneficial effect on the formation of Epcam+ cells in WT fibroblasts. Conversely, the overexpression of Nsd2 in WT cells significantly reduced reprogramming efficiency and this effect was neutralized by K36M expression (Extended Data Fig. 6c,d). Corroborating these results, siRNA-mediated inhibition of the H3K36me2 demethylases Kdm2a and Kdm2b significantly reduced reprogramming efficiency (Extended Data Fig. 6e–h), whereas knockdown of the H3K36me3 demethylases Kdm4a and Kdm4c had no effect. Consistently, the overexpression of Kdm2a, Kdm2b and Kdm4a strongly increased reprogramming efficiency while the overexpression of Kdm4c had only a subtle beneficial effect (Extended Data Fig. 6i–k). Of relevance, Kdm4a was shown to demethylate not only H3K36me3 but also H3K36me266, suggesting that K36M’s effect on reprogramming is largely driven by the depletion of H3K36me2 levels while the parallel depletion of H3K36me3 levels has a supportive role.
K36M alters H3K36me2/3 deposition and gene expression
To understand how K36M facilitates the extinction of a mesenchymal identity and the acquisition of an epithelial/pluripotent identity at a chromatin level, we assessed the epigenome of day-4 reprogramming intermediates. As expected, H3K36me3 was enriched over gene bodies and progressively increased with gene expression levels in OKSM/WT cells, whereas this mark was globally depleted in OKSM/K36M cells with the exception of the most highly expressed genes that retained residual H3K36me3 levels (Fig. 4a,b, Extended Data Fig. 7a–d). Together with our functional data on H3K36me3-specific histone-modifying enzymes, these results suggest that H3K36me3 depletion contributes to the extinction of the somatic program, while residual H3K36me3 levels at highly expressed genes may facilitate the induction of epithelial and pluripotency programs.
Fig. 4: K36M decommissions MEF enhancers and activates ESC enhancers.

(a) Profile plot of mean H3K36me3 density over gene bodies ± 10kb. TSS, transcription start site, TES, transcription end site (n=2 biologically independent replicates were integrated for this analysis).
(b) H3K36me3 deposition at differentially expressed genes (n=2,068) for WT (blue) and K36M (red) samples on day 4 of reprogramming. Center line indicates median (n=2 biologically independent replicates were integrated for this analysis).
(c) Profile plot of median H3K36me2 density over H3K36me2 domains (n=2 biologically independent replicates were integrated for this analysis).
(d) Scatter plot showing expression of genes proximal to or overlapping with H3K36me2 domains in WT and K36M samples. Red = upregulated, blue = downregulated genes in OKSM/K36M vs. OKSM/WT cells on day 4 (n=2 biologically independent replicates were integrated for this analysis).
(e) Heatmaps showing signal intensities for H3K36me2 and H3K27me3 at H3K36me2 domains including a 2kb flanking region (n=2 biologically independent replicates were integrated for this analysis).
(f) Heatmaps showing signal intensities for H3K36me2, H3K27ac and chromatin accessibility (ATAC-Seq) around differentially regulated (> 2-fold) enhancers within H3K36me2 domains. Enhancers were called by measuring H3K27ac abundance in regions proximal to H3K36me2 domains excluding promoters (n=2 biologically independent replicates were integrated for this analysis).
(g) Scatter plot showing H3K27ac abundance at enhancers embedded within H3K36me2 domains in WT and K36M reprogramming intermediates (n=2 biologically independent replicates were integrated for this analysis). Colors show overlap with MEF (beige) or ESC enhancers (green)75.
(h) Fraction of differentially regulated (> 2-fold) enhancers embedded within H3K36me2 domains and overlapping with MEF (beige) or ESC enhancers (green) in WT and K36M reprogramming intermediates75.
(i) H3K4me3 enrichment at enhancer-proximal promoters (n=3,687) in WT and K36M cells on day 4, and of corresponding RNA expression. Center line indicates median (n=2 biologically independent replicates were integrated for this analysis).
(j, k) Representative tracks of mesenchymal gene Vim, and of epithelial gene Cdh1 in WT and K36M reprogramming intermediates on day 4 (n=2 biologically independent replicates). Putative regulatory elements are highlighted in grey.
H3K36me2 signal was distributed over broad intergenic and genic regions including enhancers and promoter-proximal introns in OKSM/WT control cells, confirming and extending previous observations67,68 (Fig. 4c). OKSM/K36M cells showed genome-wide depletion of this mark across these broad H3K36me2 domains and other genomic features (Fig. 4c, Extended Data Fig. 7e). Notably, H3K36me2-depleted domains in OKSM/K36M cells were associated with a similar number of upregulated (n=910) and downregulated (n=1,053) genes associated with epithelial/pluripotent and mesenchymal identity, respectively (Fig. 4d). Supporting the instructive role of H3K36me2 in driving these gene expression changes, the forced expression of Kdm2a in OKSM/WT MEFs was sufficient to drive the downregulation of fibroblast genes and the upregulation of epithelial/pluripotency genes (Extended Data Fig. 6l).
K36M decommissions MEF enhancers and activates ESC enhancers
To understand how K36M-dependent H3K36me2 depletion leads to both gene activation and gene silencing, we mapped the deposition of the repressive H3K27me3 mark known to antagonize H3K36-methylation68–70. Only a fraction of H3K36me2-depleted domains gained H3K27me3, while the remaining domains showed little or no H3K27me3 accumulation (Fig. 4e, Extended Data Fig. 8a). Genes located within H3K36me2-depleted domains that gained H3K27me3 were enriched for ontology terms related to signal integration (Extended Data Fig. 8b), in line with our earlier findings linking H3K36-methylation to TGFβ signaling (Fig. 3). Moreover, TGFβ-responsive genes that were downregulated in K36M cells (Fig. 3d) gained H3K27me3 at their promoters consistent with a role of PRC2 in their silencing (Extended Data Fig. 8c). Indeed, when we suppressed the PRC2 components Ezh2 and Suz12 using siRNAs in OKSM/K36M cells, we observed a reduction in reprogramming efficiency and a delayed silencing of mesenchymal genes (Extended Data Fig. 8d–h).
Recent studies suggested that H3K36-methylation can have differential effects on transcription depending on the chromatin context71–74. We therefore investigated whether H3K36me2 depletion leads to locus-specific effects on regulatory elements during reprogramming (Fig. 4f, Extended Data Fig. 7f). Indeed, a subset of enhancers within H3K36me2-depleted domains exhibited reduced H3K27ac levels and chromatin accessibility in OKSM/K36M cells; these enhancers were enriched for MEF enhancers (Fig. 4f–h). By contrast, enhancers within H3K36me2-depleted domains that gained H3K27ac signal and chromatin accessibility were enriched for pluripotency enhancers (Fig. 4f–h). Gene ontology analysis of these two enhancer groups showed an overrepresentation of mesenchymal and epithelial terms (Extended Data Fig. 7h,i), and their genomic locations were enriched for binding sites of regulatory factors linked to mesenchymal (e.g., Fosl1, Cebpb) and epithelial/pluripotent (e.g., Oct4, Nanog) identity, respectively (Extended Data Fig. 7j). Accordingly, promoters proximal to enhancers that lost H3K27ac concomitantly lost H3K4me3 levels and associated genes were downregulated (e.g., Vim, Prrx1), while promoters proximal to enhancers that gained H3K27ac concomitantly increased H3K4me3 levels and associated genes were upregulated (e.g., Cdh1, Pou5f1) (Fig. 4i–k, Extended Data Fig. 7g). Collectively, our results demonstrate that H3K36me2 depletion differentially impacts enhancer activity in OKSM/K36M cells, leading to the parallel induction and repression of opposing lineage programs, respectively.
K36M rewires transcription factor binding preferences
K36M expression could replace Oct4 or Klf4 expression during reprogramming, while Sox2 expression was essential, suggesting that Sox2 is key for mediating the effects of K36M (Extended Data Fig. 9a). To understand how K36M expression collaborates with Sox2 to activate enhancers, we determined Sox2’s chromatin binding patterns on day 4 of reprogramming. Genomic Sox2 occupancy was strongly correlated with H3K27ac deposition in OKSM/K36M cells, consistent with the established role of Sox2 as an enhancer-bound factor (Extended data Fig. 9b). Of relevance, Chronis et al. previously demonstrated that OKS predominantly bind to ectopic targets associated with an active chromatin signature (MEF enhancers/promoters) early in reprogramming before robustly engaging with pluripotency-specific targets (ESC enhancers) late in reprogramming75. Strikingly, we observed a marked, K36M-dependent reduction in Sox2 binding to ectopic targets such as Acta2, Vim and Zeb1 and a parallel increase in Sox2 binding to ESC-specific targets such as Pou5f1, Cdh1 and Lefty1 (Fig. 5a–c), with H3K36me2 levels being similarly depleted across both types of targets (Extended Data Fig. 9c). We confirmed this differential enrichment using an independent set of iPSC-associated Sox2 sites (Extended Data Fig. 9d). Mirroring the increase in Sox2 signal, H3K27ac and chromatin accessibility were also increased at ESC-specific sites in OKSM/K36M cells (Extended Data Fig. 9b,e). These results suggest that K36M-dependent chromatin rewiring reduces the early, inappropriate binding of pluripotency factors to ectopic/somatic targets while it promotes their binding to epithelial/pluripotency targets.
Fig. 5: K36M-dependent chromatin rewiring alters transcription factor binding preferences.

(a) Scatter plots showing Sox2 occupancy at sites specific to early reprogramming intermediates (“ectopic”, left panel) and ESCs (“ESC-specific”, right panel) between WT and K36M reprogramming intermediates (n=2 biologically independent replicates were integrated for this analysis).
(b) Representative tracks showing ectopic Sox2 binding to the Acta2 promoter (n=2 biologically independent replicates).
(c) Representative tracks showing ESC-specific Sox2 binding at the proximal enhancer of Pou5f1 (n=2 biologically independent replicates).
(d) DNA methylation at ectopic and ESC-specific Sox2 binding sites using published Methyl-seq data of MEFs (n=2) and RRBS data of ESCs (n=2)80,81.
(e) Scatter plots of differentially methylated regions (DMRs) between WT and K36M reprogramming intermediates on day 4 and day 8 (n=2 biologically independent replicates were integrated for this analysis). DMRs overlapping ESC-specific Sox2 binding sites are highlighted in purple.
(f) Heatmaps showing percent DNA methylation at ectopic and ESC-specific Sox2 binding sites in MEFs, reprogramming intermediates on d4 and d8, and passaged iPSCs (n=2 biologically independent replicates for d4 and d8 samples, one sample for each genotype in uninduced MEFs and iPSCs).
(g) Profile plots showing enrichment of Sox2 (left panel) and H3K36me2 (right panel) over differentially demethylated regions in WT (blue) and K36M (red) reprogramming intermediates on day 4 (n=2 biologically independent replicates were integrated for this analysis).
(h) DNA methylation at ectopic and ESC-specific Sox2 binding sites in WT, Dnmt3a knockout (KO), and Dnmt3b KO MEFs80, as well as in WT and Tet triple KO (TKO) ESCs81 (n=2).
(i) Representative tracks showing DNA methylation at the Pou5f1 locus in reprogramming intermediates (RRBS) and WT/Dnmt3a KO/Dnmt3b KO MEFs (Methyl-Seq)80 (n=2 biologically independent replicates).
We hypothesized that differential DNA methylation patterns between OKSM/K36M and OKSM/WT cells could underlie the observed Sox2 binding preferences because DNA methylation typically restrains transcription factor binding76,77 and H3K36me2/3 have been shown to target DNA methylation via Dnmt3a/b78,79. Indeed, our analysis of published DNA methylation data and chromatin accessibility patterns suggested that ectopic Sox2 sites are normally hypomethylated in MEFs and ESCs, whereas ESC-specific Sox2 targets are hypermethylated and inaccessible in MEFs but demethylated and accessible in ESCs (Fig. 5d, Extended Data Fig. 9f). When we applied RRBS to our OKSM/K36M and OKSM/WT cells, we observed a striking, K36M-specific loss of DNA methylation during reprogramming (Fig. 5e) including at sites that are normally methylated in ESCs/iPSCs (Extended Data Fig. 9g). Consistent with our previous meta-analysis, we found that ectopic Sox2 targets were largely hypomethylated in our MEFs and iPSCs, while over two thirds of ESC-specific Sox2 targets were methylated in our MEFs but demethylated in our iPSCs (Fig. 5f). Notably, K36M facilitated a profound and progressive demethylation of ESC-specific Sox2 targets, reaching levels akin to ESCs at day 8 of reprogramming. In line with this finding, we observed a strong enrichment of Sox2 binding, but a depletion of H3K36me2 deposition, over hypomethylated regions in OKSM/K36M cells at day 4 (Fig. 5e,g) including at the Cdh1, Krt8, miR-290-295 and Pou5f1 loci (Extended Data Fig. 9h–k). These results suggest that the timely and effective Sox2 binding to ESC-associated targets is typically restrained by DNA methylation but enabled by K36M expression.
We failed to detect differences in the methylation of ectopic Sox2 sites between WT, Dnmt3a−/− and Dnmt3b−/− MEFs80, suggesting that these sites are not regulated by the de novo methyltransferases (Fig. 5h). However, ESC-specific Sox2 sites showed reduced DNA methylation in Dnmt3a−/− MEFs (Fig. 5h,i) and elevated methylation in Tet1/2/3-deficient ESCs81 compared to ectopic Sox2 sites, consistent with the notion that de novo methyltransferases and Tet enzymes compete for targets in ESCs82. Methylation differences between enhancers that were more or less active in OKSM/K36M cells relative to OKSM/WT cells may be due in part to differences in CpG density (Extended Data Fig. 9l). These findings suggest that H3K36me2 depletion at enhancers leads to an attenuated de novo methylation via Dnmt3a, which in turn facilitates Tet-dependent demethylation and activation of target genes.
K36M-dependent enhancer activation requires Tet activity
To investigate whether Tets play a functional role in the activation of epithelial/pluripotency genes83–85 in our system, we measured the levels of 5-hydoxymethylcytosine (5hmC), which is the Tet-catalyzed product of 5mC. We observed a strong 5hmC signal in OKSM/K36M cells that was absent in the starting MEFs and OKSM/WT intermediates (Fig. 6a). To determine whether this genomic demethylation is required for enhanced iPSC generation in OKSM/K36M cells, we treated cultures with the small molecule DMOG previously shown to inhibit Tet enzymes58,86,87. DMOG-treated OKSM/K36M cultures exhibited a reduction of 5hmC levels commensurate with OKSM/WT cultures and untreated MEFs, and it abrogated the demethylation of ESC-specific Sox2 binding sites and enhancers more active in K36M cells (Fig. 6a, Extended Data Fig. 10a,b). Consequently, DMOG treatment abolished the formation of Epcam+ and Oct4-GFP+ cells in OKSM/K36M cells (Fig. 6b,c). We observed similar results upon suppression of Tet1, Tet2 and Tet3 using shRNAs (Extended Data Fig. 10c,d) and confirmed the attenuated upregulation of the ESC-associated genes Epcam, Pou5f1 and miR-290 in DMOG-treated OKSM/K36M cells (Fig. 6d, Extended Data Fig. 10e). By contrast, the MEF-associated gene Vim continued to be effectively downregulated in the presence of OKSM/K36M and DMOG, underscoring the Tet-independent regulation of mesenchymal genes (Fig. 6d). Moreover, Dnmt3a/b overexpression neutralized the beneficial effect of K36M on reprogramming and led to increased Cdh1 methylation, supporting the antagonistic roles of Tet and Dnmt3 enzymes in the regulation of epithelial/pluripotency genes (Fig. 6e, Extended Data Fig. 10f,g). Hence, depletion of H3K36-methylation facilitates reprogramming via disrupting the balance between Dnmt3a/b and Tet enzymes at regulatory elements of epithelial/pluripotency genes, leading to their demethylation and activation.
Fig. 6: DNA demethylation is limiting for K36M-dependent enhancer activation and reprogramming.

(a) Dot blot assay to quantify 5hmC levels in MEFs as well as day 4 WT and K36M reprogramming intermediates in the presence and absence of DMOG (1 mM).
(b) Flow cytometric quantification of Epcam levels on day 4 of reprogramming in untreated or DMOG-treated WT and K36M intermediates.
(c) Quantification of Oct4-GFP+ cells detected in day-4 K36M reprogramming intermediates in the presence or absence of DMOG. P value determined by two-sided unpaired Student’s t test, error bars indicate mean ± SD (n=3 independent biological experiments).
(d) Relative expression of the fibroblast gene Vim, the epithelial gene Epcam and the pluripotency gene Pou5f1 in untreated and DMOG-treated K36M intermediates. Error bars indicate mean ± SD (n=3). P values were determined by two-sided unpaired Student’s t test.
(e) Fraction of Oct4-GFP+ K36M cultures transduced with either an empty vector or dox-inducible overexpression vectors for Dnmt3a and Dnmt3b, error bars indicate mean ± SD (n=3 independent biological experiments).
(f) Quantification of Sox2, H3K27ac, and H3K27me3 levels at sites that are gained or lost in K36M vs. WT samples and the effect of DMOG on these enrichment patterns (K36M only). Center line indicates median (n=2 biologically independent replicates were integrated for this analysis).
(g) Representative gene tracks (K36me2, H3K27ac, H3K27me3, Sox2, WGBS) showing the mesenchymal gene Prrx1 and the epithelial gene Cdh1 for WT, K36M, K36M+DMOG conditions on day 4 of reprogramming (n=2 biologically independent replicates).
(h) Schematic of DMOG washout experiment (top), and quantification of Oct4-GFP+ cells on day 8 of reprogramming (bottom). K36M cells were either left untreated (Ctrl) or treated with DMOG for 8 days (DMOG d0-d8) or 4 days, (DMOG d0-d4). P values were determined by two-sided unpaired Student’s t test, error bars indicate mean ± SD (n=3 biologically independent experiments).
(i) Summary highlighting the dual role of K36M-mediated H3K36me2 depletion on active mesenchymal vs. repressed epithelial and pluripotency genes.
To dissect how impaired DNA demethylation affects regulatory elements in our system, we assessed the epigenome of OKSM/K36M reprogramming intermediates in the presence and absence of DMOG. H3K36me2 was depleted to a similar extent in control and DMOG samples expressing K36M (Extended Data Fig. 10h). Strikingly, DMOG treatment neutralized the K36M-dependent gain of H3K27ac and Sox2 peaks while the K36M-dependent redistribution of H3K27me3 remained largely unaffected (Fig. 6f). For example, at the mesenchymal gene Prrx1, we observed efficient depletion of H3K36me2, H3K27ac and Sox2 signal over the enhancer region and a concomitant gain of H3K27me3 over the promoter region in DMOG-treated OKSM/K36M cells (Fig. 6g). However, at the epithelial/pluripotency gene Cdh1, we observed that DMOG treatment blocked demethylation and attenuated the increase in H3K27ac and Sox2 binding at the enhancer (Fig. 6g, Extended Data Fig. 10i–k). Together, these results suggest that inhibition of Tet enzymes uncouples K36M-dependent ESC enhancer activation, which is Tet-dependent, from MEF enhancer decommissioning, which is Tet-independent.
Finally, we determined whether the restoration of Tet function by withdrawal of DMOG from OKSM/K36M reprogramming cultures could restore their ability to acquire pluripotency. Remarkably, removal of DMOG from OKSM/K36M cultures that had been treated with dox and DMOG for 4 days progressed from an Epcam−/Oct4-GFP− state to an Epcam+/Oct4-GFP+ state in virtually every cell after as little as 4 days of additional dox treatment (Fig. 6h), thus catching up to OKSM/K36M cultures exposed to dox alone for the entire time period. These data imply that demethylation of epithelial/pluripotency genes is the key limiting factor for acquiring an epithelial and subsequently a pluripotent state in OKSM/K36M cells.
Discussion
Here, we provide evidence that H3K36-methylation effectively reinforces cell identity via two complementary mechanisms that differentially impact gene expression (Fig. 6i). First, H3K36-methylation sustains the expression of cell type-specific genes by keeping associated enhancers and gene bodies in a euchromatic, transcriptionally active state. This mechanism relies on the known ability of H3K36me2/3 to antagonize the repressive H3K27me3 mark and is consistent with previous observations in cancer cell lines88. Second, H3K36-methylation aids in the silencing of alternative lineage genes by maintaining associated enhancers in a methylated and closed chromatin state that opposes the binding of lineage-specific transcription factors. During reprogramming, this dual mechanism manifests itself as an enhanced decommissioning of mesenchymal enhancers leading to reduced ectopic OKSM binding, as well as an increased activation of pluripotency enhancers due to elevated OKSM binding to demethylated ESC-specific targets. Mechanistically, our data suggest that DNA methylation of regulatory elements uncouples MEF enhancers that are decommissioned and transcriptionally silenced (methylation-independent) from pluripotency enhancers that are commissioned and transcriptionally activated (methylation-sensitive). We propose that the ultimate outcome of perturbed H3K36-methylation on cell fate will be context-specific and dependent on the pre-existing chromatin and DNA methylation state as well as the availability of fate-instructive transcription factors.
In addition to illuminating the molecular basis by which K36M impacts cell identity, we establish a functional relationship between H3K36-methylation and TGFβ signaling. As K36M blocks signal integration independent of TGFβ and Smad phosphorylation, we propose that H3K36-methylation acts as an epigenetic relay mechanism for TGFβ signaling by modulating the ability of Smad proteins to access relevant chromatin targets such as Zeb189. Our finding that H3K36-methylation maintains a mesenchymal identity and resists acquisition of an epithelial identity is also supported by the recent identification of H3K36me2/3-modifying enzymes as modulators of epithelial plasticity in pancreatic cancer cell lines, suggesting a conserved mechanism across both physiological and pathological contexts88.
Our data have implications for regenerative medicine and the treatment of cancer. For example, NSD1 and H3K36M mutations were recently detected in a subset of head and neck squamous cell carcinomas associated with genomic hypomethylation and impaired differentiation90. Supporting this notion, we show that squamous stem cells expressing K36M indeed maintain expression of basal stem cell markers when exposed to differentiation cues. Furthermore, our data suggest that modulation of H3K36-methylation via K36M could be a simple approach to generate patient-specific human iPSCs or induced neurons at high efficiency. Beyond K36M, a recent study identified over one hundred additional mutants covering all histone genes and diverse types of cancer25. These mutations, like K36M, are thought to dominantly block methylation, and we speculate that their manipulation in experimental model systems should facilitate mechanistic insights into cell identity maintenance that have so far remained obscured by the study of the respective histone-modifying enzymes alone.
Materials and Methods
EXPERIMENTAL PROCEDURES:
Derivation of mouse embryonic fibroblasts
After timed mating, embryos were dissected from pregnant females at E14.5. Head, limbs, and internal organs were removed; the remaining tissue minced and incubated in Trypsin-EDTA, cells were then expanded after quenching with MEF medium (DMEM, 10% FBS, MEM/NEAA, GlutaMAX, Penicillin/Streptomycin). 8–10 week-old male and female mice of the following strains were used for breeding setups: Col1a1::tetO-OKSM with an EGFP reporter in the 3’ UTR of the Pou5f1 gene, Col1a1::tetO-H3.3, Col1a1::tetO-K36M, Rosa26::M2-rtTA.
For reprogramming experiments, MEFs were derived from crosses leading to M2-rtTA at the Rosa26 locus (heterozygous), an EGFP reporter in the 3’UTR of Pou5f1, an inducible OKSM cassette in one Col1a1 locus, and inducible H3.3 WT or K36M in the other Col1a1 locus. For additional experiments, MEFs were generated with the same setup, but without a polycistronic OKSM cassette. Mice used in this study were housed and bred in specific-pathogen-free rooms located in the AAALAC-accredited Center for Comparative Medicine vivarium at Massachusetts General Hospital. Mice were housed in ventilated cages on a standard 12 h:12 h light cycle. All procedures involving mice adhered to the guidelines of the approved Massachusetts General Hospital Institutional Animal Care and Use Committee (IACUC) protocol no. 2006N000104.
Vectors
Lentiviral vectors for the dox-inducible expression of WT H3.3, K4M, K9M, K27M, K36M, Zeb1, MyoD, Kdm2a, Kdm2b, Kdm4a, Kdm4c, Nsd2, Dnmt3a, Dnmt3b and an empty vector were purchased from VectorBuilder. Lentiviral vectors for the expression of shRNAs targeting Tet enzymes were also purchased from Vectorbuilder. FUW-TetO-Ascl1, FUW-TetO-Brn2, and FUW-Myt1l were gifts from Marius Wernig (addgene 27150, 27151, 27152)56. pHAGE2-TetOminiCMV-SKM, -OSM, and -OKM were gifts from Hans Schöler (addgene 136551, 136555, 136554)92 pHAGE-STEMCCA vectors were used for constitutive and dox-inducible expression of OKSM as previously described93. pLV-EF1a-IRES-Blast was a gift from Tobias Meyer (addgene 85133). H3.3 WT and K36M were introduced using Gibson Assembly (New England Biolabs).
Induction of pluripotency
MEFs and GMPs with dox-inducible expression of OKSM and H3.3 WT or K36M were cultured as described previously94. FBS/LIF medium consisted of KO-DMEM, 15% deactivated FBS, Glutamax, MEM/NEAA, 1000 U/mL leukemia inhibitory factor (LIF) and 50 μM beta-mercaptoethanol. Combinations of doxycycline (2 μg/mL, Sigma-Aldrich), ascorbic acid (50 μg/mL, Sigma-Aldrich), and GSK3-inhibitor CHIR99021 (3 μM, Axon Medchem) were supplemented (AGi medium). For reprogramming of GMPs, SCF (20 ng/ml, Peprotech), IL-3 (10 ng/ml, Peprotech) and IL-6 (10 ng/ml, Peprotech) were added for the first 72h. For keratinocyte reprogramming, cells with dox-inducible expression of OKSM were lentivirally transduced with dox-inducible H3.3 WT or K36M vectors and cultured in SAGM medium (Lonza) supplemented with CHIR99021 (Tocris), Y27632 (Tocris), and A-8301 (Tocris)65. After two days of reprogramming, medium was changed to a 1:1 split with FBS/LIF. After two more days, cells were cultured in only FBS/LIF medium. Alkaline phosphatase staining was performed using a Vector Red kit (Vector Labs) according to the manufacturer’s recommendations.
Human fibroblasts (BJ, CRL-2522 ATCC) cultured in DMEM/10% FBS were lentivirally transduced for the constitutive expression of H3.3 WT or K36M. STEMCCA lentivirus was introduced for the constitutive expression of OKSM, cells were seeded on Matrigel-coated plates. Four days after transduction, medium was switched to ReproTeSR (Stem Cell Technologies). Alkaline phosphatase staining was performed as described above.
Teratoma formation assay
Approximately 2 × 10⁶ cells were injected subcutaneously into 8 week old female athymic nude mice (NU/J, Jackson Laboratories). Teratomas were monitored and removed when tumor size reached 1 cm or tumors ulcerated. Tumors were then processed for haematoxylin/eosin staining.
Blastocyst injections
To generate coat-color chimeras from iPSCs derived with transient expression of K36M, iPSCs were injected into albino B6 blastocysts at embryonic day 3.5 as previously described95,96.
MEF to neuron conversion
MEFs with dox-inducible expression of H3.3 WT or K36M were infected with dox-inducible lentiviral vectors (FUW-TetO-Ascl1, FUW-TetO-Brn2, and FUW-TetO-Myt1l) in MEF growth medium and plated on matrigel. After two days, medium was changed to neuron induction medium supplemented with dox56. After three days of half-medium changes, cells were fixed and stained for Tubb3 (Biolegend 801201).
MEF to myotube conversion, MEF to iMPC de-differentiation
MEFs with dox-inducible expression of WT H3.3 or K36M were transduced with a dox-inducible lentiviral vector for expression of MyoD. Cells were then cultured as previously described58,59.
Gastruloid generation
Gastruloids were generated as described previously61,62. Briefly, KH2 ESCs inducibly expressing H3.3 WT or K36M (FBS/LIF) were plated in ultra-low attachment round-bottom 96-well plates (300 cells/well) in N2B27 medium and pulsed with 3μM CHIR99021 for 24h on day 2 after plating. Elongation was assessed at day 5.
Pre-somitic mesoderm differentiation
Pre-somitic mesoderm differentiation was induced as described previously63. In brief, KH2 ESCs inducibly expressing H3.3 WT or K36M (2i/LIF) were plated in N2B27 medium supplemented with 25 ng/ml Activin A (Peprotech) and 12 ng/ml bFGF (Peprotech). After 48h, medium was changed to high-glucose DMEM supplemented with GlutaMax, sodium pyruvate, MEM-NEAA, 15% FBS, 50 μM beta-mercaptoethanol, 3 μM CHIR99021 (Axon Medchem), and 0.5 μM LDN193189 (Tocris). 48h later, cells were fixed for immunofluorescence or RNA was harvested.
Embryoid body generation
Mouse iPSCs were re-suspended in MEF medium, then centrifuged in anti-adherence micro-well plates (Stem Cell Technologies). After 24h, cell aggregates were transferred into low-adherence plates (Stem Cell Technologies) and cultured for 4 more days.
Keratinocyte culture
Keratinocytes were derived from a Rosa26-rtTA mouse, lentivirally transduced with vectors for the dox-inducible expression of WT H3.3 or K36M, and cultured as previously described65. To assess the effect of K36M expression on TGFβ signaling in this system, A-83–01 was removed and replaced with recombinant TGFβ-1 (Peprotech) at 10 ng/ml after two days of dox treatment. Cells were fixed and stained after four more days of culture.
qRT-PCR
qRT-PCR reactions were set up in triplicate using Brilliant III SYBR Master Mix (Agilent) and run on a LightCycler 480 PCR machine (Roche) with 40 cycles of 30s at 95°C, 30s at 60°C and 30s at 72°C. Fold change was calculated using the ΔΔCt method, data was normalized to Gapdh. Kicqstart primers were purchased from Sigma-Aldrich for mouse Epcam, Cdh1, Vim, and for human EPCAM, CDH1, LIN28A, NANOG, and GAPDH.
For miRNA analysis, cDNA was generated using a TaqMan™ MicroRNA Reverse Transcription Kit according to the manufacturer’s recommendations, and reactions were set up in triplicate with the TaqMan Universal PCR Master Mix (no AmpErase UNG, Applied Biosystems) and miRNA-specific TaqMan MicroRNA assays (TaqMan MicroRNA mmu-miR-290 assay ID: 000187, TaqMan MicroRNA hsa-miR-200b assay ID: 002251, TaqMan MicroRNA hsa-miR-205 assay ID: 000509, TaqMan Array MicroRNA U6 snRNA, assay ID: 001973, all Life Technologies). Reactions were run on a LightCycler 480 PCR machine (Roche) with 40 cycles of 15 s at 95°C and 1 min at 60°C. Fold change was calculated using the ΔΔCt method, data was normalized to U6.
Flow cytometry of tissue cultures
Surface marker staining was performed using dye-conjugated antibodies against Thy1 (anti-Mouse Thy1.2 eFluor 450, Thermo Fisher Scientific), SSEA-1 (anti-Human/Mouse SSEA-1 eFluor 660, Thermo Fisher Scientific), EpCAM (anti-Mouse EpCAM PE, Thermo Fisher Scientific). Intracellular staining was performed using a Fix & Perm Kit (Thermo Fisher Scientific) and an antibody targeting Nanog (Anti-Nanog antibody ab80892, Abcam). CellTrace-Violet (Thermo Fisher Scientific) staining and Annexin-V/PI (Thermo Fisher Scientific) staining were performed according to the manufacturer’s recommendations. Data was acquired on an LSRII flow cytometer (BD Biosciences) using Diva v6.1.2 (BD Biosciences).
Bone marrow preparation and flow cytometry
Bone marrow from was incubated in RBC lysis buffer (Biolegend) for 8 min on ice. 40–50 million cells were applied for lineage depletion according to the manufacturer’s recommendations (Miltenyi Biotech). The cells were stained as follows to sort GMPs: Lineage markers (Ter119 (PE/Cy5; Thermofisher, Cat# 15-5921-83), CD3e (PE/Cy5; Biolegend, Cat# 100310), Gr1 (PE/Cy5; Thermofisher, Cat# 15-5931-83); B220/CD45R (PE/Cy5; Biolegend, Cat# 103210); TCRb (PE/Cy5; Thermofisher, Cat# 15-5961-83); CD4 (PE/Cy5; Thermofisher, Cat# 15-0041-83); CD8a (PE/Cy5; Biolegend, Cat# 100710); Sca1 (PE/Cy7; Thermofisher, Cat# 25-5981-82); c-Kit (APC-eFluor 780; Thermofisher, Cat# 47-1171-82); CD34 (FITC; Thermofisher, Cat# 11-0341-85); CD16/32 (FC gamma receptor) (PE; BD Biosciences, Cat# 553145); DAPI (BD Biosciences, Cat#564907). Antibodies were diluted to 1 μl/million cells.
Immunofluorescence assays
The following primary antibodies were used: anti-H3K36M (Anti-Histone H3 K36M Rabbit Monoclonal Antibody, Clone RM193, RevMab), anti-H3K36me3 (abcam 9050, Thermo Fisher MA5–24687), anti-H3K36me2 (active motif 39256), anti-Sox2 (Cell Signaling 23064), anti-Nanog (abcam 80892) anti-Epcam (Life Technologies 14-5791-81), anti-Vim (Cell Signaling 5741), anti-Tubb3 (Biolegend 801201), anti-Myh1 (Developmental Studies Hybridoma Bank, Iowa MF20), anti-p63 (Santa Cruz sc-8431), anti-Cdh2 (Cell Signaling 13116).
Western blot assay
Immunoblotting was performed using the following antibodies: GAPDH (Cell Signaling 8884), phospho-Smad2 Ser465/467 (Cell Signaling 3108), Smad2 (Cell Signaling 5339). Images were taken using a ChemiDoc Imaging system with enhanced chemiluminescence detection.
Mass spectrometry of histone PTMs
Bulk histones were acid-extracted from cell pellets, propionylated and subjected to trypsin digestion as described previously97. Samples were analyzed on a triple quadrupole (QqQ) mass spectrometer (Thermo Fisher TSQ Quantiva) directly coupled with an UltiMate 3000 Dionex nano-liquid chromatography system. Targeted analysis of unmodified and various modified histone peptides was performed. The process was repeated three separate times for each sample.
Dot blot assay
DNA samples were sonicated to generate fragments of 200–500bp length. After denaturizing, samples were spotted on nitrocellulose membranes in a Bio-Dot apparatus (Bio-Rad) according to manufacturer recommendations. After washing, UV-crosslinking and blocking, membranes were incubated with anti-5hmC antibody (Active Motif 39769) overnight at 4°C. After incubation with HRP-conjugated secondary antibody (Invitrogen G21234), images were taken using a ChemiDoc Imaging system with enhanced chemiluminescence detection. Quantification was performed using ImageJ.
Bisulfite-sequencing
200 ng of DNA were bisulfite converted using an EZ DNA Methylation-Gold Kit (Zymo Research) according to the manufacturer’s recommendations. PCR was performed with GoTaq (Promega), before cloning into a pCR4-TOPO vector (Invitrogen). Subcloned colonies were sequenced with M13 reverse primer. The primers used for amplification of the Cdh1 enhancer were AATAGGATAGAATAGATAAGGGAAAAAG (Fwd) and AAACATTTATTTCTAATCTTACAAACCA (Rev).
RNA-sequencing and ATAC-sequencing
For bulk RNA-sequencing, samples were harvested at day 0, 2, 4, 6, and 8 of reprogramming for both genotypes. Specimens of iPSCs of the same backgrounds were passaged for seven passages in FBS/LIF on feeders before pre-plating and RNA extraction. RNA-seq libraries were constructed using polyA selection followed by NEBNext UltraDirectional kit protocol (New England Biolabs) and sequenced on the Illumina HiSeq2500 instrument, resulting in ~30 million reads per sample on average. Small RNA-seq libraries were generated using the NEB small RNA library kit E7330L (New England Biolabs), sequencing was run on the NextSeq 2000 as PE50 on a P3 type flowcell to ~30 million reads per sample.
ATAC was performed as previously described98. Briefly, nuclei of 60,000 cells per sample were resuspended in transposition buffer with Tn5 transposase. DNA was isolated using a MinElute kit (Qiagen) and libraries were amplified by PCR for 13 cycles using barcoded, Illumina-compatible primers. After amplification, DNA was size-selected for fragments between 100bp and 1000bp using AMPure XP beads (Beckman Coulter Life Sciences). Libraries for RNA- and ATAC-seq underwent Tapestation 2200 (Agilent) analysis before sequencing. ATAC-seq libraries were sequenced in paired-end 50 bp mode on the Illumina HiSeq2500 instrument, resulting in ~40 million reads per sample.
Single-cell RNA-sequencing
Single-cell RNA-sequencing was performed for MEFs prior to induction and for reprogramming intermediates of both genotypes on days 2, 4, 6, and 8. An iPSC sample was added after seven passages in FBS/LIF on feeders and pre-plating. ~5000 cells per sample were encapsulated using the 10x Chromium pipeline according to manufacturer guidelines using Single Cell 3’ chemistry v3 (10x Genomics). After mapping and quality control, cells were embedded using the monocle framework and DPT99,100.
CUT&Tag assay
CUT&Tag was performed as previously described101. In brief, 100,000 bead-bound cells per sample were permeabilized and incubated with primary antibodies targeting anti-H3K36me3 (Thermo Fisher MA5–24687), anti-H3K36me2 (active motif 39256), anti-H3K4me3 (active motif 39060), anti-H3K27ac (Millipore MABE647), H3K27me3 (Cell Signaling 9733), and anti-Sox2 (Cell Signaling 23064). After incubation with secondary antibody (Guinea Pig anti-Rabbit IgG, antibodies online ABIN101961), pAG-tethered transposase (pAG-Tn5, Epicypher) was bound in situ at target loci. After tagmentation and DNA clean-up, libraries were prepared by PCR amplification with barcoded Illumina-compatible primers. Tapestation 2200 analysis using High Sensitivity D1000 ScreenTape (Agilent) confirmed successful library preparation before sequencing in paired-end 50 bp mode with Illumina HiSeq2500, resulting in approximately 15 million reads per sample on average.
RRBS assay
RRBS was performed on 100 ng of genomic DNA for each sample using the NuGEN Ovation RRBS methyl-seq system according to the manufacturer’s recommendations. Bisulfite conversion of DNA was performed using the Qiagen EpiTect fast bisulfite conversion kit. Libraries were purified with Agencourt RNAclean XP beads, quality control was performed using Tapestation analysis. Libraries were sequenced on the Illumina NovaSeq6000, generating 100-bp single-end reads.
WGBS assay
WGBS libraries were produced with the TrueMethyl oxBS-Seq Module (Tecan) and Accel-NGS Methyl-Seq DNA Library Kit (Swift) according to the manufacturer’s instructions with the omission of the oxBS steps in the TrueMethyl protocol. Briefly, 300ng of gDNA was sheared to average fragment size of 200 bp using a Covaris S2 sonicator for 1 minute 30 seconds with the following settings: duty cycle 10%, intensity 5, cycles per burst 200. Resulting sheared gDNA was concentrated using AMPure XP beads (Beckman Coulter) and then subjected to bisulfite conversion and desulfunation as outlined in the TrueMethyl oxBS-Seq Module. This bisulfite converted gDNA was then used as input for the Accel-NGS Methyl-Seq DNA Library Kit and yielded sequencable libraries.
STATISTICAL ANALYSES:
RNA-seq data analysis
RNA-seq reads were mapped by STAR v.2.5.0 aligner102 to mm9 reference genome using ENSEMBL annotation. Read counts for individual genes were produced using the unstranded count feature in HTSeq version 0.11.2.103. Differential expression analysis was performed using the edgeR package104 after normalizing read counts and including only those genes with count per million reads (CPM) > 1 for one or more samples105. Differentially expressed genes were defined based on the criteria of >2-fold change in expression value. Gene ontology analysis was performed using GeneOntology.org106.
Single-cell RNA-seq data analysis
Sequenced reads were first aligned using CellRanger version 3.0.2, and the filtered reads assigned to cell barcodes were analyzed with the R package Seurat, version 4.0.0107. A first round of quality control (input: 45,751 cells) involved removing all cells positioned at least 3 median absolute deviations below the mean for library size (total number of reads) and the number of detected genes, as well as above the mean for the percentage of mitochondrial genes expressed from the entire transcriptome (40,018 cells remaining). The R package monocle3, version 1.2.9 was used for normalization, dimensionality reduction and visualization (UMAP)99. Further, 372 single cells corresponding to 3 separate clusters with low QC metrics and indicative of contamination were removed (39,646 cells remaining), and the data was normalized and clustered again. A new cluster with low QC metric (low number of genes expressed) consisting of 903 single cells emerged and was removed. The final cleaned dataset consisted of 38,743 cells. The heterogeneity score within samples was generated by computing the average Euclidean distance among all cells in the same condition based on monocle3-derived UMAP coordinates. The correlation scores for MEFs and ESCs (ESCsV6.5) were calculated using all available genes, and was compared to publicly available bulk profiles91. The data was further z-scored. In order to assess the robustness of sample separation in the visual UMAP representation, we preprocessed the data following the standard Seurat framework as well, including normalizing with SCTransform. The pseudotime plots were generated on the Seurat-preprocessed data using the R package destiny version 3.4.099,100.
Small RNA-seq data analysis
Raw sequencing reads were trimmed using trimmomatic to exclude adapter contamination and poor-quality bases108. Trimmed reads were aligned to reference genome mm9 with star aligner102. Read counts for individual genes were produced using the unstranded count feature in HTSeq 0.9.1103. Differential expression analysis was performed using the edgeR package104 after normalizing read counts and including only those genes with count per million reads (CPM) greater than 1 for one or more samples105. Differentially expressed genes (DEG) were defined based on the criteria of minimum 2-fold change in expression value and p-value less than 0.01.
Mass spectrometry of histone PTMs data analysis
Raw MS files were imported and analyzed in Skyline with Savitzky-Golay smoothing109. All Skyline peak area assignments for monitored peptide transitions were manually confirmed. Multiple peptide transitions were quantified for each modification. For each monitored amino acid residue, each (un)modified form was quantified by calculating the sum of peak areas of corresponding peptide transitions; the sum of all modified forms was then calculated for each amino acid to represent the total pool of modifications for that residue. Finally, each modification is then represented as a percentage of the total pool of modifications. This process was carried out for each of the three separate mass spec runs and averaged per sample.
ATAC-seq data analysis
Sequencing reads were mapped using bwa v.0.5.9-r16 aligner110 followed by peak calling using Hotspot111. DiffBind R package112 was used for the analysis of differential accessible regions (DAR), based on the cutoffs of > 2-fold change in peak intensity and false discovery rate (FDR) < 0.01.
CUT&Tag data analysis
Sequencing reads were mapped to mm9 reference genome using bwa aligner110. Peak calling was performed using Homer113. Heatmaps and average profiles of CUT&Tag read densities were generated using deepTools114. Bedtools was used to calculate read densities over given regions115. Gene ontology analysis was performed with ClusterProfiler after annotation using ChipSeeker116,117. Plots were generated in R using the ‘ggplot2’ package.
RRBS data analysis
Demultiplexed reads were trimmed using cutadapt and the Nugene diversity adapter trimming python script trimRRBSdiversityAdaptCustomers.py. Alignment to the mouse mm9 genome was performed using BSMAP118 with the following parameters: -v 0.1 -s 12 -q 20 -w 100 -S 1 -u -R -D C-CGG. Duplicate reads were removed using the Nugene deduplication script nudup.py. Methylation ratios were called with the MOABS mcall module119. DMRs were calculated in R, using package DSS to detect differentially methylated loci120. Locations were selected based on a delta of 0.1 and a p-value threshold of 0.001 across two replicates. Using R, all RRBS samples were filtered to keep only CpGs with at least 5x coverage. Data was then combined to perform analysis on only matched CpGs across all samples (n=2,688,886). For Sox2 binding site analysis, CpGs were intersected with region sets using bedtools, and heatmaps were generated using package ‘pheatmap’ after calculating average CpG methylation percentage for each binding site in R115.
WGBS data analysis
Quality control and correcting for adaptor content was performed using fastQC and cutadapt. After this, reads were aligned to the mouse mm10 reference genome using BSmap with flags -v 0.1 -s 16 -w 100 -S 1 –q 20 –u -R. The methylation level of all CpGs captured was calculated using the mcall module in the MOABS software suite with standard parameter settings and CpGs <10x coverage were discarded from the analysis.
Statistics and reproducibility
Statistical tests are described in the corresponding figure legends. Unless otherwise indicated, statistical analyses were carried out using R or GraphPad Prism. Data distribution was assumed to be normal but this was not formally tested. No statistical method was used to pre-determine sample size, no data were excluded from the analyses and the investigators were not blinded to allocation during experiments and outcome assessment.
Extended Data
Extended Data Fig. 1: Key role of H3K36-methylation in cell identity maintenance.

(a) Colony counts for AP staining of reprogrammable MEFs transduced as indicated (Fig. 1b,c). K36M wells were confluent and could not be counted. P values were determined by two-sided unpaired Student’s t test, error bars indicate mean ± SD (n=3 biologically independent experiments).
(b) Mice with dox-inducible alleles of WT H3.3 or K36M in the Col1a1 locus were crossed with mice harboring a dox-inducible OKSM cassette in the same locus, and an EGFP reporter in the 3’UTR of Pou5f1.
(c) Immunofluorescence of MEFs derived as in a). Scale bar 50 μm.
(d) Mass spectrometry of histone modifications in day 4 reprogramming intermediates (n=2 independent biological experiments).
(e) MEFs without endogenous OKSM but with inducible H3.3 WT or K36M were doxycycline-treated for 2 days, then replated and transduced with constitutive OKSM virus. Doxycycline was added to the medium for the indicated intervals, intracellular flow cytometry for Nanog was performed on day 8.
(f) Quantification of Nanog positivity by flow cytometry on day 8 in K36M cells treated with doxycycline for the indicated time. Cells were either not pre-treated or pre-treated with doxycycline 2 days prior to initiation of reprogramming (see k). Error bars indicate mean ± SD (n=3 independent biological experiments).
(g) Fraction of Oct4-GFP+ cells during reprogramming in FBS/LIF medium supplemented with ascorbic acid (left) and without supplementation (right), error bars indicate mean ± SD (n=3 independent biological experiments).
(h) Membrane dye dilution assay for reprogramming cultures.
(i) Percentage of viable cells as assessed by Annexin V/PI negativity on day 2 and 4 of reprogramming. Error bars indicate mean ± SD (n=3 independent biological experiments).
(j) Fraction of Oct4-GFP+ cells after sorting of positive cells and expansion on gelatin (top), and in picked iPSCs passaged on feeders (bottom).
(k) Day 10 K36M reprogramming cultures were sorted by Oct4-GFP reporter positivity. Positive cells were maintained in FBS/LIF, negative cells underwent continued reprogramming in AGi medium.
(l) Quantification of Oct4-GFP+ cells by flow cytometry in K36M cells sorted by Oct4-GFP reporter status (see i), error bars indicate mean ± SD (n=3 independent biological experiments).
Extended Data Fig. 2: K36M enhances the reprogramming of different cell types and generates iPSCs highly similar to control iPSCs.

(a) Reprogramming of GMPs to iPSCs. Alkaline phosphatase staining of iPSC colonies at the indicated timepoints. Quantification of colony counts. P values were determined by two-sided unpaired Student’s t test, n=3 biologically independent experiments.
(b) Reprogramming of keratinocytes to iPSCs. Alkaline phosphatase staining on day 13 of cells cultured for the indicated timeframes. Area percentage of well that is AP positive. P values were determined by two-sided unpaired Student’s t test, error bars indicate mean ± SD (n=3 independent biological experiments).
(c) Immunofluorescence for Nanog, H3K36me3, H3K36me2, and H3K27me3 of passaged iPSC cultures from WT and K36M backgrounds cultured without doxycycline on irradiated feeders.
(d) Relative expression (RNA-seq) of key pluripotency genes in passaged iPSCs of both backgrounds, n=2 biologically independent experiments.
(e) DNA methylation at MEF (n=63,696) and ESC enhancers (n=72,638) for MEFs and passaged iPSCs of both backgrounds (RRBS). Box plot center line indicates median; lower/upper hinges indicate 25th/75th percentiles; whiskers extend to 1.5x IQR.
(f) Representative gene tracks showing RNA-seq, ATAC-seq, and RRBS data for Cdh1 and Pou5f1 in passaged iPSCs of both backgrounds.
(g) Correlation matrices for key histone modifications and chromatin accessibility in passaged WT and K36M iPSCs (CUT&Tag and ATAC-seq).
(h) Correlation plot of K36M vs. WT derived iPSCs for H3K36me3 over gene bodies (CUT&Tag).
(i) Correlation plot of K36M vs. WT derived iPSCs for H3K36me2 in genome-wide 50kb bins (CUT&Tag).
(j) Representative gene tracks showing H3K36me3, H3K36me2, H3K27me3, and H3K4me3 at pluripotency gene Nanog.
(k) Quantification of the diameter of embryoid bodies from passaged iPSCs of both backgrounds (without doxycycline). P value determined by two-sided unpaired Student’s t test, n=49 for WT, n=44 for K36M.
(l) qPCR for Nanog, Nestin, Sox7, and Gata6 in embryoid bodies derived from passaged iPSCs of both backgrounds (without doxycycline), error bars indicate mean ± SD (n=3 independent biological experiments).
(m) H&E sections of teratomas generated with iPSCs of both backgrounds (without doxycycline). 4/4 WT and 6/6 K36M iPSC lines produced well-differentiated teratomas. Images depict tissue-like structures of all germ layers.
(n) Coat-color chimeras generated by blastocyst injection of K36M iPSCs.
Extended Data Fig. 3: Single-cell RNA-seq reveals main trajectories of WT and K36M reprogramming intermediates.
(a) UMAP embedding of scRNA-seq data (Seurat framework) using MEFs, reprogramming intermediates on days 2, 4, 6, 8 for WT and K36M, as well as passaged iPSCs (n=38,743 total number of cells).
(b) Expression of pluripotency gene Nanog projected on the same UMAP embedding as in (a).
(c) Expression of mesenchymal gene Prrx1 projected on the same UMAP embedding as in (a).
(d,e) Diffusion pseudotime mapping of day 2 to day 8 intermediates undergoing reprogramming. WT cells are colored in blue, K36M cells in red.
(f) Expression of pluripotency gene Nanog projected on the same pseudotime embedding as in (d).
(g) Expression of epithelial gene Cdh1 projected on the same pseudotime embedding as in (d).
(h) Expression of mesenchymal gene Zeb1 projected on the same pseudotime embedding as in (d).
(i) Relative expression (RNA-seq) of mesenchymal and epithelial genes in MEFs expressing H3.3 WT or K36M, but not OKSM, n=2 biologically independent experiments.
(j) Gene ontology terms of genes downregulated in K36M MEFs without OKSM. Analysis and p values from geneontology.org.
(k) Gene ontology terms of genes upregulated in K36M MEFs without OKSM. Analysis and p values from geneontology.org.
Extended Data Fig. 4: K36M confers epithelial plasticity on cells undergoing reprogramming.

(a) Gene expression of Twist1 and Cdh1 on the same UMAP embedding as used in Fig. 2d. Dashed circles encompass day-2 and day-4 samples for WT (blue circle) and K36M (red circle). Solid arrow indicates switch-like MET in K36M samples, dashed arrow indicates heterogeneous maintenance/activation of mesenchymal/epithelial programs in WT cells.
(b) Immunofluorescence for Vimentin and Epcam in WT and K36M cells on day 4 of reprogramming. Scale bar = 25 μm. Three independent biological experiments with similar results.
(c) Correlation plots of single-cell RNA-seq data comparing transcriptional programs within each cell to MEFs (y-axis) and ESCs (x-axis)91. For each sample, the corresponding cells are colored according to their Epcam expression levels, whereas other cells are greyed out.
(d) Correlation plots as in (c), expression data of Twist1 is superimposed.
(e) Correlation plots as in (c), expression data of Pou5f1 is superimposed.
Extended Data Fig. 5: K36M disrupts TGFβ signaling and modulates epithelial plasticity in diverse contexts.

(a) Flow cytometry histograms displaying Epcam expression in day-4 reprogramming intermediates for WT and K36M samples. Untreated control cells are compared to cells treated with 250 nM Repsox (TGFβi) or 2.5 ng/ml recombinant TGFβ-1 or -2 (rTGFβ-1, rTGFβ-2).
(b) Fraction of Oct4-GFP+ cells treated with TGFβi or rTGFβ in day 4 reprogramming intermediates. Error bars indicate mean ± SD (n=3).
(c) Representative tracks for expression of mesenchymal gene Col1a2 on day 8 of reprogramming, WT or K36M cells were treated as indicated.
(d) Representative tracks for expression of epithelial gene Cdh1 on day 8 of reprogramming, WT or K36M cells were treated as indicated.
(e) Representative tracks for miR-200a and miR-290.
(f) Schematic of K36M’s effect on TGFβ signaling and miRNA expression during reprogramming.
(g) De-differentiation of MEFs to induced myogenic progenitor cells (iMPCs). qRT-PCR for myotube marker Myh1 and iMPC marker Pax7, P values were determined by two-sided unpaired Student’s t test, error bars indicate mean ± SD (n=3 biologically independent experiments). Flow cytometry for Pax7-GFP reporter positive cells.
(h,i) Immunofluorescence of Nanog and K36M in ES cells of both backgrounds, cultured in S/L (g) or 2iL (h) conditions. Result is representative of three independent biological experiments.
(j) Differentiation of ESC aggregates to elongated gastruloids. Representative brightfield images (scale bar = 500 μm) and quantification of long axis diameter (line = mean). P value was determined by two-sided unpaired Student’s t test, n=19 for WT, n=20 for K36M.
(k) Differentiation of ESCs to pre-somitic mesoderm. Representative immunofluorescence for Cdh2 (scale bar = 50 μm). qRT-PCR for mesodermal transcription factors Tbx6 and Msgn1. P values were determined by two-sided unpaired Student’s t test, error bars indicate mean ± SD (n=3 independent biological experiments).
Extended Data Fig. 6: H3K36me2 and H3K36me3 cooperatively safeguard cell identity.

(a) Histone methyltransferases and demethylases implicated in the regulation of H3K36me2 (top) and H3K36me3 (bottom).
(b) Fraction of Epcam+ cells on day 4 of reprogramming (top) in WT cells with knockdown of indicated histone methyltransferases. Colony counts after 6 days of doxycycline followed by 4 days of independent growth (bottom), error bars indicate mean ± SD (n=3 biologically independent experiments).
(c,d) Fraction of Epcam+ (c) or Oct4-GFP+ (d) cells on day 8 of reprogramming in WT and K36M cells transduced with either empty vector or dox-inducible Nsd2, error bars indicate mean ± SD (n=3 biologically independent experiments).
(e) Flow cytometry for Epcam on day 8 of reprogramming in WT cells with knockdown of the indicated histone demethylases.
(f,g) Fraction of Epcam+ cells on day 4 (f) and day 8 (g) of reprogramming in WT cells with knockdown of the indicated histone demethylases, error bars indicate mean ± SD (n=3 biologically independent experiments).
(h) Fraction of Oct4-GFP+ cells on day 8 of reprogramming in WT cells with knockdown of the indicated histone demethylases. P values were determined by unpaired Student’s t test, error bars indicate mean ± SD (n=3 biologically independent experiments).
(i,j) Flow cytometry for Epcam during reprogramming in WT cells with overexpression of the indicated histone demethylases, error bars indicate mean ± SD (n=3 biologically independent experiments).
(k) Fraction of Oct4-GFP+ cells on day 4 and day 8 of reprogramming in WT cells with overexpression of the indicated histone demethylases, error bars indicate mean ± SD (n=3 biologically independent experiments).
(l) qRT-PCR for mesenchymal genes Vim and Prrx1, epithelial genes Epcam and Cdh1, and pluripotency gene Pou5f1 on day 4 of reprogramming in WT cells overexpressing Kdm2a vs. empty vector control. P values were determined by unpaired Student’s t test, error bars indicate mean ± SD (n=3 independent biological experiments).
Extended Data Fig. 7: K36M alters H3K36me2/3 deposition and gene expression.
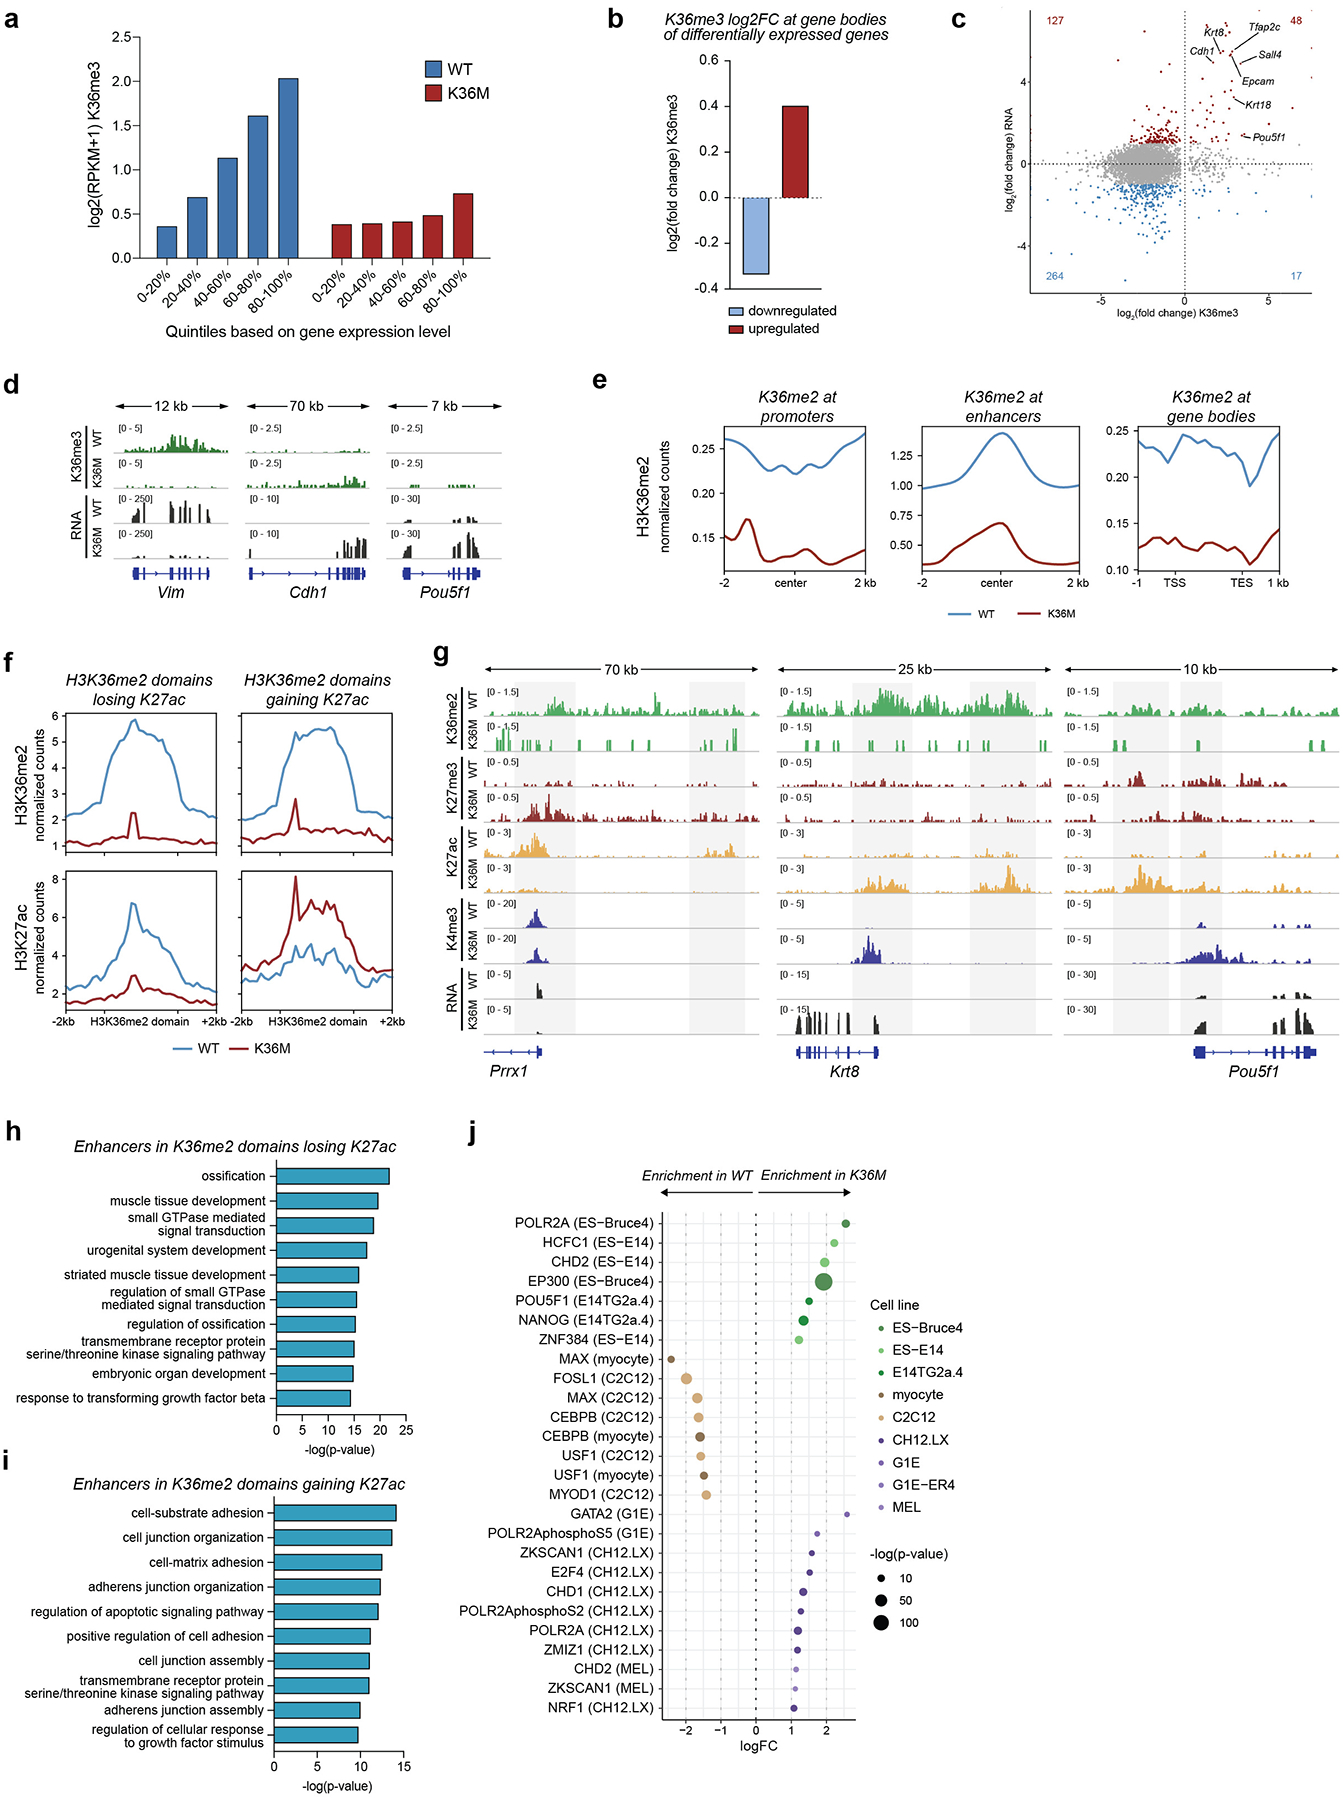
(a) H3K36me3 deposition at expressed genes (RPKM>0.1, n=10,251 for WT, n=10,496 for K36M) of indicated expression quintiles for WT (left) and K36M (right) samples on day 4 of reprogramming. Center line indicates median; lower/upper hinges indicate 25th/75th percentiles; whiskers extend to 1.5x IQR.
(b) H3K36me3 density over gene bodies of differentially expressed genes (n=1,872) on day 4 (upregulated = red, downregulated = blue). Box plots as in (a). P values were determined by two-sided Wilcoxon rank sum test.
(c) Fold change of gene expression (y axis) vs. fold change of H3K36me3 (x axis) between K36M and WT samples on day 4 of reprogramming.
(d) Representative gene tracks for H3K36me3 and RNA levels at mesenchymal gene Vim, epithelial gene Cdh1, and pluripotency gene Pou5f1.
(e) Profile plots of H3K36me2 at promoters, enhancers, and gene bodies.
(f) Profile plots of H3K36me2 and H3K27ac at H3K36me2 domains containing down- or upregulated enhancers.
(g) Representative tracks for Prrx1, a mesenchymal gene downregulated in K36M samples on day 4, Krt8, and Pou5f1, epithelial/pluripotency genes upregulated in K36M samples on day 4. Putative regulatory elements highlighted in grey.
(h) Gene ontology terms of genes closest to H3K36me2 domain-embedded enhancers that are differentially downregulated in K36M cells. Analysis and p values from geneontology.org.
(i) Gene ontology terms of genes closest to H3K36me2 domain-embedded enhancers that are differentially upregulated in K36M cells. Analysis and p values from geneontology.org.
(j) Dot plot representing enrichment of ENCODE data for differentially active enhancers within H3K36me2 domains. P values were determined by Fisher’s exact test.
Extended Data Fig. 8: PRC2 contributes to the K36M-dependent silencing of the somatic program.

(a) H3K27me3 deposition within H3K36me2 domains in K36M vs. WT samples in day-4 reprogramming intermediates. Domains gaining H3K27me3 are colored in red, domains losing H3K27me3 are colored in blue.
(b) Ontology terms for genes with promoters overlapping H3K36me2 domains and gaining H3K27me3. Analysis and p values from geneontology.org.
(c) Heatmaps for H3K27me3 and H3K4me3 at promoters mesenchymal and epithelial genes in WT and K36M samples.
(d,e) Fraction of Epcam+ and Oct4-GFP+ cells in WT (blue) and K36M (red) samples with knockdown of indicated PRC2 components (top). Log2(fold change) of fraction normalized to control siRNA (bottom). Error bars indicate mean ± SD (n=3 independent biological experiments).
(f) Representative histograms of flow cytometry for Epcam in K36M cells with control siRNA and knockdown of Ezh2 or Suz12.
(g) qRT-PCR for mesenchymal (Vim, Prrx1, Zeb1), epithelial (Cdh1, Epcam), and pluripotency (Pou5f1) marker genes, error bars indicate mean ± SD (n=3 biologically independent experiments).
(h) Immunofluorescence for H3K27me3 in WT and K36M cells transfected with control siRNA or knockdown of Ezh2 or Suz12. Representative result from three independent biological experiments.
Extended Data Fig. 9: K36M rewires DNA methylation patterns.

(a) Number of colonies following alkaline phosphatase staining of WT and K36M cell cultures transduced with non-selectable, dox-inducible lentiviruses for the expression of SKM, OSM, or OKM. Cultures were induced for 12 days and stained on day 15, n=3 independent biological experiments.
(b) Correlation plot of log2(fold-change) differences (K36M vs. WT) at Sox2 peaks called in WT and K36M samples. Differences of Sox2 enrichment are correlated with differences in H3K27ac abundance. Pearson correlation with corresponding two-sided t test, R = 0.56, p<2.2e-16.
(c) Profile plots showing H3K36me2 abundance at ectopic and ESC-specific Sox2 sides in WT and K36M cells on day 4 of reprogramming.
(d) Sox2 enrichment at Sox2 binding sites as defined in iPSCs, log2(RPKM).
(e) Correlation plot of log2(fold-change) differences (K36M vs. WT) at Sox2 peaks called in WT and K36M samples. Differences of Sox2 enrichment are correlated with differences in chromatin accessibility (as measured by ATAC-seq). Pearson correlation with corresponding two-sided t test, R = 0.68, p<2.2e-16.
(f) Chromatin accessibility (as measured by ATAC-seq) at ectopic and ESC-specific Sox2 binding sites in MEFs and passaged iPSCs, log2(RPKM+1).
(g) DNA methylation at differentially methylated regions losing (left, n=30,294) or gaining (right, n=28,060) methylation in iPSCs vs. MEFs. Box plot center line indicates median; lower/upper hinges indicate 25th/75th percentiles; whiskers extend to 1.5x IQR.
(h-k) Representative gene tracks of Cdh1, Krt8, the miR-290 cluster, and Pou5f1. Putative regulatory elements affected by DNA demethylation are highlighted in grey.
(l) CpG density at differentially active enhancers in H3K36me2 domains (n=4,939). P value determined by two-sided Wilcoxon rank sum test. Box plots as in (g).
Extended Data Fig. 10: DNA demethylation is limiting for K36M-dependent enhancer rewiring.

(a) DNA methylation (WGBS) at differentially active enhancers in H3K36me2 domains (n=4,939) in day-4 reprogramming intermediates of WT, K36M and K36M+DMOG samples. Center line indicates median; lower/upper hinges indicate 25th/75th percentiles; whiskers extend to 1.5x IQR.
(b) DNA methylation (WGBS) at ectopic (n=45,095) and ESC-exclusive (n=27,708) Sox2 binding sites in day-4 reprogramming intermediates of WT, K36M and K36M+DMOG samples. Box plots as in (a).
(c) Representative histogram plots from flow cytometric analysis for Epcam of K36M cells with knockdown of the indicated Tet demethylases.
(d) Fraction of Epcam+ cells in K36M cells with Tet knockdown on day 4 of reprogramming, error bars indicate mean ± SD (n=3 biologically independent experiments).
(e) qPCR of miRNAs miR-200b-3p, miR-205-5p, and miR-290a-5p in untreated (K36M Ctrl) and DMOG-treated K36M cells (K36M DMOG). P values were determined by unpaired Student’s t test, error bars indicate mean ± SD (n=3 independent biological experiments).
(f) Fraction of Epcam+ cells in K36M cultures transduced with either an empty vector or dox-inducible overexpression vectors for Dnmt3a and Dnmt3b, error bars indicate mean ± SD (n=3 independent biological experiments).
(g) Bisulfite-seq of a Cdh1 enhancer in K36M cells transduced with either empty vector (left), or overexpression of Dnmt3a (middle) or Dnmt3b (right).
(h) Quantification of H3K36me2 levels within H3K36me2 domains (n=7,610) on day 4 of reprogramming in WT, untreated K36M cells (K36M Ctrl), and DMOG-treated K36M cells (K36M DMOG). Center line indicates median; lower/upper hinges indicate 25th/75th percentiles; whiskers extend to 1.5x IQR. P values were determined by two-sided Wilcoxon rank sum test.
(i-k) Representative gene tracks of Krt8, Pou5f1, and the miR-290 cluster. Putative regulatory elements highlighted in grey.
Acknowledgements
We thank members of the Hochedlinger laboratory for their suggestions, and members of the MGH CRM/HSCI Flow Core, the Harvard Genome Modification Facility, and the MGH Next Generation Sequencing Core for their support. We also thank Amanda Collier for suggestions and discussions, and Helene Kretzmer for her help with DNA methylation data. Support from the Dana-Farber Cancer Institute’s Center for Cancer Evolution and Physical Sciences-Oncology Center (U54CA193461; to F.M.) is gratefully acknowledged. M.S.H. was supported by the German Cancer Aid (Deutsche Krebshilfe). K.P. is supported by the Eli and Edythe Broad Center of Regenerative Medicine and Stem Cell Research at UCLA, the David Geffen School of Medicine, the NIH (GM099134), and a Faculty Scholar grant from the Howard Hughes Medical Institute. K.H. was supported by funds from the MGH, NIH (R01 HD058013, P01 GM099134), the Milky Way Research Foundation and the Gerald and Darlene Jordan Chair in Regenerative Medicine.
Footnotes
Competing interests
F.M. is a cofounder of and has equity in Harbinger Health, has equity in Zephyr AI, and serves as a consultant for Harbinger Health, Zephyr AI, and Red Cell Partners. F.M. declares that none of these relationships are directly or indirectly related to the content of this manuscript. The remaining authors declare no competing interests.
Code availability
The code used to analyze the scRNAseq data presented here, and to generate the corresponding plots, is uploaded to GitHub https://github.com/Michorlab/H3K36_methylation_scRNAseq. Code for additional analyses available upon request.
Data availability
RNA-seq, ATAC-seq, and CUT&Tag data have been deposited in the Gene Expression Omnibus (GEO) under accession code GSE203492. Single-cell RNA-seq data are deposited under GSE203536. RRBS and WGBS data are available under GSE203606. The publicly available datasets used in this study are: GSE90893, GSE111172, GSE77420. All other data supporting the findings of this study are available from the corresponding authors upon reasonable request.
References
- 1.Tsankov AM et al. Transcription factor binding dynamics during human ESC differentiation. Nature 518, 344–349 (2015). [DOI] [PMC free article] [PubMed] [Google Scholar]
- 2.Ho L & Crabtree GR Chromatin remodelling during development. Nature 463, 474–484 (2010). [DOI] [PMC free article] [PubMed] [Google Scholar]
- 3.Mittnenzweig M et al. A single-embryo, single-cell time-resolved model for mouse gastrulation. Cell 184, 2825–2842.e22 (2021). [DOI] [PMC free article] [PubMed] [Google Scholar]
- 4.Grosswendt S et al. Epigenetic regulator function through mouse gastrulation. Nature 584, 102–108 (2020). [DOI] [PMC free article] [PubMed] [Google Scholar]
- 5.Wagner DE et al. Single-cell mapping of gene expression landscapes and lineage in the zebrafish embryo. Science 360, 981–987 (2018). [DOI] [PMC free article] [PubMed] [Google Scholar]
- 6.Aguilera-Castrejon A et al. Ex utero mouse embryogenesis from pre-gastrulation to late organogenesis. Nature 593, 119–124 (2021). [DOI] [PubMed] [Google Scholar]
- 7.Takaoka K & Hamada H Cell fate decisions and axis determination in the early mouse embryo. Development 139, 3–14 (2011). [DOI] [PubMed] [Google Scholar]
- 8.Jambhekar A, Dhall A & Shi Y Roles and regulation of histone methylation in animal development. Nat Rev Mol Cell Bio 20, 625–641 (2019). [DOI] [PMC free article] [PubMed] [Google Scholar]
- 9.Suvà ML, Riggi N & Bernstein BE Epigenetic Reprogramming in Cancer. Science 339, 1567–1570 (2013). [DOI] [PMC free article] [PubMed] [Google Scholar]
- 10.Takahashi K & Yamanaka S Induction of Pluripotent Stem Cells from Mouse Embryonic and Adult Fibroblast Cultures by Defined Factors. Cell 126, 663–676 (2006). [DOI] [PubMed] [Google Scholar]
- 11.Brumbaugh J, Stefano BD & Hochedlinger K Reprogramming: identifying the mechanisms that safeguard cell identity. Development 146, dev182170 (2019). [DOI] [PMC free article] [PubMed] [Google Scholar]
- 12.Apostolou E & Hochedlinger K Chromatin dynamics during cellular reprogramming. Nature 502, 462–471 (2013). [DOI] [PMC free article] [PubMed] [Google Scholar]
- 13.Onder TT et al. Chromatin-modifying enzymes as modulators of reprogramming. Nature 483, 598–602 (2012). [DOI] [PMC free article] [PubMed] [Google Scholar]
- 14.Borkent M et al. A Serial shRNA Screen for Roadblocks to Reprogramming Identifies the Protein Modifier SUMO2. Stem Cell Rep 6, 704–716 (2016). [DOI] [PMC free article] [PubMed] [Google Scholar]
- 15.Yang C-S, Chang K-Y & Rana TM Genome-wide Functional Analysis Reveals Factors Needed at the Transition Steps of Induced Reprogramming. Cell Reports 8, 327–337 (2014). [DOI] [PMC free article] [PubMed] [Google Scholar]
- 16.Qin H et al. Systematic Identification of Barriers to Human iPSC Generation. Cell 158, 449–461 (2014). [DOI] [PMC free article] [PubMed] [Google Scholar]
- 17.Cheloufi S et al. The histone chaperone CAF-1 safeguards somatic cell identity. Nature 528, 218–224 (2015). [DOI] [PMC free article] [PubMed] [Google Scholar]
- 18.Brumbaugh J et al. Nudt21 Controls Cell Fate by Connecting Alternative Polyadenylation to Chromatin Signaling. Cell 172, 106–120.e21 (2018). [DOI] [PMC free article] [PubMed] [Google Scholar]
- 19.Hyun K, Jeon J, Park K & Kim J Writing, erasing and reading histone lysine methylations. Exp Mol Medicine 49, e324 (2017). [DOI] [PMC free article] [PubMed] [Google Scholar]
- 20.Kim E et al. Phosphorylation of EZH2 Activates STAT3 Signaling via STAT3 Methylation and Promotes Tumorigenicity of Glioblastoma Stem-like Cells. Cancer Cell 23, 839–852 (2013). [DOI] [PMC free article] [PubMed] [Google Scholar]
- 21.Xu K et al. EZH2 Oncogenic Activity in Castration-Resistant Prostate Cancer Cells Is Polycomb-Independent. Science 338, 1465–1469 (2012). [DOI] [PMC free article] [PubMed] [Google Scholar]
- 22.Shpargel KB, Sengoku T, Yokoyama S & Magnuson T UTX and UTY Demonstrate Histone Demethylase-Independent Function in Mouse Embryonic Development. Plos Genet 8, e1002964 (2012). [DOI] [PMC free article] [PubMed] [Google Scholar]
- 23.Miller SA, Mohn SE & Weinmann AS Jmjd3 and UTX Play a Demethylase-Independent Role in Chromatin Remodeling to Regulate T-Box Family Member-Dependent Gene Expression. Mol Cell 40, 594–605 (2010). [DOI] [PMC free article] [PubMed] [Google Scholar]
- 24.Herz H-M et al. Histone H3 lysine-to-methionine mutants as a paradigm to study chromatin signaling. Science 345, 1065–1070 (2014). [DOI] [PMC free article] [PubMed] [Google Scholar]
- 25.Nacev BA et al. The expanding landscape of ‘oncohistone’ mutations in human cancers. Nature 567, 473–478 (2019). [DOI] [PMC free article] [PubMed] [Google Scholar]
- 26.Lewis PW et al. Inhibition of PRC2 Activity by a Gain-of-Function H3 Mutation Found in Pediatric Glioblastoma. Science 340, 857–861 (2013). [DOI] [PMC free article] [PubMed] [Google Scholar]
- 27.Chan K-M et al. The histone H3.3K27M mutation in pediatric glioma reprograms H3K27 methylation and gene expression. Gene Dev 27, 985–990 (2013). [DOI] [PMC free article] [PubMed] [Google Scholar]
- 28.Fang D et al. The histone H3.3K36M mutation reprograms the epigenome of chondroblastomas. Science 352, 1344–1348 (2016). [DOI] [PMC free article] [PubMed] [Google Scholar]
- 29.Lu C et al. Histone H3K36 mutations promote sarcomagenesis through altered histone methylation landscape. Science 352, 844–849 (2016). [DOI] [PMC free article] [PubMed] [Google Scholar]
- 30.Schwartzentruber J et al. Driver mutations in histone H3.3 and chromatin remodelling genes in paediatric glioblastoma. Nature 482, 226–231 (2012). [DOI] [PubMed] [Google Scholar]
- 31.Mohammad F et al. EZH2 is a potential therapeutic target for H3K27M-mutant pediatric gliomas. Nat Med 23, 483–492 (2017). [DOI] [PubMed] [Google Scholar]
- 32.Brumbaugh J et al. Inducible histone K-to-M mutations are dynamic tools to probe the physiological role of site-specific histone methylation in vitro and in vivo. Nat Cell Biol 21, 1449–1461 (2019). [DOI] [PMC free article] [PubMed] [Google Scholar]
- 33.Stadtfeld M, Maherali N, Borkent M & Hochedlinger K A reprogrammable mouse strain from gene-targeted embryonic stem cells. Nat Methods 7, 53–55 (2010). [DOI] [PMC free article] [PubMed] [Google Scholar]
- 34.Chen J et al. H3K9 methylation is a barrier during somatic cell reprogramming into iPSCs. Nat Genet 45, 34–42 (2013). [DOI] [PubMed] [Google Scholar]
- 35.Soufi A, Donahue G & Zaret KS Facilitators and Impediments of the Pluripotency Reprogramming Factors’ Initial Engagement with the Genome. Cell 151, 994–1004 (2012). [DOI] [PMC free article] [PubMed] [Google Scholar]
- 36.Sridharan R et al. Proteomic and genomic approaches reveal critical functions of H3K9 methylation and Heterochromatin Protein-1γ in reprogramming to pluripotency. Nat Cell Biol 15, 872–882 (2013). [DOI] [PMC free article] [PubMed] [Google Scholar]
- 37.Fragola G et al. Cell Reprogramming Requires Silencing of a Core Subset of Polycomb Targets. Plos Genet 9, e1003292 (2013). [DOI] [PMC free article] [PubMed] [Google Scholar]
- 38.Ding X et al. The Polycomb Protein Ezh2 Impacts on Induced Pluripotent Stem Cell Generation. Stem Cells Dev 23, 931–940 (2014). [DOI] [PMC free article] [PubMed] [Google Scholar]
- 39.Wang C et al. Enhancer priming by H3K4 methyltransferase MLL4 controls cell fate transition. Proc National Acad Sci 113, 11871–11876 (2016). [DOI] [PMC free article] [PubMed] [Google Scholar]
- 40.Liang G, He J & Zhang Y Kdm2b promotes induced pluripotent stem cell generation by facilitating gene activation early in reprogramming. Nat Cell Biol 14, 457–466 (2012). [DOI] [PMC free article] [PubMed] [Google Scholar]
- 41.Wang T et al. The Histone Demethylases Jhdm1a/1b Enhance Somatic Cell Reprogramming in a Vitamin-C-Dependent Manner. Cell Stem Cell 9, 575–587 (2011). [DOI] [PubMed] [Google Scholar]
- 42.Stadtfeld M, Maherali N, Breault DT & Hochedlinger K Defining Molecular Cornerstones during Fibroblast to iPS Cell Reprogramming in Mouse. Cell Stem Cell 2, 230–240 (2008). [DOI] [PMC free article] [PubMed] [Google Scholar]
- 43.Polo JM et al. A Molecular Roadmap of Reprogramming Somatic Cells into iPS Cells. Cell 151, 1617–1632 (2012). [DOI] [PMC free article] [PubMed] [Google Scholar]
- 44.Brambrink T et al. Sequential Expression of Pluripotency Markers during Direct Reprogramming of Mouse Somatic Cells. Cell Stem Cell 2, 151–159 (2008). [DOI] [PMC free article] [PubMed] [Google Scholar]
- 45.Schwarz BA et al. Prospective Isolation of Poised iPSC Intermediates Reveals Principles of Cellular Reprogramming. Cell Stem Cell 23, 289–305.e5 (2018). [DOI] [PMC free article] [PubMed] [Google Scholar]
- 46.Lengner CJ et al. Oct4 Expression Is Not Required for Mouse Somatic Stem Cell Self-Renewal. Cell Stem Cell 1, 403–415 (2007). [DOI] [PMC free article] [PubMed] [Google Scholar]
- 47.Schiebinger G et al. Optimal-Transport Analysis of Single-Cell Gene Expression Identifies Developmental Trajectories in Reprogramming. Cell 176, 928–943.e22 (2019). [DOI] [PMC free article] [PubMed] [Google Scholar]
- 48.Li R et al. A Mesenchymal-to-Epithelial Transition Initiates and Is Required for the Nuclear Reprogramming of Mouse Fibroblasts. Cell Stem Cell 7, 51–63 (2010). [DOI] [PubMed] [Google Scholar]
- 49.Samavarchi-Tehrani P et al. Functional Genomics Reveals a BMP-Driven Mesenchymal-to-Epithelial Transition in the Initiation of Somatic Cell Reprogramming. Cell Stem Cell 7, 64–77 (2010). [DOI] [PubMed] [Google Scholar]
- 50.Massagué J TGFβ signalling in context. Nat Rev Mol Cell Bio 13, 616–630 (2012). [DOI] [PMC free article] [PubMed] [Google Scholar]
- 51.Maherali N & Hochedlinger K Tgfβ Signal Inhibition Cooperates in the Induction of iPSCs and Replaces Sox2 and cMyc. Curr Biol 19, 1718–1723 (2009). [DOI] [PMC free article] [PubMed] [Google Scholar]
- 52.Gregory PA et al. The miR-200 family and miR-205 regulate epithelial to mesenchymal transition by targeting ZEB1 and SIP1. Nat Cell Biol 10, 593–601 (2008). [DOI] [PubMed] [Google Scholar]
- 53.Park S-M, Gaur AB, Lengyel E & Peter ME The miR-200 family determines the epithelial phenotype of cancer cells by targeting the E-cadherin repressors ZEB1 and ZEB2. Gene Dev 22, 894–907 (2008). [DOI] [PMC free article] [PubMed] [Google Scholar]
- 54.Subramanyam D et al. Multiple targets of miR-302 and miR-372 promote reprogramming of human fibroblasts to induced pluripotent stem cells. Nat Biotechnol 29, 443–448 (2011). [DOI] [PMC free article] [PubMed] [Google Scholar]
- 55.Judson RL, Babiarz JE, Venere M & Blelloch R Embryonic stem cell–specific microRNAs promote induced pluripotency. Nat Biotechnol 27, 459–461 (2009). [DOI] [PMC free article] [PubMed] [Google Scholar]
- 56.Vierbuchen T et al. Direct conversion of fibroblasts to functional neurons by defined factors. Nature 463, 1035–1041 (2010). [DOI] [PMC free article] [PubMed] [Google Scholar]
- 57.Davis RL, Weintraub H & Lassar AB Expression of a single transfected cDNA converts fibroblasts to myoblasts. Cell 51, 987–1000 (1987). [DOI] [PubMed] [Google Scholar]
- 58.Yagi M et al. Dissecting dual roles of MyoD during lineage conversion to mature myocytes and myogenic stem cells. Gene Dev 35, 1209–1228 (2021). [DOI] [PMC free article] [PubMed] [Google Scholar]
- 59.Bar-Nur O et al. Direct Reprogramming of Mouse Fibroblasts into Functional Skeletal Muscle Progenitors. Stem Cell Rep 10, 1505–1521 (2018). [DOI] [PMC free article] [PubMed] [Google Scholar]
- 60.Beccari L et al. Multi-axial self-organization properties of mouse embryonic stem cells into gastruloids. Nature 562, 272–276 (2018). [DOI] [PubMed] [Google Scholar]
- 61.van den Brink SC et al. Symmetry breaking, germ layer specification and axial organisation in aggregates of mouse embryonic stem cells. Development 141, 4231–4242 (2014). [DOI] [PMC free article] [PubMed] [Google Scholar]
- 62.Baillie-Johnson P, van den Brink SC, Balayo T, Turner DA & Arias AM Generation of Aggregates of Mouse Embryonic Stem Cells that Show Symmetry Breaking, Polarization and Emergent Collective Behaviour In Vitro. J Vis Exp Jove 53252 (2015) doi: 10.3791/53252. [DOI] [PMC free article] [PubMed] [Google Scholar]
- 63.Diaz-Cuadros M et al. In vitro characterization of the human segmentation clock. Nature 580, 113–118 (2020). [DOI] [PMC free article] [PubMed] [Google Scholar]
- 64.Kahata K, Dadras MS & Moustakas A TGF-β Family Signaling in Epithelial Differentiation and Epithelial–Mesenchymal Transition. Csh Perspect Biol 10, a022194 (2018). [DOI] [PMC free article] [PubMed] [Google Scholar]
- 65.Mou H et al. Dual SMAD Signaling Inhibition Enables Long-Term Expansion of Diverse Epithelial Basal Cells. Cell Stem Cell 19, 217–231 (2016). [DOI] [PMC free article] [PubMed] [Google Scholar]
- 66.Hillringhaus L et al. Structural and Evolutionary Basis for the Dual Substrate Selectivity of Human KDM4 Histone Demethylase Family*. J Biol Chem 286, 41616–41625 (2011). [DOI] [PMC free article] [PubMed] [Google Scholar]
- 67.Krogan NJ et al. Methylation of Histone H3 by Set2 in Saccharomyces cerevisiae Is Linked to Transcriptional Elongation by RNA Polymerase II. Mol Cell Biol 23, 4207–4218 (2003). [DOI] [PMC free article] [PubMed] [Google Scholar]
- 68.Streubel G et al. The H3K36me2 Methyltransferase Nsd1 Demarcates PRC2-Mediated H3K27me2 and H3K27me3 Domains in Embryonic Stem Cells. Mol Cell 70, 371–379.e5 (2018). [DOI] [PubMed] [Google Scholar]
- 69.Wang GG, Cai L, Pasillas MP & Kamps MP NUP98–NSD1 links H3K36 methylation to Hox-A gene activation and leukaemogenesis. Nat Cell Biol 9, 804–812 (2007). [DOI] [PubMed] [Google Scholar]
- 70.Yuan W et al. H3K36 Methylation Antagonizes PRC2-mediated H3K27 Methylation*. J Biol Chem 286, 7983–7989 (2011). [DOI] [PMC free article] [PubMed] [Google Scholar]
- 71.Rajagopalan KN et al. Depletion of H3K36me2 recapitulates epigenomic and phenotypic changes induced by the H3.3K36M oncohistone mutation. Proc National Acad Sci 118, e2021795118 (2021). [DOI] [PMC free article] [PubMed] [Google Scholar]
- 72.Fang Y et al. The H3K36me2 methyltransferase NSD1 modulates H3K27ac at active enhancers to safeguard gene expression. Nucleic Acids Res 49, 6281–6295 (2021). [DOI] [PMC free article] [PubMed] [Google Scholar]
- 73.Chaouch A et al. Histone H3.3 K27M and K36M mutations de-repress transposable elements through perturbation of antagonistic chromatin marks. Mol Cell 81, 4876–4890.e7 (2021). [DOI] [PMC free article] [PubMed] [Google Scholar]
- 74.Barral A et al. SETDB1/NSD-dependent H3K9me3/H3K36me3 dual heterochromatin maintains gene expression profiles by bookmarking poised enhancers. Mol Cell 82, 816–832.e12 (2022). [DOI] [PMC free article] [PubMed] [Google Scholar]
- 75.Chronis C et al. Cooperative Binding of Transcription Factors Orchestrates Reprogramming. Cell 168, 442–459.e20 (2017). [DOI] [PMC free article] [PubMed] [Google Scholar]
- 76.Yin Y et al. Impact of cytosine methylation on DNA binding specificities of human transcription factors. Science 356, (2017). [DOI] [PMC free article] [PubMed] [Google Scholar]
- 77.Kaluscha S et al. Evidence that direct inhibition of transcription factor binding is the prevailing mode of gene and repeat repression by DNA methylation. Nat Genet 54, 1895–1906 (2022). [DOI] [PMC free article] [PubMed] [Google Scholar]
- 78.Weinberg DN et al. The histone mark H3K36me2 recruits DNMT3A and shapes the intergenic DNA methylation landscape. Nature 573, 281–286 (2019). [DOI] [PMC free article] [PubMed] [Google Scholar]
- 79.Baubec T et al. Genomic profiling of DNA methyltransferases reveals a role for DNMT3B in genic methylation. Nature 520, 243–247 (2015). [DOI] [PubMed] [Google Scholar]
- 80.Yagi M et al. Identification of distinct loci for de novo DNA methylation by DNMT3A and DNMT3B during mammalian development. Nat Commun 11, 3199 (2020). [DOI] [PMC free article] [PubMed] [Google Scholar]
- 81.von Meyenn F et al. Impairment of DNA Methylation Maintenance Is the Main Cause of Global Demethylation in Naive Embryonic Stem Cells. Mol Cell 62, 848–861 (2016). [DOI] [PMC free article] [PubMed] [Google Scholar]
- 82.Charlton J et al. TETs compete with DNMT3 activity in pluripotent cells at thousands of methylated somatic enhancers. Nat Genet 52, 819–827 (2020). [DOI] [PMC free article] [PubMed] [Google Scholar]
- 83.Hu X et al. Tet and TDG Mediate DNA Demethylation Essential for Mesenchymal-to-Epithelial Transition in Somatic Cell Reprogramming. Cell Stem Cell 14, 512–522 (2014). [DOI] [PubMed] [Google Scholar]
- 84.Gao Y et al. Replacement of Oct4 by Tet1 during iPSC Induction Reveals an Important Role of DNA Methylation and Hydroxymethylation in Reprogramming. Cell Stem Cell 12, 453–469 (2013). [DOI] [PubMed] [Google Scholar]
- 85.Zviran A et al. Deterministic Somatic Cell Reprogramming Involves Continuous Transcriptional Changes Governed by Myc and Epigenetic-Driven Modules. Cell Stem Cell 24, 328–341.e9 (2019). [DOI] [PMC free article] [PubMed] [Google Scholar]
- 86.Amouroux R et al. De novo DNA methylation drives 5hmC accumulation in mouse zygotes. Nat Cell Biol 18, 225–233 (2016). [DOI] [PMC free article] [PubMed] [Google Scholar]
- 87.Sardina JL et al. Transcription Factors Drive Tet2-Mediated Enhancer Demethylation to Reprogram Cell Fate. Cell Stem Cell 23, 727–741.e9 (2018). [DOI] [PubMed] [Google Scholar]
- 88.Yuan S et al. Global Regulation of the Histone Mark H3K36me2 Underlies Epithelial Plasticity and Metastatic Progression. Cancer Discov 10, 854–871 (2020). [DOI] [PMC free article] [PubMed] [Google Scholar]
- 89.Brabletz S & Brabletz T The ZEB/miR-200 feedback loop—a motor of cellular plasticity in development and cancer? Embo Rep 11, 670–677 (2010). [DOI] [PMC free article] [PubMed] [Google Scholar]
- 90.Papillon-Cavanagh S et al. Impaired H3K36 methylation defines a subset of head and neck squamous cell carcinomas. Nat Genet 49, 180–185 (2017). [DOI] [PMC free article] [PubMed] [Google Scholar]
- 91.Hutchins AP et al. Models of global gene expression define major domains of cell type and tissue identity. Nucleic Acids Res 45, 2354–2367 (2017). [DOI] [PMC free article] [PubMed] [Google Scholar]
- 92.Velychko S et al. Excluding Oct4 from Yamanaka Cocktail Unleashes the Developmental Potential of iPSCs. Cell Stem Cell 25, 737–753.e4 (2019). [DOI] [PMC free article] [PubMed] [Google Scholar]
- 93.Sommer CA et al. Induced Pluripotent Stem Cell Generation Using a Single Lentiviral Stem Cell Cassette. Stem Cells 27, 543–549 (2009). [DOI] [PMC free article] [PubMed] [Google Scholar]
- 94.Bar-Nur O et al. Small molecules facilitate rapid and synchronous iPSC generation. Nat Methods 11, 1170–1176 (2014). [DOI] [PMC free article] [PubMed] [Google Scholar]
- 95.Nagy A, Rossant J, Nagy R, Abramow-Newerly W & Roder JC Derivation of completely cell culture-derived mice from early-passage embryonic stem cells. Proc National Acad Sci 90, 8424–8428 (1993). [DOI] [PMC free article] [PubMed] [Google Scholar]
- 96.Eggan K et al. Hybrid vigor, fetal overgrowth, and viability of mice derived by nuclear cloning and tetraploid embryo complementation. Proc National Acad Sci 98, 6209–6214 (2001). [DOI] [PMC free article] [PubMed] [Google Scholar]
- 97.Zheng Y, Thomas PM & Kelleher NL Measurement of acetylation turnover at distinct lysines in human histones identifies long-lived acetylation sites. Nat Commun 4, 2203 (2013). [DOI] [PMC free article] [PubMed] [Google Scholar]
- 98.Buenrostro JD, Giresi PG, Zaba LC, Chang HY & Greenleaf WJ Transposition of native chromatin for fast and sensitive epigenomic profiling of open chromatin, DNA-binding proteins and nucleosome position. Nat Methods 10, 1213–1218 (2013). [DOI] [PMC free article] [PubMed] [Google Scholar]
- 99.Trapnell C et al. The dynamics and regulators of cell fate decisions are revealed by pseudotemporal ordering of single cells. Nat Biotechnol 32, 381–386 (2014). [DOI] [PMC free article] [PubMed] [Google Scholar]
- 100.Haghverdi L, Büttner M, Wolf FA, Buettner F & Theis FJ Diffusion pseudotime robustly reconstructs lineage branching. Nat Methods 13, 845–848 (2016). [DOI] [PubMed] [Google Scholar]
- 101.Kaya-Okur HS, Janssens DH, Henikoff JG, Ahmad K & Henikoff S Efficient low-cost chromatin profiling with CUT&Tag. Nat Protoc 15, 3264–3283 (2020). [DOI] [PMC free article] [PubMed] [Google Scholar]
- 102.Dobin A et al. STAR: ultrafast universal RNA-seq aligner. Bioinformatics 29, 15–21 (2013). [DOI] [PMC free article] [PubMed] [Google Scholar]
- 103.Anders S, Pyl PT & Huber W HTSeq—a Python framework to work with high-throughput sequencing data. Bioinformatics 31, 166–169 (2015). [DOI] [PMC free article] [PubMed] [Google Scholar]
- 104.Robinson MD, McCarthy DJ & Smyth GK edgeR: a Bioconductor package for differential expression analysis of digital gene expression data. Bioinformatics 26, 139–140 (2010). [DOI] [PMC free article] [PubMed] [Google Scholar]
- 105.Anders S et al. Count-based differential expression analysis of RNA sequencing data using R and Bioconductor. Nat Protoc 8, 1765–1786 (2013). [DOI] [PubMed] [Google Scholar]
- 106.Ashburner M et al. Gene Ontology: tool for the unification of biology. Nat Genet 25, 25–29 (2000). [DOI] [PMC free article] [PubMed] [Google Scholar]
- 107.Hao Y et al. Integrated analysis of multimodal single-cell data. Cell 184, 3573–3587.e29 (2021). [DOI] [PMC free article] [PubMed] [Google Scholar]
- 108.Bolger AM, Lohse M & Usadel B Trimmomatic: a flexible trimmer for Illumina sequence data. Bioinformatics 30, 2114–2120 (2014). [DOI] [PMC free article] [PubMed] [Google Scholar]
- 109.MacLean B et al. Skyline: an open source document editor for creating and analyzing targeted proteomics experiments. Bioinformatics 26, 966–968 (2010). [DOI] [PMC free article] [PubMed] [Google Scholar]
- 110.Li H & Durbin R Fast and accurate short read alignment with Burrows–Wheeler transform. Bioinformatics 25, 1754–1760 (2009). [DOI] [PMC free article] [PubMed] [Google Scholar]
- 111.John S et al. Chromatin accessibility pre-determines glucocorticoid receptor binding patterns. Nat Genet 43, 264–268 (2011). [DOI] [PMC free article] [PubMed] [Google Scholar]
- 112.Ross-Innes CS et al. Differential oestrogen receptor binding is associated with clinical outcome in breast cancer. Nature 481, 389–393 (2012). [DOI] [PMC free article] [PubMed] [Google Scholar]
- 113.Heinz S et al. Simple Combinations of Lineage-Determining Transcription Factors Prime cis-Regulatory Elements Required for Macrophage and B Cell Identities. Mol Cell 38, 576–589 (2010). [DOI] [PMC free article] [PubMed] [Google Scholar]
- 114.Ramírez F et al. deepTools2: a next generation web server for deep-sequencing data analysis. Nucleic Acids Res 44, W160–W165 (2016). [DOI] [PMC free article] [PubMed] [Google Scholar]
- 115.Quinlan AR & Hall IM BEDTools: a flexible suite of utilities for comparing genomic features. Bioinformatics 26, 841–842 (2010). [DOI] [PMC free article] [PubMed] [Google Scholar]
- 116.Yu G, Wang L-G, Han Y & He Q-Y clusterProfiler: an R Package for Comparing Biological Themes Among Gene Clusters. Omics J Integr Biology 16, 284–287 (2012). [DOI] [PMC free article] [PubMed] [Google Scholar]
- 117.Yu G, Wang L-G & He Q-Y ChIPseeker: an R/Bioconductor package for ChIP peak annotation, comparison and visualization. Bioinformatics 31, 2382–2383 (2015). [DOI] [PubMed] [Google Scholar]
- 118.Xi Y & Li W BSMAP: whole genome bisulfite sequence MAPping program. Bmc Bioinformatics 10, 232–232 (2009). [DOI] [PMC free article] [PubMed] [Google Scholar]
- 119.Sun D et al. MOABS: model based analysis of bisulfite sequencing data. Genome Biol 15, R38–R38 (2014). [DOI] [PMC free article] [PubMed] [Google Scholar]
- 120.Feng H, Conneely KN & Wu H A Bayesian hierarchical model to detect differentially methylated loci from single nucleotide resolution sequencing data. Nucleic Acids Res 42, e69–e69 (2014). [DOI] [PMC free article] [PubMed] [Google Scholar]
Associated Data
This section collects any data citations, data availability statements, or supplementary materials included in this article.
Data Availability Statement
RNA-seq, ATAC-seq, and CUT&Tag data have been deposited in the Gene Expression Omnibus (GEO) under accession code GSE203492. Single-cell RNA-seq data are deposited under GSE203536. RRBS and WGBS data are available under GSE203606. The publicly available datasets used in this study are: GSE90893, GSE111172, GSE77420. All other data supporting the findings of this study are available from the corresponding authors upon reasonable request.