

Summary
Neuroendocrine carcinomas, such as neuroendocrine prostate cancer and small-cell lung cancer, commonly have a poor prognosis and limited therapeutic options. We report that ubiquitin carboxy-terminal hydrolase L1 (UCHL1), a deubiquitinating enzyme, is elevated in tissues and plasma from patients with neuroendocrine carcinomas. Loss of UCHL1 decreases tumor growth and inhibits metastasis of these malignancies. UCHL1 maintains neuroendocrine differentiation and promotes cancer progression by regulating nucleoporin, POM121, and p53. UCHL1 binds, deubiquitinates, and stabilizes POM121 to regulate POM121-associated nuclear transport of E2F1 and c-MYC. Treatment with the UCHL1 inhibitor LDN-57444 slows tumor growth and metastasis across neuroendocrine carcinomas. The combination of UCHL1 inhibitors with cisplatin, the standard of care used for neuroendocrine carcinomas, significantly delays tumor growth in pre-clinical settings. Our study reveals mechanisms of UCHL1 function in regulating the progression of neuroendocrine carcinomas and identifies UCHL1 as a therapeutic target and potential molecular indicator for diagnosing and monitoring treatment responses in these malignancies.
Keywords: UCHL1, neuroendocrine carcinomas, neuroendocrine prostate cancer, small cell lung cancer, neuroblastoma, nuclear pore complex
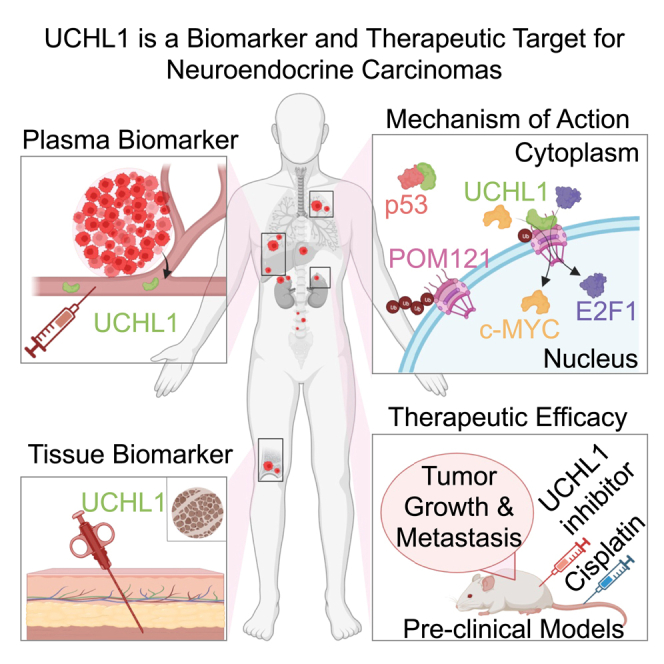
Graphical abstract
Highlights
-
•
UCHL1 is a potential molecular indicator for neuroendocrine carcinomas
-
•
UCHL1 regulates neuroendocrine carcinoma tumor growth and metastasis
-
•
UCHL1 stabilizes POM121 and regulates POM121-driven E2F1 nuclear localization
-
•
UCHL1 is a therapeutic target for neuroendocrine carcinomas and neuroblastoma
Liu et al. identify UCHL1 as a blood and tissue marker that is elevated across cancers with neuroendocrine features. These cancers are characterized by poor patient outcomes and lack effective treatments. UCHL1 inhibition exhibits anticancer effects in malignancies with neuroendocrine features, presenting a potent therapeutic strategy for these patients.
Introduction
Neuroendocrine neoplasms can be categorized into well-differentiated neuroendocrine tumors and poorly differentiated neuroendocrine carcinomas.1 Neuroendocrine neoplasms can originate from different primary sites, including the lungs, prostate, gastrointestinal tract, pancreas, and others, and can be classified and graded by two key markers, Ki67 and mitotic index.1 Neuroendocrine carcinomas, such as neuroendocrine prostate cancer (NEPC) and small-cell lung cancer (SCLC), share common histological features, including expression of neuroendocrine markers, high Ki67 labeling index, aggressive disease course, rapid relapse after treatment, and poor clinical outcome.2,3,4 These shared features have been attributed in part to common gene expression programs and oncogenic mechanisms underlying their development.5,6 NEPC is a highly aggressive subtype of prostate cancer that is rare in treatment-naive and localized disease but common in relapsed prostate cancers after treatment with second-generation anti-androgen therapies.4 Likewise, SCLC, which accounts for approximately 15% of lung cancers, is characterized by high expression of neuroendocrine markers and has an aggressive clinical course.7 Increasing studies show that poorly differentiated neuroblastoma shares common drivers, signaling pathways, and therapeutic vulnerabilities with SCLC and NEPC.8,9,10,11 Neuroblastoma, a neural crest-derived tumor with many phenotypic commonalities with neuroendocrine differentiation in other organs, is the most common extracranial solid tumor in children.12 About half of neuroblastoma patients present with disseminated disease at the time of diagnosis, and the 5-year survival rate of high-risk neuroblastoma is about 50%.12,13 The poor clinical prognosis of SCLC, NEPC, and poorly differentiated neuroblastoma renders a critical clinical need to identify therapeutic targets and minimally invasive approaches to diagnose these malignancies, ideally across multiple cancer types.
Current therapies for neuroendocrine carcinomas and poorly differentiated neuroblastoma include combinations of chemotherapy, radiation, and immunotherapy, but these treatments only extend patients’ survival for a few months.12,14,15 Transcriptomic and genomic analyses of neuroendocrine carcinomas have provided a better understanding of their development. Inactivating mutations of tumor suppressors, TP53 and RB1, are characteristics of poorly differentiated neuroendocrine carcinomas, including SCLC and NEPC.16,17 In addition, high expression levels of E2F1, SOX2, EZH2, MYCN, BRN2, and ASCL1 play essential roles in promoting lineage plasticity and driving neuroendocrine differentiation, making them promising therapeutic targets in cancers with neuroendocrine differentiation.5,16,18,19,20,21,22,23,24,25,26 For instance, genomic amplification of MYCN is observed in patients with SCLC, approximately 20% of patients with neuroblastoma, and 40% of patients with NEPC.12,27,28,29 MYCN amplification mediates metabolic reprogramming by enhancing fatty acid uptake in neuroblastoma.30 MYCN binds directly at the EZH2 promoter to promote neuroblastoma progression.21 E2F1 is a key regulator of treatment-emergent NEPC and drives NEPC lineage plasticity by repressing the androgen receptor (AR).26 Bioinformatic analysis revealed that both primary prostate basal cells with stem-like characteristics and NEPC cells share a similar gene network associated with E2F targets.31 These results suggest that E2F1 plays an essential role in neuroendocrine differentiation in cancer. Nevertheless, there is still an urgent unmet need to identify more effective mechanism-based therapies for neuroendocrine carcinomas and poorly differentiated neuroblastoma.
Ubiquitin carboxy-terminal hydrolase L1 (UCHL1) is a protease with a dual function in regulating protein stability. UCHL1 removes and recycles ubiquitin from proteins being degraded to maintain the cellular ubiquitin pool and to stabilize proteins.32,33 Additionally, UCHL1 can ubiquitinate target proteins and thus enhance their protein degradation.34 UCHL1 is a secreted protein,35,36 making it an ideal candidate biomarker for minimally invasive cancer detection. A potential oncogenic role of UCHL1 has been reported in lymphoma and colorectal cancer.37,38,39 However, the functional role and therapeutic potential of UCHL1 in neuroendocrine carcinomas and neuroblastoma have not been reported previously.
Nuclear pore complexes regulate the nucleocytoplasmic transport of macromolecules.40,41,42 The functional roles of nuclear pore complexes in cancers remain poorly understood. Nucleoporin POM121 is a member of the nuclear pore complex members and may serve as a prognostic biomarker in lung cancer, colorectal cancer, and oral squamous cell carcinoma.43,44,45 POM121 promotes lung cancer tumorigenesis and metastasis.46 In the context of prostate cancer, POM121 drives cancer progression by increasing E2F1 and MYC nuclear import.47
In this study, we demonstrate that UCHL1 is highly expressed in neuroendocrine neoplasms and detectable in the plasma from patients with NEPC and SCLC. Our results indicate that UCHL1 could serve as a molecular biomarker for the diagnosis of neuroendocrine carcinomas and neuroblastoma and potentially for predicting and monitoring responses to therapy. Our study further reveals a functional role of UCHL1 in SCLC and NEPC. Loss of UCHL1 significantly decreases tumor growth and metastasis. Proteomic analysis demonstrates that pathways involved in cancer progression, such as E2F targets, MYC targets, and mTOR signaling, are altered upon downregulation of UCHL1. UCHL1 directly binds to p53 and POM121 to regulate tumor progression and neuroendocrine differentiation. Upon binding, UCHL1 destabilizes p53 associated with neuroendocrine differentiation and stabilizes POM121, allowing rapid import of c-MYC and E2F1 transcriptional factors previously implicated in cancer progression. Most importantly, our results showed that treatment with a UCHL1 inhibitor significantly delays neuroendocrine carcinoma and neuroblastoma growth and decreases the metastatic burden of NEPC and SCLC both as a single agent and in combination with cisplatin. These results together strongly suggest that UCHL1 represents a potent therapeutic target in neuroendocrine carcinomas and neuroblastoma and is a molecular indicator of these malignancies.
Results
UCHL1 is highly expressed in neuroendocrine neoplasms
To identify druggable targets for NEPC patients, we analyzed a previously published proteomics dataset of metastatic NEPC driven by the Trop2 oncogene (TD-NEPC).48 From this analysis, we identified UCHL1 as one of the top druggable proteins with increased levels in TD-NEPC compared with non-neuroendocrine castration-sensitive LNCaP prostate cancer (CSPC) xenograft tumors (Figures 1A and S1A).48 Increasing evidence has shown that cancers with neuroendocrine differentiation share commonalities in gene expression, druggable targets, and therapeutic vulnerabilities.5,6,9,49 Thus, we further evaluated UCHL1 levels in tissues from patients with other neuroendocrine neoplasms. Immunohistochemical analysis revealed elevated UCHL1 levels in human neuroendocrine neoplasms tissues, including human NEPC, SCLC, lung carcinoid tumors, neuroblastoma, gastrointestinal neuroendocrine neoplasms, and pancreatic neuroendocrine neoplasms, as well as in NEPC patient-derived xenografts (PDXs) compared with castration-resistant prostate adenocarcinoma (adeno-CRPC), non-SCLC (NSCLC), other types of non-neuroendocrine neoplasms, and adeno-CRPC PDXs (Figures 1B–1E, S1B, and S1C). High levels of UCHL1 protein were found in 56% of NEPC, 80% of lung carcinoid, 90% of SCLC, 96% of neuroblastoma, and 84% of other neuroendocrine neoplasms compared with 3% of benign prostate tissues, 5% localized prostate adenocarcinoma, 8% adeno-CRPC, 22% NSCLC, and 0% of other non-neuroendocrine neoplasms (Figures 1B–1E). Additionally, mRNA levels of UCHL1 were elevated in NEPC and SCLC tumor samples from PDXs and patients compared with normal prostate tissues and adeno-CRPC and with NSCLC and normal lung tissues, respectively (Figures 1F, 1G, S1D, and S1E).
Figure 1.

UCHL1 is highly expressed in neuroendocrine neoplasms
(A) A heatmap represents fold change of increased proteins in TD-NEPC (Trop2-driven neuroendocrine prostate cancer) tumor xenografts compared with CSPC (LNCaP-RFP) control tumors from a published proteomic analysis.48
(B‒E) Representative images and quantification of IHC staining for UCHL1 in patient prostate tissues (B), lung cancers (C), other neuroendocrine neoplasms (NENs) (D), and neuroblastoma (E). Prostate tissues (B) include benign prostate tissues (n = 37), localized prostate cancer (PC) (n = 44), adenocarcinoma castration-resistant prostate cancer (adeno-CRPC; n = 25), and NEPC (n = 25). Scale bars, 100 μm (top) and 40 μm (bottom). Lung tissues (C) include non-small cell lung cancer (NSCLC; n = 36), lung carcinoid tumors (n = 15), and small cell lung cancer (SCLC; n = 11). Scale bars, 20 μm (top) and 10 μm (bottom). Other NENs (n = 37) include gastrointestinal neuroendocrine carcinomas (GI NECs; n = 3), well-differentiated GI neuroendocrine tumors (GI NETs; n = 14), well-differentiated pancreatic NETs (n = 17), poorly differentiated pancreatic NECs (n = 3), and non-NEN GI carcinomas (n = 15) (D). Scale bars, 20 μm (top) and 10 μm (bottom). (E) includes neuroblastoma (n = 27) in a tissue microarray (TMA) format. Scale bar, 200 μm (top) and 25 μm (bottom). UCHL1 staining intensity is scored from 0 to 3 (0 is negative and marked as blue, 1 is low and marked as beige, 2 is medium and marked as light brown, 3 is strongly positive and marked as dark brown). Z score distribution analysis was performed for comparison of two groups (two tailed).
(F) Principal-component analysis of UCHL1 based on RNA sequencing data from normal tissues adjacent to lung adenocarcinoma (LUAD) or normal tissues adjacent to prostate adenocarcinoma (PRAD) and from LUAD, CRPC, SCLC, and NEPC patient biopsy tissues from Balanis et al.49
(G) UCHL1 mRNA Z score in human prostate tissues (NEPC vs. adeno-CRPC from Beltran et al.50 and lung tissues from Bhattacharjee et al.51).
(H) Western blot showing UCHL1 protein levels in cancer cell lysates and cell culture media. Red indicates NEC cell lines. DU145 is an AR-negative and NE-like prostate cancer cell line and is indicated in green.
(I) Protein levels of UCHL1 in media from the indicated cancer cell lines determined by ELISA.
(J) UCHL1 levels in plasma from mice bearing prostate cancer PDXs. Assessment of plasma UCHL1 level was performed on mice bearing adeno-CRPC (LuCaP 23.1, LuCaP 35, LuCaP 86.2, and LuCaP 96) or NEPC (LuCaP 49, LuCaP 93, LuCaP 145.1, and LuCaP 173.1) PDXs. For each PDX, plasma from three individual mice was tested by ELISA (adeno-CRPC [n = 12] vs. NEPC [n = 12]).
(K) UCHL1 levels in plasma of patients with SCLC (n = 8) vs. NSCLC (n = 17) and localized PC (n = 9) vs. NEPC (n = 8), determined by ELISA. UCHL1 plasma levels were compared by Student’s t test (two tailed).
∗p < 0.05, ∗∗p < 0.01, ∗∗∗p < 0.005, ∗∗∗∗p < 0.001; n.s., not significant.
High levels of UCHL1 were also detected in the culture media of cancer cell lines with neuroendocrine differentiation, including NEPC cells (TD-NEPC and H660), AR-negative NE-like prostate cancer cells (DU145), SCLC cells (NJH29 and NCI-H82), and MYCN-amplified neuroblastoma cells (IMR-32) by western blot and sandwich enzyme-linked immunosorbent assay (ELISA) (Figures 1H and 1I). Additionally, UCHL1 levels in NEPC PDX mouse plasma were higher than in adeno-CRPC PDX mouse plasma (Figure 1J). Likewise, high levels of UCHL1 were detected in the plasma from mice bearing SCLC and neuroblastoma xenografts (Figure S1F). Importantly, we observed that UCHL1 plasma levels in SCLC and NEPC patients were significantly higher than those in patients with NSCLC and localized prostate adenocarcinoma, respectively (Figure 1K). Taken together, these results indicate that UCHL1 has potential to be used as a tissue and plasma molecular indicator for neuroendocrine carcinomas and neuroblastoma and represents a rational therapeutic target for these malignancies.
UCHL1 regulates the growth and neuroendocrine differentiation of neuroendocrine carcinomas
Consistent with the levels of UCHL1 in tissues of patients with neuroendocrine carcinomas, we observed high levels of UCHL1 in NEPC, AR-negative NE-like, and SCLC cell lines and tumor xenografts (Figures S2A‒S2C). To test the role of UCHL1 in tumor growth, we generated stable prostate cancer adenocarcinoma cell lines (22Rv1 and C4-2) with overexpression of wild-type (WT) UCHL1 or a catalytically inactive UCHL1 mutant (C90S) as well as NEPC (TD-NEPC) and SCLC (NCI-H82) cell lines with downregulation (knockdown) or genetic loss (knockout) of UCHL1 (Figures 2A and S2D‒S2H). Notably, overexpression of WT UCHL1 in prostate adenocarcinoma cells increased the levels of a neuroendocrine marker, synaptophysin (SYP), while knockout of UCHL1 in NEPC and SCLC cell lines decreased expression levels of neuroendocrine markers and a stem cell marker, SOX2 (Figures 2A, and S2E‒S2G). Overexpression of WT UCHL1 enhanced cell growth, as measured by colony formation ability (Figures 2B and S2I), whereas loss of UCHL1 in NEPC cells decreased their clonogenic potential (Figures 2C and S2I). As expected, overexpression of inactive UCHL1(C90S) did not affect SYP expression or colony formation of 22Rv1 cells (Figures 2A and 2B). More importantly, overexpression of WT UCHL1 increased prostate adenocarcinoma tumor growth in vivo (Figure 2D). Consistently, overexpression of WT UCHL1 in adeno-CRPC tumor xenografts increased levels of the neuroendocrine markers CD56, SYP, and chromogranin-A (CgA), suggesting that UCHL1 mediates neuroendocrine differentiation (Figure 2E). Silencing or gene deletion of UCHL1 in NEPC cells significantly decreased tumor growth (Figures 2F, 2G, and S2J) and reduced the expression of neuroendocrine markers (Figures 2H and S2K), demonstrating that UCHL1 regulates NEPC growth and neuroendocrine differentiation in vivo.
Figure 2.

UCHL1 regulates cancer cell growth in vitro and in vivo
(A) UCHL1 and SYP levels in 22Rv1-RFP, 22Rv1-UCHL1-OV (WT UCHL1), and 22Rv1-UCHL1(C90S) cells were determined by western blot (WB) (left). SOX2, CD56, SYP, and UCHL1 levels in UCHL1 knockout pool cells were assessed by WB (right).
(B and C) Colony formation assays of 22Rv1 with or without WT UCHL1 or UCHL1(C90S) overexpression (B) and colony formation assays of TD-NEPC parental (no transfection) cells, CTL (transfection with control non-targeting sgRNA), and UCHL1 knockout (transfection with multi-sgRNA targeting UCHL1) single-cell selection clones (C). Scale bar, 1 cm. The percentage of colony area per well was quantified using ImageJ. All experiments were performed in triplicate. Error bars, SD.
(D) Subcutaneous tumor growth (left) and tumor weight (right) of 22Rv1-RFP (n = 10) and 22Rv1-UCHL1-OV (n = 10). Error bars represent standard error of the mean (SEM).
(E) IHC staining of UCHL1, androgen receptor (AR) and SYP, CgA, and CD56 in 22Rv1 xenografts. Scale bar, 10 μm.
(F) Subcutaneous tumor growth of TD-NEPC parental (no transduction), CTL 1 and 2, and UCHL1 knockout 1, 2, and 3 single-cell selection clone xenografts. Error bars represent SEM.
(G) Harvested tumors (left) and tumor weights (right) at the endpoint (scale bar, 1 cm).
(H) IHC staining for UCHL1, SYP, CgA, and CD56 in TD-NEPC parental, CTL, and UCHL1 knockout (KO) xenografts. Scale bars, 10 μm.
∗p < 0.05, ∗∗p < 0.01, ∗∗∗p < 0.005, ∗∗∗∗p < 0.001, determined by Student’s t test.
UCHL1 regulates cell migration, invasion, and metastasis of neuroendocrine carcinomas
Overexpression of WT UCHL1 in prostate adenocarcinoma cells promoted migration and invasion, whereas loss of UCHL1 in NEPC cells significantly reduced migration and invasion in vitro (Figures S3A‒S3C). Based on these findings, we tested the role of UCHL1 in metastatic colonization at distant sites using an intracardiac injection model (Figure 3A). Silencing or genetic loss of UCHL1 in TD-NEPC cells dramatically decreased metastatic colonization, as assessed by whole-body bioluminescence imaging (BLI) and metastasis incidence (Figures 3B–3E and S3D‒S3G). We observed a significant decrease in metastasis to the bone and liver upon UCHL1 knockdown and knockout (Figures 3C–3E, S3E, and S3F). These findings are consistent with the metastatic progression in clinical prostate cancer, where bone is the most frequent site of metastasis, and liver metastasis is associated with worse outcomes and neuroendocrine differentiation in patients.52 Similarly, the number of metastatic nodules in the lungs decreased upon UCHL1 knockdown compared with control cells (Figure S3G). In concordance, SCLC cells with UCHL1 knockdown exhibited a decrease in metastatic colonization and metastasis incidences (Figures 3F–3H). Liver and lymph nodes are two common metastatic sites of SCLC, and we observed much fewer and smaller metastatic nodules in liver and lymph nodes in the UCHL1 knockdown SCLC group compared with the controls (Figures 3G and 3H).
Figure 3.

UCHL1 regulates NEPC and SCLC metastasis in vivo
(A) Cartoon depicting the experimental design, generated using BioRender (https://biorender.com).
(B) Whole-body BLI of the intracardiac injection metastasis model generated with TD-NEPC-CTL 1 (n = 7), TD-NEPC-CTL 2 (n = 8), TD-NEPC-UCHL1 KO 1 (n = 9), and TD-NEPC-UCHL1 KO 2 (n = 8) cells on day 14 after injection. The bioluminescence signal was quantified (right).
(C) Representative fluorescence images of metastatic nodules in bone (scale bar, 1 mm). Shown are the percentage and number of animals with bone metastasis over the total number of animals (right). The Z score test for two population proportions was performed for the comparison of two groups.
(D) Representative fluorescence images of metastatic nodules in excised liver (scale bar, 1 mm). The percentage of liver metastasis-positive animals over total animal number was quantified (right).
(E) The number and size of metastases in liver from (D) were quantified. Error bars depict SD.
(F) BLI of mice injected with SCLC shCtl, shUCHL1#1, and shUCHL1#2 cells via intracardiac injection. Whole-body bioluminescence intensity was quantified and is shown for day 21 on the right.
(G) Representative GFP fluorescence images of lymph nodes (LN) (left). The percentage of mice with LN metastases was quantified (right). Scale bars, 2 mm.
(H) Representative GFP fluorescence images of liver excised from animals in (F) (scale bar, 2 mm). Shown are the number and size of liver metastases based on GFP focus count (right).
∗p < 0.05, ∗∗p < 0.01, ∗∗∗p < 0.005, ∗∗∗∗p < 0.001, determined by Student’s t test.
We further tested the role of UCHL1 in NEPC metastasis utilizing a spontaneous metastasis model (Figure S3H). Consistently, we found a decrease in metastatic incidence and size of metastatic nodules in liver, lungs, and lymph nodes in the UCHL1 knockdown group compared with the control group (Figures S3I‒S3L). Collectively, these data demonstrate an essential role of UCHL1 in regulating metastasis and metastatic colonization of NEPC and SCLC.
Modulation of UCHL1 mediates changes in pathways associated with neuroendocrine differentiation
To delineate the molecular mechanism underlying the function of UCHL1 in neuroendocrine carcinomas, we evaluated changes in protein levels mediated by knockdown of UCHL1 in TD-NEPC xenografts (Figures 4A and 4B). Pathway analysis and gene set enrichment analysis (GSEA) of proteins with decreased expression upon UCHL1 knockdown demonstrated that MYC targets, oxidative phosphorylation, E2F targets, and mTOR signaling were the most downregulated pathways (Figures 4B–4D). E2F1 was highly expressed in NEPC and SCLC compared with normal prostate and adeno-CRPC and with normal lung tissues and NSCLC, respectively (Figure S4A). E2F1 is one of the key factors driving neuroendocrine differentiation.26,53 These results demonstrate that changes in UCHL1 levels modulate pathways implicated in neuroendocrine differentiation and that UCHL1 is associated with neuroendocrine differentiation and E2F signaling. We further explored the levels of 85 proteins with decreased levels upon UCHL1 knockdown in multiple cancers with neuroendocrine differentiation datasets (Figure 4E). The levels of 20 of 85 protein targets were higher in NEPC tissues than in adeno-CRPC tissues (Figure 4E, top). Likewise, analyses of the Cancer Cell Line Encyclopedia (CCLE) datasets showed that the expression levels of 32 of 85 targets associated with UCHL1 were significantly higher in SCLC than in NSCLC (Figure 4E, center). Gliomas have often been used as a non-neuroendocrine-type comparator for neuroblastoma,9,54 and our results demonstrated that the expression levels of 40 of 85 targets associated with UCHL1 were higher in neuroblastoma compared with glioma (Figure 4E, bottom).
Figure 4.

UCHL1 modulates pathways associated with neuroendocrine differentiation
(A) Volcano plot of the global protein changes in TD-NEPC UCHL1 knockdown tumor xenografts compared with TD-NEPC control tumor xenografts. UCHL1 and POM121 are indicated. p < 0.01 and fold change (log2) less than −1.5 or greater than 1.5 were chosen as cutoffs. Blue dots indicate proteins with decreased levels, and red dots indicate proteins with increased levels after UCHL1 knockdown.
(B) Heatmap displaying fold change of the 86 proteins with decreased levels in UCHL1 knockdown xenografts compared with control xenografts. UCHL1, POM121, and E2F targets are indicated.
(C) Significantly enriched pathways of 86 proteins with decreased levels upon UCHL1 knockdown from proteomics analysis (MSigDB Hallmark 2020). The x axis represents the −log10 (p value).
(D) GSEA of the decreased proteins upon UCHL1 knockdown from the proteomics analysis.
(E) Pan-NEC analysis of the 86 downregulated targets upon UCHL1 knockdown in the Beltran et al.50 and CCLE datasets.50,55
(F) String UniProt keywords pathway analysis of proteins with decreased levels from (B). Top enriched pathways were indicated.
(G) The indicated protein levels in UCHL1 KO cells measured by immunofluorescence imaging. Scale bar, 20 μm.
(H) The indicated protein levels in 22Rv1-WT UCHL1-overexpressing cells were assessed by WB.
(I) The indicated protein levels in LDN-57444 (LDN)-treated TD-NEPC cells were assessed by WB. Cells were treated with LDN (0, 5, 10, 20, and 40 μM) for 72 h.
(J) The quantification of the WB from (I).
(K) WB of E2F1 and c-MYC levels in the cytoplasm and nucleoplasm of TD-NEPC control and UCHL1 KO cells or TD-NEPC cells treated with vehicle or LDN (left) and WB of E2F1 and c-MYC levels in the cytoplasm and nucleoplasm of H660 cells treated with vehicle or LDN (right).
(L) mRNA levels of the topmost decreased MYC and E2F targets indicated in the proteomics analysis. TD-NEPC cells and H660 cells were treated with LDN(10 μM) or vehicle (Veh) for 72 h before harvesting.
∗∗p < 0.01, ∗∗∗p < 0.005, and ∗∗∗∗p < 0.001, determined by Student’s t test. Error bars depict SD.
MYC targets, protein secretion, and glycolysis were identified as the top three enriched pathways among proteins with increased levels upon UCHL1 knockdown (Figures S4B and S4C). Pan-neuroendocrine carcinoma analysis in CCLE datasets demonstrated that 15 of 86 proteins with increased levels upon UCHL1 knockdown were significantly lower in SCLC compared with NSCLC and that 17 of 86 upregulated proteins were decreased in neuroblastoma relative to glioma (Figure S4D). Furthermore, 10 of 86 proteins with increased levels after UCHL1 knockdown were decreased in both SCLC and neuroblastoma relative to NSCLC and glioma from CCLE datasets (Figure S4E). Consistent with results obtained from the downregulation of UCHL1, proteomic analysis of H660 NEPC xenografts treated with a UCHL1 inhibitor, LDN-57444, significantly decreased levels of MYC targets, E2F targets, and mTOR signaling compared with controls (Figures S4F‒S4I). These results further demonstrate that changes in UCHL1 levels modulate neuroendocrine differentiation and pathways associated and implicated in neuroendocrine carcinomas and neuroblastoma.
String pathways for 86 proteins with decreased levels upon UCHL1 knockdown revealed that the top pathways of the UniProt keywords were related to the nuclear pore complex, neurodegeneration, and proteasome pathways (Figure 4F). Nucleoporin POM121 belongs to the nuclear pore complex and has been shown to drive prostate cancer aggressiveness.47 Thymopoietin (TMPO), a nuclear membrane protein, is one of the E2F targets that is associated with neuroendocrine signatures.31,56 Loss of p53 is another common genetic alteration in neuroendocrine carcinomas and has been shown to be potentially regulated by UCHL1 in nasopharyngeal carcinoma.16,34,50,57 Given that, we tested whether UCHL1 regulates neuroendocrine differentiation via decreasing p53 and increasing the POM121-mediated nuclear transport of E2F1 and c-MYC. First, we measured the levels of the top two downregulated proteins upon UCHL1 knockdown, POM121 and TMPO, as well as the neuroendocrine markers c-MYC, E2F1, and p53 upon modulation of UCHL1 (Figures 4G–4J, S4J, and S4N). POM121, TMPO, E2F1, c-MYC, and neuroendocrine markers were all decreased upon knockdown or inhibition of UCHL1 (Figures 4G, 4I, 4J, S4J, and S4K). Likewise, we observed an increase in POM121, TMPO, E2F1, c-MYC, and SYP upon overexpression of WT UCHL1 (Figures 4H, S4L, and S4M). Conversely, we observed an increase in p53 levels in UCHL1 knockout cells and a decrease in p53 levels in WT UCHL1-overexpressing cells (Figures 4H and S4N). Because POM121 mediates the nucleocytoplasmic transport of proteins, we evaluated levels of cytoplasmic and nuclear c-MYC and E2F1 in UCHL1 knockout cells and cells treated with LDN-57444. Loss or inhibition of UCHL1 decreased the nuclear localization of c-MYC and E2F1 in NEPC (Figure 4K). Interestingly, inhibition of UCHL1 in neuroendocrine carcinoma cell lines decreased the levels of MYCN, a key factor that drives neuroendocrine differentiation (Figures 4K and S4K). Next, we further validated the most decreased MYC and E2F direct targets from our proteomics analysis in UCHL1 knockout cells and neuroendocrine carcinoma cell lines treated with LDN-57444. Loss or inhibition of UCHL1 in neuroendocrine carcinomas and neuroblastoma significantly decreased MYC targets (COX5A, LDHA, and CCT5) and E2F targets (HMGB3, LBR, and HMGB2) at the protein and mRNA levels (Figures 4L, S5A, and S5B). Altogether, these results indicate that UCHL1 regulates p53, POM121, and POM121-mediated nuclear localization of c-MYC, E2F1, and their downstream targets in cancers with neuroendocrine differentiation.
UCHL1 binds to POM121 and p53 and regulates their ubiquitination and stability
To further delineate the molecular mechanism through which UCHL1 regulates POM121 and p53 levels, we evaluated whether UCHL1 interacts with POM121 and p53. Immunoprecipitation followed by western blot in NEPC and SCLC demonstrated that UCHL1 was bound to POM121 and p53 (Figures 5A and S5C). Moreover, we detected the interaction of POM121 with UCHL1 in vivo in NEPC PDX tissues by a proximity ligation assay (PLA) (Figure 5B). A biolayer interferometry assay demonstrated that p53 and UCHL1 had high-affinity binding with a KD value of 2.5 ± 1.7 nM in vitro (Figure 5C). Immunofluorescence staining and PLA revealed that UCHL1 co-localized with and was bound to p53 in TD-NEPC cells and NJH29 xenografts, respectively (Figures 5D, S5D, and S5E). These data revealed that UCHL1 interacts directly with POM121 and p53 in neuroendocrine carcinomas.
Figure 5.

UCHL1 binds p53 and POM121 to regulate their stabilities
(A) Endogenous protein interactions were examined in TD-NEPC cells and NJH29 cells by immunoprecipitation (IP) with anti-rabbit immunoglobulin G (IgG) or anti-UCHL1 antibody and analyzed by WB with antibodies to detect UCHL1, POM121, p53, E2F1, and actin.
(B) POM121 and UCHL1 interaction was examined on CRPC (n = 3) and NEPC (n = 3) LuCaP PDX tissues by PLA in situ assay. Positive signal was quantified from 3 images of each PDX model. Data are presented with SD.
(C) The binding affinity of p53 with UCHL1 was assessed by biolayer interferometry assay. His-tagged UCHL1 (200 nM) was loaded on Octet NTA biosensors and incubated with serially diluted p53. The sensorgram was fitted using a 1:1 binding model (dashed line in red), and the KD value was calculated based on rates of association and dissociation yielded by the fitted curve.
(D) PLA of p53 with UCHL1 in NJH29 xenografts. Scale bar, 5 μm.
(E) The half-life of POM121 was determined in UCHL1 KO cells by cycloheximide (CHX; 10 μM) assay. The level of POM121 was normalized based on GAPDH level (right).
(F) Ubiquitination of POM121 upon UCHL1 modulation. HEK293T cells were transfected with the indicated constructs for 48 h and treated with MG132 (10 μM) for 5 h before harvesting. POM121 was immunoprecipitated with anti-V5-antibody and immunoblotted with anti-ubiquitin (Ub) antibody.
(G) Ubiquitination of POM121 upon LDN treatment. TD-NEPC cells were treated with LDN (0, 20, and 40 μM). Endogenous POM121 was immunoprecipitated with anti-POM121 antibody and immunoblotted with anti-Ub antibody.
(H) Ubiquitination of p53 upon overexpression of WT UCHL1(WT). HEK293T cells were transfected with the indicated constructs for 48 h and treated with MG132 (10 μM) for 5 h before harvesting. p53 was immunoprecipitated with anti-p53 antibody and immunoblotted with anti-Ub antibody.
(I) IHC staining of POM121 in a TMA containing normal (n = 22) vs. localized PC (n = 22) and the LuCaP PDX TMA including CRPC (n = 21) and NEPC (n = 5). Scale bars, 20 μm. POM121 was scored from 0 to 3. Percentages of 0, 1, 2, and 3 scores in each group were calculated (right). Z score distribution analysis was performed for comparison of two groups (two tailed).
(J) WB of the indicated protein levels in TD-NEPC CTL and TD-NEPC UCHL1 KO cells with or without POM121 overexpression.
(K) Colony formation assay of TD-NEPC CTL and TD-NEPC UCHL1 KO cells with or without POM121 overexpression. The percentage of colony area per well was quantified using ImageJ and normalized to the TD-NEPC CTL-EV clone.
(L) 3D Matrigel drop assay of TD-NEPC CTL and TD-NEPC UCHL1 KO cells with or without POM121 overexpression. The percentage of invaded area of each drop was normalized to the TD-NEPC CTL-EV clone. Scale bars, 500 μm. The invasive area was quantified.
For (K) and (L), all experiments were performed in triplicate. Error bars represent SD. For all, ∗p < 0.05, ∗∗p < 0.01, ∗∗∗p < 0.005, ∗∗∗∗p < 0.001, determined by Student’s t test.
UCHL1 is a dual-function protein that can ubiquitinate to destabilize or deubiquitinate to stabilize targeted proteins.34,58 The catalytically inactive mutant (C90S) of UCHL1 is critical for both hydrolase and ligase activity of UCHL1.58,59,60 First, we interrogated the effect of UCHL1 on the stability of POM121 and p53. Using a cycloheximide (CHX) chase assay, we found that loss of UCHL1 decreased the half-life of POM121 relative to control cells (Figure 5E). In accordance with these results, overexpression of WT UCHL1 abrogated the ubiquitination of POM121, while inhibition of UCHL1 significantly enhanced POM121 ubiquitination (Figures 5F and 5G). Indeed, overexpression of UCHL1 with the catalytically inactive mutant (C90S) had no effect on the ubiquitination of POM121, further supporting the hypothesis that UCHL1 regulates POM121 stability (Figure 5F). In contrast to POM121, loss of UCHL1 extended the half-life of p53, while overexpression of WT UCHL1 increased the ubiquitination of p53, which promoted p53 degradation, thus remarkably shortening the half-life of p53 (Figures 5H and S5F‒S5H). This effect was rescued by overexpression of UCHL1(C90S) and treatment with MG132, a proteasome inhibitor (Figures S5G and S5H). Taken together, our results indicate that UCHL1 deubiquitinates POM121 to increase its stability, while UCHL1 ubiquitinates p53 to promote p53 degradation. These results suggest that UCHL1 may drive neuroendocrine differentiation by destabilizing p53 and stabilizing POM121, which increases the nuclear localization of c-MYC and E2F1.
Next, we evaluated the protein levels of POM121 in prostate cancer samples. Similar to UCHL1 expression, we found that 80% of NEPC patient-derived xenograft tissues had high levels of POM121 compared with 10% of adeno-CRPC PDX tissues, 0% of human localized prostate cancer (PC), and 0% of human benign prostate tissues (Figure 5I). Likewise, POM121 was highly expressed in tissues from patients with NEPC relative to tissues from patients with localized PC, suggesting the relevance of UCHL1-mediated regulation of POM121 in clinical settings (Figure S5I). In addition, nuclear pore complexes regulate nuclear-cytoplasmic transport to drive cancer progression. Interestingly, treatment with a potent nuclear transport inhibitor, KPT-330, decreased E2F1, c-MYC, and neuroendocrine marker levels, which is similar to the effects of the UCHL1 inhibitor (Figures 4I, 4K, and S5J).
To test whether UCHL1 regulates tumor growth, progression, and neuroendocrine differentiation via POM121, we performed rescue experiments with overexpression of POM121 in UCHL1 control and UCHL1 knockout NEPC cells. We demonstrated that overexpression of POM121 partially rescued the decrease in expression of neuroendocrine markers and E2F1 levels mediated by loss of UCHL1 (Figure 5J). More importantly, overexpression of POM121 partially rescued the decrease of neuroendocrine carcinoma cell growth and invasion ability upon UCHL1 knockout in vitro (Figures 5K and 5L). Our results suggest that UCHL1 regulates neuroendocrine differentiation, cell proliferation, and cell invasion partially through POM121.
Treatment with UCHL1 inhibitors alone or in combination with cisplatin delays neuroendocrine carcinoma growth
Next, we tested the therapeutic potential of blocking UCHL1 in pre-clinical models of neuroendocrine carcinomas and neuroblastoma. We utilized two UCHL1-specific inhibitors, LDN-5744461 and IMP-1710.62 Highly effective growth inhibition was observed in NEPC (H660 and TD-NEPC), SCLC (NCI-H82), and neuroblastoma (IMR-32) cell lines upon treatment with UCHL1-specific inhibitors, LDN-57444 and IMP-1710 (Figures S6A‒S6D). As expected, prostate adenocarcinoma (LNCaP) and NSCLC cell lines that are negative for UCHL1 (H358 and H1650) were not sensitive to LDN-57444 and IMP-1710, highlighting the specificity of the inhibitors (Figures S6A and S6C). Treatment with LDN-57444 and IMP-1710 significantly decreased the colony formation ability of TD-NEPC cells compared with vehicle in vitro (Figures S6B and S6D).
To further support the translational potential of UCHL1 inhibition, we tested the therapeutic efficacy of LDN-57444 and IMP-1710 in vivo (Figures 6A–6F and S6E‒S6G). We found that LDN-57444 treatment significantly delayed the tumor growth of NEPC, SCLC, and neuroblastoma cell line xenografts and NEPC and SCLC PDX models in vivo without any adverse effects on body weight or histology of liver and kidney tissues (Figures 6B–6E, and S7A‒S7D). Likewise, treatment with IMP-1710 delayed NEPC tumor growth in vivo (Figures S6E‒S6G). Consistent with the specificity observed in vitro, LDN-57444 had no effect on the tumor growth of a UCHL1-negative NSCLC xenograft model (Figure 6F). Furthermore, treatment with LDN-57444 significantly reduced the expression of the neuroendocrine markers CD56, SYP, and CgA while also reducing aggressiveness and proliferation in neuroendocrine carcinomas and neuroblastoma, measured by Ki67 labeling index (Figures 6G and S7E‒S7G). Intriguingly, UCHL1 plasma levels were decreased in mice treated with LDN-57444 compared with the vehicle-treated group, suggesting clinical potential of plasma UCHL1 as a minimally invasive molecular indicator for predicting and monitoring treatment response in neuroendocrine carcinomas (Figure S7H).
Figure 6.

UCHL1 inhibitor delays NEC and neuroblastoma growth in vivo
(A) Schematic of the experimental design.
(B) Growth curves of subcutaneous NEPC PDXs (LuCaP 173.1 and LuCaP 93) treated with Veh or LDN (5 mg/kg, daily), injected intraperitoneally (i.p.) (n = 6–7 per experimental group).
(C) Growth curves of two NEPC (H660 and TD-NEPC) xenografts treated with Veh or LDN (n = 7–10 per experimental group).
(D) Growth curves of two SCLC (PDX-NJH29 [n = 7–9 per experimental group] and NCI-H82 [n = 7 per experimental group]) xenografts treated with Veh or LDN.
(E) Growth curves of neuroblastoma xenograft (IMR-32) treated with Veh (n = 7) or LDN (n = 6).
(F) Growth curves of NSCLC (UCHL1 negative, H358) treated with Veh (n = 10) or LDN (n = 10).
For all, error bars depict SEM. Tumors were harvested when the average tumor volume of the Veh group reached ∼400 mm3.
(G) IHC staining for the indicated protein levels in LuCaP 173.1 and LuCaP 93 PDXs treated with Veh or LDN. Ki67 quantification of Veh- or LDN-treated LuCaP 173.1 and LuCap 93 xenografts was graphed. Scale bars, 20 μm. Data are represented as mean ± SD.
(H) Schematic of the experimental design of the combination therapy (BioRender).
(I) Growth curve of LuCaP 173.1 PDX treated with Veh, LDN (5 mg/kg, daily, i.p.), cisplatin (Cis; 5 mg/kg, every 7 days, intravenously [i.v.]), and LDN with Cis.
(J) Growth curve of NJH29 PDX treated with Veh, LDN, Cis, and LDN with Cis.
For all, ∗p < 0.05, ∗∗p < 0.01, ∗∗∗p < 0.005, ∗∗∗∗p < 0.001, determined by Student’s t test (two tailed) at the endpoint.
(K) Mouse body weight from the experiment in (I).
Platinum-based chemotherapy is the standard of care for SCLC and NEPC patients.14,63 Specifically, cisplatin is one of the most commonly used platinum-based therapies for NEPC, SCLC, and poorly differentiated neuroblastoma.14,63 To test whether UCHL1 inhibition enhances the efficacy of cisplatin, we tested the synergistic interactions between cisplatin and the UCHL1 inhibitors LDN-57444 and IMP-1710 in neuroendocrine carcinoma cell lines in vitro. Our results showed that both LDN-57444 and IMP-1710 synergized with cisplatin with a coefficient of drug interaction (CDI) score of less than 1 in neuroendocrine carcinoma cell lines (Figures S8A‒S8E). Likewise, genetic loss of UCHL1 increased the therapeutic effect of cisplatin in NEPC (Figure S8F). Based on these results, we evaluated the therapeutic effects of LDN-57444 in combination with cisplatin on NEPC PDX (LuCaP 173.1) and SCLC PDX (NJH29) in vivo (Figure 6H). The combination of LDN-57444 with cisplatin significantly slows the growth of neuroendocrine carcinomas in vivo (Figures 6I and 6J). No liver or kidney toxicity was observed with these combination therapies, as measured by animal body weight, liver enzyme panel analysis, and histopathological analysis (Figures 6K and S9A‒S9C). Treatment with LDN-57444 in combination with cisplatin significantly decreased the proliferation rate measured by Ki67 compared with single-arm treatment or vehicle treatment in neuroendocrine carcinomas (Figure S9D). Our data suggest that the UCHL1 inhibitors LDN-57444 and IMP1710 are effective drugs for treating SCLC, NEPC, and neuroblastoma in pre-clinical settings both as single agents and when combined with cisplatin.
Treatment with a UCHL1 inhibitor suppresses metastasis of neuroendocrine carcinomas
Based on our in vitro data demonstrating that LDN-57444 was very effective in suppressing the invasion of TD-NEPC cells (Figure S9E), we tested whether LDN-57444 decreases the size and number of metastases in an intracardiac injection model in vivo (Figure 7A). Treatment with LDN-57444 significantly decreased the metastatic burden of NEPC in the intracardiac injection model of metastatic colonization (Figures 7B–7E). Inhibition of UCHL1 reduced the incidence of bone metastases (3 of 7 mice) in mice bearing NEPC compared with those treated with vehicle (6 of 7 mice) (Figures 7C and 7E). Even though treatment with LDN-57444 did not decrease liver metastasis incidence in NEPC, there were significantly fewer and smaller liver metastatic nodules in the LDN-57444-treated group compared with the vehicle-treated group in the NEPC model (Figures 7D and S7F).
Figure 7.

Inhibition of UCHL1 decreases NEPC and SCLC metastasis in vivo
(A) Schematic of the intracardiac injection metastasis model for treatment with LDN. The image was generated using BioRender (https://biorender.com).
(B) BLI imaging of the TD-NEPC intracardiac injection metastasis model treated with Veh or LDN on day 14 post-treatment (n = 7). The bioluminescence signal was quantified by fold change compared with day 0 (right).
(C) Percentage and number of metastasis-positive animals/total animal number by organ site.
(D) Representative RFP fluorescence imagines of liver (scale bar, 2 mm). The number of liver metastases was quantified by counting the RFP foci (left).
(E) Representative RFP fluorescence images of bone (scale bar, 2 mm).
(F) BLI of the Veh- or LDN-treated intracardiac injection model generated with NCI-H82 cells. Bioluminescence intensity was quantified by fold change compared with day 0.
(G) GFP fluorescence images of liver (left). Scale bar, 2 mm. The number and size of the liver metastases were quantified by GFP signals (right).
(H) GFP fluorescence images of LNs with percentage of the mice with LN metastases. Scale bar, 2 mm.
∗p < 0.05, ∗∗p < 0.01, assessed by Student’s t test.
Additionally, treatment with LDN-57444 decreased the metastatic burden in mice bearing SCLC compared with the vehicle-treated group (Figure 7F). Specifically, treatment with LDN-57444 reduced the number and size of the SCLC metastatic nodules in the liver and suppressed lymph node metastasis (6 of 10 mice) in comparison with vehicle treatment (8 of 8 mice) (Figures 7G and 7H). In addition to the intracardiac injection model, we also tested the therapeutic efficacy of UCHL1 inhibition in preventing spontaneous metastasis in an SCLC xenograft model (Figures S9G‒S9I). Our data demonstrate consistent therapeutic efficacy because treatment with LDN-57444 decreased the incidence of liver and lymph node metastasis and reduced the size of liver and lymph node metastatic nodules compared with the vehicle-treated group in mice bearing SCLC (Figures S9H and S9I).
Taken together, our results indicate that inhibition of UCHL1 represents a promising therapeutic strategy for targeting tumor growth and metastasis across cancers with neuroendocrine differentiation, including NEPC, SCLC, and poorly differentiated neuroblastoma, and that UCHL1 regulates neuroendocrine differentiation. Further, inhibition of UCHL1 alone or in combination with platinum agents represents an effective therapeutic strategy for NEPC and SCLC in pre-clinical settings with potential applications in other neuroendocrine carcinomas.
Discussion
Clinically, the gold standard of diagnosing cancers with neuroendocrine differentiation relies on one or multiple sets of invasive tissue biopsies and pathological evaluation.21 Recent cancer research efforts have focused on identifying minimally invasive methods for diagnosis, monitoring disease progression, and treatment response. Circulating tumor DNA and circulating tumor cells (CTCs) have improved the sensitivity and specificity of diagnosing NEPC patients.50 In this study, we report that plasma levels of UCHL1 are elevated in SCLC patients and NEPC patients compared with NSCLC patients and localized PC patients, respectively. These results provide insights into the potential utility of UCHL1 as a minimally invasive molecular indicator for patients with suspected neuroendocrine carcinomas. UCHL1 plasma levels decrease after LDN-57444 treatment, suggesting the application of plasma UCHL1 as a treatment monitoring indicator.
Increasing evidence shows that the nuclear pore complex regulates the nucleocytoplasmic transportation of key molecular factors to drive cancer progression.47,64,65,66 Inhibition of the nuclear pore complex induces cancer cell death.64 POM121 is highly expressed in multiple cancers and directly interacts with importin-β, a nuclear import machinery component, to regulate two oncogenic transcription factors, E2F1 and c-MYC, in advanced PC.47 Our study identifies that UCHL1 regulates POM121 and that loss of UCHL1 or inhibition of UCHL1 decreases POM121-mediated nuclear localization of E2F1. Overexpression of POM121 in UCHL1 knockout cells rescues E2F1 level caused by the loss of UCHL1. Collectively, inhibition of UCHL1 could potentially be a potent therapeutic strategy to reverse E2F1-driven neuroendocrine differentiation and suppress the nuclear pore complexes.
KPT-330 is a potent nuclear transport inhibitor that has been investigated in clinical trials for cancer patients.67,68 However, the clinical application of KPT-330 faces challenges due to low tolerability and high toxicity associated with changes in global nuclear import/export.68,69 Our study demonstrates that treatment with LDN-57444 or KPT-330 decreases E2F1 and c-MYC levels in neuroendocrine carcinomas, which demonstrates the potential of using UCHL1 inhibitors as a replacement for nuclear transport inhibitors for neuroendocrine carcinoma patients.
In addition to its effect on E2F1 and c-MYC, UCHL1 also modulates p53 levels in neuroendocrine carcinomas. Inactivation of p53 is observed in approximately 67% of NEPC patients compared with 31% of adeno-CRPC patients.50 Concurrent loss of RB1 and p53 is required for normal prostate epithelial cells to transform to NEPC and is observed in almost all screened SCLC patients.5,70 Our study suggests that the UCHL1-p53 axis represents an additional mechanism through which UCHL1 may potentially regulate neuroendocrine carcinomas and warrants further investigation. The regulation of p53 ubiquitination by UCHL1 could be potentially indirect and disease specific because it has been reported that UCHL1 could stabilize p53 in the context of nasopharyngeal carcinoma.34
The identification of effective therapeutic targets is critical for improving the survival of patients with neuroendocrine carcinomas and poorly differentiated neuroblastoma, who have poor outcomes and limited benefits from current therapies. Combining a UCHL1 inhibitor with platinum-based chemotherapies may improve the therapeutic response in SCLC cell lines in vitro.71 Our results further support the translational potential of combination therapy of cisplatin and UCHL1 inhibition to improve the outcome of neuroendocrine carcinoma patients. The future trial designs for this combination could include a selection of patients with high UCHL1 expression in their cancer tissues.
In conclusion, our study demonstrates that UCHL1 is a molecular indicator for cancers with neuroendocrine differentiation and that UCHL1 regulates the growth and metastasis of SCLC and NEPC. The mechanisms of action of UCHL1 in driving the progression of these malignancies include deubiquitination and stabilization nucleoporin POM121, resulting in increased nuclear localization of E2F1. Conversely, UCHL1 binds p53 and promotes p53 degradation. Importantly, UCHL1 is a neuroendocrine carcinoma- and neuroblastoma-directed therapeutic target and candidate plasma and molecular tissue indicator for these malignancies. As such, testing of UCHL1 inhibitors and plasma UCHL1 as a companion therapeutic biomarker in clinical settings holds immense promise for patients with NEPC, SCLC, poorly differentiated neuroblastoma, and other neuroendocrine carcinomas.
Limitations of the study
Our study has a couple of potential limitations. While we demonstrate that UCHL1 is a potential minimally invasive biomarker for diagnosing and monitoring responses to therapies for neuroendocrine carcinomas, the findings warrant further validation studies for UCHL1 in plasma in a large patient cohort. In addition, while we demonstrate that UCHL1 inhibitors significantly delay tumor growth, the durability and survival benefits from UCHL1 inhibition has yet to be determined. Furthermore, the role of UCHL1 in other neuroendocrine carcinomas has yet to be validated, and further studies are needed to test the contribution of UCHL1 to the heterogeneity of neuroendocrine carcinoma from other different sites.
STAR★Methods
Key resources table
| REAGENT or RESOURCE | SOURCE | IDENTIFIER |
|---|---|---|
| Antibodies | ||
| Mouse anti-Human-Ki67 | Santa Cruz Biotechnology | Cat#sc-23900 |
| Mouse anti-Human-AR | Santa Cruz Biotechnology | Cat#sc-7305 |
| Mouse anti-Human- Actin | Santa Cruz Biotechnology | Cat#sc-8432 |
| Mouse anti-Human-UCHL1 | Santa Cruz Biotechnology | Cat#sc-271639 |
| Mouse anti-Human-SYP | Santa Cruz Biotechnology | Cat#sc-17750 |
| Mouse anti-Human-CHGA | Santa Cruz Biotechnology | Cat#sc-393941 |
| Mouse anti-Human-GAPDH | Santa Cruz Biotechnology | Cat#sc-47724 |
| Mouse anti-Human-NCAM | Santa Cruz Biotechnology | Cat#sc-7326 |
| Mouse anti-Human-p53 | Santa Cruz Biotechnology | Cat#sc-126 |
| Mouse anti-Human-E2F1 | Santa Cruz Biotechnology | Cat#sc-251 |
| Mouse anti-Human-SOX2 | Santa Cruz Biotechnology | Cat#sc-365823 |
| Mouse anti-Human-Lamin A | Santa Cruz Biotechnology | Cat#sc-71481 |
| Mouse anti-Human-PCNA | Santa Cruz Biotechnology | Cat#sc-56 |
| Mouse anti-Human-Ubiquitin | Santa Cruz Biotechnology | Cat#sc-8017 |
| Mouse anti-Human-αTubulin | Santa Cruz Biotechnology | Cat#sc-23948 |
| Mouse anti-Human-LDHA | Santa Cruz Biotechnology | Cat#sc-137243 |
| Mouse anti-Human-MYCN | Santa Cruz Biotechnology | Cat#sc-53993 |
| Rabbit anti-Human-TMPO | ABclonal | Cat#A2534 |
| Rabbit anti-Human-CCT5 | ABclonal | Cat#A6549 |
| Rabbit anti-Human-TUFM | ABclonal | Cat# A6423 |
| Rabbit anti-Human-HMGB3 | ABclonal | Cat# A15064 |
| HRP-conjugated mouse antibody | Fisher Scientific | Cat#PI31432 |
| HRP-conjugated rabbit antibody | Fisher Scientific | Cat#PI31462 |
| Rabbit anti- Human-POM121 | GeneTex | Cat#GTX102128 |
| Rabbit anti- Human-p53 | Cell signaling | Cat#2527 |
| Rabbit anti- Human-Ubiquitin | Cell signaling | Cat#3933S |
| Mouse anti-Human-V5-Tag | Invitrogen | Cat#E10/V4RR |
| Alexa Flour 647-conjugated Goat anti-mouse | Jackson ImmunoResearch | Cat#715-605-150 |
| Alexa Flour 488-conjugated Goat anti-mouse | Jackson ImmunoResearch | Cat#115-545-003 |
| Alexa Flour 488-conjugated Goat anti-rabbit | Jackson ImmunoResearch | Cat#111-545-144 |
| Rabbit anti-Human-PGP9.5 | Abcam | Cat#ab27053 |
| Rabbit anti-Human-E2F1 | Abcam | Cat#ab288369 |
| Rabbit anti-Human-c-Myc | Abcam | Cat#ab32072 |
| Bacterial and virus strains | ||
| FUCGW | University of California Los Angeles | Owen Witte |
| FUCRW | University of California Los Angeles | Owen Witte |
| HA-UCHL1(WT)-FUCRW | This paper | N/A |
| HA-UCHL1(C90S)-FUCRW | This paper | N/A |
| pHAGE6-POM121-V5 | This paper | N/A |
| pHIV-LucZsGreen | DeRose et al.72 | Addgene plasmid # 39196; http://n2t.net/addgene:39196; RRID: Addgene_39196 |
| pHAGE6 | University of California Los Angeles | Owen Witte |
| Biological samples | ||
| The LuCaP prostate cancer patient-derived xenografts tissue microarrays | University of Washington | Eva Corey |
| Neuroendocrine neoplasm tissues | Stanford University | Brooke E. Howitt; Christian A. Kunder |
| Neuroblastoma tissue microarrays | Biomax | Cat#NB642a |
| Prostate cancer tissue | Stanford University; Duke University | James D. Brooks; Jiaoti Huang |
| Patient-derived xenografts (PDX)-NJH29 | Stanford University | Julian Sage |
| Prostate cancer patient plasma | UT Health San Antonio; University of California, Los Angeles | Michael A. Liss; Arnold I. Chin |
| Lung cancer patient plasma | Stanford University | Millie Das |
| Chemicals, peptides, and recombinant proteins | ||
| LDN-57444 | TargetMol | Cat#T1924 |
| Cisplatin | TargetMol | Cat#T1564 |
| IMP-1710 | Cayman Chemical | Cat#31391 |
| KPT-330 | Selleck Chemicals | Cat#S7252 |
| Recombinant Human UCH-L1/PGP9.5 Protein with His-tag | R&D Systems | Cat#6007-CY |
| Recombinant human p53 | Bio-techne | Cat#SP-454 |
| Critical commercial assays | ||
| CellTiter-Blue Cell Viability Assay | Promega | Cat#G8081 |
| Corning™ BioCoat™ Matrigel™ Invasion Chamber - Matrigel™ | Fisher Scientific | Cat#08-774-122 |
| Costar™ Transwell™ Permeable Supports | Fisher Scientific | Cat#07-200-150 |
| In Situ Proximity Ligation Assay | Sigma-Aldrich | Cat#DUO92101 |
| NI-NTA Biosensors | FortéBio | Cat#18-5101 |
| UCH-L1/PGP9.5 DuoSet ELISA reagents | R&D Systems | Cat#DY6007 |
| ProtoScript II First Strand cDNA Synthesis Kit | New England Biolabs | Cat#E6560S |
| SsoAdvanced Universal SYBR Green Supermix | Bio-Rad | Cat#1725271 |
| Costar™ Transwell™ Permeable Supports | Fisher Scientific | Cat#07-200-150 |
| Deposited data | ||
| Proteomics | PRIDE | PRIDE: PXD044864 |
| Experimental models: Cell lines | ||
| 22Rv1 | ATCC | CRL-2505 |
| DU145 | ATCC | HTB-81 |
| C4-2 | ATCC | CRL-3314 |
| PC3 | ATCC | CRL-1435 |
| NCI-H660 | ATCC | CRL-5813 |
| LNCaP | ATCC | CRL-1740 |
| H358 | ATCC | CRL-5807 |
| NCI-H82 | ATCC | HTB-175 |
| H1650 | ATCC | CRL-5883 |
| IMR-32 | ATCC | CCL-127 |
| NJH29 | Jahchan et al.73 | N/A |
| TD-NEPC | Hsu et al.48 | N/A |
| Experimental models: Organisms/strains | ||
| NOD-SCID-IL2Rγ–null (Male and Female) | Jackson Laboratory | NOD-SCID-IL2Rγ–null |
| Oligonucleotides | ||
| UCHL1 [shRNA#1] | Millipore Sigma | TRCN0000007274 |
| UCHL1 [shRNA#2] | Millipore Sigma | TRCN0000007276 |
| Control nontargeting sgRNA | Synthego | sku: 063-1010-000-000 |
| multi-sgRNA targeting UCHL1 | Synthego | sku: GKO-HS1-000-0-1.5n-0-0 |
| control [shRNA] | Sarbassov et al.74 | Addgene plasmid #1864; http://n2t.net/addgene:1864; RRID: Addgene_1864 |
| Primer sequences for qPCR | This paper | Table S1 |
| Recombinant DNA | ||
| Plasmid: Ubiquitin-His-Tag | This paper | N/A |
| Plasmid: FUCRW-UCHL1(C90S) | This paper | N/A |
| Plasmid: pHAGE6-POM121-V5-Tag | This paper | N/A |
| Plasmid: FUCRW-UCHL1-WT | This paper | N/A |
| Software and algorithms | ||
| ImageJ | ImageJ | https://imagej.net/Downloads |
| Byonic 2.11.0 | Protein Metrics | N/A |
| Prism (version 9.2) | Graphpad | https://www.graphpad.com/scientific-software/prism/ |
| Other | ||
| Biorender | https://biorender.com/ | |
Resource availability
Lead contact
Further information and requests for resources should be directed to and will be fulfilled by the lead contact, Tanya Stoyanova (tstoyanova@mednet.ucla.edu).
Materials availability
All reagents generated in this study are available from the lead contact with a completed materials transfer agreement.
Data and code availability
Proteomic data have been deposited at PRIDE and are publicly available with the identifier PXD044864. This study did not generate any custom computer code. Any additional information required to reanalyze the data reported in this paper is available from the lead contact upon request.
Experimental model and study participant details
Patient tissue samples
The LuCaP prostate cancer Patient Derived Xenograft (PDX) tissue microarrays (TMAs) have been described previously.75 The LuCaP PDX TMA for UCHL1 staining includes 21 adeno-CRPC PDXs and 4 NEPC PDXs with three cores per PDX. The PDX TMA for POM121 staining includes 21 adeno-CRPC PDXs and 5 NEPC PDXs. The neuroblastoma TMA was purchased from Biomax (NB642a, US Biomax Inc.). Staining intensity of UCHL1 was subjected to blind scoring in the 27 cases of neuroblastoma with duplicate cores per case. Benign prostate and localized prostate cancer TMAs were built in the Department of Urology at Stanford University and all samples were collected under the approved Institutional Review Board (IRB) protocol (IRB: 5628). Adeno-CRPC patients (n = 25) and NEPC patients (n = 18) TMAs were obtained from Duke University (IRB: Pro00070193). 7 NEPC, 36 NSCLC, 11 SCLC, 15 lung carcinoid tumors, 3 gastrointestinal neuroendocrine carcinomas, 14 well-differentiated gastrointestinal neuroendocrine tumors, 17 pancreatic neuroendocrine tumors, 3 poorly differentiated pancreatic neuroendocrine carcinomas patient samples were purchased from the Stanford Cancer Institute (SCI) Tissue Bank with informed consent from each patient under approved IRB (11977). The diagnoses of the samples were validated by pathologists. All methods were carried out in accordance with the relevant guidelines and regulations of the Regional Ethics Committee and ethical guidelines and regulations. All committees approved the studies and confirmed that informed consent was obtained from all subjects. The intensity of UCHL1 and POM121 staining was scored from 0 to 3 (0 = negative; 1 = low; 2 = medium; 3 = strong).
Patient plasma samples
17 NSCLC patient plasma samples and 1 SCLC patient plasma sample were purchased from SCI Tissue Bank with matched formalin fixed paraffin embedded (FFPE) tissue under an IRB-approved protocol and with patient informed consent (IRB: 11977). 7 SCLC patient plasma samples were collected at the Department of Medicine, VA Palo Alto Health Care System (IRB:45112). Plasma samples from 9 localized prostate cancer patients were used as controls to compare UCHL1 plasma levels in 8 NEPC patients. Plasma from 9 localized prostate cancer patients was collected at Department of Urology, UT Health San Antonio under an approved protocol (IRB: HSC20050234H). Plasma from 8 NEPC patients was collected at Department of Urology, University of California, Los Angeles under an approved protocol (IRB: 18–000435). All committees approved the studies and confirmed that informed consent was obtained from all subjects.
Clinical datasets
All mRNA levels were obtained from datasets from cBioPortal (www.cbioportal.org/), Oncomine (www.oncomine.org/), and Balanis, Cancer Cell, 2019 dataset (systems.crump.ucla.edu/).49 mRNA levels of UCHL1 and E2F1 in normal tissue adjacent to lung or prostate adenocarcinoma, lung adenocarcinoma, CRPC, SCLC, and NEPC were obtained from Balanis, Cancer Cell, 201949 and Varimax-rotated PCA (PCAv) plots were generated using systems.crump.ucla.edu/. mRNA levels in neuroendocrine carcinomas compared to non-neuroendocrine carcinomas were assessed from the Cancer Cell Line Encyclopedia (CCLE), Beltran, Nat Med. 2016, Abida, PNAS. 2019, Rohrbeck, J Transl Med. 2008, Bhattacharjee, PNAS. 2001, and Garber, PNAS. 2001.50,51,55,76,77,78 mRNA levels of UCHL1, SYP, and CgA were acquired from PDX tumors reported in Nguyen, Prostate, 2017.75
Animal studies
All animal experimental procedures performed in this study were approved by Stanford Administrative Panel on Laboratory Animal Care (APLAC), IACUC, and the Animal Research Committee (ARC) of University of California, Los Angeles. 6-8-week-old NSG (NOD-SCID-IL2Rγ-null) male and female mice (Jackson Laboratory) were used for all animal experiments. Mice were housed at temperatures of 65–75°F with 40–60% humidity.
Cell lines and cell culture
LNCaP, 22Rv1, C4-2, PC-3, DU145, NCI-H660, NCI-H82, IMR-32, H1650, and H358 were purchased from the American Type Culture Collection (ATCC; Manassas, VA). LNCaP-RFP, TD-NEPC, and NJH29 were generated as previously described.48,73 NJH29 PDX cells were kindly gifted from Julien Sage’s laboratory at Stanford University.73 NJH29, NCI-H82, H1650, and H358 were maintained in DMEM medium. LNCaP, 22Rv1, C4-2, PC-3, DU145, TD-NEPC, and IMR-32 cells were maintained in RPMI medium. Both DMEM and RPMI medium were supplemented with 10% FBS, 4 mM L-glutamine, and 1% penicillin/streptomycin. NCI-H660 was cultured in HITES medium containing RPMI, 5% FBS, 10 nM hydrocortisone, 10 nM beta-estradiol (Sigma), 0.005 mg/mL insulin, and 4 mM L-glutamine.
Method details
Generation of control, overexpression, and shRNA knock-down cell lines
FUCGW and FUCRW 3rd generation lentiviral plasmids were kind gifts from Dr. Owen Witte’s laboratory at University of California Los Angeles. UCHL1 cDNA was obtained from Addgene (Flag-HA-UCHL1 was a gift from Wade Harper (Addgene plasmid # 22563; http://n2t.net/addgene:22563; RRID: Addgene_22563) and wild type HA-UCHL1 was cloned into FUCRW lentiviral plasmid. Subsequently, UCHL1 (C90S) was created through Gibson Assembly site-directed mutagenesis and cloned into FUCRW lentiviral plasmid with HA-tag. The lentivirus was generated as described previously.48 22Rv1 and C4-2 cells were infected with RFP (FUCRW), RFP and wild-type UCHL1 (FUCRW-UCHL1-OV), or RFP and UCHL1 mutation (FUCRW-UCHL1(C90S)) lentivirus. RFP signal was confirmed after 72 h post-infection. The TD-NEPC-Luc cells expressing luciferase were generated as described previously.48 NCI-H82 cells were infected with pHIV-LucZsGreen virus (a gift from Bryan Welm (Addgene plasmid # 39196; http://n2t.net/addgene:39196; RRID: Addgene_39196)) and GFP (FUCGW) virus to generate NCI-H82-GFP-Luc cells. TD-NEPC-RFP-Luc and NCI-H82-GFP-Luc cells were infected with lentiviruses carrying shControl (shCtl) RNA and two independent UCHL1 shRNAs. Validated small hairpin RNA targeting UCHL1 sequences were purchased from Millipore Sigma (St. Louis, MO). shUCHL1 #1: TRCN0000007274; Sequence: 5′CCGGCGGGTAGATGACAAGGTGAATCTCGAGATTCACCTTGTCATCTACCCGTTTTT-3’; shUCHL1 #2: TRCN0000007276: Sequence: 5′CCGGCCAGCATGAGAACTTCAGGAACTCGAGTTCCTGAAGTTCTCATGCTGGTTTTT-3’. The control shRNA is from Addgene (gift from David Sabatini, Addgene plasmid #1864; http://n2t.net/addgene:1864; RRID: Addgene_1864) (CCTAAGGTTAAGTCGCCCTCGCTCGAGCGAGGGCGACTTAACCTTAGG). Cells were selected in puromycin (0.5ug/mL) for 14 days, and Western Blot was used to assess protein levels of UCHL1.
Generation of control and UCHL1 CRISPR-Cas9 knock-out cell lines
Gene deletion of UCHL1 in TD-NEPC and NCI-H82 cells was achieved by CRISPR Cas9 system according to the manufacturer’s protocol. Control nontargeting sgRNA (sku: 063-1010-000-000) and multi-sgRNA targeting UCHL1 (sku: GKO-HS1-000-0-1.5n-0-0) were purchased from Synthego (Synthego Corporation Biotechnology, Menlo Park, California, United States). Briefly, sgRNA and Cas9 were diluted into working concentration (3 μM). 25 μL Opti-MEM reduced serum medium, 3.9 pmol sgRNA, 3 pmol Cas9, and Lipofectamine Cas9 plus reagent (Thermo Scientific, CMAX00003) were added to assemble the ribonucleoprotein (RNP) complexes. The RNP complexes were incubated at room temperature for 10 min. Lipofectamine CRISPRMAX transfection reagent was diluted with Opti-MEM reduced serum medium and incubated for 5 min at room temperature, then directly added into the RNP complexes tube and incubated for 10 min at room temperature. 1 × 10⁵ cells were resuspended in 500 μL media before transfection. 50 μL of the CRISPR mixed reagent was added into the cells, and cells were seeded into 24-well plates. The plates were incubated for 2 days at 37°C, 5% CO2 incubator, and cells were expanded for assessment.
Generation of POM121 overexpression cell lines
POM121 cDNA was synthesized from IDT Hifi gBlock and cloned into pHAGE6 3rd generation lentiviral plasmid. TD-NEPC UCHL1 control and knockout cells were infected with pHAGE6 empty plasmid and pHAGE6-POM121-V5-OV.
Viability assay
5 × 10³ LNCaP, TD-NEPC, NCI-H660, H1650, H358, IMR-32, and NCI-H82 cells were seeded per well in 96-well plates. After 12 h, the cells were treated with vehicle or LDN-57444 (2.5, 5, 10, 20 μM) for 72 h. For testing the synergistic effect of the combination therapy, 5 × 10³ TD-NEPC and NJH29 cell lines were seeded per well in 96-well plates. The cells were treated with vehicle, LDN-57444/IMP-1710, cisplatin, or LDN-57444/IMP-1710 with cisplatin respectively for 72 h. For testing the synergistic effect in TD-NEPC CTL and KO cells, 5 × 10³ TD-NEPC CTL or TD-NEPC KO cells were seeded and incubated with cisplatin (0, 1, 2 μM) for 72 h. Cell titer blue reagent (Promega, Madison, WI) was added to the plates, and the plates were incubated for 3 h in darkness at 37°C. The plates were read at 560/590 nm wavelength on Tecan Microplate Reader. All experiments were performed in triplicate.
Colony formation assay
5 × 10² C4-2 (RFP or UCHL1-OV), TD-NEPC (shCtl, shUCHL1#1, shUCHL1#2, CTL 1, CTL 2, UCHL1 KO 1, UCHL1 KO 2, CTL-Empty vector, CTL-POM121-V5-OV, UCHL1 KO-Empty vector, and UCHL1 KO POM121-V5-OV) or 2 × 10³ 22Rv1 (RFP, UCHL1-OV, and UCHL1(C90S)) cells were plated per well in 6-well plates. Medium was refreshed every three days, and colonies were cultured for 9 days. For single drug treatment, 5 × 10² TD-NEPC cells were seeded per well in 6-well plates. After the cells attached, the cells were treated with vehicle or LDN-57444 (5 or 10 μM) or IMP-1710 (0.25 or 0.5 μM) for 9 days and the media with inhibitors was refreshed every three days. For combination therapy, 5 × 10² TD-NEPC cells were seeded and treated with vehicle, IMP-1710 (0.125 μM), cisplatin (0.5 μM), and IMP-1710 with cisplatin. After 9 days, colonies were fixed with cold methanol for 30 min and stained with 0.01% crystal violet for 20 min. Plates were scanned and quantified based on the percentage of colony-covered area per well. Experiments were performed in triplicate and presented as mean ± SD.
Migration and invasion assays
5 × 10⁴ 22Rv1 (RFP or UCHL1-OV) or C4-2 (RFP or UCHL1-OV) were seeded in serum-free medium in 24-well transwell inserts (Transwell Permeable Polyester Membrane Inserts or Matrigel-coated Boyden chamber PET membrane, Corning). The inserts were incubated in medium with 10% FBS in 24-well plates for 22 h. The cells that passed through the membrane were fixed, stained with 0.01% crystal violet solution and manually counted. Experiments were performed in triplicate and presented as mean ± SD.
3D matrigel drop assay
3D Matrigel drop assay was performed as previously described.79 5 × 10⁴ TD-NEPC (shCtl, shUCHL1#1, shUCHL1#2, CTL 1, CTL 2, UCHL1 KO 1, and UCHL1 KO 2, CTL-Empty vector, CTL-POM121-V5-OV, UCHL1 KO-Empty vector, and UCHL1 KO POM121-V5-OV) cells in 10 μL Matrigel were seeded as a single droplets in the center of each well in 24-well plates and incubated with medium for 6 days. Medium exchange performed every three days. For drug treatment, 5 × 10⁴ TD-NEPC cells with 100% Matrigel were plated into a drop like shape in the middle of a well in 24-well plates as described previously.48 The medium containing either vehicle or LDN-57444 (2.5, 5 μM) was added into the plates, and medium was changed every three days. The plates were scanned on Day 6 by Celigo and the invaded area was quantified by ImageJ. Experiments were performed in triplicate, and presented as mean ± SD.
RNA-extraction and real-time qPCR assay
Total RNAs were isolated with TRIzol Reagent (Invitrogen, Carlsbad, CA), and 750 ng total RNAs were reverse transcribed into cDNA (ProtoScript II First Strand cDNA Synthesis Kit, New England Biolabs (NEB), E6560S). Relative transcript levels were analyzed by real-time PCR using SYBR Green (SsoAdvanced Universal SYBR Green Supermix, Bio-Rad, Cat#1725271) and calculated by the comparative Ct method normalized against human β-ACTIN. Primers are listed in the Table S1.
Histology, immunohistochemistry, and immunofluorescence staining
FFPE tissue sections were incubated at 65°C for 1 h, deparaffinized, and rehydrated in 100%, 95%, and 70% ethanol. For H&E staining, slides were washed in water for 10 min, stained with hematoxylin for 30 s, and eosin for 1 min. For immunohistochemical staining, tissue slides were heated in antigen retrieval buffer (10 mM citrate buffer (pH = 6.0)) at 95°C for 30 min and then incubated with 3% hydrogen peroxide for 5 min. Tissue sections were blocked with either 2.5% horse serum or 2.5% goat serum at room temperature for 1 h, and then incubated with primary antibody (Santa Crux Biotechnology-anti-UCHL1 sc-271639 (1:100), anti-AR sc-7305 (1:100), anti-Ki67 sc-23900 (1:100), anti-SYP sc-17750 (1:100), anti-CgA sc-393941 (1:100), and anti-NCAM sc-7326 (1:100); GeneTex-anti-POM121 GTX102128 (1:200)) in blocking buffer overnight at 4°C. Slides were incubated with ImmPRESS HRP secondary Antibody (MP-7452-50 or LS-J1066-50, Vector Laboratories) at room temperature for 1 h and developed using DAB kit in accordance with manufacturer’s instructions (Dako).
For immunofluorescence staining, TD-NEPC (CTL and UCHL1 KO) or 22Rv1 (RFP and UCHL1-OV) cells were cultured in glass-bottom dishes, fixed with 4% paraformaldehyde, permeabilized, and blocked with 5% BSA in PBST (1X PBS, 0.3% Triton X-100) for 1 h at room temperature. After blocking, the cells were then incubated with primary antibodies at 1:100 dilution (Santa Cruz Biotechnology-anti-UCHL1, sc-271639; anti-CD56, sc-7326; anti-SYP, sc-17750; anti-p53, sc-126. Cell Signaling: anti-p53, #2527. Abcam: E2F1, ab288369; c-Myc, ab32072. GeneTex-anti-POM121, GTX102128. ABclonal-TMPO, A2534) overnight at 4°C. Alexa Flour 488-conjugated secondary antibodies (115-545-003 and 111-545-144, Jackson ImmunoResearch, 1:200) or Alexa Flour 647-conjugated Goat anti-mouse (715-605-150, Jackson ImmunoResearch, 1:200) were used for staining of target proteins at room temperature for 2 h. The stained cells were washed thoroughly, and nuclei were labeled with Hoechst 33342 (5 μg/mL for 15 min). The images were captured by Leica DMi8 confocal microscope.
In Situ Proximity Ligation Assay was performed by using the Duolink In Situ Red Starter Kit Mouse/Rabbit (Sigma-Aldrich, DUO92101) according to the manufacturer’s instructions. For POM121 with UCHL1, the sections from 3 CRPC and 3 NEPC tissues were stained with primary antibodies against UCHL1 (Santa Cruz Biotechnology-anti-UCHL1, sc-271639) and POM121 (GeneTex-anti-POM121, GTX102128). For p53 with UCHL1, the sections from SCLC PDX (NJH29) were stained with primary antibodies against UCHL1 (Santa Cruz Biotechnology-anti-UCHL1, sc-271639) and p53 (Cell signaling, #2527). Incubation with a single primary antibody was used as a negative control. The red fluorescence images were taken with Leica DMi8 confocal microscope. The positive RFP signals were quantified by manually counting and normalized per cell for UCHL1 and POM121 PLA.
Western blotting
Cells were lysed in RIPA lysis buffer with protease and phosphatase inhibitors (Thermo Fisher Scientific) for 1 h. For subcellular nuclear cytoplasm protein fractionation, Pierce NE-PER nuclear and cytoplasmic extraction reagent kit (Thermo Scientific, 78833) was used following the protocol of the manufacturer. Protein was loaded in each well of 8–16% SDS-PAGE gel (Invitrogen XP08165BOX) and transferred onto a 0.22 μm nitrocellulose membrane (GVS Life Sciences, 1212632). After blocking with 5% non-fat milk at room temperature for 1 h, the membrane was incubated with primary antibody (Santa Cruz Biotechnology-anti-UCHL1 (1:1000) sc-271639, anti-MYCN (1:1000) sc-53993, anti-SYP (1:1000) sc-17750, anti-NCAM (1:500) sc-7326, anti-SOX2 (1:1000) sc-365823, anti-p53 (1:1000) sc-126, anti-E2F1 (1:1000) sc-251, anti-Lamin A (1:1000) sc-71481, anti-αTubulin (1:1000) sc-23948, anti-GAPDH (1:2000) sc-47724, anti-Actin (1:2000) sc-8432, anti-PCNA (1:1000) sc-56, anti-Ubiquitin (1:1000) sc-8017, and anti-LDHA (1:1000) sc-137243. AB clonal-anti-TMPO (1:2000) A2534, anti-CCT5 (1:1000) A6549, anti-TUFM (1:1000) A6423, and anti-HMGB3 (1:1000) A15064. GeneTex-anti-POM121 (1:1000) GTX102128), Cell Signaling-anti-Ubiquitin (1:1000) 3933S; anti-p53 (1:1000) Cat#2527 and Abcam-anti-c-MYC (1:1000), ab32072; anti- PGP9.5 (1:1000), ab27053) overnight at 4°C. Then the membrane was washed and incubated with HRP-conjugated secondary antibodies (1:5000, PI31432 and PI31462, Fisher Scientific) and developed with ECL Western Blotting Substrate (Thermo Fisher Scientific). Western Blot quantification was performed using ImageJ as previously described.80
Immunoprecipitation
TD-NEPC cells or NJH29 cells were lysed in RIPA lysis buffer with protease and phosphatase inhibitors and universal nuclease for cell lysis (Thermo Fisher Scientific) on ice for 30 min and 30 min at room temperature. The lysates were centrifuged at 13,000 rpm at 4°C for 15 min 2 mg of protein was used and incubated with 2 μg of mouse/rabbit IgG (Santa Cruz Biotechnology SC2025/Thermo Fisher Scientific, NC9499071), anti-UCHL1 (Anti-PGP9.5 antibody, ab27053) antibody, anti-POM121 (GeneTex, GTX102128), anti-p53 (Cell signaling, #2527) respectively overnight at 4°C. 200 μL of Protein A/G Plus Agarose beads (Fisher Scientific, PI20423) were added and incubated for 3 h at 4°C, followed by centrifugation at 3000 rpm for 5 min at 4°C. Beads were washed twice with washing buffer I (50 mM tris-HCL (pH 7.5), 500 mM sodium chloride, 0.1% NP-40, and 0.05% sodium deoxycholate) and one time with washing buffer II (50 mM tris-HCL (pH 7.5), 0.1% NP-40, and 0.05% sodium deoxycholate). Bound proteins were eluted with 4 x SDS buffer in lysis buffer and boiled for 5 min at 95°C, followed by Western Blot analysis.
For the ubiquitination assays testing the role of UCHL1 on POM121 ubiquitin status, 293T cells were simultaneously transfected with three plasmids: 1) POM121-V5 (as described above); 2) pLenti puro His-Ubiquitin plasmid (Modified from pLenti puro HA-Ubiquitin plasmid by replacing HA tag with 6 x His tag. pLenti puro HA-Ubiquitin was a gift from Melina Fan (Addgene plasmid # 74218; http://n2t.net/addgene:74218; RRID:Addgene_74218); and 3) FUCRW, FUCRW expressing wild-type HA-UCHL1 (WT), or FUCRW expressing HA-UCHL1 (C90S) plasmid (as described above). For ubiquitination assay testing the role of UCHL1 on p53, 293-T cells were transfected with three plasmids: 1) pLX313-TP53-WT plasmid (pLX313-TP53-WT was a gift from William Hahn & David Root (Addgene plasmid # 118014; http://n2t.net/addgene:118014; RRID:Addgene_118014)); 2) pLenti puro His-Ubiquitin plasmid (described above); and 3) FUCRW or wild-type HA-UCHL1 plasmid. After 48 h, cells were treated with MG132 (10 μM) for 5 h and then harvested. Cells were lysed and immunoprecipitated with anti-V5-Tag Monoclonal Antibody (Invitrogen, E10/V4RR) for POM121 or immunoprecipitated with anti-p53 (cell signaling, #2527) for p53, followed by Western Blot analysis. For the ubiquitination assay in TD-NEPC treated with LDN-57444, cells were treated with LDN-57444 for 24 h, followed by treatment with MG132 (10 μM) for 5 h and harvested. Endogenous POM121 was immunoprecipitated with 2 μg of anti-POM121 (GeneTex, GTX102128) antibody and followed by Western Blot analysis.
Bio-layer interferometry
The binding affinity of UCHL1 and p53 was tested on Octet RED384 platform using NI-NTA Biosensors (FortéBio, 18–5101) according to the manufacture’s protocol. Briefly, 200 nM recombinant Human UCH-L1/PGP9.5 Protein with His-tag (R&D, 6007-CY) was prepared in the kinetic buffer (PBS with 0.1% BSA and 0.1% Tween 20). Recombinant human p53 with a serial of concentrations (0, 18.75, 37.5, 75, 150, 300, 600 nM, SP-454, Bio-techne) was tested. Biosensors were first hydrated in the kinetic buffer for 10 min and then run at baseline in the kinetic buffer for 45 s. The sensors were loaded with recombinant Human UCHL1 or kinetic buffer (as control sensor) for 300 s and washed in the kinetic buffer for 60 s. The probes were run at baseline in the kinetic buffer for 200 s and incubated with recombinant human p53 for 900 s, followed by dissociation in the kinetic buffer for 3600 s. The binding affinity was analyzed by FortéBio Data Analysis software (version 9.0). The well with the control sensor was designated as the reference well, and the signal from the reference well was subtracted from every other sensor’s signal.
Sandwich enzyme-linked immunosorbent assay (ELISA)
UCHL1 levels in plasma samples were determined by sandwich ELISA by using a commercially available antibody set (UCH-L1/PGP9.5 DuoSet ELISA reagents, DY6007, R&D Systems). Briefly, mouse Anti-human UCHL1 capture antibody (DY6007, 1:120, R&D Systems) diluted in 0.2 M sodium bicarbonate (pH 9.4) was coated in 96-well, half-well plates (#3690, Corning) overnight at 4°C. After washing with 0.05% Tween 20 in PBS (PBS-T) three times, the plates were blocked with 5% BSA in PBS overnight at 4°C. Then, plasma samples (50 μL) were incubated at room temperature for 2 h followed by three washes with PBS-T. The plates were incubated with biotinylated sheep Anti-Human UCHL1 detection antibody (DY6007, 1:60, R&D Systems) at room temperature for 2 h after washing three times. Next, the plates were incubated with Streptavidin-HRP-biotin (DY6007, 1:40, R&D Systems) at room temperature for 30 min, and then washed three times with PBS-T. Ultra TMB-ELISA substrate (#34028, manufacturer’s protocol, Thermo Scientific) was used to detect the bound proteins, and the signals were analyzed by a Promega plate reader at 450 nm. The standard curve for UCHL1 concentrations were determined using 0.078–2.5 ng/uL recombinant human UCHL1 (DY6007, R&D Systems).
Sample preparation for LC/MS-MS analysis
Xenograft tumor samples were lysed with 800 μL 1.5% sodium dodecyl sulfate (SDS) (Thermo Fisher Scientific) containing 1X protease inhibitor (Sigma-Aldrich) followed by sonication with a Branson probe sonicator (Fisher Scientific) for three-15 s cycles with an amplitude set to 40%. Extracted proteins were quantified by a Bicinchoninic acid protein assay (Thermo Fisher Scientific). Twenty-five micrograms of protein were used to perform shotgun proteomics by reducing the disulfide bonds on cysteine residues with 5 μL of 200 mM Tris (2carboxyethyl) phosphine (TCEP) (Sigma-Aldrich) in 100 μL of 50 mM ammonium bicarbonate (Sigma-Aldrich) and incubated at 65°C for 1.5 h. Then, free thiol groups were capped with 7.5 μL 200 mM iodoacetamide (Acros Organics) and incubated for 45 min at room temperature in the dark. Proteins were precipitated with 6x volume of cold acetone and stored at −20°C overnight. Samples were centrifuged at 14,000 g for 10 min at 4°C and protein pellets were collected. Proteins were reconstituted with 50 μL of 50 mM ammonium bicarbonate for trypsin digestion. Each sample received 1.5 μg of sequencing grade modified trypsin enzyme (Thermo Fisher Scientific) followed by an incubation at 37°C overnight. The resulting tryptic peptides were dried using a speed vacuum and reconstituted with 50 μL of 0.1% formic acid (Fisher Scientific) in HPLC MS grade water (Fisher Scientific) for LC/MS-MS analysis as previously described.48
Xenograft models
1 × 10⁶ cancer cells were resuspended with 80% Matrigel in medium and subcutaneously implanted into NSG mice. Tumor volumes were measured every three days and calculated by the equation (length x width x height)/2. Tumors were harvested for histological analysis.
For LDN-57444 drug treatment, mice were randomized into vehicle (DMSO) or LDN-57444 (TargetMol, T1924, 5 mg/kg in corn oil, i.p. daily) group when the average tumor volume reached 30–50 mm3. For IMP-1710 treatment, mice were randomized into vehicle (DMSO) or IMP-1710 (Cayman Chemical, No. 31391, 2.5 mg/kg in PBS, i.v. every three days) groups when the average tumor volume reached 50 mm3. Tumor volumes and mouse weight were measured every three days and calculated. Tumors (H660, TD-NEPC, NCI-H82, and IMR-32) were harvested when the average tumor volumes of the vehicle group reached ∼400 mm3, and tumors of NCI-H358 xenografts were harvested when the average tumor volume of one experimental group reached ∼230 mm3. Tumors were weighed at the endpoint and fixed for histology. At the experimental endpoint, whole blood was collected and centrifuged at 2000 rpm for 8 min to isolate plasma.
For combination therapy, when the average tumor volume reached 40 mm3, mice were randomized into the following four groups: vehicle (DMSO), cisplatin (TargetMol, T1564, 5 mg/kg in PBS, i.v. every 7 days), LDN-57444 (TargetMol, T1924, 5 mg/kg in corn oil, i.p. daily), and the combination of LDN-57444 with cisplatin. At the experimental endpoint, whole blood was collected and centrifuged at 2000 rpm for 8 min to isolate plasma. The toxicity of the combination therapies was evaluated by liver enzyme analysis. Samples were tested at the Stanford School of Medicine Diagnostic Laboratory in the Department of Comparative Medicine. Liver enzymes including Aspartate Transaminase (AST), Alanine Aminotransferase (ALT), Alkaline Phosphatase (ALP), and Total Bilirubin were tested. 3 mice were analyzed from each group.
Patient-derived xenograft models
LuCaP 93 and LuCaP 173.1 fresh PDX tumors were sliced to ∼25 mg under sterile conditions prior to transplantation into the rear flank of NSG male mice. For NJH29 PDX, 1 × 10⁶ cells were resuspended with 80% of Matrigel in medium and subcutaneously implanted into NSG mice. When tumors reached average tumor volumes of 40–50 mm3, the mice were randomized into treatment groups. Tumor volumes and mouse weights were measured every three days. Tumors (PDX-LuCaP 93, PDX-LuCaP 173.1, and NJH29 PDX) were harvested and weighed at the endpoint followed by fixation for histology.
Intracardiac injection metastasis model
Intracardiac injections were performed as previously described.81 Briefly, 1 × 10⁵ TD-NEPC-RFP-Luc (shCtl, shUCHL1#1, shUCHL1#2, CTL 1, CTL 2, UCHL1 KO 1, and UCHL1 KO 2), or H82-GFP-Luc (shCtl, shUCHL1#1, and shUCHL1#2) cells were injected into left ventricles of the heart of the mice. Mice were imaged by whole-body BLI at the endpoint (TD-NEPC, Day 14 and H82, Day 18). For treatment, 1 × 10⁵ TD-NEPC-RFP-Luc or H82-GFP-Luc cells were injected into mice via intracardiac injection. Mice were randomized into vehicle or LDN-57444 group based on even bioluminescence signals assessed by BLI at Day 3 post injection. Mice were treated with vehicle or LDN-57444 (5 mg/kg in corn oil, i.p. daily) for 12 days (TD-NEPC) or 15 days (NCI-H82) respectively. For whole body BLI, mice were injected with D-Luciferin (5 mg/kg) via intraperitoneal injection. Mice were imaged after 5 min by Lago optical imaging system. Diverse organs including lungs, liver, kidneys, LN, and bones were harvested and fixed with 10% formalin for histopathologic assessment. Metastatic nodules were quantified based on fluorescence intensity.
Spontaneous metastasis model
2 × 10⁶ TD-NEPC-RFP-Luc (shCtl, shUCHL1#1, shUCHL1#2), or H82-GFP-Luc cells were implanted subcutaneously into NSG mice. For UCHL1 knockdown, primary subcutaneous tumors were resected after they reached tumor volumes of 400 mm3. For LDN-57444 treatment, when the average tumor volumes reached 100 mm3, mice were randomized into two groups and treated with vehicle (n = 10) or LDN-57444 (n = 10). Subcutaneous tumors were resected after they reached volumes of 400 mm3. For the spontaneous metastasis model, metastases were evaluated three weeks post-surgical resection of the primary tumor by BLI and fluorescence imaging. Tissues were collected, and metastatic nodules were quantified by high-resolution, quantitative fluorescence images. Histopathology analyses of metastases in diverse organs were performed as described above.
Statistics
Student’s t test was performed for comparison of two groups unless otherwise noted. All tests were two-sided, and p values of 0.05 or less were considered statistically significant. ∗∗∗∗ = p < 0.001, ∗∗∗ = p < 0.005, ∗∗ = p < 0.01 ∗ = p < 0.05, and n.s = not significant. The statistical significance of differences of the UCHL1 and POM121 intensity in TMAs were calculated through a normal distribution N (0,1) of z-scores. UCHL1 plasma levels are analyzed by the Mann-Whitney U test for comparison of two groups.
Statistical analysis of proteomic data
For each condition biological replicates were performed as follows: H660 xenografts control (n = 3), LDN-57444 treatment (n = 3), and TD-NEPC xenografts UCHL1 knockdown (n = 4), and shControl (n = 2). Triplicate LC-MS runs were performed for each sample. The resulting raw data files were searched using Byonic 2.11.0 (Protein Metrics). Performing serial searches against the reference human proteome (2020; 20,626 entries) and reference mouse proteome (2019; 17,027 entries). Parameters included trypsin digestion with a maximum of two missed cleavages and precursor mass tolerance of 10 ppm. Fixed cysteine carbamidomethylation and variable methionine oxidation and asparagine deamination were also specified. Peptides were filtered to remove those with a >1% false discovery rate (FDR). Finally, peptides which overlapped in human and mouse searches were removed for a conservative analysis of human-specific identified proteins using an in-house R script. Quantitative values were extracted from MS1 spectra from all identified peptides using an in-house R script based on MSnbase package,82 and abundance changes analyzed using Generic Integration Algorithm. Calculation of statistical weight was performed at the spectrum level using WSPP model.83 Final statistical analysis was performed using Student’s T-test.
Gene set enrichment analysis (GSEA)
Pre-ranked lists of protein identification with two or more peptides with their corresponding Z score difference between control and LDN-57444 treatment, or control and shUCHL1 at the protein level were subjected to GSEA using MSigDB 7.4 released on Mar 2021. The default parameters were used except that all pathways with four or less proteins were removed.
Acknowledgments
This study was supported by the National Institutes of Health/National Cancer Institute (NCI) R01CA244281, US Department of Defense award HT9425-23-1-1034, National Institutes of Health/NCI P50CA092131, and the UCLA Jonsson Comprehensive Cancer Center. T.S. is supported by National Institutes of Health/NCI R37CA240822, R01CA244281, R01CA274978, and P50CA092131 and US Department of Defense award HT9425-23-1-1034. J.D.B. is supported by NIH CA245595 and NIH CA196387. S.J.P. is supported by NIH CA196387 and NIH CA196387. S.L. is supported by the Stanford Maternal and Child Health Research Institute Postdoctoral Support Award and the Jonsson Comprehensive Cancer Center Fellowship Award. A.B.H. is supported by US Department of Defense HT94252310237. C.F.M. is supported by a grant from the Jonsson Comprehensive Cancer Center. Establishment and characterization for the LuCaP PDX models were funded by Pacific Northwest Prostate Cancer SPORE P50CA97186 and P01CA163227. The content is solely the responsibility of the authors and does not necessarily represent the official views of the NCI and Department of Defense.
Author contributions
Study conception and design, S.L. and T.S.; experiments or data collection, S.L., T.C., F.G.-M., Q.Y., E.-C.H., M.S., A.M.S.T., A.B., A.B.H., C.F.M., C.S.L., L.Z., M.B., C.J.D., M.A., H.M.N., R.N., A.Z., E.C., and M.D.; investigation, S.L., A.Z., C.A.K., B.E.H., H.T.S., I.L.W., M.A.L., A.I.C., J.D.B., E.C., S.J.P., J.H., and T.S.; funding acquisition, T.S.; project administration, T.S.; supervision, A.Z., M.D., C.A.K., B.E.H., H.T.S., I.L.W., M.A.L., A.I.C., J.D.B., E.C., S.J.P., J.H., and T.S.; writing – review & editing, all authors.
Declaration of interests
E.C. is a consultant for Dotquant and received research funding under institutional SRAs from AbbVie, Astra Zeneca, Janssen Research, Gilead, Zenith Epigenetics, Forma Therapeutics, Bayer, Kronos, Foghorn, and MacroGenics. M.D. is a consultant for Regeneron, Beigene, Astra Zeneca, Sanofi/Genzyme, Eurofins, Janssen, and Genentech (uncompensated) and performs research at Merck, Genentech, CellSight, Novartis, AbbVie, United Therapeutics, Varian, Verily, and Celgene. J.H. is a consultant for or owns shares in Kingmed, MoreHealth, OptraScan, Genetron, Omnitura, Vetonco, York Biotechnology, Genecode, VIVA Biotech, and Sisu Pharma and received grants from Zenith Epigenetics, BioXcel Therapeutics, Inc., and Fortis Therapeutics. T.S. is a consultant for Dren Bio.
Published: January 19, 2024
Footnotes
Supplemental information can be found online at https://doi.org/10.1016/j.xcrm.2023.101381.
Supplemental information
References
- 1.Rindi G., Mete O., Uccella S., Basturk O., La Rosa S., Brosens L.A.A., Ezzat S., de Herder W.W., Klimstra D.S., Papotti M., Asa S.L. Overview of the 2022 WHO Classification of Neuroendocrine Neoplasms. Endocr. Pathol. 2022;33:115–154. doi: 10.1007/s12022-022-09708-2. [DOI] [PubMed] [Google Scholar]
- 2.Maris J.M. Recent advances in neuroblastoma. N. Engl. J. Med. 2010;362:2202–2211. doi: 10.1056/NEJMra0804577. [DOI] [PMC free article] [PubMed] [Google Scholar]
- 3.van Meerbeeck J.P., Fennell D.A., De Ruysscher D.K.M. Small-cell lung cancer. Lancet. 2011;378:1741–1755. doi: 10.1016/S0140-6736(11)60165-7. [DOI] [PubMed] [Google Scholar]
- 4.Nadal R., Schweizer M., Kryvenko O.N., Epstein J.I., Eisenberger M.A. Small cell carcinoma of the prostate. Nat. Rev. Urol. 2014;11:213–219. doi: 10.1038/nrurol.2014.21. [DOI] [PMC free article] [PubMed] [Google Scholar]
- 5.Park J.W., Lee J.K., Sheu K.M., Wang L., Balanis N.G., Nguyen K., Smith B.A., Cheng C., Tsai B.L., Cheng D., et al. Reprogramming normal human epithelial tissues to a common, lethal neuroendocrine cancer lineage. Science. 2018;362:91–95. doi: 10.1126/science.aat5749. [DOI] [PMC free article] [PubMed] [Google Scholar]
- 6.Corella A.N., Cabiliza Ordonio M.V.A., Coleman I., Lucas J.M., Kaipainen A., Nguyen H.M., Sondheim D., Brown L.G., True L.D., Lee J.K., et al. Identification of Therapeutic Vulnerabilities in Small-cell Neuroendocrine Prostate Cancer. Clin. Cancer Res. 2020;26:1667–1677. doi: 10.1158/1078-0432.CCR-19-0775. [DOI] [PMC free article] [PubMed] [Google Scholar]
- 7.Rudin C.M., Brambilla E., Faivre-Finn C., Sage J. Small-cell lung cancer. Nat. Rev. Dis. Primers. 2021;7:3. doi: 10.1038/s41572-020-00235-0. [DOI] [PMC free article] [PubMed] [Google Scholar]
- 8.Jiang S., Richaud M., Vieugué P., Rama N., Delcros J.G., Siouda M., Sanada M., Redavid A.R., Ducarouge B., Hervieu M., et al. Targeting netrin-3 in small cell lung cancer and neuroblastoma. EMBO Mol. Med. 2021;13 doi: 10.15252/emmm.202012878. [DOI] [PMC free article] [PubMed] [Google Scholar]
- 9.Guo H., Ci X., Ahmed M., Hua J.T., Soares F., Lin D., Puca L., Vosoughi A., Xue H., Li E., et al. ONECUT2 is a driver of neuroendocrine prostate cancer. Nat. Commun. 2019;10:278. doi: 10.1038/s41467-018-08133-6. [DOI] [PMC free article] [PubMed] [Google Scholar]
- 10.Unno K., Chalmers Z.R., Pamarthy S., Vatapalli R., Rodriguez Y., Lysy B., Mok H., Sagar V., Han H., Yoo Y.A., et al. Activated ALK Cooperates with N-Myc via Wnt/beta-Catenin Signaling to Induce Neuroendocrine Prostate Cancer. Cancer Res. 2021;81:2157–2170. doi: 10.1158/0008-5472.CAN-20-3351. [DOI] [PMC free article] [PubMed] [Google Scholar]
- 11.Raman S., Buongervino S.N., Lane M.V., Zhelev D.V., Zhu Z., Cui H., Martinez B., Martinez D., Wang Y., Upton K., et al. A GPC2 antibody-drug conjugate is efficacious against neuroblastoma and small-cell lung cancer via binding a conformational epitope. Cell Rep. Med. 2021;2 doi: 10.1016/j.xcrm.2021.100344. [DOI] [PMC free article] [PubMed] [Google Scholar]
- 12.Qiu B., Matthay K.K. Advancing therapy for neuroblastoma. Nat. Rev. Clin. Oncol. 2022;19:515–533. doi: 10.1038/s41571-022-00643-z. [DOI] [PubMed] [Google Scholar]
- 13.Pinto N.R., Applebaum M.A., Volchenboum S.L., Matthay K.K., London W.B., Ambros P.F., Nakagawara A., Berthold F., Schleiermacher G., Park J.R., et al. Advances in Risk Classification and Treatment Strategies for Neuroblastoma. J. Clin. Oncol. 2015;33:3008–3017. doi: 10.1200/JCO.2014.59.4648. [DOI] [PMC free article] [PubMed] [Google Scholar]
- 14.Alabi B.R., Liu S., Stoyanova T. Current and emerging therapies for neuroendocrine prostate cancer. Pharmacol. Ther. 2022;238 doi: 10.1016/j.pharmthera.2022.108255. [DOI] [PubMed] [Google Scholar]
- 15.Petty W.J., Paz-Ares L. Emerging Strategies for the Treatment of Small Cell Lung Cancer: A Review. JAMA Oncol. 2023;9:419–429. doi: 10.1001/jamaoncol.2022.5631. [DOI] [PubMed] [Google Scholar]
- 16.Liu S., Alabi B.R., Yin Q., Stoyanova T. Molecular mechanisms underlying the development of neuroendocrine prostate cancer. Semin. Cancer Biol. 2022;86:57–68. doi: 10.1016/j.semcancer.2022.05.007. [DOI] [PubMed] [Google Scholar]
- 17.Tan H.L., Sood A., Rahimi H.A., Wang W., Gupta N., Hicks J., Mosier S., Gocke C.D., Epstein J.I., Netto G.J., et al. Rb loss is characteristic of prostatic small cell neuroendocrine carcinoma. Clin. Cancer Res. 2014;20:890–903. doi: 10.1158/1078-0432.CCR-13-1982. [DOI] [PMC free article] [PubMed] [Google Scholar]
- 18.Mu P., Zhang Z., Benelli M., Karthaus W.R., Hoover E., Chen C.C., Wongvipat J., Ku S.Y., Gao D., Cao Z., et al. SOX2 promotes lineage plasticity and antiandrogen resistance in TP53- and RB1-deficient prostate cancer. Science. 2017;355:84–88. doi: 10.1126/science.aah4307. [DOI] [PMC free article] [PubMed] [Google Scholar]
- 19.Luo J., Wang K., Yeh S., Sun Y., Liang L., Xiao Y., Xu W., Niu Y., Cheng L., Maity S.N., et al. LncRNA-p21 alters the antiandrogen enzalutamide-induced prostate cancer neuroendocrine differentiation via modulating the EZH2/STAT3 signaling. Nat. Commun. 2019;10:2571. doi: 10.1038/s41467-019-09784-9. [DOI] [PMC free article] [PubMed] [Google Scholar]
- 20.Zhang Y., Zheng D., Zhou T., Song H., Hulsurkar M., Su N., Liu Y., Wang Z., Shao L., Ittmann M., et al. Androgen deprivation promotes neuroendocrine differentiation and angiogenesis through CREB-EZH2-TSP1 pathway in prostate cancers. Nat. Commun. 2018;9:4080. doi: 10.1038/s41467-018-06177-2. [DOI] [PMC free article] [PubMed] [Google Scholar]
- 21.Chen L., Alexe G., Dharia N.V., Ross L., Iniguez A.B., Conway A.S., Wang E.J., Veschi V., Lam N., Qi J., et al. CRISPR-Cas9 screen reveals a MYCN-amplified neuroblastoma dependency on EZH2. J. Clin. Invest. 2018;128:446–462. doi: 10.1172/JCI90793. [DOI] [PMC free article] [PubMed] [Google Scholar]
- 22.Bishop J.L., Thaper D., Vahid S., Davies A., Ketola K., Kuruma H., Jama R., Nip K.M., Angeles A., Johnson F., et al. The Master Neural Transcription Factor BRN2 Is an Androgen Receptor-Suppressed Driver of Neuroendocrine Differentiation in Prostate Cancer. Cancer Discov. 2017;7:54–71. doi: 10.1158/2159-8290.CD-15-1263. [DOI] [PubMed] [Google Scholar]
- 23.Ku S.Y., Rosario S., Wang Y., Mu P., Seshadri M., Goodrich Z.W., Goodrich M.M., Labbé D.P., Gomez E.C., Wang J., et al. Rb1 and Trp53 cooperate to suppress prostate cancer lineage plasticity, metastasis, and antiandrogen resistance. Science. 2017;355:78–83. doi: 10.1126/science.aah4199. [DOI] [PMC free article] [PubMed] [Google Scholar]
- 24.Brady N.J., Bagadion A.M., Singh R., Conteduca V., Van Emmenis L., Arceci E., Pakula H., Carelli R., Khani F., Bakht M., et al. Temporal evolution of cellular heterogeneity during the progression to advanced AR-negative prostate cancer. Nat. Commun. 2021;12:3372. doi: 10.1038/s41467-021-23780-y. [DOI] [PMC free article] [PubMed] [Google Scholar]
- 25.Yin Y., Xu L., Chang Y., Zeng T., Chen X., Wang A., Groth J., Foo W.C., Liang C., Hu H., Huang J. N-Myc promotes therapeutic resistance development of neuroendocrine prostate cancer by differentially regulating miR-421/ATM pathway. Mol. Cancer. 2019;18:11. doi: 10.1186/s12943-019-0941-2. [DOI] [PMC free article] [PubMed] [Google Scholar]
- 26.Kim D.H., Sun D., Storck W.K., Welker Leng K., Jenkins C., Coleman D.J., Sampson D., Guan X., Kumaraswamy A., Rodansky E.S., et al. BET Bromodomain Inhibition Blocks an AR-Repressed, E2F1-Activated Treatment-Emergent Neuroendocrine Prostate Cancer Lineage Plasticity Program. Clin. Cancer Res. 2021;27:4923–4936. doi: 10.1158/1078-0432.CCR-20-4968. [DOI] [PMC free article] [PubMed] [Google Scholar]
- 27.Wang L.L., Teshiba R., Ikegaki N., Tang X.X., Naranjo A., London W.B., Hogarty M.D., Gastier-Foster J.M., Look A.T., Park J.R., et al. Augmented expression of MYC and/or MYCN protein defines highly aggressive MYC-driven neuroblastoma: a Children's Oncology Group study. Br. J. Cancer. 2015;113:57–63. doi: 10.1038/bjc.2015.188. [DOI] [PMC free article] [PubMed] [Google Scholar]
- 28.Beltran H., Rickman D.S., Park K., Chae S.S., Sboner A., MacDonald T.Y., Wang Y., Sheikh K.L., Terry S., Tagawa S.T., et al. Molecular characterization of neuroendocrine prostate cancer and identification of new drug targets. Cancer Discov. 2011;1:487–495. doi: 10.1158/2159-8290.CD-11-0130. [DOI] [PMC free article] [PubMed] [Google Scholar]
- 29.Peifer M., Fernández-Cuesta L., Sos M.L., George J., Seidel D., Kasper L.H., Plenker D., Leenders F., Sun R., Zander T., et al. Integrative genome analyses identify key somatic driver mutations of small-cell lung cancer. Nat. Genet. 2012;44:1104–1110. doi: 10.1038/ng.2396. [DOI] [PMC free article] [PubMed] [Google Scholar]
- 30.Tao L., Mohammad M.A., Milazzo G., Moreno-Smith M., Patel T.D., Zorman B., Badachhape A., Hernandez B.E., Wolf A.B., Zeng Z., et al. MYCN-driven fatty acid uptake is a metabolic vulnerability in neuroblastoma. Nat. Commun. 2022;13:3728. doi: 10.1038/s41467-022-31331-2. [DOI] [PMC free article] [PubMed] [Google Scholar]
- 31.Smith B.A., Sokolov A., Uzunangelov V., Baertsch R., Newton Y., Graim K., Mathis C., Cheng D., Stuart J.M., Witte O.N. A basal stem cell signature identifies aggressive prostate cancer phenotypes. Proc. Natl. Acad. Sci. USA. 2015;112:E6544–E6552. doi: 10.1073/pnas.1518007112. [DOI] [PMC free article] [PubMed] [Google Scholar]
- 32.Bi H.L., Zhang X.L., Zhang Y.L., Xie X., Xia Y.L., Du J., Li H.H. The deubiquitinase UCHL1 regulates cardiac hypertrophy by stabilizing epidermal growth factor receptor. Sci. Adv. 2020;6 doi: 10.1126/sciadv.aax4826. [DOI] [PMC free article] [PubMed] [Google Scholar]
- 33.Liu S., González-Prieto R., Zhang M., Geurink P.P., Kooij R., Iyengar P.V., van Dinther M., Bos E., Zhang X., Le Dévédec S.E., et al. Deubiquitinase Activity Profiling Identifies UCHL1 as a Candidate Oncoprotein That Promotes TGFbeta-Induced Breast Cancer Metastasis. Clin. Cancer Res. 2020;26:1460–1473. doi: 10.1158/1078-0432.CCR-19-1373. [DOI] [PMC free article] [PubMed] [Google Scholar]
- 34.Li L., Tao Q., Jin H., van Hasselt A., Poon F.F., Wang X., Zeng M.S., Jia W.H., Zeng Y.X., Chan A.T.C., Cao Y. The tumor suppressor UCHL1 forms a complex with p53/MDM2/ARF to promote p53 signaling and is frequently silenced in nasopharyngeal carcinoma. Clin. Cancer Res. 2010;16:2949–2958. doi: 10.1158/1078-0432.CCR-09-3178. [DOI] [PubMed] [Google Scholar]
- 35.Mondello S., Linnet A., Buki A., Robicsek S., Gabrielli A., Tepas J., Papa L., Brophy G.M., Tortella F., Hayes R.L., Wang K.K. Clinical utility of serum levels of ubiquitin C-terminal hydrolase as a biomarker for severe traumatic brain injury. Neurosurgery. 2012;70:666–675. doi: 10.1227/NEU.0b013e318236a809. [DOI] [PMC free article] [PubMed] [Google Scholar]
- 36.Mondello S., Kobeissy F., Vestri A., Hayes R.L., Kochanek P.M., Berger R.P. Serum Concentrations of Ubiquitin C-Terminal Hydrolase-L1 and Glial Fibrillary Acidic Protein after Pediatric Traumatic Brain Injury. Sci. Rep. 2016;6 doi: 10.1038/srep28203. [DOI] [PMC free article] [PubMed] [Google Scholar]
- 37.Hussain S., Bedekovics T., Liu Q., Hu W., Jeon H., Johnson S.H., Vasmatzis G., May D.G., Roux K.J., Galardy P.J. UCH-L1 bypasses mTOR to promote protein biosynthesis and is required for MYC-driven lymphomagenesis in mice. Blood. 2018;132:2564–2574. doi: 10.1182/blood-2018-05-848515. [DOI] [PMC free article] [PubMed] [Google Scholar]
- 38.Hussain S., Foreman O., Perkins S.L., Witzig T.E., Miles R.R., van Deursen J., Galardy P.J. The de-ubiquitinase UCH-L1 is an oncogene that drives the development of lymphoma in vivo by deregulating PHLPP1 and Akt signaling. Leukemia. 2010;24:1641–1655. doi: 10.1038/leu.2010.138. [DOI] [PMC free article] [PubMed] [Google Scholar]
- 39.Zhong J., Zhao M., Ma Y., Luo Q., Liu J., Wang J., Yuan X., Sang J., Huang C. UCHL1 acts as a colorectal cancer oncogene via activation of the beta-catenin/TCF pathway through its deubiquitinating activity. Int. J. Mol. Med. 2012;30:430–436. doi: 10.3892/ijmm.2012.1012. [DOI] [PubMed] [Google Scholar]
- 40.Beck M., Hurt E. The nuclear pore complex: understanding its function through structural insight. Nat. Rev. Mol. Cell Biol. 2017;18:73–89. doi: 10.1038/nrm.2016.147. [DOI] [PubMed] [Google Scholar]
- 41.Schuller A.P., Wojtynek M., Mankus D., Tatli M., Kronenberg-Tenga R., Regmi S.G., Dip P.V., Lytton-Jean A.K.R., Brignole E.J., Dasso M., et al. The cellular environment shapes the nuclear pore complex architecture. Nature. 2021;598:667–671. doi: 10.1038/s41586-021-03985-3. [DOI] [PMC free article] [PubMed] [Google Scholar]
- 42.Knockenhauer K.E., Schwartz T.U. The Nuclear Pore Complex as a Flexible and Dynamic Gate. Cell. 2016;164:1162–1171. doi: 10.1016/j.cell.2016.01.034. [DOI] [PMC free article] [PubMed] [Google Scholar]
- 43.Zhang S., Zheng C., Li D., Bei C., Zhang H., Tian R., Song X., Zhu X., Tan S. Clinical Significance of POM121 Expression in Lung Cancer. Genet. Test. Mol. Biomarkers. 2020;24:819–824. doi: 10.1089/gtmb.2020.0053. [DOI] [PubMed] [Google Scholar]
- 44.Wang T., Sun H., Bao Y., En R., Tian Y., Zhao W., Jia L. POM121 overexpression is related to a poor prognosis in colorectal cancer. Expert Rev. Mol. Diagn. 2020;20:345–353. doi: 10.1080/14737159.2020.1707670. [DOI] [PubMed] [Google Scholar]
- 45.Ma H., Li L., Jia L., Gong A., Wang A., Zhang L., Gu M., Tang G. POM121 is identified as a novel prognostic marker of oral squamous cell carcinoma. J. Cancer. 2019;10:4473–4480. doi: 10.7150/jca.33368. [DOI] [PMC free article] [PubMed] [Google Scholar]
- 46.Guan L., Zhang L., Wang T., Jia L., Zhang N., Yan H., Zhao K. POM121 promotes proliferation and metastasis in non-small-cell lung cancer through TGF-beta/SMAD and PI3K/AKT pathways. Cancer Biomark. 2021;32:293–302. doi: 10.3233/CBM-210001. [DOI] [PubMed] [Google Scholar]
- 47.Rodriguez-Bravo V., Pippa R., Song W.M., Carceles-Cordon M., Dominguez-Andres A., Fujiwara N., Woo J., Koh A.P., Ertel A., Lokareddy R.K., et al. Nuclear Pores Promote Lethal Prostate Cancer by Increasing POM121-Driven E2F1, MYC, and AR Nuclear Import. Cell. 2018;174:1200–1215.e20. doi: 10.1016/j.cell.2018.07.015. [DOI] [PMC free article] [PubMed] [Google Scholar]
- 48.Hsu E.C., Rice M.A., Bermudez A., Marques F.J.G., Aslan M., Liu S., Ghoochani A., Zhang C.A., Chen Y.S., Zlitni A., et al. Trop2 is a driver of metastatic prostate cancer with neuroendocrine phenotype via PARP1. Proc. Natl. Acad. Sci. USA. 2020;117:2032–2042. doi: 10.1073/pnas.1905384117. [DOI] [PMC free article] [PubMed] [Google Scholar]
- 49.Balanis N.G., Sheu K.M., Esedebe F.N., Patel S.J., Smith B.A., Park J.W., Alhani S., Gomperts B.N., Huang J., Witte O.N., Graeber T.G. Pan-cancer Convergence to a Small-Cell Neuroendocrine Phenotype that Shares Susceptibilities with Hematological Malignancies. Cancer Cell. 2019;36:17–34.e7. doi: 10.1016/j.ccell.2019.06.005. [DOI] [PMC free article] [PubMed] [Google Scholar]
- 50.Beltran H., Prandi D., Mosquera J.M., Benelli M., Puca L., Cyrta J., Marotz C., Giannopoulou E., Chakravarthi B.V.S.K., Varambally S., et al. Divergent clonal evolution of castration-resistant neuroendocrine prostate cancer. Nat. Med. 2016;22:298–305. doi: 10.1038/nm.4045. [DOI] [PMC free article] [PubMed] [Google Scholar]
- 51.Bhattacharjee A., Richards W.G., Staunton J., Li C., Monti S., Vasa P., Ladd C., Beheshti J., Bueno R., Gillette M., et al. Classification of human lung carcinomas by mRNA expression profiling reveals distinct adenocarcinoma subclasses. Proc. Natl. Acad. Sci. USA. 2001;98:13790–13795. doi: 10.1073/pnas.191502998. [DOI] [PMC free article] [PubMed] [Google Scholar]
- 52.Halabi S., Kelly W.K., Ma H., Zhou H., Solomon N.C., Fizazi K., Tangen C.M., Rosenthal M., Petrylak D.P., Hussain M., et al. Meta-Analysis Evaluating the Impact of Site of Metastasis on Overall Survival in Men With Castration-Resistant Prostate Cancer. J. Clin. Oncol. 2016;34:1652–1659. doi: 10.1200/JCO.2015.65.7270. [DOI] [PMC free article] [PubMed] [Google Scholar]
- 53.Liu B., Li L., Yang G., Geng C., Luo Y., Wu W., Manyam G.C., Korentzelos D., Park S., Tang Z., et al. PARP Inhibition Suppresses GR-MYCN-CDK5-RB1-E2F1 Signaling and Neuroendocrine Differentiation in Castration-Resistant Prostate Cancer. Clin. Cancer Res. 2019;25:6839–6851. doi: 10.1158/1078-0432.CCR-19-0317. [DOI] [PMC free article] [PubMed] [Google Scholar]
- 54.Almstedt E., Elgendy R., Hekmati N., Rosén E., Wärn C., Olsen T.K., Dyberg C., Doroszko M., Larsson I., Sundström A., et al. Integrative discovery of treatments for high-risk neuroblastoma. Nat. Commun. 2020;11:71. doi: 10.1038/s41467-019-13817-8. [DOI] [PMC free article] [PubMed] [Google Scholar]
- 55.Ghandi M., Huang F.W., Jané-Valbuena J., Kryukov G.V., Lo C.C., McDonald E.R., 3rd, Barretina J., Gelfand E.T., Bielski C.M., Li H., et al. Next-generation characterization of the Cancer Cell Line Encyclopedia. Nature. 2019;569:503–508. doi: 10.1038/s41586-019-1186-3. [DOI] [PMC free article] [PubMed] [Google Scholar]
- 56.Dechat T., Vlcek S., Foisner R. Review: lamina-associated polypeptide 2 isoforms and related proteins in cell cycle-dependent nuclear structure dynamics. J. Struct. Biol. 2000;129:335–345. doi: 10.1006/jsbi.2000.4212. [DOI] [PubMed] [Google Scholar]
- 57.Hurst-Kennedy J., Chin L.S., Li L. Ubiquitin C-terminal hydrolase l1 in tumorigenesis. Biochem. Res. Int. 2012;2012 doi: 10.1155/2012/123706. [DOI] [PMC free article] [PubMed] [Google Scholar]
- 58.Liu Y., Fallon L., Lashuel H.A., Liu Z., Lansbury P.T., Jr. The UCH-L1 gene encodes two opposing enzymatic activities that affect alpha-synuclein degradation and Parkinson's disease susceptibility. Cell. 2002;111:209–218. doi: 10.1016/s0092-8674(02)01012-7. [DOI] [PubMed] [Google Scholar]
- 59.Seo E.Y., Jin S.P., Sohn K.C., Park C.H., Lee D.H., Chung J.H. UCHL1 Regulates Melanogenesis through Controlling MITF Stability in Human Melanocytes. J. Invest. Dermatol. 2017;137:1757–1765. doi: 10.1016/j.jid.2017.03.024. [DOI] [PubMed] [Google Scholar]
- 60.Zhao Y., Lei Y., He S.-W., Li Y.-Q., Wang Y.-Q., Hong X.-H., Liang Y.-L., Li J.-Y., Chen Y., Luo W.-J., et al. Hypermethylation of UCHL1 Promotes Metastasis of Nasopharyngeal Carcinoma by Suppressing Degradation of Cortactin (CTTN) Cells. 2020;9:559. doi: 10.3390/cells9030559. [DOI] [PMC free article] [PubMed] [Google Scholar]
- 61.Liu Y., Lashuel H.A., Choi S., Xing X., Case A., Ni J., Yeh L.A., Cuny G.D., Stein R.L., Lansbury P.T., Jr. Discovery of inhibitors that elucidate the role of UCH-L1 activity in the H1299 lung cancer cell line. Chem. Biol. 2003;10:837–846. doi: 10.1016/j.chembiol.2003.08.010. [DOI] [PubMed] [Google Scholar]
- 62.Panyain N., Godinat A., Lanyon-Hogg T., Lachiondo-Ortega S., Will E.J., Soudy C., Mondal M., Mason K., Elkhalifa S., Smith L.M., et al. Discovery of a Potent and Selective Covalent Inhibitor and Activity-Based Probe for the Deubiquitylating Enzyme UCHL1, with Antifibrotic Activity. J. Am. Chem. Soc. 2020;142:12020–12026. doi: 10.1021/jacs.0c04527. [DOI] [PMC free article] [PubMed] [Google Scholar]
- 63.Zugazagoitia J., Paz-Ares L. Extensive-Stage Small-Cell Lung Cancer: First-Line and Second-Line Treatment Options. J. Clin. Oncol. 2022;40:671–680. doi: 10.1200/JCO.21.01881. [DOI] [PubMed] [Google Scholar]
- 64.Sakuma S., Raices M., Borlido J., Guglielmi V., Zhu E.Y.S., D'Angelo M.A. Inhibition of Nuclear Pore Complex Formation Selectively Induces Cancer Cell Death. Cancer Discov. 2021;11:176–193. doi: 10.1158/2159-8290.CD-20-0581. [DOI] [PMC free article] [PubMed] [Google Scholar]
- 65.Amin R., Shukla A., Zhu J.J., Kim S., Wang P., Tian S.Z., Tran A.D., Paul D., Cappell S.D., Burkett S., et al. Nuclear pore protein NUP210 depletion suppresses metastasis through heterochromatin-mediated disruption of tumor cell mechanical response. Nat. Commun. 2021;12:7216. doi: 10.1038/s41467-021-27451-w. [DOI] [PMC free article] [PubMed] [Google Scholar]
- 66.Xu H., Valerio D.G., Eisold M.E., Sinha A., Koche R.P., Hu W., Chen C.W., Chu S.H., Brien G.L., Park C.Y., et al. NUP98 Fusion Proteins Interact with the NSL and MLL1 Complexes to Drive Leukemogenesis. Cancer Cell. 2016;30:863–878. doi: 10.1016/j.ccell.2016.10.019. [DOI] [PMC free article] [PubMed] [Google Scholar]
- 67.Lassman A.B., Wen P.Y., van den Bent M.J., Plotkin S.R., Walenkamp A.M.E., Green A.L., Li K., Walker C.J., Chang H., Tamir S., et al. A Phase II Study of the Efficacy and Safety of Oral Selinexor in Recurrent Glioblastoma. Clin. Cancer Res. 2022;28:452–460. doi: 10.1158/1078-0432.CCR-21-2225. [DOI] [PMC free article] [PubMed] [Google Scholar]
- 68.Wei X.X., Siegel A.P., Aggarwal R., Lin A.M., Friedlander T.W., Fong L., Kim W., Louttit M., Chang E., Zhang L., Ryan C.J. A Phase II Trial of Selinexor, an Oral Selective Inhibitor of Nuclear Export Compound, in Abiraterone- and/or Enzalutamide-Refractory Metastatic Castration-Resistant Prostate Cancer. Oncol. 2018;23:656–e64. doi: 10.1634/theoncologist.2017-0624. [DOI] [PMC free article] [PubMed] [Google Scholar]
- 69.Nachmias B., Schimmer A.D. Targeting nuclear import and export in hematological malignancies. Leukemia. 2020;34:2875–2886. doi: 10.1038/s41375-020-0958-y. [DOI] [PMC free article] [PubMed] [Google Scholar]
- 70.George J., Lim J.S., Jang S.J., Cun Y., Ozretić L., Kong G., Leenders F., Lu X., Fernández-Cuesta L., Bosco G., et al. Comprehensive genomic profiles of small cell lung cancer. Nature. 2015;524:47–53. doi: 10.1038/nature14664. [DOI] [PMC free article] [PubMed] [Google Scholar]
- 71.Shimada Y., Kudo Y., Maehara S., Matsubayashi J., Otaki Y., Kajiwara N., Ohira T., Minna J.D., Ikeda N. Ubiquitin C-terminal hydrolase-L1 has prognostic relevance and is a therapeutic target for high-grade neuroendocrine lung cancers. Cancer Sci. 2020;111:610–620. doi: 10.1111/cas.14284. [DOI] [PMC free article] [PubMed] [Google Scholar]
- 72.DeRose Y.S., Gligorich K.M., Wang G., Georgelas A., Bowman P., Courdy S.J., Welm A.L., Welm B.E. Patient-derived models of human breast cancer: protocols for in vitro and in vivo applications in tumor biology and translational medicine. In Curr Protoc Pharmacol. 2013 doi: 10.1002/0471141755.ph1423s60. [DOI] [PMC free article] [PubMed] [Google Scholar]
- 73.Jahchan N.S., Dudley J.T., Mazur P.K., Flores N., Yang D., Palmerton A., Zmoos A.F., Vaka D., Tran K.Q.T., Zhou M., et al. A drug repositioning approach identifies tricyclic antidepressants as inhibitors of small cell lung cancer and other neuroendocrine tumors. Cancer Discov. 2013;3:1364–1377. doi: 10.1158/2159-8290.CD-13-0183. [DOI] [PMC free article] [PubMed] [Google Scholar]
- 74.Sarbassov D.D., Guertin D.A., Ali S.M., Sabatini D.M. Phosphorylation and regulation of Akt/PKB by the rictor-mTOR complex. Science. 2005;307:1098–1101. doi: 10.1126/science.1106148. [DOI] [PubMed] [Google Scholar]
- 75.Nguyen H.M., Vessella R.L., Morrissey C., Brown L.G., Coleman I.M., Higano C.S., Mostaghel E.A., Zhang X., True L.D., Lam H.M., et al. LuCaP Prostate Cancer Patient-Derived Xenografts Reflect the Molecular Heterogeneity of Advanced Disease an--d Serve as Models for Evaluating Cancer Therapeutics. Prostate. 2017;77:654–671. doi: 10.1002/pros.23313. [DOI] [PMC free article] [PubMed] [Google Scholar]
- 76.Abida W., Cyrta J., Heller G., Prandi D., Armenia J., Coleman I., Cieslik M., Benelli M., Robinson D., Van Allen E.M., et al. Genomic correlates of clinical outcome in advanced prostate cancer. Proc. Natl. Acad. Sci. USA. 2019;116:11428–11436. doi: 10.1073/pnas.1902651116. [DOI] [PMC free article] [PubMed] [Google Scholar]
- 77.Rohrbeck A., Neukirchen J., Rosskopf M., Pardillos G.G., Geddert H., Schwalen A., Gabbert H.E., von Haeseler A., Pitschke G., Schott M., et al. Gene expression profiling for molecular distinction and characterization of laser captured primary lung cancers. J. Transl. Med. 2008;6:69. doi: 10.1186/1479-5876-6-69. [DOI] [PMC free article] [PubMed] [Google Scholar]
- 78.Garber M.E., Troyanskaya O.G., Schluens K., Petersen S., Thaesler Z., Pacyna-Gengelbach M., van de Rijn M., Rosen G.D., Perou C.M., Whyte R.I., et al. Diversity of gene expression in adenocarcinoma of the lung. Proc. Natl. Acad. Sci. USA. 2001;98:13784–13789. doi: 10.1073/pnas.241500798. [DOI] [PMC free article] [PubMed] [Google Scholar]
- 79.Aslan M., Hsu E.C., Liu S., Stoyanova T. Quantifying the invasion and migration ability of cancer cells with a 3D Matrigel drop invasion assay. Biol. Methods Protoc. 2021;6:bpab014. doi: 10.1093/biomethods/bpab014. [DOI] [PMC free article] [PubMed] [Google Scholar]
- 80.Gallo-Oller G., Ordoñez R., Dotor J. A new background subtraction method for Western blot densitometry band quantification through image analysis software. J. Immunol. Methods. 2018;457:1–5. doi: 10.1016/j.jim.2018.03.004. [DOI] [PubMed] [Google Scholar]
- 81.Liu S., Hsu E.C., Shen M., Aslan M., Stoyanova T. Metastasis Model to Test the Role of Notch Signaling in Prostate Cancer. Methods Mol. Biol. 2022;2472:221–233. doi: 10.1007/978-1-0716-2201-8_18. [DOI] [PubMed] [Google Scholar]
- 82.Gatto L., Lilley K.S. MSnbase-an R/Bioconductor package for isobaric tagged mass spectrometry data visualization, processing and quantitation. Bioinformatics. 2012;28:288–289. doi: 10.1093/bioinformatics/btr645. [DOI] [PubMed] [Google Scholar]
- 83.Navarro P., Trevisan-Herraz M., Bonzon-Kulichenko E., Núñez E., Martínez-Acedo P., Pérez-Hernández D., Jorge I., Mesa R., Calvo E., Carrascal M., et al. General statistical framework for quantitative proteomics by stable isotope labeling. J. Proteome Res. 2014;13:1234–1247. doi: 10.1021/pr4006958. [DOI] [PubMed] [Google Scholar]
Associated Data
This section collects any data citations, data availability statements, or supplementary materials included in this article.
Supplementary Materials
Data Availability Statement
Proteomic data have been deposited at PRIDE and are publicly available with the identifier PXD044864. This study did not generate any custom computer code. Any additional information required to reanalyze the data reported in this paper is available from the lead contact upon request.