

Abstract
Deleterious genetic variation is abundant in wild populations and understanding the ecological and conservation implications of such variation is an area of active research. Genomic methods are increasingly used to quantify the impacts of deleterious variation in natural populations; however, these approaches remain limited by an inability to accurately predict the selective and dominance effects of mutations. Computational simulations of deleterious variation offer a complementary tool that can help overcome these limitations, though such approaches have yet to be widely employed. In this Perspective, we aim to encourage ecological and conservation genomics researchers to adopt greater use of computational simulations to aid in deepening our understanding of deleterious variation in natural populations. We first provide an overview of the components of a simulation of deleterious variation, describing the key parameters involved in such models. Next, we discuss several approaches for validating simulation models. Finally, we compare and validate several recently-proposed deleterious mutation models, demonstrating that models based on estimates of selection parameters from experimental systems are biased towards highly deleterious mutations. We describe a new model that is supported by multiple orthogonal lines of evidence and provide example scripts for implementing this model (https://github.com/ckyriazis/simulations_review).
Keywords: computational simulations, deleterious mutations, distribution of fitness effects, genetic load, inbreeding depression, population genetics
Introduction
New mutations are constantly entering a population, some fraction of which are deleterious to organismal fitness (Eyre-Walker and Keightley 2007; Keightley 2012). The burden of deleterious variation carried by a population is referred to as its “genetic load”, defined as the reduction in fitness due to segregating and fixed deleterious mutations (Muller 1950; Agrawal and Whitlock 2012; Hedrick and Garcia-Dorado 2016). Genomic methods are now commonly used to characterize deleterious variation in wild populations (Kardos et al. 2016; Díez-del-Molino et al. 2018; Bertorelle et al. 2022), though the best approaches for leveraging such datasets to estimate genetic load remains an active area of research. In particular, empirical measures of putatively deleterious variation have seen increased use in conservation genomics studies (Bertorelle et al. 2022), however, these measures remain relatively crude and often challenging to interpret (Cooper and Shendure 2011; She and Jarosz 2018; Huber et al. 2020; Sandell and Sharp 2022).
In light of the limitations of empirical measures of deleterious variation and genetic load, the aim of this review is to encourage more ecological and conservation genomics researchers to employ computational genetic simulations. To that end, we first provide an overview of simulations of deleterious genetic variation, discussing the key parameters involved and how such methods can be used to model genetic load. Next, we discuss several approaches for validating these models, either by comparing predicted and observed patterns of genetic variation, or by comparing the predicted inbreeding load to an estimate for a given species. Using this validation approach for three recently-proposed deleterious variation models, we then demonstrate that models based on experimental estimates of selection parameters are biased towards highly deleterious mutations. Finally, we propose a new model that is supported by several orthogonal sources of evidence and conclude with a discussion of future directions in the field. Our hope is that this review will provide useful information for researchers aiming to incorporate simulation-based approaches into genomic studies of load, enabling more comprehensive assessments of the ecological and conservation relevance of deleterious genetic variation.
Defining genetic load
Understanding the implications of genetic load for organismal fitness and population viability is a topic of long-standing interest in population and conservation genetics (Haldane 1937; Muller 1950; Morton et al. 1956; Kimura et al. 1963; Agrawal and Whitlock 2012; Henn et al. 2015; Hedrick and Garcia-Dorado 2016). Several definitions of genetic load have been put forth in the literature recently, often with the aim of partitioning genetic load into “realized” and “potential” load (e.g., Mathur and DeWoody 2021; Bertorelle et al. 2022). Here, we adhere to the definition of genetic load as the realized reduction in mean fitness in a population due to segregating and fixed deleterious mutations (note that the “mutation load” typically refers only to mutations segregating under mutation-selection balance; Muller 1950; Agrawal and Whitlock 2012). The genetic load of a population at a single locus is given by:
| (1) |
where is the selection coefficient of a mutation, is the dominance coefficient, and is the mutation frequency (Agrawal and Whitlock 2012). Here, we parameterize fitness assuming that homozygous mutant individuals have a fitness of and heterozygous individuals have fitness , such that is positive for deleterious mutations. In equation (1), the effect of deleterious mutations found as heterozygotes is captured by the term and the effect of homozygous deleterious mutations is captured by the term. For fixed mutations , the genetic load is therefore equal to . Genetic load at a single locus can be related to mean population fitness at locus as: . When assuming fitness is multiplicative across sites (i.e., ignoring epistasis and linkage disequilibrium), the mean genome-wide fitness of a population can be obtained by multiplying across sites, such that . This quantity then can be subtracted from 1 to obtain the genome-wide genetic load (Agrawal and Whitlock 2012). Thus, the units of genetic load are in terms of multiplicative fitness scaled from 0 to 1.
Another important quantity for understanding the impacts of deleterious variation is the inbreeding load, which quantifies the rate at which fitness is lost under increasing levels of inbreeding (Morton et al. 1956; Hedrick and Garcia-Dorado 2016). Unlike the genetic load, the inbreeding load is measured in terms of lethal equivalents, which represent a summed quantity of for recessive deleterious mutations that are masked as heterozygotes. For a randomly mating population, the inbreeding load at a single locus is given by (Morton et al. 1956):
| (2) |
This equation demonstrates that the inbreeding load at a single locus is determined by the frequency and fitness effect of a mutation (), minus the effects that are expressed as homozygotes and heterozygotes . To calculate the total inbreeding load across a diploid genome , this quantity can be summed across sites with deleterious mutations and multiplied by two to account for diploidy, such that .
These fundamental principles demonstrate that an essential component of estimating the genetic load and inbreeding load (hereafter, referred to together as “load”) using genetic variation data is knowing and for individual mutations. However, although some progress has been made in predicting whether a mutation is likely to be neutral or deleterious (e.g., Cooper et al. 2005; Kumar et al. 2009; Choi et al. 2012; Cingolani et al. 2012; Kircher et al. 2014), accurately predicting and for individual mutations in genomic sequencing data remains a major challenge, even in humans and model organisms (Cooper and Shendure 2011; She and Jarosz 2018; Huber et al. 2020; Sandell and Sharp 2022). For example, a recent simulation study demonstrated that Genomic Evolutionary Rate Profiling (GERP; Cooper et al. 2005), a popular method for predicting the deleterious effect of mutations based on evolutionary conservation, cannot reliably distinguish weakly deleterious mutations from strongly deleterious mutations (Huber et al. 2020), though the method is commonly used for this purpose (e.g., Henn et al. 2016; Marsden et al. 2016; Van Der Valk et al. 2019; Dussex et al. 2021). Similarly, experimental studies in yeast have found that methods such as SIFT (Kumar et al. 2009) and PROVEAN (Choi et al. 2012) are poor predictors of the fitness effect of a mutation (She and Jarosz 2018; Sandell and Sharp 2022) that provide only crude proxies of . Moreover, these methods do not provide any information on dominance, an essential component of quantifying load. These limitations are unlikely to be fully overcome, particularly for non-model organisms, implying that methods for quantifying load based on sequence data will remain somewhat crude approximations for the foreseeable future.
Overview of simulation-based approaches
Computational simulations using evolutionary models provide an alternate way of quantifying load that alleviates many of the limitations discussed above. Simulations are widely used in population genetics (e.g., Marjoram and Donnelly 1994; Akey et al. 2004; Ramachandran et al. 2005; Fu et al. 2014; Harris and Nielsen 2016; Henn et al. 2016; Uricchio et al. 2016; Adrion et al. 2020a), yet remain underused in ecological and conservation genomics. Historically, this may be due to a relative lack of simulation tools capable of modelling ecologically-realistic scenarios and an often steep learning curve for using simulation software that may be poorly documented (Hoban et al. 2012). However, many of these challenges have been addressed by the forward-in-time genetic simulation program SLiM (Haller and Messer 2016, 2019, 2023), which offers a flexible array of models incorporating realistic ecological dynamics as well as comprehensive documentation and a graphical user interface. Other similar programs include Nemo (Guillaume and Rougemont 2006; Cotto et al. 2020) and SimBit (Matthey-Doret 2021), both of which have been applied in a conservation genetics context (Grossen et al. 2020; Grummer et al. 2022). Finally, another important recent advance in simulation software in population genetics is the growth of simulation resources through the PopSim consortium (Adrion et al. 2020a; Lauterbur et al. 2023), including a library of demographic models, recombination maps, and other useful simulation parameters for a growing number of species.
Simulations are broadly useful in evolutionary genetics because they can serve the critical function of revealing which evolutionary scenarios are consistent with observed patterns of genetic variation. All studies of genetic variation in natural populations suffer from the limitation that they are observing a single outcome of a stochastic evolutionary process, where underlying mechanisms are largely unobservable. Simulations allow researchers to model this evolutionary process and determine which mechanisms (e.g., genetic drift, gene flow, selection, migration) are needed to explain observed patterns of variation in a dataset. Moreover, the process of using simulations can be extremely valuable for developing intuition on how various evolutionary forces interact to influence patterns of genetic variation, improving the ability of researchers to design evolutionary genetics studies and interpret their results.
For studies aiming to assess the ecological and conservation relevance of deleterious variation, simulations can be especially useful for quantifying load, which can be directly tabulated from the simulation output (see Supplementary Appendix 1). Simulations can therefore be used to complement empirical measures of load, providing a framework in which to interpret observed patterns and verify that they are expected under a plausible evolutionary model. Moreover, simulations can go beyond empirical measures by projecting load under various future scenarios, illuminating how actions in the present-day may impact load decades or centuries from now. Finally, modern simulation tools, such as the ecologically-realistic models supported by SLiM (Haller and Messer 2019, 2023), also offer the potential to conduct an analysis of future extinction risk while incorporating genome-scale genetic variation (e.g., Robinson et al. 2022), analogous to the population viability analysis (PVA) approaches that have long been employed in conservation genetics (e.g., Lacy 1993, 2019; Beissinger and Westphal 1998; Brook et al. 2000).
In summary, simulation-based approaches have much to offer for genomic studies of deleterious variation in wild populations, yet their application remains relatively limited. In Table 1, we have summarized existing studies that employ simulations along with genomic analyses to investigate load in organisms ranging from Alpine ibex to Chinese crocodile lizards. We suggest that future research should incorporate similar approaches to those implemented in these studies to provide a more thorough investigation of load in wild populations.
Table 1:
Recent studies combining simulations with empirical genomic data to explore impacts of small population size on deleterious variation in non-human species
| Study | Organism | Simulation software | Distribution of fitness effects | Question addressed with simulations |
|---|---|---|---|---|
|
| ||||
| Beichman et al. 2023 | Sea otter | SLiM | Kim et al. 2017 ^ | How has the fur trade bottleneck impacted genetic load in the sea otter? |
| Dussex et al. 2021 | Kākāpō | SLiM | mean | Has purging occurred in the Stewart island kakapo population? |
| Grossen et al. 2020 | Alpine ibex | nemo | mean * | How has deleterious variation been impacted by a recent human-mediated bottleneck? |
| Kyriazis et al. 2023a | North American moose | SLiM | Kim et al. 2017 ^ | How have bottlenecks influenced purging and genetic load in North American moose? |
| Marsden et al. 2016 | Domestic dog | PReFerSim | Boyko et al. 2008 | How has the domestication bottleneck shaped deleterious variation in dogs? |
| Robinson et al. 2018 | Channel island fox | SLiM | Kim et al. 2017 | How has deleterious variation been impacted by small population size in island foxes? |
| Robinson et al. 2019 | Gray wolf | SLiM | Kim et al. 2017 | How does the large North American wolf population size influence recessive deleterious variation? |
| Robinson et al. 2022 | Vaquita | SLiM | Estimated by authors ^ | Are vaquitas doomed to extinction by inbreeding depression? |
| Stoffel et al. 2021b | Soay sheep | SLiM | Eyre-Walker et al. 2006 # | Are short runs of homozygosity purged of deleterious variation? |
| Takou et al. 2021 | Arabodopsi s lyrata | PReFerSim | Estimated by authors | Do range-edge populations have elevated genetic load? |
| Xie et al. 2022 | Chinese crocodile lizard | SLiM | Kim et al. 2017 | Have population declines resulted in purging? |
mean for gamma distribution, not based on explicit analysis
DFE uses shape parameter from Eyre-Walker et al. 2006 and mean of 0.01, 0.03, 0.05
sensitivity analysis conducted with additional DFEs
What are the components of a simulation of deleterious genetic variation?
Modelling deleterious genetic variation in a simulation framework at a minimum requires specifying a population history, mutation rate, recombination rate, deleterious mutation target size, and distribution of selection and dominance coefficients (Table 2). The extent to which these parameters need to be tailored to a focal organism will vary depending on the researcher’s objectives. Many studies may focus on using simulations primarily to explore qualitative dynamics of deleterious variation under various demographic and genetic scenarios. For example, one may be interested in asking: what are the qualitative effects of a bottleneck on genetic load under two extreme scenarios where deleterious mutations are either additive or fully recessive? For these studies, tailoring the simulation parameters to the focal organism may not be crucial, so long as the chosen parameters are reasonable.
Table 2:
Evolutionary forces relevant to modelling load and how these forces impact load
| Evolutionary force | Impact on genetic load | Impact on inbreeding load |
|---|---|---|
|
| ||
| Population size () | Decrease with increasing | Increase with increasing |
| Mutation rate () | Increase with increasing | Increase with increasing |
| Deleterious mutation target size () | Increase with increasing | Increase with increasing |
| Distribution of fitness effects () | Depends on N* | Increase with increasing mean |
| Dominance distribution () | Increase as increases from 0 to 0.5 | Decrease as increases from 0 to 0.5 |
| Recombination rate () | Decrease with increasing | Decrease with increasing |
Note that, under classical models of mutation load due to mutations segregating under mutation-selection balance, does not impact load. However, this result does not hold when considering fixed mutations and finite population size. See Kimura 1963 for a detailed analysis of the effects of , , and on genetic load.
For studies aiming to make more quantitative statements about genetic load or project future population trends, tailoring simulation parameters to the focal organism may be more critical. For example, demographic history can vary widely between populations and has a large influence on deleterious genetic variation. Thus, having a reliable demographic model is a crucial factor in modelling load. Fortunately, historical demographic parameters can be readily inferred from genomic datasets, though estimating recent demography (i.e., during the last tens or hundreds of generations) remains challenging (Beichman et al. 2018; Nadachowska-Brzyska et al. 2022). Importantly, computational simulation models need not assume populations are at mutation-selection-drift-equilibrium. However, it is typical to run a “burn-in” for forward-in-time simulations to reach equilibrium levels of genetic diversity in an ancestral population before modelling subsequent population size changes, when the population is no longer at equilibrium. This ability to model non-equilibrium dynamics is a key advantage of simulation approaches, as most natural populations are likely not at equilibrium, though many classic analytical results in population genetics assume equilibrium conditions (Brandvain and Wright 2016).
The mutation rate is another essential component influencing levels of deleterious variation in a population, though high-quality mutation rate estimates (i.e., based on a large number of sequenced trios) do not exist for the vast majority of species (though see Bergeron et al. 2023). However, mutation rates can also be estimated from substitution rates between species, an approach that is now widely feasible given the abundance of whole genome sequencing data (Lynch et al. 2016). Recombination rates can also influence load, as negative selection against deleterious alleles may be impeded in regions of low recombination (Charlesworth 2012; Berdan et al. 2021; Sianta et al. 2023). To model these dynamics for a species of interest, a growing number of approaches exist for estimating recombination rates from genomic datasets from as little as one diploid individual (e.g., Barroso et al. 2019; Adrion et al. 2020b). Tailoring the genome structure (i.e., the length and number of genes and extent of non-coding deleterious variation, which together determine the deleterious mutation target size) of a simulation to a specific organism can also be an important component of a simulation, particularly for studies aiming to model population dynamics due to the total impact of deleterious mutations. To aid in this, a growing number of annotated reference genomes are now available, which can provide useful information on genome structure, particularly for protein-coding regions of the genome (Paez et al. 2022).
Finally, the joint distributions of selection and dominance coefficients are essential components of modelling deleterious variation and load. These distributions determine the effect that new mutations exert on fitness, as well as the corresponding dominance coefficient of a mutation. Although there is broad agreement that strongly deleterious mutations tend to be highly recessive, the parameters of the distribution of dominance coefficients remain especially poorly known (Simmons and Crow 1977; Caballero and Keightley 1994; García-Dorado and Caballero 2000; Agrawal and Whitlock 2011; Huber et al. 2018). Much more is known about the distribution of selection coefficients for new mutations, often termed “the distribution of fitness effects” or DFE, though most studies remain focused on humans and model organisms such as Drosophila (Eyre-Walker and Keightley 2007; Huber et al. 2017; Kim et al. 2017; Fig. 1). Given the importance of the DFE for simulations of deleterious variation, as well as recent debate over DFE parameters (Kardos et al. 2021; Pérez-Pereira et al. 2021; Garcia-Dorado and Hedrick 2022; Pérez-Pereira et al. 2022; Kyriazis et al. 2023b), below we provide a more detailed review of this topic.
Figure 1: Representative estimates of the distribution of fitness effects from sequence-based approaches.

Distributions are plotted in discrete bins of weakly deleterious (0<<0.001), moderately deleterious (0.001=<<0.01), strongly deleterious (0.01<=<0.1), semi-lethal (0.1<=<0.99) and lethal (>=0.99) mutations. DFEs estimated for humans are colored in shades of blue, DFEs for non-human mammals are in shades of green, and non-mammalian DFEs are in shades of red. Note the higher fraction of weakly deleterious mutations in non-mammalian DFEs.
What is the DFE and how is it estimated?
The DFE is a probability distribution that quantifies the selective effect () of new mutations entering the population, i.e., what fraction of new mutations are adaptive, neutral, weakly deleterious, or strongly deleterious. Here, we focus our discussion on the deleterious portion of the DFE, given that adaptive mutations do not contribute to load. Importantly, the DFE is not an estimate of for segregating variation and therefore does not directly quantify load (see Supplemental Appendix 1; Fig. S1–S2), a misconception that has recently spread in the literature (e.g., Jones et al. 2020; Kutschera et al. 2020). Instead, the fate of a mutation after it enters a population, and whether it will segregate and potentially reach fixation, will be influenced by selection as well as the stochastic effects of genetic drift and linkage. Thus, quantifying segregating variation and load using the DFE requires modelling these effects under a given demographic model (see Supplemental Appendix 1 for an example; Fig. S1–S2).
Historically, the DFE was estimated primarily using experimental mutation accumulation approaches (Mukai 1964; Simmons and Crow 1977; Eyre-Walker and Keightley 2007; Halligan and Keightley 2009). However, these approaches are limited to detecting the small fraction of deleterious mutations that have large enough effects to be observed in a laboratory setting (though typically excluding lethals; Davies et al. 1999; Eyre-Walker and Keightley 2007; Halligan and Keightley 2009; see Supplemental Appendix 2; Table S1). These limitations motivated the development of sequence-based approaches for estimating the DFE over the past two decades (Eyre-Walker and Keightley 2007). Sequence-based methods estimate the DFE based on differences in the synonymous (assumed to be neutral) and nonsynonymous (assumed to be primarily neutral and deleterious) site frequency spectra (SFS), a summary of allele frequencies in a sample (Eyre-Walker et al. 2006; Eyre-Walker and Keightley 2007; Boyko et al. 2008; Kim et al. 2017; Tataru et al. 2017; see Supplemental Appendix 2). Specifically, these methods typically use the synonymous SFS to account for neutral demographic effects and, conditioning on inferred demographic or nuisance parameters, then estimate the parameters of the distribution of for new nonsynonymous mutations (most commonly, the mean and shape parameters of a gamma distribution). Thus, although these approaches have much greater power for estimating the weakly deleterious portion of the DFE, existing sequence-based DFEs are generally limited to nonsynonymous single nucleotide variants (though see Torgerson et al. 2009). Finally, one important limitation of sequence-based approaches is that they typically assume that all mutations have additive effects on fitness, given that information on the distribution of dominance coefficients is very limited (though see Huber et al. 2018). Consequently, sequence-based DFE approaches may not be well powered for estimating the relatively small portion of the DFE that is highly recessive and strongly deleterious, including recessive lethals (Wade et al. 2023). See Supplemental Appendix 2 for a detailed discussion of the nuances and limitations of sequence-based versus experimental methods to infer the DFE.
A growing number of studies have used sequence-based methods to estimate the DFE for nonsynonymous mutations in various taxa including humans, non-human primates, mice, Arabidopsis, Drosophila, and the highly endangered vaquita porpoise (Eyre-Walker et al. 2006; Boyko et al. 2008; Ma et al. 2013; Chen et al. 2017; Huber et al. 2017, 2018; Kim et al. 2017; Tataru et al. 2017; Castellano et al. 2019; Robinson et al. 2022; Fig. 1). In general, these studies estimate a relatively high proportion of weakly deleterious mutations (here defined as <1e-3). These sequence-based estimates are also in agreement with a broad literature in population genetics and functional genomics suggesting that the majority of nonsynonymous mutations have relatively minimal effects on fitness (Cassa et al. 2017; Agarwal and Przeworski 2021; Kruglyak et al. 2022; Agarwal et al. 2023). Another finding from sequence-based DFE studies is that the fraction of new mutations that are weakly deleterious appears to vary among major taxonomic groups. For example, studies in mammals generally estimate ~50% of mutations as weakly deleterious, whereas studies in Arabidopsis, Drosophila, and yeast suggest that >80% of new nonsynonymous mutations are weakly deleterious (Fig. 1). Comparative analyses of the DFE have suggested that such differences may be related to species complexity (Huber et al. 2017) as well as life history traits, such as selfing (Arunkumar et al. 2015; Chen et al. 2017).
How can we validate simulation models?
As can be seen from the above discussion, there are many different parameters in a model of deleterious variation, and the estimation of each of these parameters often comes with some uncertainty. Moreover, such parameter estimates do not exist for the vast majority of species, which may result in researchers employing parameter estimates from other (ideally, closely-related) species. Given these many potential sources of uncertainty, an important step in formulating a simulation model is ensuring that it is reasonable with some form of validation (Lotterhos et al. 2022).
One approach for validating a simulation model is to test whether patterns genetic variation generated under the model agree with patterns observed in an empirical genomic dataset. Various summary statistics can be useful for this exercise. Examination of the simulated and observed SFS can be particularly informative, as the SFS captures all allele frequency information in a dataset and is therefore a rich source of information for model validation (Schraiber and Akey 2015; Ragsdale et al. 2018). Comparing simulated vs observed heterozygosity, which is itself a summary of the SFS, can also be informative as a simple test of whether a model can predict basic aspects of an observed dataset. Additionally, in populations where inbreeding is present, comparing the observed and simulated distribution of runs of homozygosity can provide valuable information on whether the demographic parameters of a model are reasonable (see Kyriazis et al. 2023a for an example). Finally, examining patterns of linkage disequilibrium (LD) may also be useful, as patterns of LD represent a valuable source of information that is not contained in the SFS (Schraiber and Akey 2015; Ragsdale et al. 2018).
Such comparisons between simulated and empirical patterns of genetic variation can give some reassurance that a model is reasonable. However, for models that aim to examine ecological population dynamics due to genome-wide effects of deleterious variation, it may be important to also assess whether a model agrees with more direct, field-based estimates of fitness. For most species, this can pose a major challenge, as the long-term observational data that is typically required for measuring fitness remain rare (Sheldon et al. 2022). Moreover, another major hurdle is that comparing model-based predictions of genetic load to field-based estimates is not straightforward, as an empirical estimate of genetic load requires the existence of a “mutant-free” reference genotype where deleterious mutations are absent (Agrawal and Whitlock 2012; Robinson et al. 2023). Given that all organisms are burdened to some degree by deleterious mutations, this problem makes quantifying genetic load empirically a near-impossible task (Agrawal and Whitlock 2012).
A more feasible approach for comparing the effects of deleterious mutations between a model and empirical measurements of fitness is to examine the predicted inbreeding load. As described above, the inbreeding load quantifies the rate at which fitness is lost in a population as levels of inbreeding increase (Morton et al. 1956; Keller and Waller 2002; Hedrick and Garcia-Dorado 2016). This quantity can be measured empirically in systems where estimates of fitness and the inbreeding coefficient exist at an individual level (note that these individual-level data provide a population-level estimate of the inbreeding load; see Nietlisbach et al. 2019 for a detailed evaluation of common methodological approaches for measuring the inbreeding load). Thus, for species where such empirical estimates of the inbreeding load exist, it may be possible to compare these empirical estimates to those derived from a simulation model as a means to further validate model parameters.
However, there are several potential hurdles in comparing observed and predicted inbreeding load for model validation. First, empirical estimates of the inbreeding load do not exist for the vast majority of populations or species, thus it is unlikely that an estimate is available for model validation in a given population of interest. Second, even in cases where empirical estimates of the inbreeding load do exist, often they are not reliable (Nietlisbach et al. 2019). Accurately estimating the inbreeding load is not a trivial task: it requires large sample sizes, accurate estimates of the inbreeding coefficient ideally from genomic data, high variance in inbreeding in a population, and a reliable proxy for fitness (Kalinowski and Hedrick 1999; Nietlisbach et al. 2019). Relatively few studies exist that combine all of these elements, leading to wide variance in available estimates (see Supplemental Appendix 3 for further discussion).
Given these challenges, another approach may be to compare model-based predictions of the inbreeding load to empirical estimates that are averaged across populations or species. For instance, one widely-cited estimate of the median diploid inbreeding load (2B) for juvenile survival in mammals is 2B=3.1, derived from an analysis of 40 captive mammalian populations (Ralls et al. 1988). More recently, an analysis of the “total” inbreeding load in wild vertebrates proposed a much higher 2B=12, based on data from 12 primarily bird species (O’Grady et al. 2006). However, this estimate was shown to be upwardly biased and unreliable due to issues with the statistical methods and underlying datasets (Nietlisbach et al. 2019; see Supplemental Appendix 3). Given these issues, Nietlisbach et al. (2019) conducted a reanalysis and found a median inbreeding load for survival to sexual maturity in wild vertebrates of 2B=4.5. This value may serve as a useful point of comparison for validating model-based predictions. However, we emphasize that the inbreeding load of a given population is expected to vary based on its genomic and demographic characteristics; thus, model-based predictions may often be higher or lower than this estimate. Additional reliable estimates of the inbreeding load in wild populations will be valuable for further validating models in the future.
Validating recent deleterious mutation models
A great deal of recent debate has been concerned with the parameterization of models of deleterious variation (Kardos et al. 2021; Pérez-Pereira et al. 2021, 2022; Garcia-Dorado and Hedrick 2022; Kyriazis et al. 2023b). Much of this debate has occurred in response to the model employed by Kyriazis et al. (2021), a model that aimed to reflect deleterious mutation parameters in canids. Specifically, this model employed a genome structure consisting of 30Mb of coding sequence across 38 different chromosomes as informed by the structure of the dog genome (Lindblad-Toh et al. 2005), yielding an overall rate of deleterious mutation of per individual (see Supplemental Appendix 4 for details). Since estimates of selection and dominance parameters do not exist for canids, this model also employed a sequence-based DFE estimated from humans by Kim et al. (2017) and a dominance distribution that was proposed for humans by Henn et al. (2016) (Fig. 2; Table 3; see Supplemental Appendix 4 for details).
Figure 2: Comparison of DFE and dominance models employed by Kyriazis et al. 2021, Kardos et al. 2021, Pérez-Pereira et al. 2022, as well as the model described in this study.

(A) Distribution of fitness effects of new deleterious mutations for each model. (B) Distribution of dominance coefficients for each respective model. Note that the dominance distribution from Pérez-Pereira et al. 2022 assumes a distribution of for each value of (see Supplemental Appendix 4). See Table 3 for more details on these models.
Table 3:
Comparison DFE, dominance, and mutation rate parameters
| Model | mean | shape | lethals | mean | |
|---|---|---|---|---|---|
|
| |||||
| Kyriazis et al. 2021 | 0.0131 | 0.186 | 0 | 0.18 | 0.42 |
| Kardos et al. 2021 | 0.05 | 0.1 | 5% | 0.31 | 1.2 |
| Pérez-Pereira et al. 2022 | 0.2 | 0.33 | 0 | 0.28 | 0.4 |
| This study | 0.0131 | 0.186 | 0.3% | 0.28 | 0.63 |
Note that the mean and shape are for parameterizing a gamma distribution and “lethals” denotes an additional proportion of recessive lethals augmented to the gamma distribution. Mean denotes the mean dominance coefficient for new mutations under each DFE (note that this value is impacted by the assumed DFE, as DFEs with more strongly deleterious mutations will tend to have a more recessive mean when keeping the distribution of constant). represents the diploid genomic deleterious mutation rate from each of these models.
These parameters were criticized by both Kardos et al. (2021) and Pérez-Pereira et al. (2022), both of which argued that the Kim et al. (2017) DFE did not reflect the high proportion of strongly deleterious variation inferred from experimental studies. Additionally, these authors also criticized the dominance distribution based on Henn et al. (2016) as being too recessive (Fig. 2). Kardos et al. (2021) and Pérez-Pereira et al. (2022) instead proposed DFEs with a much greater proportion of highly deleterious alleles (here defined as >0.01) and dominance distributions that are far less recessive, loosely based on experimental results (Fig. 2; Table 3; see Supplemental Appendix 4 for details). These DFEs suggest that a large majority of new mutations are highly deleterious (~67% for Kardos et al. 2021 and ~71% for Pérez-Pereira et al. 2022; Fig. 2), in stark contrast to all existing sequence-based estimates for nonsynonymous mutations in diverse plant and animal taxa (Fig. 1). Finally, these authors also propose varying deleterious mutation rates as compared to Kyriazis et al. (2021), with Kardos et al. (2021) assuming and Pérez-Pereira et al. (2022) assuming (Table 3).
It is not surprising that the sequence-based DFE parameters estimated by Kim et al. (2017) and employed by Kyriazis et al. (2021) do not agree with experimental estimates of the DFE. As noted above, experimental estimates are well known to be biased towards highly deleterious variation, as the impacts of more weakly deleterious alleles may go undetected in an experimental setting (Davies et al. 1999; Eyre-Walker and Keightley 2007). To quantitatively demonstrate the implications of such extreme selection parameters, we compared these three proposed models in terms of whether the predicted nonsynonymous SFS from these models agrees with the observed SFS from a large sample of human genomes from the 1000G dataset (Auton et al. 2015; see Supplemental Appendix 5 for details). As described above, the SFS is a useful tool for model validation as it summarizes all allele frequency information in a sample. Given that Kardos et al. (2021) and Pérez-Pereira et al. (2022) claim that their models are applicable to mammals, their models should predict patterns of genetic variation that are consistent with those seen in humans.
When running SLiM simulations under a human demographic model and outputting the simulated SFS (see Supplemental Appendix 5; Fig. S3), we find that the predicted patterns of genetic variation from the Kardos et al. (2021) and Pérez-Pereira et al. (2022) models are not consistent with those observed in humans. Specifically, the nonsynonymous SFS from these models is greatly shifted towards rare variation, with a large majority of variants predicted to be singletons (variants with a count of 1 in the sample; Fig. 3; Table S2). For instance, the Kardos et al. (2021) model yields ~76% of variants as singletons and the Pérez-Pereira et al. (2022) model yields ~71% as singletons (Table S2). However, only ~57% of variants are singletons in the 1000G dataset (Table S2). This surplus of rare variation is due to the very strong predicted effects of negative selection under these models, which results in deleterious alleles being held at extremely low frequency. By contrast, the Kyriazis et al. (2021) model makes predictions that are in good agreement with observed patterns in humans, with ~54% of variants predicted to be singletons (Fig. 3; Table S2; see Supplemental Appendix 5 for further discussion). Overall, these results further confirm previous findings that experimentally-derived selection parameters are biased towards highly deleterious variation. Additionally, although our comparison here focuses on humans, the similarity between sequence-based human DFE estimates and those from other mammalian species (Fig. 1) suggests that similar results would be obtained when comparing model predictions to patterns of genomic variation in other taxa.
Figure 3: Predicted proportional nonsynonymous SFS from various DFE and dominance models compared to SFS from 1000G data.
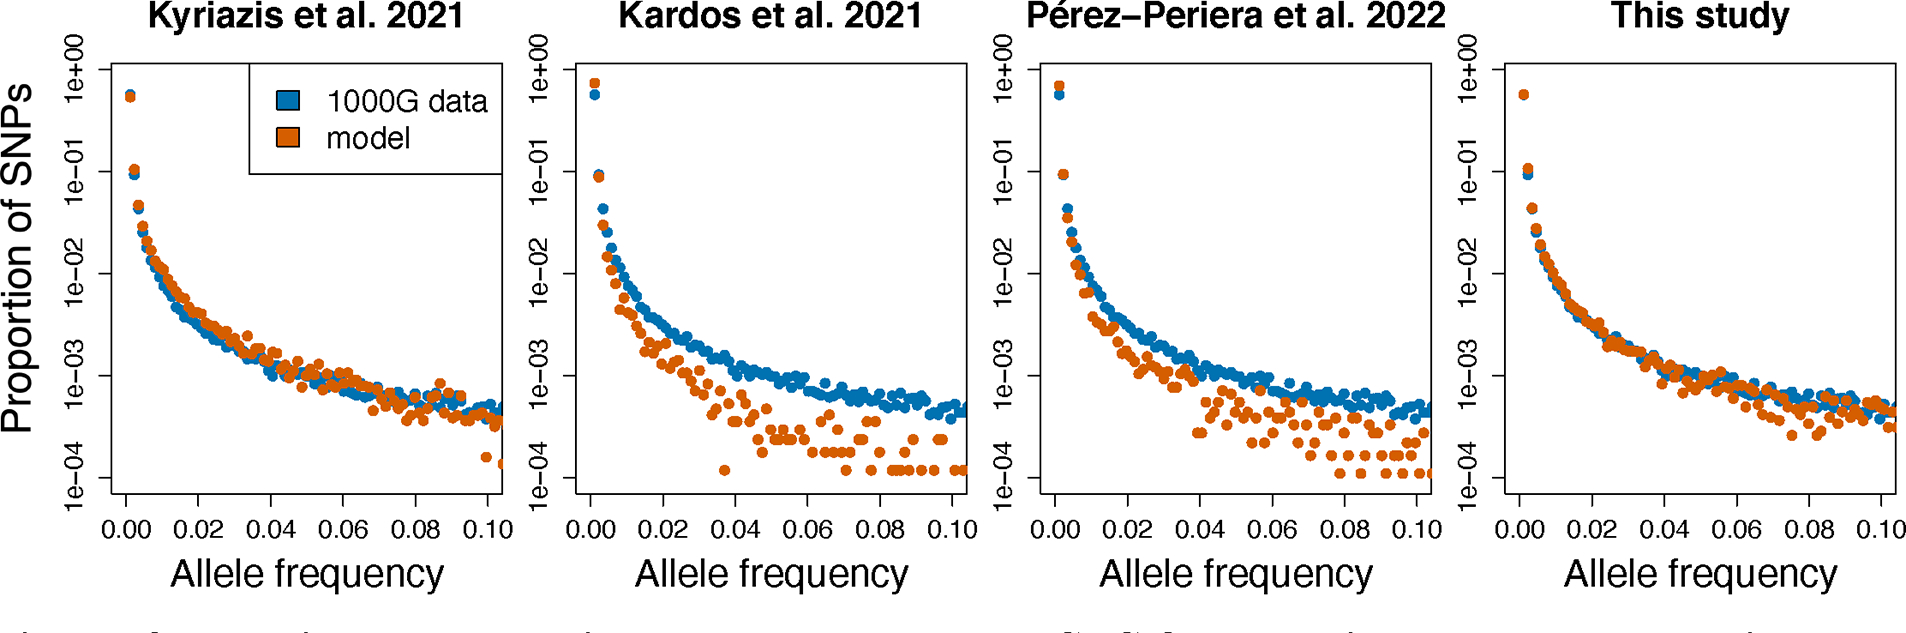
Note that the predicted SFS from the Kyriazis et al. 2021 model and the model proposed in this study fit the 1000G data well, whereas the predicted SFS from the Pérez-Pereira et al. 2022 and Kardos et al. 2021 models are greatly shifted towards rare alleles due to the overabundance of strongly deleterious variation in these models. See Figure S3 for plots of simulated vs empirical synonymous SFS and Table S2 for proportion of singletons and common variants predicted by each model.
As another approach for validating these models, we compared the predicted inbreeding load from each model to empirical estimates of inbreeding load in humans. Several estimates of the inbreeding load are available in humans, including an estimate of 2B=~4 from Morton et al. (1956) and 2B=1.4 from Bittles & Neel (1994). Additionally, Gao et al. (2015) estimated ~0.6 recessive lethal mutations per human, which represents the fraction of the inbreeding load that is due to lethal mutations. To assess which models are consistent with these estimates in humans, we again ran simulations under a human demographic model (Fig. S4). For each model, we assumed the genomic deleterious mutation rate proposed by each paper (Table 3). However, we also present results using the same human mutational parameters for all models (; see Supplemental Appendix 5) to facilitate more direct comparison of how these DFE and dominance parameters affect the predicted inbreeding load. Note that, although Kardos et al. (2021) and Pérez-Pereira et al. (2022) conducted a similar analysis of comparing the predicted inbreeding load from their models to an empirical estimate, their analysis assumed small equilibrium effective population sizes that do not reflect those observed in natural populations (see Supplemental Appendix 6; Fig. S5–S6). By contrast, our analysis employs a demographic model that was estimated for humans by Kim et al. (2017) that includes complex non-equilibrium dynamics (see Supplemental Appendix 5), as informed by observed patterns of synonymous variation in humans (Fig. S3).
Here, we find that all models greatly overshoot empirical estimates of the inbreeding load in humans. Specifically, the Kardos et al. (2021) and Pérez-Pereira et al. (2022) models predict very high inbreeding loads of 2B=38.0 and 2B=20.4, respectively, while the Kyriazis et al. (2021) model predicts an inbreeding load of 2B=7.6 (Fig. 4; Fig. S4). Moreover, the Kardos et al. (2021) and Pérez-Pereira et al. (2022) models also predict a high number of recessive lethal mutations (30.4 and 7.8 mutations per human, respectively), whereas the Kyriazis et al. (2021) model predicts no such lethal mutations (Fig. 4). Thus, none of these models are consistent with empirical inbreeding load estimates in humans, though over-predictions are especially notable for the Kardos et al. (2021) and Pérez-Pereira et al. (2022) models. Importantly, the predictions from the Kardos et al. (2021) and Pérez-Pereira et al. (2022) models are also not consistent with results from non-human species, where inbreeding loads are typically on the order of ~5 (Nietlisbach et al. 2019) and recessive lethal counts are consistently on the order of ~1.5 (Simmons and Crow 1977; McCune et al. 2002). Finally, note that results are qualitatively similar when assuming the same genomic deleterious mutation rate for all models (; Fig. S7), suggesting that much of the over-prediction of the inbreeding load for the Kardos et al. (2021) and Pérez-Pereira et al. (2022) models is due to the assumed DFE and dominance parameters.
Figure 4: Predicted inbreeding load for different deleterious variation models under a human demographic model.

Colors depict the contribution of inbreeding load from each class of deleterious mutations, with the total height of each bar representing the total predicted inbreeding load (2B). Detrimentals are here defined as mutations with <0.1, semi-lethals as mutations with 0.1<=<0.99, and lethals as mutations with >=0.99. Dashed lines show estimated number of lethals per diploid human from Gao et al. (2015) and inbreeding load estimates for humans from Bittles & Neel (1994) and Morton et al. (1956).
Given the shortcomings of these existing models, we propose a new model based on an analysis of the DFE in humans under a non-additive model of dominance (Cavassim, Kyriazis, and Lohmueller, in prep) as well as an estimate of the recessive lethal portion of the DFE (Wade et al. 2023). In brief, this new model assumes a somewhat less recessive dominance distribution compared to that assumed by Kyriazis et al. (2021) and is augmented with a small proportion (0.3%) of recessive lethal mutations (Fig 2; see Supplemental Appendix 5 for details). Indeed, simulation results under this model are in much better agreement with empirical estimates. Specifically, this new model predicts an inbreeding load of 2B=6.3, including ~0.9 recessive lethals per diploid (Fig. 4). Although the total predicted inbreeding load slightly exceeds empirical estimates in humans, this result is expected given that these empirical estimates are based only on juvenile survival and may therefore be underestimates of the full inbreeding load (Morton et al. 1956; Bittles and Neel 1994). Importantly, this model also predicts patterns of genetic variation that closely align with those observed in humans (Fig. 3; Table S2; see Supplemental Appendix 5 for further discussion).
Overall, this analysis demonstrates that sequence-based DFE estimates can explain empirical estimates of fitness when making slight adjustments to account for their shortcomings in estimating the proportion of recessive lethal mutations (Wade et al. 2023). Thus, sequence-based DFEs remain preferable for modelling deleterious variation because they account for the impacts of both weakly and strongly deleterious variation. To facilitate use of this new model in future simulation studies, we have provided an example SLiM script available on GitHub https://github.com/ckyriazis/simulations_review.
Conclusions & Remaining Questions
In summary, computational simulation tools represent a valuable resource for studying deleterious variation in natural populations that has been largely untapped by the ecological and conservation genomics community. As genomic datasets for wild species continue to grow, the necessity of employing such simulation tools to help interpret patterns in these data will also increase. Although parameterizing a computational simulation model may seem like a daunting task for a first-time user, we hope that this Perspective will provide a useful starting point for many of the key components.
Several outstanding questions remain to be addressed, which have implications both for our fundamental understanding of deleterious variation and inbreeding depression as well as for our ability to better parameterize simulation models. These include:
How can we better estimate dominance parameters?
Few estimates of the distribution of dominance parameters are available, and those that do exist sometimes conflict with one another (Simmons and Crow 1977; Caballero and Keightley 1994; Agrawal and Whitlock 2011; Huber et al. 2018). As dominance is an essential component of inbreeding depression, obtaining a better understanding of dominance will be essential to improving our ability to model the effects of inbreeding depression in natural populations.
How much does the DFE differ across taxa?
Most available estimates of the DFE are for mammals, with few existing estimates in other animal or plant taxa (Fig. 1). Obtaining a better understanding of the DFE across diverse taxa will help determine whether it is justified to use mammalian DFEs, such as the human DFE presented in this paper (Fig. 2), in simulations for other vertebrate taxa where DFE estimates are not available.
How much does balancing selection contribute to inbreeding depression?
Although the focus of this review is deleterious variation, studies in Drosophila suggest that inbreeding depression cannot be fully explained by deleterious alleles under mutation selection balance and that other factors, such as balancing selection, may play a role (Charlesworth and Charlesworth 1999; Charlesworth 2015). These studies notably contrast with our finding that deleterious variation models in humans are sufficient to explain empirical estimates of the inbreeding load (Fig. 4). Additional research is needed to better understand the reasons for these conflicting findings.
How can we better parameterize the effects of other sources of deleterious variation, including non-coding variation and structural variation?
Although our discussion in this paper is focused on deleterious mutations arising at nonsynonymous sites in coding regions, there are several other sources of deleterious variation, including variants in non-coding regions and structural variants. Although some evidence suggests that non-coding deleterious mutations tend to be primarily weakly deleterious (Torgerson et al. 2009; Murphy et al. 2021; Dukler et al. 2022), there have been few attempts to quantify the selective effects of structural variants (though see Abel et al. 2020). Quantifying the selective effects of these types of mutations will provide critical information for better parameterizing models of deleterious variation.
What is the role of epistasis?
Epistasis, or interactions between variants at different loci, is a factor that is typically ignored by models of deleterious variation and genetic load (Agrawal and Whitlock 2012). In many cases, this assumption seems justified, as there remains little convincing evidence for epistasis playing a major role in shaping the genomic landscape of deleterious variation (Carr and Dudash 2003; Agrawal and Whitlock 2012; Garcia and Lohmueller 2021; Sandler et al. 2021). Nevertheless, more research is needed to evaluate the potential impact of epistasis and understand its influence on deleterious variation and load.
Supplementary Material
Acknowledgements
We are grateful to Phil Morin, Annabel Beichman, Robert Wayne, Stella Yuan, Nandita Garud, Meixi Lin, and two anonymous reviewers for comments on the manuscript. C.C.K. and K.E.L. were supported by National Institutes of Health grant (R35GM119856 to K.E.L.).
Data and Code Accessibility
All simulation and plotting scripts are available at https://github.com/ckyriazis/simulations_review and have been archived in a Zenodo repository (DOI: 10.5281/zenodo.7925628).
References
- Abel HJ, Larson DE, Regier AA, Chiang C, Das I, Kanchi KL, Layer RM, et al. 2020. Mapping and characterization of structural variation in 17,795 human genomes. Nature 583:83–89. [DOI] [PMC free article] [PubMed] [Google Scholar]
- Adrion JR, Cole CB, Dukler N, Galloway JG, Gladstein AL, Gower G, Kyriazis CC, et al. 2020a. A community-maintained standard library of population genetic models. eLife 9:1–29. [DOI] [PMC free article] [PubMed] [Google Scholar]
- Adrion JR, Galloway JG, and Kern AD. 2020b. Predicting the landscape of recombination using deep learning. Molecular Biology and Evolution 37:1790–1808. [DOI] [PMC free article] [PubMed] [Google Scholar]
- Agarwal I, Fuller ZL, Myers SR, and Przeworski M. 2023. Relating pathogenic loss-of function mutations in humans to their evolutionary fitness costs. eLife 12:1–36. [DOI] [PMC free article] [PubMed] [Google Scholar]
- Agarwal I, and Przeworski M. 2021. Mutation saturation for fitness effects at human CPG sites. eLife 10:1–23. [DOI] [PMC free article] [PubMed] [Google Scholar]
- Agrawal AF, and Whitlock MC. 2011. Inferences about the distribution of dominance drawn from yeast gene knockout data. Genetics 187:553–566. [DOI] [PMC free article] [PubMed] [Google Scholar]
- ———. 2012. Mutation Load: The Fitness of Individuals in Populations Where Deleterious Alleles Are Abundant. Annual Review of Ecology, Evolution, and Systematics 43:115–135. [Google Scholar]
- Akey JM, Eberle MA, Rieder MJ, Carlson CS, Shriver MD, Nickerson DA, and Kruglyak L. 2004. Population history and natural selection shape patterns of genetic variation in 132 genes. PLoS Biology 2:1591–1599. [DOI] [PMC free article] [PubMed] [Google Scholar]
- Arunkumar R, Ness RW, Wright SI, and Barrett SCH. 2015. The evolution of selfing is accompanied by reduced efficacy of selection and purging of deleterious mutations. Genetics 199:817–829. [DOI] [PMC free article] [PubMed] [Google Scholar]
- Auton A, Abecasis GR, Altshuler DM, Durbin RM, Bentley DR, Chakravarti A, Clark AG, et al. 2015. A global reference for human genetic variation. Nature 526:68–74. [DOI] [PMC free article] [PubMed] [Google Scholar]
- Barroso GV, Puzović N, and Dutheil JY. 2019. Inference of recombination maps from a single pair of genomes and its application to ancient samples. PLoS Genetics 15:1–21. [DOI] [PMC free article] [PubMed] [Google Scholar]
- Beichman AC, Huerta-Sanchez E, and Lohmueller KE. 2018. Using Genomic Data to Infer Historic Population Dynamics. Annual Review of Ecology, Evolution, and Systematics 49:433–456. [Google Scholar]
- Beichman AC, Kalhori P, Kyriazis CC, Devries AA, Nigenda-Morales S, Heckel G, Schramm Y, et al. 2023. Genomic analyses reveal range-wide devastation of sea otter populations. Molecular Ecology 32:281–298. [DOI] [PMC free article] [PubMed] [Google Scholar]
- Beissinger SR, and Westphal MI. 1998. On the Use of Demographic Models of Population Viability in Endangered Species Management. Journal of Wildlife Management 62:821–841. [Google Scholar]
- Berdan EL, Blanckaert A, Butlin RK, and Bank C. 2021. Deleterious mutation accumulation and the long-term fate of chromosomal inversions. PLoS Genetics 17:1–23. [DOI] [PMC free article] [PubMed] [Google Scholar]
- Bergeron LA, Besenbacher S, Zheng J, Li P, Bertelsen MF, Quintard B, Hoffman JI, et al. 2023. Evolution of the germline mutation rate across vertebrates. Nature 615:285–291. [DOI] [PMC free article] [PubMed] [Google Scholar]
- Bertorelle G, Raffini F, Bosse M, Bortoluzzi C, Iannucci A, Trucchi E, Morales HE, et al. 2022. Genetic load: genomic estimates and applications in non-model animals. Nature Reviews Genetics 23:492–503. [DOI] [PubMed] [Google Scholar]
- Bittles AH, and Neel JV. 1994. The costs of human inbreeding and their implications for variations at the DNA level. Nature Genetics 8:117–121. [DOI] [PubMed] [Google Scholar]
- Boyko AR, Williamson SH, Indap AR, Degenhardt JD, Hernandez RD, Lohmueller KE, Adams MD, et al. 2008. Assessing the evolutionary impact of amino acid mutations in the human genome. PLoS Genetics 4:e1000083. [DOI] [PMC free article] [PubMed] [Google Scholar]
- Brandvain Y, and Wright SI. 2016. The Limits of Natural Selection in a Nonequilibrium World. Trends in Genetics 32:201–210. [DOI] [PubMed] [Google Scholar]
- Brook BW, O’Grady JJ, Chapman AP, Burgman MA, Resit Akçakaya H, and Frankham R. 2000. Predictive accuracy of population viability analysis in conservation biology. Nature 404:385–387. [DOI] [PubMed] [Google Scholar]
- Caballero A, and Keightley PD. 1994. A pleiotropic nonadditive model of variation in quantitative traits. Genetics 138:883–900. [DOI] [PMC free article] [PubMed] [Google Scholar]
- Carr DE, and Dudash MR. 2003. Recent approaches into the genetic basis of inbreeding depression in plants. Philosophical Transactions of the Royal Society B: Biological Sciences 358:1071–1084. [DOI] [PMC free article] [PubMed] [Google Scholar]
- Cassa CA, Weghorn D, Balick DJ, Jordan DM, Nusinow D, Samocha KE, O’Donnell-Luria A, et al. 2017. Estimating the selective effects of heterozygous protein-truncating variants from human exome data. Nature Genetics 49:806–810. [DOI] [PMC free article] [PubMed] [Google Scholar]
- Castellano D, Macià MC, Tataru P, Bataillon T, and Munch K. 2019. Comparison of the full distribution of fitness effects of new amino acid mutations across great apes. Genetics 213:953–966. [DOI] [PMC free article] [PubMed] [Google Scholar]
- Cavassim MIA, Kyriazis CC, and Lohmueller KE. n.d. Testing models of dominance of deleterious mutations in the human genome. In Prep. [Google Scholar]
- Charlesworth B 2012. The effects of deleterious mutations on evolution at linked sites. Genetics 190:5–22. [DOI] [PMC free article] [PubMed] [Google Scholar]
- ———. 2015. Causes of natural variation in fitness: evidence from studies of Drosophila populations. Proceedings of the National Academy of Sciences of the United States of America 112:1662–1669. [DOI] [PMC free article] [PubMed] [Google Scholar]
- Charlesworth B, and Charlesworth D. 1999. The genetic basis of inbreeding depression. Genetical Research 74:329–340. [DOI] [PubMed] [Google Scholar]
- Chen J, Glémin S, and Lascoux M. 2017. Genetic diversity and the efficacy of purifying selection across plant and animal species. Molecular Biology and Evolution 34:1417–1428. [DOI] [PubMed] [Google Scholar]
- Choi Y, Sims GE, Murphy S, Miller JR, and Chan AP. 2012. Predicting the Functional Effect of Amino Acid Substitutions and Indels. PLoS ONE 7:e46688. [DOI] [PMC free article] [PubMed] [Google Scholar]
- Cingolani P, Platts A, Wang LL, Coon M, Nguyen T, Wang L, Land SJ, et al. 2012. A program for annotating and predicting the effects of single nucleotide polymorphisms, SnpEff. Fly 6:80–92. [DOI] [PMC free article] [PubMed] [Google Scholar]
- Cooper GM, and Shendure J. 2011. Needles in stacks of needles: Finding disease-causal variants in a wealth of genomic data. Nature Reviews Genetics 12:628–640. [DOI] [PubMed] [Google Scholar]
- Cooper GM, Stone EA, Asimenos G, Green ED, Batzoglou S, and Sidow A. 2005. Distribution and intensity of constraint in mammalian genomic sequence. Genome Research 15:901–913. [DOI] [PMC free article] [PubMed] [Google Scholar]
- Cotto O, Schmid M, and Guillaume F. 2020. Nemo-age: spatially explicit simulations of eco-evolutionary dynamics in stage-structured populations under changing environments. Methods in Ecology and Evolution 11:1227–1236. [Google Scholar]
- Davies EK, Peters AD, and Keightley PD. 1999. High frequency of cryptic deleterious mutations in Caenorhabditis elegans. Science 285:1748–1751. [DOI] [PubMed] [Google Scholar]
- Díez-del-Molino D, Sánchez-Barreiro F, Barnes I, Gilbert MTP, and Dalén L. 2018. Quantifying Temporal Genomic Erosion in Endangered Species. Trends in Ecology and Evolution 33:176–185. [DOI] [PubMed] [Google Scholar]
- Dukler N, Mughal MR, Ramani R, Huang Y-F, and Siepel A. 2022. Extreme purifying selection against point mutations in the human genome. Nature Communications 13:1–12. [DOI] [PMC free article] [PubMed] [Google Scholar]
- Dussex N, van der Valk T, Morales HE, Wheat CW, Díez-del-Molino D, von Seth J, Foster Y, et al. 2021. Population genomics of the critically endangered kākāpō. Cell Genomics 1:1–10. [DOI] [PMC free article] [PubMed] [Google Scholar]
- Eyre-Walker A, and Keightley PD. 2007. The distribution of fitness effects of new mutations. Nature Reviews Genetics 8:610–618. [DOI] [PubMed] [Google Scholar]
- Eyre-Walker A, Woolfit M, and Phelps T. 2006. The Distribution of Fitness Effects of New Deleterious Amino Acid Mutations in Humans. Genetics 173:891–900. [DOI] [PMC free article] [PubMed] [Google Scholar]
- Fu W, Gittelman RM, Bamshad MJ, and Akey JM. 2014. Characteristics of neutral and deleterious protein-coding variation among individuals and populations. American Journal of Human Genetics 95:421–436. [DOI] [PMC free article] [PubMed] [Google Scholar]
- García-Dorado A, and Caballero A. 2000. On the Average Coefficient of Dominance of Deleterious Spontaneous Mutations. Genetics 1991–2001. [DOI] [PMC free article] [PubMed] [Google Scholar]
- Garcia-Dorado A, and Hedrick P. 2022. Some hope and many concerns on the future of the vaquita. Heredity. [DOI] [PMC free article] [PubMed] [Google Scholar]
- Garcia JA, and Lohmueller KE. 2021. Negative linkage disequilibrium between amino acid changing variants reveals interference among deleterious mutations in the human genome. PLoS Genetics 17:1–25. [DOI] [PMC free article] [PubMed] [Google Scholar]
- Grossen C, Guillaume F, Keller LF, and Croll D. 2020. Purging of highly deleterious mutations through severe bottlenecks in Alpine ibex. Nature communications 11:1–12. [DOI] [PMC free article] [PubMed] [Google Scholar]
- Grummer JA, Booker TR, Matthey-Doret R, Nietlisbach P, Thomaz AT, and Whitlock MC. 2022. The immediate costs and long-term benefits of assisted gene flow in large populations. Conservation Biology 36:1–12. [DOI] [PubMed] [Google Scholar]
- Guillaume F, and Rougemont J. 2006. Nemo: An evolutionary and population genetics programming framework. Bioinformatics 22:2556–2557. [DOI] [PubMed] [Google Scholar]
- Haldane J 1937. The effect of variation on fitness. The American Naturalist 71:337–349. [Google Scholar]
- Haller BC, and Messer PW. 2016. SLiM 2: Flexible, interactive forward genetic simulations. Molecular Biology and Evolution 34:230–240. [DOI] [PubMed] [Google Scholar]
- Haller BC, and Messer PW. 2019. SLiM 3: Forward Genetic Simulations Beyond the Wright–Fisher Model. Molecular Biology and Evolution 36:632–637. [DOI] [PMC free article] [PubMed] [Google Scholar]
- Haller BC, and Messer PW. 2023. SLiM 4: Multispecies eco-evolutionary modeling. The American Naturalist 201. [DOI] [PMC free article] [PubMed] [Google Scholar]
- Halligan DL, and Keightley PD. 2009. Spontaneous mutation accumulation studies in evolutionary genetics. Annual Review of Ecology, Evolution, and Systematics 40:151–172. [Google Scholar]
- Harris K, and Nielsen R. 2016. The genetic cost of neanderthal introgression. Genetics 203:881–891. [DOI] [PMC free article] [PubMed] [Google Scholar]
- Hedrick PW, and Garcia-Dorado A. 2016. Understanding Inbreeding Depression, Purging, and Genetic Rescue. Trends in Ecology and Evolution 31:940–952. [DOI] [PubMed] [Google Scholar]
- Henn BM, Botigué LR, Bustamante CD, Clark AG, and Gravel S. 2015. Estimating the mutation load in human genomes. Nature Reviews Genetics 16:333–343. [DOI] [PMC free article] [PubMed] [Google Scholar]
- Henn BM, Botigué LR, Peischl S, Dupanloup I, Lipatov M, Maples BK, Martin AR, et al. 2016. Distance from sub-Saharan Africa predicts mutational load in diverse human genomes. Proceedings of the National Academy of Sciences 113:E440–E449. [DOI] [PMC free article] [PubMed] [Google Scholar]
- Hoban S, Bertorelle G, and Gaggiotti OE. 2012. Computer simulations: Tools for population and evolutionary genetics. Nature Reviews Genetics 13:110–122. [DOI] [PubMed] [Google Scholar]
- Huber CD, Durvasula A, and Hancock AM. 2018. Gene expression drives the evolution of dominance. Nature Communications 9:1–11. [DOI] [PMC free article] [PubMed] [Google Scholar]
- Huber CD, Kim BY, and Lohmueller KE. 2020. Population genetic models of GERP scores suggest pervasive turnover of constrained sites across mammalian evolution. PLoS Genetics 16:1–26. [DOI] [PMC free article] [PubMed] [Google Scholar]
- Huber CD, Kim BY, Marsden CD, and Lohmueller KE. 2017. Determining the factors driving selective effects of new nonsynonymous mutations. Proceedings of the National Academy of Sciences 114:4465–4470. [DOI] [PMC free article] [PubMed] [Google Scholar]
- Jones MR, Scott Mills L, Jensen JD, and Good JM. 2020. The origin and spread of locally adaptive seasonal camouflage in snowshoe hares. American Naturalist 196:316–332. [DOI] [PubMed] [Google Scholar]
- Kalinowski ST, and Hedrick PW. 1999. Detecting inbreeding depression is difficult in captive endangered species. Animal Conservation 2:131–136. [Google Scholar]
- Kardos M, Armstrong EE, Fitzpatrick SW, Hauser S, Hedrick PW, Miller JM, Tallmon DA, et al. 2021. The crucial role of genome-wide genetic variation in conservation. Proceedings of the National Academy of Sciences of the United States of America 118:1–10. [DOI] [PMC free article] [PubMed] [Google Scholar]
- Kardos M, Taylor HR, Ellegren H, Luikart G, and Allendorf FW. 2016. Genomics advances the study of inbreeding depression in the wild. Evolutionary Applications 9:1205–1218. [DOI] [PMC free article] [PubMed] [Google Scholar]
- Keightley PD 2012. Rates and fitness consequences of new mutations in humans. Genetics 190:295–304. [DOI] [PMC free article] [PubMed] [Google Scholar]
- Keller L, and Waller DM. 2002. Inbreeding effects in wild populations. Trends in Ecology and Evolution 17:19–23. [Google Scholar]
- Kim BY, Huber CD, and Lohmueller KE. 2017. Inference of the Distribution of Selection Coefficients for New Nonsynonymous Mutations Using Large Samples. Genetics 206:345–361. [DOI] [PMC free article] [PubMed] [Google Scholar]
- Kimura M, Maruyama T, and Crow JF. 1963. The mutation load in small populations. Genetics 48:1303–1312. [DOI] [PMC free article] [PubMed] [Google Scholar]
- Kircher M, Witten DM, Jain P, O’roak BJ, Cooper GM, and Shendure J. 2014. A general framework for estimating the relative pathogenicity of human genetic variants. Nature Genetics 46:310–315. [DOI] [PMC free article] [PubMed] [Google Scholar]
- Kruglyak L, Beyer A, Bloom JS, Grossbach J, Tami D, Mancuso CP, Rich MS, et al. 2022. No evidence that synonymous mutations in yeast genes are mostly deleterious. bioRxiv 1–11. [Google Scholar]
- Kumar P, Henikoff S, and Ng PC. 2009. Predicting the effects of coding non-synonymous variants on protein function using the SIFT algorithm. Nature Protocols 4:1073–1082. [DOI] [PubMed] [Google Scholar]
- Kutschera VE, Poelstra JW, Botero-Castro F, Dussex N, Gemmell NJ, Hunt GR, Ritchie MG, et al. 2020. Purifying Selection in Corvids Is Less Efficient on Islands. Molecular Biology and Evolution 37:469–474. [DOI] [PMC free article] [PubMed] [Google Scholar]
- Kyriazis CC, Beichman AC, Brzeski KE, Hoy SR, Peterson RO, Vucetich JA, Vucetich LM, et al. 2023a. Genomic underpinnings of population persistence in Isle Royale moose. Molecular Biology and Evolution 40:1–17. [DOI] [PMC free article] [PubMed] [Google Scholar]
- Kyriazis CC, Robinson JA, Nigenda-Morales SF, Beichman AC, Rojas-Bracho L, Robertson KM, Fontaine MC, et al. 2023b. Models based on best-available information support a low inbreeding load and potential for recovery in the vaquita. Heredity 130:183 – 187. [DOI] [PMC free article] [PubMed] [Google Scholar]
- Kyriazis CC, Robinson JA, and Lohmueller KE. 2023c. Using computational simulations to model deleterious variation and genetic load in natural populations. American Naturalist, Zenodo Digital Repository, DOI: 10.5281/zenodo.7925628. [DOI] [PMC free article] [PubMed] [Google Scholar]
- Kyriazis CC, Wayne RK, and Lohmueller KE. 2021. Strongly deleterious mutations are a primary determinant of extinction risk due to inbreeding depression. Evolution Letters 5:33–47. [DOI] [PMC free article] [PubMed] [Google Scholar]
- Lacy RC 1993. Vortex Computer Simulation Model for Population Viability Analysis. Wildlife Research 20:45–65. [Google Scholar]
- Lacy RC 2019. Lessons from 30 years of population viability analysis of wildlife populations. Zoo Biology 38:67–77. [DOI] [PubMed] [Google Scholar]
- Lauterbur ME, Cavassim MIA, Gladstein AL, Gower G, Pope NS, Tsambos G, Adrion J, et al. 2023. Expanding the stdpopsim species catalog, and lessons learned for realistic genome simulations. bioRxiv. [DOI] [PMC free article] [PubMed] [Google Scholar]
- Lindblad-Toh K, Wade CM, Mikkelsen TS, Karlsson EK, Jaffe DB, Kamal M, Clamp M, et al. 2005. Genome sequence, comparative analysis and haplotype structure of the domestic dog. Nature 438:803–819. [DOI] [PubMed] [Google Scholar]
- Lotterhos KE, Fitzpatrick MC, and Blackmon H. 2022. Simulation Tests of Methods in Evolution, Ecology, and Systematics: Pitfalls, Progress, and Principles. Annual Review of Ecology, Evolution and Systematics 53:1–24. [DOI] [PMC free article] [PubMed] [Google Scholar]
- Lynch M, Ackerman MS, Gout JF, Long H, Sung W, Thomas WK, and Foster PL. 2016. Genetic drift, selection and the evolution of the mutation rate. Nature Reviews Genetics 17:704–714. [DOI] [PubMed] [Google Scholar]
- Ma X, Kelley JL, Eilertson K, Musharoff S, Degenhardt JD, Martins AL, Vinar T, et al. 2013. Population Genomic Analysis Reveals a Rich Speciation and Demographic History of Orang-utans (Pongo pygmaeus and Pongo abelii). PLoS ONE 8. [DOI] [PMC free article] [PubMed] [Google Scholar]
- Marjoram P, and Donnelly P. 1994. Pairwise comparisons of mitochondrial DNA sequences in subdivided populations and implications for early human evolution. Genetics 136:673–683. [DOI] [PMC free article] [PubMed] [Google Scholar]
- Marsden CD, Ortega-Del Vecchyo D, O’Brien DP, Taylor JF, Ramirez O, Vilà C, Marques-Bonet T, et al. 2016. Bottlenecks and selective sweeps during domestication have increased deleterious genetic variation in dogs. Proceedings of the National Academy of Sciences 113:152–157. [DOI] [PMC free article] [PubMed] [Google Scholar]
- Mathur S, and DeWoody JA. 2021. Genetic load has potential in large populations but is realized in small inbred populations. Evolutionary Applications 14:1540–1557. [DOI] [PMC free article] [PubMed] [Google Scholar]
- Matthey-Doret R 2021. SimBit: A high performance, flexible and easy-to-use population genetic simulator. Molecular Ecology Resources 21:1745–1754. [DOI] [PubMed] [Google Scholar]
- McCune AR, Fuller RC, Aquilina AA, Dawley RM, Fadool JM, Houle D, Travis J, et al. 2002. A low genomic number of recessive lethals in natural populations of bluefin killifish and zebrafish. Science 296:2398–2401. [DOI] [PubMed] [Google Scholar]
- Morton NE, Crow JF, and Muller HJ. 1956. An Estimate of the Mutational Damage in Man From Data on Consanguineous Marriages. Proceedings of National Academy of Sciences 42:855–863. [DOI] [PMC free article] [PubMed] [Google Scholar]
- Mukai T 1964. The genetic structure of natural populations of Drosophila melanogaster. I. Spontaneous mutation rate of polygenes controlling viability. Genetics 50:1–19. [DOI] [PMC free article] [PubMed] [Google Scholar]
- Muller HJ 1950. Our load of mutations. The American Journal of Human Genetics 2:111–176. [PMC free article] [PubMed] [Google Scholar]
- Murphy D, Elyashiv E, Amster G, and Sella G. 2021. Broad-scale variation in human genetic diversity levels is predicted by purifying selection on coding and non-coding elements. bioRxiv 1–18. [DOI] [PMC free article] [PubMed] [Google Scholar]
- Nadachowska-Brzyska K, Konczal M, and Babik W. 2022. Navigating the temporal continuum of effective population size. Methods in Ecology and Evolution 13:22–41. [Google Scholar]
- Nietlisbach P, Muff S, Reid JM, Whitlock MC, and Keller LF. 2019. Nonequivalent lethal equivalents: Models and inbreeding metrics for unbiased estimation of inbreeding load. Evolutionary Applications 12:266–279. [DOI] [PMC free article] [PubMed] [Google Scholar]
- O’Grady JJ, Brook BW, Reed DH, Ballou JD, Tonkyn DW, and Frankham R. 2006. Realistic levels of inbreeding depression strongly affect extinction risk in wild populations. Biological Conservation 133:42–51. [Google Scholar]
- Paez S, Kraus RHS, Shapiro B, Gilbert MTP, Jarvis ED, and V. G. P. C. Group. 2022. Reference genomes for conservation. Science 377:364–366. [DOI] [PubMed] [Google Scholar]
- Pérez-Pereira N, Caballero A, and García-Dorado A. 2022. Reviewing the consequences of genetic purging on the success of rescue programs. Conservation Genetics 23:1–17. [Google Scholar]
- Pérez-Pereira N, Pouso R, Rus A, Vilas A, López-Cortegano E, García-Dorado A, Quesada H, et al. 2021. Long-term exhaustion of the inbreeding load in Drosophila melanogaster. Heredity 127:373–383. [DOI] [PMC free article] [PubMed] [Google Scholar]
- Ragsdale AP, Moreau C, and Gravel S. 2018. Genomic inference using diffusion models and the allele frequency spectrum. Current Opinion in Genetics and Development 53:140–147. [DOI] [PubMed] [Google Scholar]
- Ralls K, Ballou JD, Templeton A, Ralls K, and Ballou JD. 1988. Estimates of Lethal Equivalents and the Cost of Inbreeding in Mammals. Conservation Biology 2:185–193. [Google Scholar]
- Ramachandran S, Deshpande O, Roseman CC, Rosenberg NA, Feldman MW, and Cavalli-Sforza LL. 2005. Support from the relationship of genetic and geographic in human populations for a serial founder effect originating in Africa. Proceedings of the National Academy of Sciences of the United States of America 102:15942–15947. [DOI] [PMC free article] [PubMed] [Google Scholar]
- Robinson JA, Brown C, Kim BY, Lohmueller KE, and Wayne RK. 2018. Purging of Strongly Deleterious Mutations Explains Long-Term Persistence and Absence of Inbreeding Depression in Island Foxes. Current Biology 28:3487–3494.e4. [DOI] [PMC free article] [PubMed] [Google Scholar]
- Robinson JA, Kyriazis CC, Nigenda-Morales SF, Beichman AC, Rojas-Bracho L, Robertson KM, Fontaine MC, et al. 2022. The critically endangered vaquita is not doomed to extinction by inbreeding depression. Science 639:635–639. [DOI] [PMC free article] [PubMed] [Google Scholar]
- Robinson JA, Kyriazis CC, Yuan SC, and Lohmueller KE. 2023. Deleterious Variation in Natural Populations and Implications for Conservation Genetics. Annual Review of Animal Biosciences 11:93–114. [DOI] [PMC free article] [PubMed] [Google Scholar]
- Robinson JA, Räikkönen J, Vucetich LM, Vucetich JA, Peterson RO, Lohmueller KE, and Wayne RK. 2019. Genomic signatures of extensive inbreeding in Isle Royale wolves, a population on the threshold of extinction. Science Advances 5:1–13. [DOI] [PMC free article] [PubMed] [Google Scholar]
- Sandell L, and Sharp NP. 2022. Fitness Effects of Mutations: An Assessment of PROVEAN Predictions Using Mutation Accumulation Data. Genome Biology and Evolution 14:1–15. [DOI] [PMC free article] [PubMed] [Google Scholar]
- Sandler G, Wright SI, and Agrawal AF. 2021. Patterns and Causes of Signed Linkage Disequilibria in Flies and Plants. Molecular Biology and Evolution 38:4310–4321. [DOI] [PMC free article] [PubMed] [Google Scholar]
- Schraiber JG, and Akey JM. 2015. Methods and models for unravelling human evolutionary history. Nature Reviews Genetics 16:727–740. [DOI] [PubMed] [Google Scholar]
- She R, and Jarosz DF. 2018. Mapping Causal Variants with Single-Nucleotide Resolution Reveals Biochemical Drivers of Phenotypic Change. Cell 172:478–490.e15. [DOI] [PMC free article] [PubMed] [Google Scholar]
- Sheldon BC, Kruuk LEB, and Alberts SC. 2022. The expanding value of long-term studies of individuals in the wild. Nature Ecology & Evolution 6:1799–1801. [DOI] [PubMed] [Google Scholar]
- Sianta SA, Peischl S, Moeller DA, and Brandvain Y. 2023. The efficacy of selection may increase or decrease with selfing depending upon the recombination environment. Evolution 77:394–408. [DOI] [PubMed] [Google Scholar]
- Simmons MJ, and Crow JF. 1977. Mutations affecting fitness in Drosophila populations. Ann. Rev. Genet. 11:49–78. [DOI] [PubMed] [Google Scholar]
- Stoffel MA, Johnston SE, Pilkington JG, and Pemberton JM. 2021. Mutation load decreases with haplotype age in wild Soay sheep. Evolution Letters 5:187–195. [DOI] [PMC free article] [PubMed] [Google Scholar]
- Takou M, Hämälä T, Koch EM, Steige KA, Dittberner H, Yant L, Genete M, et al. 2021. Maintenance of Adaptive Dynamics and No Detectable Load in a Range-Edge Outcrossing Plant Population. Molecular Biology and Evolution 38:1820–1836. [DOI] [PMC free article] [PubMed] [Google Scholar]
- Tataru P, Mollion M, Glémin S, and Bataillon T. 2017. Inference of Distribution of Fitness Effects and Proportion of Adaptive Substitutions from Polymorphism Data. Genetics 207:1103–1119. [DOI] [PMC free article] [PubMed] [Google Scholar]
- Torgerson DG, Boyko AR, Hernandez RD, Indap A, Hu X, White TJ, Sninsky JJ, et al. 2009. Evolutionary processes acting on candidate cis-regulatory regions in humans inferred from patterns of polymorphism and divergence. PLoS Genetics 5:1–17. [DOI] [PMC free article] [PubMed] [Google Scholar]
- Uricchio LH, Zaitlen NA, Ye CJ, Witte JS, and Hernandez RD. 2016. Selection and explosive growth alter genetic architecture and hamper the detection of causal rare variants. Genome Research 26:863–873. [DOI] [PMC free article] [PubMed] [Google Scholar]
- Van Der Valk T, De Manuel M, Marquez-Bonet T, and Guschanski K. 2019. Estimates of genetic load suggest extensive genetic purging in mammalian populations. bioRxiv. [Google Scholar]
- Wade EE, Kyriazis CC, Izabel Cavassim MA, and Lohmueller KE. 2023. Quantifying the fraction of new mutations that are recessive lethal. Evolution In press. [DOI] [PMC free article] [PubMed] [Google Scholar]
- Xie HX, Liang XX, Chen ZQ, Li WM, Mi CR, Li M, Wu ZJ, et al. 2022. Ancient Demographics Determine the Effectiveness of Genetic Purging in Endangered Lizards. Molecular Biology and Evolution 39:1–14. [DOI] [PMC free article] [PubMed] [Google Scholar]
References Cited Only in the Online Enhancements
- Boyle EA, Li YI, and Pritchard JK. 2017. An Expanded View of Complex Traits: From Polygenic to Omnigenic. Cell 169:1177–1186. [DOI] [PMC free article] [PubMed] [Google Scholar]
- Clark DW, and et al. 2019. Associations of autozygosity with a broad range of human phenotypes. Nature communications 10:1–17. [DOI] [PMC free article] [PubMed] [Google Scholar]
- Corbett-Detig RB, Hartl DL, and Sackton TB. 2015. Natural Selection Constrains Neutral Diversity across A Wide Range of Species. PLoS Biology 13:1–25. [DOI] [PMC free article] [PubMed] [Google Scholar]
- Deng HW, and Lynch M. 1996. Estimation of deleterious-mutation parameters in natural populations. Genetics 144:349–360. [DOI] [PMC free article] [PubMed] [Google Scholar]
- Duchen P, Živković D, Hutter S, Stephan W, and Laurent S. 2013. Demographic inference reveals african and european admixture in the north american drosophila melanogaster population. Genetics 193:291–301. [DOI] [PMC free article] [PubMed] [Google Scholar]
- Foote AD, Hooper R, Alexander A, Baird RW, Baker CS, Ballance L, Barlow J, et al. 2021. Runs of homozygosity in killer whale genomes provide a global record of demographic histories. Molecular Ecology 30:6162–6177. [DOI] [PubMed] [Google Scholar]
- Gaillard J-M 2007. Are Moose Only a Large Deer?: Some Life History Considerations. Alces 43:1–12. [Google Scholar]
- Haag-Liautard C, Dorris M, Maside X, Macaskill S, Halligan DL, Charlesworth B, and Keightley PD. 2007. Direct estimation of per nucleotide and genomic deleterious mutation rates in Drosophila. Nature 445:82–85. [DOI] [PubMed] [Google Scholar]
- Husband BC, and Schemske DW. 1996. Evolution of the Magnitude and Timing of Inbreeding Depression in Plants. Evolution 50:54–70. [DOI] [PubMed] [Google Scholar]
- Kalinowski ST, and Hedrick PW. 1999. Detecting inbreeding depression is difficult in captive endangered species. Animal Conservation 2:131–136. [Google Scholar]
- Keller LF 1998. Inbreeding and its fitness effects in an insular population of song sparrows (Melospiza melodia). Evolution 52:240–250. [DOI] [PubMed] [Google Scholar]
- Laure S, and Wyman MJ. 2014. Determinants of Mutation Rate Variation in the Human Germline 1–24. [DOI] [PubMed] [Google Scholar]
- Lawrie DS, Messer PW, Hershberg R, and Petrov DA. 2013. Strong Purifying Selection at Synonymous Sites in D. melanogaster. PLoS Genetics 9:33–40. [DOI] [PMC free article] [PubMed] [Google Scholar]
- Lebeuf-Taylor E, McCloskey N, Bailey SF, Hinz A, and Kassen R. 2019. The distribution of fitness effects among synonymous mutations in a gene under directional selection. eLife 8:1–16. [DOI] [PMC free article] [PubMed] [Google Scholar]
- Liu Y, Sun X, Driscoll C, Smith JLD, Brien SJO, Luo S, Liu Y, et al. 2018. Genome-Wide Evolutionary Analysis of Natural History and Adaptation in the World’s Tigers. Current Biology 28:3840–3849.e6. [DOI] [PubMed] [Google Scholar]
- Lynch M, Blanchard J, Houle D, Kibota T, Schultz S, Vassilieva L, and Willis J. 1999. Perspective: Spontaneous deleterious mutation. Evolution 53:645–663. [DOI] [PubMed] [Google Scholar]
- Lynch M, Conery IJ, and Burger R. 1995. Mutation accumulation and the extinction of small populations. The American Naturalist 146:489–518. [Google Scholar]
- Peterson RO, Thomas NJ, Thurber JM, Vucetich JA, and Waite TA. 1998. Population Limitation and the Wolves of Isle Royale. Journal of Mammalogy. [Google Scholar]
- Pickrell JK, Berisa T, Liu JZ, Ségurel L, Tung JY, and Hinds DA. 2016. Detection and interpretation of shared genetic influences on 42 human traits. Nature Genetics 48:709–717. [DOI] [PMC free article] [PubMed] [Google Scholar]
- Ragsdale AP, Moreau C, and Gravel S. 2018. Genomic inference using diffusion models and the allele frequency spectrum. Current Opinion in Genetics and Development 53:140–147. [DOI] [PubMed] [Google Scholar]
- Sheehan S, and Song YS. 2016. Deep Learning for Population Genetic Inference. PLoS Computational Biology 12:1–28. [DOI] [PMC free article] [PubMed] [Google Scholar]
- Siepel A, Bejerano G, Pedersen JS, Hinrichs AS, Hou M, Rosenbloom K, Clawson H, et al. 2005. Evolutionarily conserved elements in vertebrate, insect, worm, and yeast genomes. Genome Research 15:1034–1050. [DOI] [PMC free article] [PubMed] [Google Scholar]
- Taylor BL, Chivers SJ, Larese J, and Perrin WF. 2007. Generation length and percent mature estimates for IUCN assessments of cetaceans. Administrative Report LJ-07–01 National Marine Fisheries. [Google Scholar]
- Tennessen JA, Bigham AW, O’Connor TD, Fu W, Kenny EE, Gravel S, McGee S, et al. 2012. Evolution and Functional Impact of Rare Coding Variation from Deep Sequencing of Human Exomes. Science (New York, NY) 337:64–69. [DOI] [PMC free article] [PubMed] [Google Scholar]
Associated Data
This section collects any data citations, data availability statements, or supplementary materials included in this article.
Supplementary Materials
Data Availability Statement
All simulation and plotting scripts are available at https://github.com/ckyriazis/simulations_review and have been archived in a Zenodo repository (DOI: 10.5281/zenodo.7925628).