

Summary
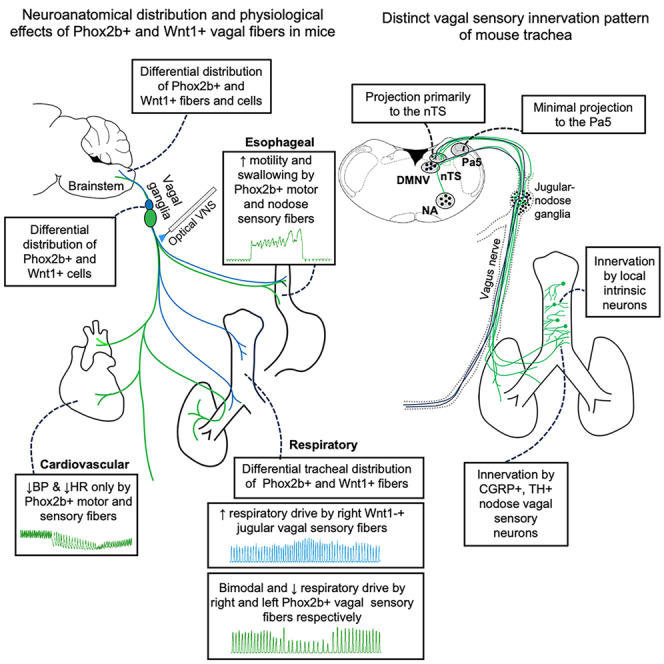
In rats and guinea pigs, sensory innervation of the airways is derived largely from the vagus nerve, with the extrapulmonary airways innervated by Wnt1+ jugular neurons and the intrapulmonary airways and lungs by Phox2b+ nodose neurons; however, our knowledge of airway innervation in mice is limited. We used genetically targeted expression of enhanced yellow fluorescent protein-channelrhodopsin-2 (EYFP-ChR2) in Wnt1+ or Phox2b+ tissues to characterize jugular and nodose-mediated physiological responses and airway innervation in mice. With optical stimulation, Phox2b+ vagal fibers modulated cardiorespiratory function in a frequency-dependent manner while right Wnt1+ vagal fibers induced a small increase in respiratory rate. Mouse tracheae contained sparse Phox2b-EYFP fibers but dense networks of Wnt1-EYFP fibers. Retrograde tracing from the airways showed limited tracheal innervation by the jugular sensory neurons, distinct from other species. These differences in physiology and vagal sensory distribution have important implications when using mice for studying airway neurobiology.
Subject areas: Sensory neuroscience, Techniques in neuroscience
Graphical abstract
Highlights
-
•
Right Phox2b+ vagal fibers mediate biphasic respiratory responses
-
•
Wnt1+ vagal fibers only on right side increased respiratory drive
-
•
Mouse trachea has dense networks of Wnt1+ nerve fibers and plexuses
-
•
Vagal sensory fibers innervating mouse trachea are primarily nodose in origin
Sensory neuroscience; Techniques in neuroscience
Introduction
The airways are innervated by a rich supply of sensory nerve fibers which mostly originate from neurons in the nodose and jugular vagal sensory ganglia, with a smaller contribution from the spinal dorsal root ganglia (DRG). The terminal fields of these airway sensory neurons are specialized to detect either physiological or noxious stimuli in the form of mechanical distortion of the airways or chemicals produced locally or entering the airways via inhalation or aspiration.1,2 Nodose and jugular vagal sensory neurons arise from different embryological cell lineages.3 The paired-like homeodomain transcription factor, Phox2a, and its downstream partner, Phox2b, are instrumental early in the formation of the nodose vagal ganglia and vagal preganglionic hindbrain motor neurons.4 By contrast, pathways involving Wnt1 signaling and neural crest specialization contribute to the development and survival of the jugular vagal ganglia sensory neurons5,6 and all the peripheral glial cells supporting function in the vagi.7 Consequently, mature jugular sensory neurons resemble more closely the neurons of the DRG than those of the nodose ganglia.3,8
Mice are increasingly used as animal models to study respiratory physiology and pathophysiology with the advantage of targeted manipulation experiments in transgenic mouse lines. However, most of the existing knowledge on airway innervation and reflex physiology is derived from studies in other species, such as dogs, cats, guinea pigs, and rats.9,10,11,12,13,14,15 Although electrophysiology and transcriptome profiling studies have characterized airway and general vagal sensory neurons in mice,8,16,17 fewer studies have assessed the physiology of airway neural circuitry. Efforts to characterize the innervation of the airways in mice using either viral tracing or transgenic mouse lines are relatively recent and incomplete.18,19,20 This is an important gap in knowledge as strengths and limitations of using mice as a model for studying airway neurobiology are not entirely clear.
Our prior work in guinea pigs and rats has shown that the smaller airways and the lung parenchyma are primarily innervated by the nodose vagal sensory neurons, which project to the nucleus of the solitary tract (nTS) in the brainstem and subsequently relay to the viscerosensory circuits in the brain known to regulate a broad range of autonomic functions and associated behaviors. In contrast, the large, extrapulmonary airways (including the larynx, trachea, and mainstem bronchi) are primarily innervated by the jugular vagal sensory neurons. These airway-innervating jugular vagal sensory neurons do not terminate centrally in the nTS but rather project to the paratrigeminal nucleus (Pa5), part of the interstitial system of the spinal trigeminal tract, and subsequent projections ascend the neuraxis to the classic somatosensory processing areas in the higher brain.9,11,21,22 These jugular pathways are especially important for coughing and other respiratory reflexes,23 although their existence is often neglected in favor for studying the more common nodose circuits. Importantly, our functional brain imaging studies suggest humans also possess these differentially organized nodose and jugular airway vagal circuits,21 although whether they similarly exist in mice is questionable based on recent data.19
In the current study, we set out to further investigate the functional arrangement of nodose and jugular vagal sensory innervation of the mouse airways. We assessed respiratory responses and other physiological measures evoked by selective optical stimulation of the jugular or nodose vagal sensory pathways in transgenic mice expressing the functional light-sensitive channelrhodopsin-2 (ChR2) in Phox2b+ or Wnt1+ vagal neurons. The findings from these physiological studies then led us to subsequently investigate and characterize in detail the innervation patterns of the mouse trachea using transgenic reporter expression studies, conditional and conventional retrograde viral tracing and tissue clearing approaches.
Results
Characterization of physiological responses evoked by electrical vagus nerve stimulation (VNS) in anesthetized mice
We first crossed Wnt1-Cre or Phox2b-Cre mice with homozygous floxed ChR2(H134R)-EYFP mice expressing Cre-dependent ChR2-enhanced yellow fluorescent protein (EYFP) allele (Figure 1A), to produce “transgene positive” mice expressing ChR2-EYFP in Phox2b-derived vagal motor and nodose sensory neurons or Wnt1-derived vagal jugular sensory neurons. Transgene positive mice are referred to herein as Phox2b-Cre;loxP-ChR2 and Wnt1-Cre;loxP-ChR2 mice, respectively while transgene negative mice are referred to as loxP-ChR2 and represent littermates from Phox2b and Wnt1 breeding lines.
Figure 1.

Effect of left and right electrical vagus nerve stimulation (VNS) on cardiorespiratory function in anesthetized mice
(A) Schematic diagram of the breeding strategy of Wnt1-Cre;loxP-ChR2 and Phox2b-Cre;loxP-ChR2 mouse lines.
(B) Schematic diagram of physiological recording with electrical VNS.
(C) Example tracings of blood pressure (upper) and diaphragm EMG (lower) recordings with right electrical VNS (black bar labeled “Electrical VNS on”) at 20 Hz. Accompanying mean ± SD physiological response data showing right (open symbol and dashed line) and left (filled symbol and solid line) electrical VNS train frequency-dependent changes in (D) heart rate, (E) blood pressure, (F) respiratory rate, and (G) minute-dEMG. D′, D″, E′, E″, F′, F″, G′, and G″ show Emax and EF50 values for heart rate, blood pressure, respiratory rate and minute-dEMG respectively. n = 8 and 1 respectively for Phox2b-Cre;loxP-ChR2 and Wnt1-Cre;loxP-ChR2 mice. n = 5 and 4 respectively for right and left electrical VNS. Abbreviations: BP, blood pressure; dEMG, diaphragmatic electromyography; DMNV, dorsal motor nucleus of vagus; EF50, the stimulation frequency that produced effect in 50% of animals; Emax, the stimulation frequency that produced a maximum effect; eVNS, electrical vagus nerve stimulation; GIT, gastrointestinal tract; NA, nucleus ambiguus; nTS, nucleus of the solitary tract; Pa5, paratrigeminal nucleus.
We next characterized the physiological effects induced by electrical VNS in isoflurane-anaesthetized mice in which carotid arterial pressure, diaphragm electromyography (dEMG), and intraluminal esophageal pressure were recorded (Figure 1B). Electrical VNS of the right and left cervical vagus nerves induced a progressive frequency-dependent reduction in heart rate, blood pressure, respiratory rate and minute-dEMG from the respective baseline levels with mean EF50 values of 30.6, 16.1, 13.3, and 12.3 Hz, for the right electrical VNS and 33.3, 25.5, 10.8, and 14.8 Hz for the left electrical VNS, respectively. Notably, respiratory rate responses evoked by either right or left electrical VNS at low frequencies (1–10 Hz) were quite variable with individual animal responses ranging from increases, decreases or no effect in respiratory rate, in contrast to more consistent reductions in respiratory rate evoked at other electrical VNS frequencies employed (20–50 Hz) (Figures 1C–1G). Electrical VNS of both right and left vagus nerves also induced a dramatic increase in esophageal pressure with a maximum response at 20 Hz stimulation (data not shown).
Characterization of optical VNS-evoked physiological responses in anesthetized mice
The baseline values of examined physiological parameters prior to optical VNS (Table 1) did not differ between experimental groups. Optical VNS (either left or right; Figure 2A) in transgene-negative loxP-ChR2 littermate mice in vivo did not induce any measurable physiological responses, nor did stimuli at light intensities less than 21 mWmm−2 in transgene-positive mice. This confirmed the dependency of the optically evoked physiological responses (described in the following) on the transgenic expression of functional ChR2.
Table 1.
Baseline physiological status of the experimental groups prior to left or right optical vagus nerve stimulation (VNS)
| Experimental Groups | N | Measured physiological parameters at baseline (mean ± SD) |
|||
|---|---|---|---|---|---|
| HR (bpm) | BP (mmHg) | RR (bpm) | EP (mmHg) | ||
| Phox2b-Cre;loxP-ChR2 Right VNS | 6 | 441.0 ± 68.3 | 76.0 ± 10.7 | 121.5 ± 47.1 | 0.5 ± 0.1 |
| Phox2b-Cre;loxP-ChR2 Left VNS | 10 | 461.1 ± 81.0 | 74.4 ± 18.3 | 101.1 ± 25.02 | 0.4 ± 0.5 |
| loxP-ChR2 (Phox2b-Cre line) | 6 | 461.5 ± 34.2 | 73.6 ± 5.0 | 120.0 ± 24.8 | 0.6 ± 0.5 |
| Wnt1-Cre;loxP-ChR2 Right VNS | 7 | 457.3 ± 50.8 | 68.2 ± 8.7 | 107.1 ± 27.3 | 0.4 ± 0.3 |
| Wnt1-Cre;loxP-ChR2 Left VNS | 9 | 427.7 ± 61.0 | 62.7 ± 8.4 | 90.3 ± 25.2 | 0.5 ± 0.3 |
| loxP-ChR2 (Wnt1-Cre line) | 6 | 435.5 ± 33.4 | 70.4 ± 7.0 | 102.5 ± 28.1 | 0.4 ± 0.3 |
BP, blood pressure; EP, esophageal pressure; HR (bpm), heart rate (beats per minute); RR (bpm), respiratory rate (breaths per minute).
Figure 2.

Differential sensorimotor effects evoked by left and right optical vagus nerve stimulation (VNS) in Phox2b-Cre;loxP-ChR2 and Wnt1-Cre;loxP-ChR2 mice
(A) Schematic diagram of physiological recording with optogenetic VNS.
(B) Example tracings of blood pressure (upper), diaphragm EMG (middle), and esophageal pressure (lower) recordings with optical VNS (blue bar labeled “Laser on”) at 20 Hz of (i, iii) left and (ii, iv) right vagal fibers in Phox2b-Cre;loxP-ChR2 (green) and Wnt1-Cre;loxP-ChR2 (blue) mice. Accompanying mean ± SD data optical pulse train frequency-dependent changes in (C and G) heart rate, (D and H) blood pressure, (E and I) esophageal pressure and (F and J) respiratory rate are shown in the green and blue stimulus-response curve plots. n = 10 and 6 respectively for left (light green symbol and solid line) and right (dark green symbol and dash line) Phox2b-Cre;loxPChR2 and n = 6 for loxP-ChR2 (open symbol and dotted black line). n = 9 and 7 respectively for left (light blue symbol and solid line) and right (dark blue symbol and dash line) Wnt1-Cre;loxP-ChR2 and 6 for loxP-ChR2 (open symbol and dotted black line). ∗p < 0.05; ∗∗p < 0.01; ∗∗∗p < 0.001; #p = 0.05–0.08 for comparison of left and right optical VNS groups against loxP-ChR2 (Dunnett’s post hoc tests). Abbreviations: BP, blood pressure; dEMG, diaphragmatic electromyography; DMNV, dorsal motor nucleus of vagus; EMG, electromyography; EP, esophageal pressure; GIT, gastrointestinal tract; NA, nucleus ambiguus; nTS, nucleus of the solitary tract; Pa5, paratrigeminal nucleus.
Cardiovascular responses
In Phox2b-Cre;loxP-ChR2 mice, optical VNS of either left or right intact vagus nerve reduced blood pressure and heart rate, dependent on both optical intensity (5–31 mWmm−2, power-response data not shown) and optical pulse train frequency (Figures 2B–2D). At the maximum stimulation intensity examined (31 mWmm−2), the hypotensive effect was evoked at optical pulse train frequencies ranging from 5 to 100 Hz, with an inverted U-shaped frequency response curve and peak responses occurring at 20–30 Hz. Similarly, a bradycardic effect was evident at optical pulse train frequencies from 5 to 60 Hz with peak responses occurring at 20–30 Hz (Figures 2Bi, 2Bii, 2C, and 2D).
To tease apart the physiological effects mediated by Phox2b+ sensory and motor fibers, we performed unilateral vagotomy and repeated the optical VNS. Post-vagotomy optical VNS of the distal vagal stump at 30 and 60 Hz produced a reduction in blood pressure and heart rate comparable to that evoked by optical VNS of the intact nerve (Figures S1A and S1B). By contrast, optical VNS of the proximal stump of the vagus nerve at 30 and 60 Hz induced a reduction in blood pressure and heart rate that was significantly smaller in magnitude compared to that evoked by distal stump or intact nerve stimulation. In general, there were no significant differences in response magnitude evoked by left and right vagus nerves, despite a trend toward more robust response with the left optical VNS.
We next examined differential influence of vagal preganglionic motor and sensory fibers on optical VNS-induced cardiovascular responses by blocking peripheral muscarinic M2 receptors on the heart. Systemic administration of the selective M2 receptor antagonist methoctramine (0.5 mg/kg, i.p.) abolished the bradycardia evoked by optical VNS (at 30 and 60 Hz, intact nerve), but only partially inhibited the accompanying hypotension. After vagotomy, systemic methoctramine completely blocked both bradycardia and hypotension induced by optical VNS of the distal vagal stump but only partially blocked the hypotensive effect of proximal vagal stump stimulation (Figures S2A–S2D). These findings suggest that optical VNS in Phox2b-Cre;loxP-ChR2 mice induces bradycardia predominantly due to recruitment of preganglionic parasympathetic motor fibers and a fall in systemic blood pressure due to both direct parasympathetic motor fiber activation and reflexively via nodose sensory fiber activation leading to altered sympathetic outflow.
In Wnt1-Cre;loxP-ChR2 mice, optical VNS of the left or right vagus nerve induced small changes in blood pressure but did not alter heart rate at any stimulus intensity or optical pulse train frequency tested (Figures 2B [iii and iv], 2G, and 2H). Stimulation of the left distal and proximal stumps of the vagus nerve after unilateral vagotomy also did not induce any significant change in measured cardiovascular parameters (Figures S3A and S3B). These data indicate that vagally mediated cardiovascular effects are predominately regulated by Phox2b+ vagal sensory and motor fibers.
We also examined changes in esophageal motility with optical VNS in both mouse lines. Optical VNS of either the left or right cervical vagus nerves in Phox2b-Cre;loxP-ChR2 mice at optical pulse train frequencies of 5 Hz and above induced a rapid and tonic increase in esophageal pressure along with swallowing movements (Figure S1H, swallowing data not shown). No effect of optical VNS on the esophageal motility was observed in Wnt1-Cre;loxP-ChR2 mice (Figure S3H). Thus, the esophageal motility is mediated primarily by Phox2b+ vagal fibers, not Wnt1+ vagal fibers.
Respiratory changes
In Phox2b-Cre;loxP-ChR2 mice, optical VNS produced changes in breathing that were dependent on optical intensity (5–31 mWmm−2, power-response data not shown), optical pulse train frequency and additionally the side (left versus right) of stimulation. Optical VNS of the left vagus nerve (20 Hz and above 31 mWmm−2) predominantly decreased respiratory rate, occasionally culminating in apnea at optimal optical pulse train frequencies (typically 30 Hz) (Figures 2Bi and 2E). Respiratory slowing was accompanied by a decrease in the amplitude of dEMG and overall ventilation (minute-dEMG) (Figures 2F and S1G). By contrast, optical VNS of the right vagus nerve at 5 and 10 Hz induced a significant increase in respiratory rate and minute dEMG without any change in the dEMG amplitude. This tachypnea response reverted to a significant reduction in respiratory rate accompanied by a significant increase in the dEMG amplitude at optical pulse train frequencies of 40 Hz and above (Figures 2Bii, 2E, 2F, and S1G).
After unilateral vagotomy, optical VNS of the left or right distal vagus nerve stumps at 10, 30, and 60 Hz failed to significantly change respiratory rate or dEMG amplitude. Stimulation of left proximal vagus nerve stump induced a reduction in respiratory rate and minute dEMG leading to apnea, recapitulating the responses observed with the intact left vagus nerve (Figures S1D–S1F). Stimulation of right proximal vagus nerve stump induced a tachypnea at lower optical pulse train frequencies and a small, but statistically insignificant, reduction in respiratory rate at higher optical pulse train frequencies, resembling the bimodal pattern seen with intact nerve stimulation. However, no accompanying increase in dEMG amplitude was observed.
In Wnt1-Cre;loxP-ChR2 mice, optical VNS similarly produced changes in breathing that were dependent on optical intensity (5–31 mWmm−2, power-response data not shown), optical pulse train frequency and the stimulation side (left versus right). Notably, optical VNS of the left intact vagus nerve did not induce any change in respiratory rate, dEMG amplitude or minute dEMG at any stimulus intensity or optical pulse train frequency tested. However, optical VNS of the right vagus at 1–50 Hz induced a small but significant increase in respiratory rate (Figures 2Biii, iv and 2I) and dEMG amplitude and a similar trend in the minute dEMG (Figures 2J and S3G). After unilateral vagotomy, optical VNS of the left or right distal vagus nerve stumps at 30 and 60 Hz failed to alter breathing. Stimulation of left and right proximal vagus nerve stumps at 30 Hz induced variable increases in respiratory rate, dEMG amplitude, and minute dEMG, largely recapitulating the findings of intact nerve optical VNS (Figures S3D–S3F).
The superior laryngeal nerve (SLN) carries many jugular vagal fibers of neural crest origin but originates from the vagus proximal to the level of our optical VNS and as such our cervical optical VNS may underrepresent the potential for neural crest-derived vagal fibers to modify respiratory and autonomic responses. We therefore next examined the effects of direct optical stimulation of the SLN in Wnt1-Cre;loxP-ChR2 mice (n = 2 each for left and right stimulation). The evoked responses were largely consistent with the findings from cervical VNS. Right SLN stimulation induced a more robust increase in respiratory rate and dEMG amplitude, sometimes accompanied by an increase in the blood pressure (Figure S4A) whereas the left SLN stimulation induced only a small increase in respiratory rate without any significant change in the blood pressure or dEMG amplitude (Figure S4B).
The data suggest that vagal sensory neurons solely mediate the optically evoked respiratory responses in both Phox2b-Cre;loxP-ChR2 and Wnt1-Cre;loxP-ChR2 animals. Optical VNS of the distal vagus nerve stump following unilateral vagotomy failed to modify breathing, while proximal vagus nerve stump stimulation mimicked the responses evoked by intact nerve stimulation. The data also suggest bimodal respiratory reflex effects mediated by nodose sensory neurons dependent of optical pulse train frequency and a degree of asymmetrical organization in both nodose and jugular vagal sensory neural circuits regulating breathing in mice.
Ex vivo characterization of fiber types recruited by optical VNS
We confirmed the functionality of expressed ChR2 in vagal fibers and recruitment of fiber types by performing electrophysiological recordings of vagal compound action potentials ex vivo during focal vagal optical stimulation. ChR2-EYFP expression was observed in the vagal axons from both Phox2b-Cre;loxP-ChR2 and Wnt1-Cre;loxP-ChR2 mice (Figures 3A and 3B), while Wnt1-EYFP appeared to be more abundant given expression of Wnt1 in satellite glial cells (see next section). Repeated single optical pulses (1 Hz) at 473 nm applied to the vagi harvested from either Phox2b-Cre;loxP-ChR2 (Figure 3C) or Wnt1-Cre;loxP-ChR2 (Figure 3D) mice reliably induced compound action potentials when the stimulus intensity was 21 mWmm−2 or higher and pulse durations were greater than 0.25 ms. The conduction velocity of optically recruited vagal fibers ranged from less than 0.2 to 4.7 ms−1 in Phox2b-Cre;loxP-ChR2 mice (n = 10 recordings from 5 animals) and from less than 0.2 up to 2.2 ms−1 from Wnt1-Cre;loxP-ChR2 mice (n = 8 recordings from 4 animals). No notable differences were observed between left and right vagi from any animal. The same stimulation protocol failed to evoke any responses in vagi harvested from loxP-ChR2 animals (n = 4 recordings from 2 animals; Figures 3E and 3F). By comparison, electrical stimulation reliably evoked compound potentials in the vagi from all animals at intensities of 0.5 V (the lowest examined) and above and pulse durations as low as 0.1 ms. Electrical stimulation-evoked conduction velocities occasionally reached up to 15 ms−1 (Figures 3G and 3H). Cutting the nerve between the recording and stimulating electrodes abolished all waveforms in the compound actional potential recordings. Given the reported conduction velocities of fiber populations in the mouse vagus nerve,17 we conclude that optical stimulation recruits a range of faster-conducting myelinated (A- and B-fibers) and slow-conducting unmyelinated (C-fibers) vagal fibers in Phox2b-Cre;loxP-ChR2 mice and mainly slower-conducting unmyelinated vagal C-fibers in Wnt1-Cre;loxP-ChR2 mice. These fiber types would include most of the vagal sensory and motor neurons that have been functionally described, perhaps with exception of the very fast (>15 ms−1) conducting Aδ-fibers which were apparent only in the recordings of electrically evoked compound potentials.
Figure 3.

Optical recruitment of different fiber types in ex vivo vagus nerve
EYFP-ChR2 expression the axons of the vagus nerve from (A) Phox2b-Cre;loxPChR2 and (B) Wnt1-Cre;loxP-ChR2 mice. Representative compound actional potentials induced by ex vivo optical stimulation of vagi harvested from (C) Phox2b-Cre;loxP-ChR2 and (D) Wnt1-Cre;loxP-ChR2 mice. Representative compound actional potential trace during ex vivo optical stimulation of vagi harvested from (E) Phox2b transgene-negative and (F) Wnt1 transgene-negative loxP-ChR2 mice. Representative compound actional potentials induced by electrical stimulation of vagi harvested from (G) Phox2b-Cre;loxP-ChR2 and (H) Wnt1-Cre;loxP-ChR2 mice. G′ and H′ show the magnified compound action potential from the dotted box areas in G and H respectively. Scale bars represent 100 μm in (A and B). ChR2, channelrhodopsin-2; EYFP, enhanced yellow fluorescent protein.
Characterization of the distribution of Wnt1-EYFP and Phox2b-EYFP in the vagal ganglia and the brainstem
Imaging of histological sections of the vagal ganglia confirmed restricted expression of EYFP in neurons in the nodose (caudal) portion of the ganglia in Phox2b-Cre;loxP-ChR2 mice (Figure 4A) and in neurons in the jugular (rostral) portion in Wnt1-Cre;loxP-ChR2 mice (Figure 4B), consistent with previously reported different embryological origins of the nodose and jugular sensory neurons respectively. Satellite glial cells, identified with glutamine synthetase expression, in both nodose and jugular ganglia also expressed EYFP in Wnt1-Cre;loxP-ChR2 mice, but not in Phox2b-Cre;loxP-ChR2 mice, consistent with peripheral glial cells arising from the same developmental lineage as the jugular sensory neurons.7 Consequently, almost all neurons in both nodose and jugular ganglia had association with EYFP in Wnt1-Cre;loxP-ChR2 mice (Figure 4B).
Figure 4.

Transgenic expression of EYFP in the vagal ganglia and the brainstem of Phox2b-Cre;loxP-ChR2 and Wnt1-Cre;loxP-ChR2 mice
(A–D) Differential EYFP-ChR2 expression in the jugular and nodose portions of the vagal ganglia and colocalization with the pan neuronal marker PGP9.5, the satellite glial cell marker GS, CGRP, and TH in (A and B). (C and D) Representative examples of expression of CGRP and TH in optically cleared vagal ganglia and (E and F) quantitative relative abundance of each.
(G and H) Differential EYFP-ChR2 expression at rostrocaudal levels of the medulla. Numbers on the right lower corners indicate the nearest bregma levels. Lower panels in (G and H) show magnified views of the white rectangles delineated in the respective upper panels. Scale bars represent 100 μm in (A, B, and C), 200 μm in (D), and 500 μm in (G and H). Abbreviations: 7N, facial nucleus; AP, area postrema; CGRP, calcitonin gene related peptide; ChR2, channelrhodopsin-2; Cu, cuneate nucleus; DMV, dorsal motor nucleus of vagus; EYFP, enhanced yellow fluorescent protein; GS, glutamine synthetase; NA, nucleus ambiguus; nTS, nucleus of the solitary tract; Pa5, paratrigeminal nucleus; PGP9.5, protein gene-product 9.5; TH, tyrosine hydroxylase.
In Phox2b-Cre;loxP-ChR2 vagal ganglia, EYFP was expressed only in 5.7% of calcitonin gene related peptide (CGRP)-positive neurons (n = 4 different ganglia from 4 different animals; total number of CGRP-positive cells = 1755; Figures 4C and 4E). In contrast, in Wnt1-Cre;loxP-ChR2 vagal ganglia, EYFP was detected in 99.1% of CGRP positive cells (n = 4 ganglia; total number of CGRP-positive cells = 1717; Figures 4D and 4F). Phox2b-EYFP was detected in 59.2% of tyrosine hydroxylase (TH)-positive neurons in in Phox2b-Cre;loxP-ChR2 vagal ganglia whereas Wnt1-EYFP was observed to be associated with TH expression in 96.2% of cells in Wnt1-Cre;loxP-ChR2 vagal ganglia (Figures 4C–4F).
In the medulla, EYFP expression was present in the dorsal motor nucleus of vagus (DMNV) and the nucleus ambiguus (NA) of Phox2b-Cre;loxP-ChR2 mice only (Figures 4G and S5A). Nerve fibers and cells expressing EYFP were seen in the nTS, the adjacent area postrema (AP) and the rostral trigeminal system areas in Phox2b-Cre;loxP-ChR2 mice (Figure 4G) and in the Pa5 and the caudal dorsolateral trigeminal system areas in Wnt1-Cre;loxP-ChR2 mice (Figures 4H and S5B), consistent with the known projections of nodose and jugular sensory neurons, respectively.24 In Phox2b-Cre;loxP-ChR2 mice EYFP expression was also observed in the cuneate nucleus, the facial nucleus (7N) and surrounding ventral spinocerebellar tract and cerebellar nuclei such as interposed cerebellar nucleus and vestibulocerebellar nucleus (Figures 4G and S5A). In Wnt1-Cre;loxP-ChR2 mice, robust EYFP expression was observed in the AP and throughout the cerebellar layers (Figure 4H).
Characterization of the neural innervation in the mouse trachea
Phox2b-EYFP fibers
Next, whole-mount immunohistochemical examination was performed to identify the innervation patterns of the trachea. The tracheae of Phox2b-Cre;loxP-ChR2 mice were observed to contain large and thick bundles of EYFP fibers on the adventitial surface over the trachealis muscle at the posterior midline (Figures 5A–5C). However, a limited number of thin, fine Phox2b-EYFP fibers were observed on the mucosal side with some present over the tracheal cartilage (Figure 5D; white arrow). Mucosal Phox2b-EYFP fibers were negative for CGRP, TH and substance P although some of these mucosal Phox2b-EYFP were in close spatial relationship with CGRP- and substance P-expressing fibers. A few adventitial Phox2b-EYFP fibers at the posterior midline co-stained with choline acetyltransferase (ChAT, white arrow, Figures 5D–5G) and occasionally Phox2b-EYFP-expressing tracheal ganglia neurons were observed (Figure 5G). These findings suggest that the small number of mucosal Phox2b-EYFP fibers in mouse trachea is likely derived from the vagal sensory neurons while the adventitial Phox2b-EYFP fibers are primarily from the local tracheal parasympathetic neurons.
Figure 5.

Innervation pattern of tracheal EYFP fibers in Phox2b-Cre;loxP-ChR2 mice
(A) Representative image showing overall distribution of Phox2b-derived nerve fibers and bundles in the mouse trachea.
(B) A higher magnification of Phox2b-derived nerve fiber bundle on the adventitial surface. Phox2b-derived nerve fibers were (C) positive for PGP9.5 but negative for (D) CGRP, (E) TH, and (F) SP. White arrows indicate EYFP-positive fibers in close proximity to (E) TH-positive or (F) SP-positive fibers.
(G) Some of adventitial Phox2b-derived fibers were positive for ChAT (white arrows).
(H) Relationship between Phox2b-derived mucosal nerve fibers and ASMA-stained blood vessels. ASMA, alpha smooth muscle actin; CGRP, calcitonin gene related peptide; ChAT, choline acetyltransferase; EYFP, enhanced yellow fluorescent protein; PGP9.5, protein gene-product 9.5; SP, substance P; TH, tyrosine hydroxylase. Scale bars represent 100 μm in all images except in (A) where it represents 1 mm.
Wnt1-EYFP fibers
The tracheae of Wnt1-Cre;loxP-ChR2 mice were observed to contain dense networks and plexuses of Wnt1-EYFP fibers on both mucosal and adventitial surfaces from the junction of the trachea and larynx to the bronchi (Figures 6A and 6B). The density and complexity of Wnt1-EYFP fibers was in sharp contrast with and disproportionate to minimal level of evoked physiological responses of optical VNS in these mice.
Figure 6.

Innervation pattern of tracheal EYFP fibers in Wnt1-Cre;loxP-ChR2 mice
(A) Representative image showing overall distribution of Wnt1-derived nerve fibers and bundles in the mouse trachea.
(B) Wnt1-derived EYFP fibers at different z planes on a projected image. The color bar on the right indicates superficial-to-deep z planes.
(C) The majority of Wnt1-derived EYFP fibers were positive for PGP9.5 (solid filled white arrows) but some were negative for this pan-neuronal marker (open white arrows).
(D) The majority of Wnt1-derived mucosal EYFP fibers were positive for CGRP. On the adventitial surface, only select few EYFP (E) fibers and (F) intrinsic neurons (solid filled white arrows) were positive for CGRP. Open white arrow in (F) indicates an artifact in the sample. CGRP, calcitonin gene related peptide; EYFP, enhanced yellow fluorescent protein; PGP9.5, protein gene-product 9.5. Scale bars represent 100 μm for all images except in (A) where it represents 1 mm.
At the mucosal surface, Wnt1-EYFP positive fibers were observed over the tracheal cartilages. Wnt1-EYFP fibers were observed to run almost parallel to the cartilages and form networks and plexuses across different planes (Figures 6B–6D). The majority of these Wnt1-EYFP fibers were co-stained with PGP9.5, CGRP, substance P, and TH (Figures 6C–6F and 7A–7D). Some of the mucosal Wnt1-EYFP fibers had beads-on-string appearance with varicosities. Mucosal Wnt1-EYFP fibers along the tracheal cartilage were also observed to be in close spatial relationship with the blood vessels identified with alpha smooth muscle actin (ASMA) (Figure 7F).
Figure 7.

Neurochemical characterization of tracheal EYFP-ChR2 fibers in Wnt1-Cre;loxP-ChR2 mice
Mucosal (A) but not adventitial (B) Wnt1-derived EYFP-ChR2 fibers expressed TH.
(C) Many mucosal EYFP-ChR2 fibers additionally stained positive for SP.
(D) Some Wnt1-derived intrinsic ganglionic neurons on the adventitial surface expressed SP (solid filled white arrows) but some did not (open white arrow).
(E) A limited number of Wnt1-derived fibers and intrinsic neurons on the adventitial surface were positive for ChAT (solid filled white arrows).
(F) Wnt1-derived EYFP-ChR2 fibers running along ASMA-positive blood vessels. ASMA, alpha smooth muscle actin; ChAT, choline acetyltransferase; EYFP, enhanced yellow fluorescent protein; SP, substance P; TH, tyrosine hydroxylase. Scale bars represent 100 μm in all images.
On the adventitial surface, Wnt1-EYFP expression was observed in both nerve fibers and neurons and ganglia over the trachealis muscles at the posterior midline (Figures 6E, 6F, and 7E). Wnt1-EYFP fibers on the adventitial surface were observed to be both single axons and nerve bundles. The Wnt1-EYFP neurons and nerve bundles were observed to form an outer layer and the Wnt1-EYFP fibers an inner layer. Moreover Wnt1-EYFP positive ganglia were also observed. Some of these posterior midline adventitial fibers and ganglia were co-stained with ChAT, substance P and CGRP (Figures 6E, 6F, 7D, and 7E). These findings raise questions on the sources of Wnt1-EYFP fibers in the trachea as to whether they are derived extrinsically from sensory ganglia or autonomic neuron pools or intrinsically from the local neurons.
Retrograde viral tracing
To identify the sources of innervation to the mouse airways in general, we first performed retrograde viral tracing in left vagotomized and left SLN-sectioned Wnt1-Cre;loxP-ChR2 and Phox2b-Cre;loxP-ChR2 mice (Figure 8A). With the existing knowledge of airway innervation in rats and guinea pigs, we predicted the right vagal ganglia and both the nTS and the Pa5 would be labeled retrogradely in these mice.
Figure 8.

Identification and characterization of neurons retrogradely traced from the trachea and the lungs in Phox2b-Cre;loxP-ChR2 and Wnt1-Cre;loxP-ChR2 mice
(A) Schematic diagram of the experiment where the retrograde viral tracer AAV-CAG-tdTomato was injected into the trachea and lungs along with sectioning of left vagus and superior laryngeal nerves in two mouse lines. Expression of virally induced tdTomato in the trachea of (B) Phox2b-Cre;loxP-ChR2 and (C) Wnt1-Cre;loxP-ChR2 mice. Localization of virally traced tdTomato-positive neurons in the left and right optically cleared whole vagal ganglia and their quantification of (D and F) Phox2b-Cre;loxP-ChR2 and (E and G) Wnt1-Cre;loxP-ChR2 mice. Representative images of virally traced tdTomato-positive neurons in the optically cleared whole (H and I) stellate and (J and K) superior cervical ganglia of (H and J) Phox2b-Cre;loxP-ChR2 and (I and K) Wnt1-Cre;loxP-ChR2 mice. Expression of virally traced tdTomato-positive vagal terminals in the medulla in both (L) Phox2b-Cre;loxP-ChR2 and (M) Wnt1-Cre;loxP-ChR2 mice was localized to the nTS and vagal fiber tract (solid white arrows) with no expression observed in the Pa5. CGRP, calcitonin gene related peptide; ChR2, channelrhodopsin-2; DMNV, dorsal motor nucleus of vagus; EYFP, enhanced yellow fluorescent protein; nTS, nucleus of the solitary tract; Pa5, paratrigeminal nucleus; SLN, superior laryngeal nerve; VG, vagal ganglia. Scale bars represent 100 μm in (B and C), 150 or 200 μm in (D, E, H, and I), and 500 μm in (L and M).
Injection of the non-conditional retrograde viral tracer AAV-CAG-tdTomato to the trachea and lungs labeled the local tracheal parasympathetic ganglia neurons and mucosal and adventitial fibers of the trachea (Figures 8B and 8C). In both lines of mice, many of tdTomato-labeled tracheal fibers were positive for CGRP. In Wnt1-Cre;loxP-ChR2 mice, tdTomato-labeled tracheal fibers were also positive for EYFP. However, no apparent reduction in EYFP-positive fibers of the trachea was observed in either mouse line as a consequence of unilateral vagotomy. We also observed some tdTomato labeling of the smooth muscle (Figure 8B).
Consistent with our prediction, the right vagal ganglia contained tdTomato-positive neurons in both lines of mice, while retrogradely labeled neurons in the left vagal ganglia were absent or few in number, representing only 2.9% of the total neurons (12 out of 408 neurons from n = 8 ganglia) traced in both ganglia of all animals. Notably, the majority of the tdTomato-labeled vagal neurons were located in the nodose portion of the vagal ganglia in both mouse lines (Figures 8D and 8E) with a small proportion (4.9% of the total traced in both ganglia) expressing CGRP (Figures 8D–8G). Moreover, tdTomato expression was evident in some neurons of both right and left stellate ganglia (a total of 2015 neurons in n = 8 ganglia) and superior cervical ganglia (a total of 1385 neurons in n = 7 ganglia) in both mouse lines (Figures 8H–8K). No labeling of the thoracic DRG was observed. Contrary to our prediction of the brainstem termination, but consistent with the predominant labeling of nodose vagal ganglia, tdTomato-positive fibers were observed bilaterally in the caudal nTS and unilaterally in the rostral nTS, but not in the Pa5 in both mouse lines (8L and 8M). These findings suggest that the mouse trachea receives limited innervation from the jugular vagal ganglia and the dense network of Wnt1-EYFP fibers are likely derived from the local intrinsic neurons and extrinsic sympathetic ganglia.
To then examine the source of the dense networks of fibers in the trachea, which were also positive for CGRP in the mouse trachea, we next performed retrograde Cre-dependent viral tracing from the trachea of heterozygous CGRP-Cre mice (Figure 9A). In the tracheae of these mice, virally induced tdTomato expression was again observed in both nerve fibers and local intrinsic neurons (Figure 9D). We also observed several branches of nerve fibers arising from single tdTomato-labeled intrinsic tracheal neurons (Figure 9D; white arrow). Some of the tdTomato-labeled fibers were also positive for either substance P or TH (Figure 9E). In the vagal ganglia, almost all the retrogradely traced tdTomato-positive vagal sensory neurons were located in the nodose portion and 26% of these tdTomato-positive neurons (15 out of total 56 tdTomato-positive neurons) co-localized with TH (Figures 9B and 9C). In the brainstem, tdTomato-positive terminals were mainly located in the nTS and to a lesser extent around the DMNV, but none were observed in the Pa5 (Figure 9F). These findings further support that the vagal sensory innervation of mouse trachea, including the peptidergic fibers, is derived primarily from the nodose vagal ganglia, not the jugular vagal ganglia.
Figure 9.

Identification of neurons retrogradely traced in a Cre-dependent manner from the trachea in CGRP-Cre mice
(A) Schematic diagram of the experiment where the Cre-dependent retrograde viral tracer AAV-FLEX-tdTomato was injected into the trachea of CGRP-Cre mice.
(B) Representative image of optically cleared vagal ganglia showing conditionally traced tdTomato-positive neurons (which were CGRP-positive) in relation to TH-expressing neurons.
(C) Quantification of the total number of TH-expressing and conditionally traced neurons from n = 4 separate experiments.
(D and E) Representative images showing virally induced tdTomato-positive fibers and local intrinsic neurons (solid white arrow) in the trachea.
(F) Representative images showing localization of virally traced tdTomato-positive nerve terminals along with ChAT staining for neuroanatomy at different bregma levels of the medulla. Expression of tdTomato was restricted to the nTS and the vagal fiber tract (solid white arrows). In the overlay images, the tdTomato was expressed in a red pseudo color. ChAT, choline acetyltransferase; ChR2, channelrhodopsin-2; EYFP, enhanced yellow fluorescent protein. Scale bars represent 300 μm in (B), 100 μm in (D and E), and 100 μm in (F).
To investigate the jugular innervation of the trachea in further detail, we performed intratracheal injection of retrograde tracer cholera toxin B (CTB) in Phox2b-Cre;loxP-ChR2 mice (Figure 10A). Consistent with our observations in the other experiments, the majority of CTB-positive neurons retrogradely traced from the trachea were located in the nodose portion of the left and right vagal ganglia. Only a small population of CTB-positive neurons were observed in the jugular portion of the ganglion (total CTB-positive neurons = 845, nodose CTB-positive neurons = 759 (89.8%), jugular CTB-positive neurons = 86 (10.2%), n = 11 vagal ganglia) (Figures 10B and 10C). Most CTB-positive neurons expressed EYFP (675 out of 845 CTB-positive neurons, 79.9%), confirming their nodose identity (Figure 10C’). Intriguingly, some CTB positive neurons located in the nodose potion of the ganglia did not display visually detectable EYFP expression, suggesting that some jugular neurons may reside intermingled with nodose ganglia neurons, although we cannot rule out the possibility that EYFP expression in these cells was below the level of microscopy detection. Consistent with these findings in the vagal ganglia, CTB-positive fibers were observed primarily in the nTS (Figure 10D, white arrows) in all animals. A few, sparsely arranged, CTB-positive fibers were observed in the putative Pa5 region and the Sp5 areas in 5 out of 6 animals (Figure 10D, white arrow heads). CTB-positive neurons were also observed in the NA in all animals. These findings further support that the vagal sensory innervation of mouse trachea, is derived primarily from the nodose vagal sensory neurons with limited innervation by the jugular vagal sensory neurons.
Figure 10.

Identification of neurons retrogradely traced from the trachea of Phox2b-Cre;loxP-ChR2 mice
(A) Schematic diagram of the experiment where the retrograde tracer cholera toxin B (CTB) was injected into the trachea of Phox2b-Cre;loxP-ChR2 mice (n = 6).
(B) Representative images of vagal ganglia section from a Phox2b-Cre;loxP-ChR2 animal with tracheal CTB injection.
(C) Quantification of the total number of EYFP-positive or CTB-positive cells in the vagal ganglia (n = 11 vagal ganglia from n = 6 animals). (C′) Proportion of CTB-positive and EYFP-positive cells and CTB-positive and EYFP-negative cells. (C″) Proportion of CTB-positive cells in the jugular and nodose portions of the vagal ganglia.
(D) Representative images showing expression of EYFP and CTB in different bregma levels of the medulla. Numbers on the right upper corners of EYFP images indicate the nearest bregma levels. Lower panels in (D) show magnified views of the white rectangles delineated in the respective upper panels. AP, area postrema; ChR2, channelrhodopsin-2; CTB, cholera toxin B; DMV, dorsal motor nucleus of vagus; EYFP, enhanced yellow fluorescent protein; NA, nucleus ambiguus; nTS, nucleus of the solitary tract; Pa5, paratrigeminal nucleus. Scale bars represent 100 μm in (B) and 500 μm in (D).
Discussion
In this study, we initially set out to investigate the physiological responses mediated by vagal fibers of developmentally different origins using optogenetics in transgenic mouse lines and continued to characterize the innervation of the mouse trachea in detail. We showed that optical stimulation of the intact vagus nerve in Phox2b-Cre;loxP-ChR2 mice produced physiological responses that were largely indistinguishable to those evoked by mass fiber recruitment with electrical VNS. Stimulus-dependent reduction in respiratory rate was the most prevalent effect, directly mediated by Phox2b+ (nodose) sensory nerve fiber activation. In contrast, the primary physiological responses evoked by optical VNS, primarily with the right side, in Wnt1-Cre;loxP-ChR2 mice was a small increase in respiratory rate. Our follow-up neuroanatomical examination revealed that the mouse trachea contained dense networks of nerve fibers but a sparse distribution of tracheal Phox2b-EYFP fibers. Notably, the mouse trachea received limited number of extrinsic sensory nerve fibers of a neural crest origin. Instead, most of the nerve fibers present in the mouse trachea appear to be derived from intrinsic parasympathetic neurons, extrinsic neurons of the sympathetic ganglia and nodose vagal ganglia. This nerve fiber arrangement is dissimilar to those in other commonly studied species, such rats and guinea pigs, and should be carefully considered when using the mouse as a model system for studying airway neurobiology.
Differential physiological responses mediated by optical VNS
The vagal sensory neurons residing in the nodose and jugular vagal ganglia are known to have differences in their embryonic origins, arising from the epibranchial placodes (dependent on Phox2b) and neural crests (dependent on Wnt1), respectively.3 Similarly, motor fibers of the vagus arise from the bulbar neurons which, like the majority of the autonomic nervous system, depend on Phox2b for development.4 Optical VNS in our in vivo preparation revealed differential physiological effects dependent on the developmental origin of the neurons expressing ChR2.
The primary measured reflex effect evoked by optical activation of vagal sensory fibers was an altered breathing pattern. Vagal reflex regulation of breathing following optical VNS of either nodose A- or C-fibers has been previously investigated using selective genetic targeting of ChR2 to these sensory neuron types.25 However, to our knowledge, our data are the first description of stimuli that separate the respiratory effects evoked by stimulating vagal sensory fibers of placodal (nodose) and neural crest (jugular) neuronal lineages. Activation of the nodose sensory fibers induced respiratory changes similar to the effects of mass fiber recruitment by the electrical VNS. Optical VNS of nodose sensory fibers in Phox2b-Cre;loxP mice produced biphasic effects on breathing, especially with the right side, with an initial excitatory response at low optical pulse train frequencies replaced by respiratory suppression and apnea at higher stimulus frequencies. Although variable between preparations, we also noted increases in respiratory rate evoked by lower frequency electrical VNS, albeit with no significant differences between left and right nerves. Because nodose C-fiber and nodose A-fiber activation induces tachypnea and respiratory slowing, respectively,25 we surmise that our data reflect the progressive recruitment of reflexes mediated by C-fibers (pulmonary chemoreflex) followed by A-fibers (Hering-Breuer inflation reflex) as optical pulse train frequency increases. Interestingly, optically evoked respiratory responses mediated by the nodose fibers were distinguished from motor evoked autonomic responses by their lower stimulus frequency sensitivity (initiated at pulse trains of less than 10 Hz) and sustained response magnitude even at very high optical pulse train frequencies (up to 100 Hz). A bimodal response during low and high vagal B-fiber stimulation has been reported previously26 which may suggest substantially less filtering of sensory inputs arriving in the central nervous system compared to motor outputs at the level of the autonomic ganglia or effector muscles.
By contrast, optical activation of jugular sensory fibers in both the vagus nerve and the SLN of Wnt1-Cre;loxP-ChR2 mice produced a small increase in breathing rate only. We are unaware of any previous studies that have investigated jugular neuron-mediated breathing responses in mice. In guinea pigs, we previously demonstrated that a putative jugular sensory reflex arising from the larynx mediates apneic responses,11 perhaps suggesting significant differences between mouse and guinea pig physiology. Jugular fiber-mediated tachypnea was similar to that induced by nodose axon stimulation in that peak responses were seen at very low optical pulse train frequencies (<10 Hz) and presumably mediated by C-fibers. However, because the distribution of Phox2b-EYFP and Wnt1-EYFP fibers in the caudal brainstem showed minimal shared topography, it seems likely that the central organization of jugular and nodose-mediated tachypnea reflexes are not identical. This is consistent with the known differences in projection patterns of these sensory neuron types demonstrated in mice and other species, including humans.10,11,21,22,24,27
The activation of vagal motor fibers, as demonstrated in experiments with Phox2b-Cre;loxP-ChR2 mice, produced profound and largely dysregulated autonomic responses characterized by a strong cardioinhibitory effect, a precipitous fall in blood pressure and heart rate, and a large tonic increase in esophageal pressure. Cardiovascular responses were not substantially different between the left and right optical VNS. The recapitulation of these cardiovascular responses by stimulation of the distal vagal stump and inhibition of bradycardia and hypotension after pharmacological blockade M2 receptors are consistent with the effects of activating cholinergic preganglionic fibers of the vagus nerve and their recipient cholinergic neurons in the inferior pulmonary vein ganglionated plexus regulating the heart.28 In this regard, it was notable that optimal responses were evoked with optical pulse trains of 20–30 Hz, while lower and higher stimulation frequencies evoked significantly smaller effects. Cardiovascular responses (bradycardia and hypotension) were also elicited by optical stimulation of the central cut end of the vagus nerve, presumably representing reflex evoked changes in autonomic outflow. Notably, the bradycardia was small compared to that of the vagally mediated Bezold-Jarisch reflex,29 perhaps due to the vagotomy disrupting vagal B-fiber innervation to the heart or reflecting the combined effect of activating all nodose afferents, not just those mediating the bradycardia response. A rapid tonic increase in the esophageal pressure is most likely due to the bulk recruitment of striated muscles following activation of cholinergic vagal branchiomotor motor fibers.30,31,32,33 This suggests that common encoding properties for vagal motor fibers mediate diverse autonomic end organ responses.
Functional asymmetry in optical VNS-induced respiratory changes
While motor-evoked autonomic responses were largely similar between left and right optical VNS, vagal sensory-evoked responses showed clear signs of asymmetrical organization. Indeed, this asymmetry was most evident in the vagal sensory control of breathing, regardless of sensory fiber embryology. The left Phox2b+ nodose vagal fibers mediated a reduction in breathing rate only, failing to induce the tachypnea that was evident only with the optical VNS of the right Phox2b+ vagal fibers at low optical pulse train frequencies. This resulted in a demonstrable separation between the stimulus frequency-response profiles recorded for left and right nodose nerve fibers. The tachypnea evoked by optical VNS of the Wnt1+ jugular vagal fibers was similarly confined to the right nerve only but was accompanied by an increased breathing depth (i.e., rapid/deep breathing), again differentiating it from putative nodose C-fiber-evoked responses. These findings add to the growing list of literature on left and right asymmetry in vagal circuit organization.34,35 The source of this asymmetry likely reflects differences between the central terminal organization of left and right vagal sensory fibers, a suggestion supported by prior literature35 and the fact that we failed to find any notable differences in optical VNS-induced fiber type recruitment or compound action potential response profiles between left and right vagus nerves. Such left and right asymmetry in the vagal circuitry organization, if further confirmed in the humans, may be an important determinant of the behavioral outcomes associated with visceral sensory stimuli35 which could have important implications for therapeutic uses of vagal stimulation.
Innervation of the mouse trachea by the nodose vagal neurons and the local tracheal neurons
The sensory innervation of the airways has been reported to be derived mainly from the vagus nerve with some contribution from the DRG. Our previous studies in guinea pigs and rats have indicated that the upper airways, such as the larynx and trachea, are primarily innervated by the jugular vagal fibers which project to the Pa5 whereas the lower airways and lungs are primarily innervated by the nodose vagal fibers which project to the nTS.10,11 However, the findings of the current study indicate that, distinct from other species, the vagal sensory innervation of the trachea in mice was mainly from neurons located in the nodose portion of the vagal ganglia, even for CGRP-positive fibers. We saw limited contribution from neurons located in the jugular vagal ganglia and no DRG neurons were retrogradely labeled in our tracing studies (data not shown). Both in vivo physiological data and neuroanatomical data supported this conclusion. However, it was intriguing that we observed a relatively robust optical compound action potential recorded in isolated cervical vagi from Wnt1-Cre;loxP-ChR2 mice. This suggests that jugular vagal axons do not mediate appreciable cardiorespiratory effects in the in vivo preparation or that cervical vagal axons of a Wnt1 developmental origin do not arise from jugular neurons and/or do not project to the airways or other end organs investigated in this study. Indeed, retrograde tracing from the trachea in three different mouse lines (Wnt1-Cre;loxP-ChR2, Phox2b-Cre;loxP-ChR2, and CGRP-Cre mice) provided further support that the tracheal innervation had limited contribution from the jugular vagal ganglia. Consistent with this, almost all the terminals in the medulla retrogradely traced from the trachea were observed in the nTS, not in the Pa5 as would be expected if jugular neurons were labeled.10,11 This pattern of sensory innervation is distinct to that in rats and guinea pigs, and possibly humans.21 While our findings of limited jugular innervation of the mouse trachea could possibly be attributed to insufficient viral transduction efficiency for these jugular neurons, the data from our retrograde tracing with CTB in Phox2b-Cre;loxP-ChR2 mice argued against this. The majority of CTB-positive neurons retrogradely traced from the trachea were located in the nodose ganglia and their terminals primarily reside in the nTS.
The innervation of the trachea has been studied extensively in different species but only a limited number of studies have examined the mouse trachea.20,36 For instance, in dogs, dense networks and plexuses of nerve fibers as identified with PGP9.5 immunohistochemistry have been reported in different layers of the trachea.14 In guinea pig trachea, ganglionated plexuses of nerve fibers as identified with acetylcholine esterase or substance P12,37 or substance P and TH38 have been reported. Similarly in rat trachea, substance P expressing fibers with or without varicosities,13 TRPV1- and substance P-expressing fibers,15 CGRP-expressing fibers and networks39 have also been reported. Consistent with the existing findings in other species, we observed dense networks and plexuses of nerve fibers and varicosities in the mouse trachea. In fact, our observed distribution of the mucosal nerve fibers in the trachea of both Wnt1-Cre;loxP-ChR2 and Phox2b-Cre;loxP-ChR2 mice was similar to a previously reported “anterolateral segmental array” pattern of terminals virally traced with AAV-EGFP from the jugular-nodose complex in mice.20 This suggests that some of the mucosal fibers observed in these mice are most likely derived from the vagal ganglia. The majority of the nerve fiber network in the mouse trachea is derived from a developmental origin that relies on Wnt1 expression, whereas only a limited number of fibers are derived from epibranchial placode or autonomic neurons as indicated by the distribution of fibers with Wnt1-EYFP and Phox2b-EYFP expression. More importantly, many Wnt1-EYFP nerve fibers expressed CGRP, substance P and TH, an interesting finding which had not been reported previously in mice. In guinea pig trachea, substance P positive nerve plexuses have been suggested to have a similar distribution to the noradrenergic fibers.12 Moreover, in guinea pig trachea, TH- and substance P-positive fibers are known to be in close spatial relationship to the blood vessels.38 Here in mice, we observed that Wnt1-EYFP fibers are frequently both TH-positive and peptidergic, expressing both CGRP and substance P, and travel along the blood vessels. The experiments in CGRP-Cre mice showed co-expression of retrogradely labeled tdTomato and TH in the nodose vagal neurons, suggesting that some of nerve fibers expressing both TH and neuropeptides are derived from nodose neurons. The remainder may be the projections of autonomic postganglionic neurons which were traced in large numbers from the trachea.
An older study reported the presence of the ganglion neurons dorsal to the trachealis muscle on the adventitial surface in the mouse trachea.36 These have also been observed in the guinea pig and consist of cholinergic and noncholinergic parasympathetic neurons.40 In line with this, we observed ChAT-positive and ChAT-negative ganglion neurons over the adventitial surface of the trachealis muscle and confirmed that these neurons were frequently Wnt1-EYFP expressing. By contrast, relatively few Phox2b-EYFP neuron cell bodies were identified in the adventitial tracheal plexus.
Our data from retrograde viral tracing in CGRP-Cre mice and retrograde viral tracing with vagotomy and SLN sectioning in Wnt1-Cre;loxP-ChR2 and Phox2b-Cre;loxP-ChR2 mice indicate that the nerve fiber networks of the mouse trachea are partly derived from the local intrinsic neurons inside the trachea. However, there was a mismatch between the number of retrogradely traced neurons and the extent of Wnt1-EYFP fiber networks observed. Given our observation of several labeled branches arising from individual retrogradely traced neurons, it remains possible that a small number of parasympathetic neurons give rise to a large number of tracheal fibers, generating the complex neural network seen. Moreover, repeated branching of the axons of the vagal sensory neurons, as reported previously,20 may also contribute to the extent of fiber network observed in this study. The total number of local intrinsic neurons that could be retrogradely traced would also have been influenced by the efficiency of the virus or the nature of the injection procedure.
In conclusion, using the transgenic mouse lines with restricted expression of ChR2-EYFP in Phox2b+ or Wnt1+ tissues, we showed activation of Phox2b+ vagal fibers could induce a range of cardiorespiratory responses similar to electrical VNS whereas activation of right Wnt1+ vagal fibers can induce a small increase in the respiratory drive. More importantly, the mouse trachea receives limited jugular vagal sensory fibers and some nodose vagal sensory fibers, rather different from other species such as rats and guinea pigs. Careful consideration should be exercised when using mice as a model for neurobiological investigations.
Limitations of the study
In this study, we used isoflurane anesthesia for our in vivo physiological experiments with electrical or optical VNS and it may be possible that isoflurane anesthesia could influence some of our physiological measures. Further experiments in conscious free moving mice with an implanted wireless optical nerve cuff may avoid the potential caveats of isoflurane anesthesia. Optical stimulations routinely produced responses of smaller magnitude compared to electrical stimulation, indicative of a lower efficacy for vagal fiber activation. This suggestion is supported by our observations in ex vivo compound potential studies, where the magnitude of evoked peaks was higher with electrical stimulation, indicative of more fiber recruitment. Nevertheless, the findings of our compound action potential recordings should be interpreted in the context of the stimulation frequency, the laser power and the pulse width of each stimulation, which may not be optimal for activating all vagal fibers. Consistent with this, electrical stimulation was effective at recruiting very fast fibers, a finding missing from the optical-evoked compound action potential recordings. By contrast, the longer pulse widths and higher stimulation frequencies used in vivo reliably evoked respiratory reflexes consistent with fast A-fiber activation. Some viral tracing experiments had a small proof-of-concept sample size. However, given the consistent findings among the experimental replicates, we are confident that the findings and the conclusions will remain the same with a larger sample size. Technical limitations with our wholemount cleared ganglia imaging should also be considered. With this approach, immunohistochemically labeled isolated neurons with well-defined cell bodies (such as the retrogradely labeled cells) were relatively easy to count in Imaris whereas densely packed cells (such as the reporter EYFP marked cells) were more difficult to be quantified reliably. More challenges were posed by the membrane localization of the EYFP signal and the fact that the laser used has lower tissue penetrance compared to the longer wavelengths in other channels.
STAR★Methods
Key resources table
| REAGENT or RESOURCE | SOURCE | IDENTIFIER |
|---|---|---|
| Antibodies | ||
| Rabbit anti-alpha smooth muscle actin (ASMA) | Abcam | AB5694; RRID: AB_2223021 |
| Rabbit anti-calcitonin gene related peptide (CGRP) | Immunostar | #24112; RRID: AB_572217 |
| Goat anti-choline acetyltransferase (ChAT) | Merck Millipore | AB144P; RRID: AB_2079751 |
| Rabbit anti-cholera toxin B | Sigma Aldrich | C3062-1ml; RRID: AB_258833 |
| Rabbit anti-dsRED | Takara Bio | 632496; RRID: AB_10013483 |
| Chicken anti-GFP | Abcam | #ab13970; RRID: AB_300798 |
| Rabbit anti-GFP | Thermo Fisher | #A11122; RRID: AB_221569 |
| Mouse anti-glutamine synthetase | Merck Millipore | MAB302; RRID: AB_2110656 |
| Rabbit anti-PGP9.5 | Merck Millipore | AB5925; RRID: AB_92138 |
| Rat anti-substance P | Merck Millipore | MAB356; RRID: AB_94639 |
| Sheep anti-tyrosine hydroxylase (TH) | Merck Millipore | AB1542; RRID: AB_90755 |
| Chemicals, peptides, and recombinant proteins | ||
| Boric acid | Merck Millipore | 1.00165.0500 |
| Cholera toxin B | List Biological Labs | #104 |
| Lethabarb | Virbac | LETHA450 |
| Quadrol | Sigma Aldrich | 122262-1L |
| Triton-X | Merck Millipore | 1086031000 |
| Urea | Thermo Fisher Scientific | ACR434720010 |
| Experimental models: Organisms/strains | ||
| Wnt1-Cre mice (B6 Wnt1-Cre2; B6.Cg-E2f1Tg(Wnt1-cre)2Sor/J) | The Jackson Laboratory | Stock No: 0022501 |
| Phox2b-Cre mice (B6(Cg)-Tg(Phox2b-Cre)3Jke/J) | The Jackson Laboratory | Stock No: 016223 |
| CGRP-Cre mice (B6.Cg-Calcatm1.1(cre/EGFP)Rpa/J) | The Jackson Laboratory | Stock No: 033168 |
| Homozygous floxed ChR2 mice (Ai32(RCL-ChR2(H134R)/EYFP); B6;129S-Gt(ROSA)26Sortm32(CAG-COP4∗H134R/EYFP)Hze/J) | The Jackson Laboratory | Stock No: 012569 |
| Software and algorithms | ||
| Fiji | NIH | https://imagej.net/software/fiji/downloads |
| GraphPad | Prism | https://www.graphpad.com/features |
| QuPath | QuPath docs authors | https://qupath.github.io/ |
| Other | ||
| PELO Clear Wall Glass Bottom Dishes 35 × 10 mm, 22 mm | ProSciTech | PEL14023-20 |
Resource availability
Lead contact
Correspondence should be addressed to the lead contact and corresponding author, Professor Stuart Mazzone (stuart.mazzone@unimelb.edu.au).
Materials availability
This study did not generate new unique reagents or materials.
Data and code availability
-
•
All data reported in this paper will be shared by the lead contact upon reasonable request.
-
•
This paper does not report original code.
-
•
Any additional information required to reanalyze the data reported in this paper is available from the lead contact upon request.
Experimental model and study participant details
This study complies with the Australian code for the care and use of animals for scientific purposes from the National Health and Medical Research Council of Australia. All procedures are approved by the Animal Ethics Committee of the University of Melbourne, Australia (approval number 1814540). All steps were used to minimize the animals’ pain and suffering, as mandated in the Australian Code. All mouse lines were purchased initially from the Jackson Laboratory. Heterozygous Wnt1-Cre mice (Stock No: 0022501; B6 Wnt1-Cre2; B6.Cg-E2f1Tg(Wnt1-cre)2Sor/J)41,42 or Phox2b-Cre mice (Stock No: 016223; B6(Cg)-Tg(Phox2b-Cre)3Jke/J)43 were crossed with homozygous floxed ChR2 mice (Stock No: 012569; Ai32(RCL-ChR2(H134R)/EYFP); B6;129S-Gt(ROSA)26Sortm32(CAG-COP4∗H134R/EYFP)Hze/J)44 (Figure 1A). The resulting offspring were genotyped for Cre and ChR2 status as per genotyping guidelines in the Jackson Laboratory website. Successful functional incorporation of ChR2 into vagal neurons was confirmed by assessing compound action potentials generated by electrical and optical stimulation of isolated vagus nerves in vitro, and through microscopy visualization of enhanced yellow fluorescent protein (EYFP)-expressing axons in histological sections of the vagus (See Figures 3 and 4 for details). Transgene-positive mice are referred to herein as Phox2b-Cre;loxP-ChR2 and Wnt1-Cre;loxP-ChR2 mice, and transgene negative littermates mice from Phox2b and Wnt1 breeding lines as loxP-ChR2. Heterozygous CGRP-Cre mice (Stock No: 033168; B6.Cg-Calcatm1.1(cre/EGFP)Rpa/J; The Jackson Laboratory)45 are also used in this study. All animals were housed under standard conditions with ad libitum access to food and water. Both sexes of adult mice (> 2 months of age, 20–35 g; a total of n = 23 for Wnt1-Cre;loxP-ChR2, n = 39 for Phox2b-Cre;loxP-ChR2 and n = 14 (7 each) for transgene-negative loxP-ChR2 mice; n = 2 for heterozygous CGRP-Cre mice) were used for experiments. No sex-dependent difference was observed and data from both sexes were thus pooled.
Method details
In vivo physiological recordings with electrical or optical vagus nerve stimulation (VNS)
Animal preparation
Mice were anesthetized with isoflurane in medical-grade oxygen (4% for induction and 1.3–1.8% for maintenance). A midline incision was made in the neck and either left or right common carotid artery (on the opposite side of vagal stimulation) was carefully exposed and cannulated with a mouse pressure catheter (SPR-1000 Mikro-tip, Millar), which was connected to the pressure control unit (PCU2000, Millar) for recording of blood pressure. The cervical esophagus was carefully exposed without any damage to the recurrent laryngeal nerve and cannulated with a polyethylene tubing (OD 1 mm; ID 0.6 mm) which was connected to a pressure transducer. The abdominal diaphragm was exposed through an oblique incision just below the rib cage and by gently pressing down the liver and hooked with two electrodes for recording of diaphragmatic electromyography (dEMG) for respiratory activity (Figure 1B). The outputs from the esophageal pressure transducer and the dEMG were filtered and amplified (Neurolog Systems, Digitimer, Hertfordshire, UK). All outputs were then digitized (Micro1401 A-D converter, CED, Cambridge, UK) and recorded using Spike II software (CED, Cambridge, UK) for offline analysis. The left or right cervical vagus nerve was carefully exposed and separated from the surrounding tissues with blunt dissection for electrical or optical stimulation.
Electrical VNS
A total of 9 mice (n = 8 and 1, respectively for Phox2b-Cre;loxP-ChR2 and Wnt1-Cre;loxP-ChR2, data pooled) were used for this experiment. Stainless steel bipolar electrodes (A-M systems, 791100), connected to the square pulse stimulator (S48, Grass Instruments), were hooked onto the exposed right (n = 5) or left (n = 4) vagus nerve. After a stable baseline recording was established for 5 minutes, an optimal voltage that could elicit an apneic response at 20 Hz was first determined. Next using the identified optimal voltage, the electrical VNS (1 ms pulse, 10 s pulse trains) was performed at frequencies ranging from 1 Hz to 50 Hz at 6-minute intervals and induced physiological responses were examined.
Optical VNS
An optical laser probe tip (200 μm, NA0.22, OPT_200_0.22_FLT, Doric Lenses) attached to a probe holder and laser light source (473 nm, LRS-0473 DPSS laser system, Laserglow Technologies) was positioned on the surface of the exposed left or right mid-cervical vagus nerve. Optical VNS was delivered and controlled by OTPG4 software (Doric lenses) on a Windows Computer and used to trigger event markings in Spike II to accurately define stimulus-response timings. Laser power used was defined from measurements with 5 ms pulse at 20 Hz using an optical power and energy meter (PM100D, Thorlabs Inc.)
A total of 44 mice (n = 16, 16 and 12, respectively for Phox2b-Cre;loxP-ChR2, Wnt1-Cre;loxP-ChR2 and loxP-ChR2 from the two mouse lines) were used for this experiment. A stable baseline physiological recording was established for 5 minutes. Next, optical VNS (5 ms pulses, 10 s pulse trains) of the left or right intact vagus nerve was performed at optical pulse train frequencies of 1–100 Hz at laser power of 31 mWmm−2 and 30 and 60 Hz at decreasing laser power of 5–21 mWmm−2 at a 6.5 min inter-stimulus intervals, following the published literature on optogenetic VNS in mice.25 Next, a repeat 30 Hz optical pulse train frequency stimulation at 31 mWmm−2 was performed on the intact vagus nerve to confirm that the animal was still in optimal physiological status, after which a unilateral vagotomy was performed on the vagus nerve under examination and physiological recordings were performed with optical VNS (30 and 60 Hz, 31 mWmm−2) of the vagus nerve stumps distal and proximal to the vagotomy site. In select animals, 10 Hz VNS was performed on the distal and proximal vagal stumps. The non-stimulated nerve stump was covered with an optically opaque sheet to prevent any inadvertent spread of light from reaching the tissue.
Analysis of physiology data
Recordings of blood pressure, esophageal pressure and dEMG were processed and analyzed offline in Spike 2 version 9 on Windows 10. Raw dEMG data were rectified and smoothed, and respiratory rate and amplitude determined from each dEMG peak. Heart rate was calculated from the waveforms of blood pressure recordings. Respiratory rate, dEMG amplitude, blood pressure, heart rate and esophageal pressure during each 10 s stimulation were quantified, averaged and normalized to the respective mean baseline values (20 s before any stimulation) within each group of animals. Ventilation responses (minute dEMG) were calculated by multiplication of respiratory rate and dEMG amplitude and presented as a percent change from the baseline level.
Ex vivo vagus nerve recording
Phox2b-Cre;loxP-ChR2 (n = 7), Wnt1-Cre;loxP-ChR2 (n = 4) and loxP-ChR2 (n = 2, 1 each from Wnt1 and Phox2b lines) mice were euthanized with an overdose of pentobarbitone (Lethabarb) and perfused through the left ventricle with Krebs buffer (composed of: NaCl, 118 mM; KCl, 5.4 mM; NaH2PO4, 1.0 mM; MgSO4, 1.2 mM; CaCl2, 1.9 mM; NaHCO3, 25.0 mM; dextrose, 11.1 mM, indomethacin, 3 μM, gassed with 95% O2–5% CO2, pH = 7.4). Left and right vagus nerves with their intact ganglia were quickly dissected from their point of attachment to the brainstem to the thoracic inlet and kept in oxygenated Krebs buffer at room temperature until recording. The vagus nerve and ganglia were de-sheathed in Krebs buffer before transferring to liquid paraffin in a temperature controlled (∼35°C) organ bath. The distal end of the vagus nerve was placed on a pair of silver wire hook electrodes and the signals from these electrodes were recorded using an AC Pre-amplifier headstage (NL100, Digitimer), amplified and filtered (Neurolog Systems, Digitimer, Hertfordshire, UK), digitized (Micro1401 A-D converter, CED, Cambridge, UK) and recorded using Spike II software (CED, Cambridge, UK). Optical stimulation was performed with the laser probe tip placed on the vagal ganglia at 1 Hz for 1.6 min. The shortest functional laser pulse duration (0.25–0.5 ms) which could produce reliable activation and compound action potential waves above two standard deviations over the baseline was determined and used for all subsequent stimulations. Laser powers of 5–63 mWmm−2 were tested. At the completion of optical stimulation, electrical stimulation of the vagal ganglia was performed using a concentric electrode with the following parameters: 0.1 ms pulse at 1 Hz for 1.5 minutes. The distance between recording electrodes and optical probe tip or stimulating electrode was measured. In additional experiments (4 nerves collected from n = 2 Phox2b-Cre;loxP-ChR2 mice, compound action potentials evoked by electrical and optical stimulation were compared before and after the nerve was cut between the stimulation and recording sites to assess the contribution of shock artifacts to the compound recordings. Data were processed offline in Spike 2 version 9. Waveform average analysis was used to determine different compound action potential waves and their timepoints from the start of each stimulation and conduction velocity of each wave was determined.
Retrograde viral tracing from the trachea and the lungs
Airway and lung injections of the non-conditional retrograde viral tracer, AAVrg-CAG-tdTomato, were used to trace airway neural innervation. A total of 4 mice (Phox2b-Cre;loxP-ChR2 (n = 2) and Wnt1-Cre;loxP-ChR2 mice (n = 2)) were anesthetized with isoflurane in medical-grade oxygen (4% for induction and 1.8–2.5% for maintenance). A midline incision was made in the neck and the left vagus and superior laryngeal nerve were carefully exposed, gently separated from the surrounding tissues with blunt dissection and then transectioned. Next, 3 μl each of AAVrg-CAG-tdTomato with 1 μl of saline was injected into the left and right lungs through the seventh or eighth intercostal space which was exposed by a small incision of the overlying skin following our published protocols in rodents.9 1 μl of the same AAV together with 2 μl of saline was subsequently injected into the lumen of the trachea using a Hamilton syringe. Four weeks later, the animals were euthanized and their trachea, lungs, brains, vagal ganglia, thoracic DRGs (T2-T4), superior cervical ganglia and stellate ganglia were collected for immunohistochemistry.
In the subsequent confirmatory experiments, the Cre-dependent viral tracer, AAVrg-CAG-FLEX-tdTomato-WPRE10GH, was injected into the trachea of heterozygous CGRP-Cre mice (n = 2). Again, animals were anaesthetized with isoflurane (4% for induction and 1.8–2.5% for maintenance), a midline incision was made in the neck and the muscles overlying the trachea were retracted to expose the trachea. Next using a Hamilton syringe, 1 μl of AAVrg-CAG-FLEX-tdTomato-WPRE10GH together with 2μl of saline was injected into the lumen of the trachea. After 4 weeks, the animals were euthanized and their brains, trachea and vagal ganglia were collected for immunohistochemistry. Alternatively, cholera toxin B (CTB, catalogue number #104, List Biological Labs, 0.3% w/v, 5 μl per injection), a retrograde tracer, was injected into the trachea of Phox2b-Cre;loxP-ChR2 mice (n = 6) following the experimental procedures described above. After one week, the animals were euthanized and their brains and vagal ganglia were collected for immunohistochemistry.
Conventional immunohistochemistry of vagal sensory ganglia and brainstem
At the conclusion of physiology or viral tracing experiments, mice were euthanized with an overdose of Lethabarb and perfused with PBS and 4% PFA. Vagal ganglia along with the vagus nerve and brainstems were collected, fixed in 4% PFA (at room temperature for 1 hour for vagal ganglia and at 4°C overnight for the brainstems) and stored in 0.01% PFA at 4°C until sectioning. After cryoprotection overnight in 30% sucrose followed by freezing in OCT embedding compound, tissues were sectioned using a Leica cryostat (CM1860V) at 12 μm (ganglia) and 50 μm (brainstems) and collected either onto 4 sets of Superfrost plus slides (ganglia) or sequentially in PBS in 48-well plates (brainstems). Every fourth section of vagal ganglia and brainstem were used for immunohistochemistry. Sections were blocked in 10% donkey serum in 0.1M PBS for one hour at room temperature and then incubated with primary antibodies of interest for 24 hours (ganglia) or 48 hours (brainstem) and in appropriate secondary antisera and Hoechst (1:1000) for 1 hour at room temperature. Anti-GFP antibody (rabbit (Thermo Fisher, #A111222) or chicken (Abcam, #ab13970), both at 1:1000) was used to boost EYFP signal. The following primary antibodies were also used: rabbit anti-PGP9.5 antibody (1:500, Merck Millipore, #AB5925), mouse anti-glutamine synthetase (1:300, Merck Millipore, #MAB302), sheep anti-tyrosine hydroxylase (TH) (1:1000, Merck Millipore, AB1542), rabbit anti-dsRED (1:1000, Clonetech, #632496), goat anti-choline acetyltransferase (1:100, Merck Millipore, #AB144P), rabbit anti-cholera toxin B antibody (1:10,000, Sigma Aldrich, #C3062) and rabbit anti-calcitonin gene related peptide (CGRP) (1:1500, Immunostar, #24112). The secondary antibodies used were donkey anti-chicken Alexa Fluor 488, donkey anti-rabbit Alexa Fluor 488, donkey anti-goat AF488, donkey anti-rabbit Alexa Fluor 594, donkey anti-mouse Alexa Fluor 647 and donkey anti-sheep Alexa Fluor 647 (all at 1:500, Thermo Fischer). Hoechst (1:1000) was also used to counterstain the nuclei. Imaging of vagal ganglia and brain sections were performed at a Leica DM6B LED microscope equipped with a Leica DFC7000T camera and images minimally processed for optimal clarity in Adobe Photoshop. EYFP expression and its fluorescent intensity in the brainstem was examined in Fiji software with a rainbow color lookup scale. The brainstem regions were segmented and presented at different bregma levels according to the mouse brain atlas.46 Quantification of fluorescent images from the vagal ganglia sections was performed in QuPath.
Wholemount immunohistochemistry of trachea and ganglia
Tracheae and whole ganglia were immunostained using a modification of a previously described protocol.20 Briefly, after collection from 4% PFA-perfused animals, tracheae were cut open longitudinally through the anterior wall and flat-fixed on Sylgard with 4% PFA at 4°C for one night. Ganglia were fixed with 4% PFA at 4°C overnight. Tissues were washed in PBS, blocked in 2% bovine serum albumin and incubated with primary antibodies for two nights and appropriate secondary antibodies overnight at 37°C. The following primary antibodies were used: chicken anti-GFP antibody (1:1000, Abcam, #ab13970), sheep anti-tyrosine hydroxylase (TH) (1:1000, Merck Millipore, AB1542), goat anti-choline acetyltransferase (ChAT, 1:100, Merck Millipore, AB144P), rat anti-substance P (1:200, Merck Millipore, MAB356), rabbit anti-alpha smooth muscle actin (ASMA, 1:500) and rabbit anti-CGRP (1:1000, Immunostar, 24112). Tracheae were mounted in fluoroshield on a glass slide with coverslips applied with the use of back-folding clips and imaged at Leica microscope.
Tissue clearing and imaging of sensory and sympathetic ganglia
Wholemount immunostained ganglia were cleared with modified CUBIC-scale-1 reagent containing boric acid (25% w/w urea, 25% w/w Quadrol, 15% w/w Triton-X100, 15% w/w of 4% w/v boric acid and 15% w/w water) following an experimental protocol by Liu and colleagues.47 Briefly, immunostained ganglia were cleaned and incubated in the modified CUBIC-sale-1 agent at 37°C at 150 rpm until completely cleared (usually for 3–5 nights). Once cleared, ganglia were transferred to and imaged in mineral oil in custom-made or commercial microscope chambers at Zeiss LSM880 or LSM900 confocal microscopes.
Quantification of the cells in cleared ganglia were performed in Imaris 9.5.1 (Oxford Instruments) on a Mac computer.
Quantification and statistical analysis
All data were presented as mean ± standard deviations (SD). Statistical analyses were performed in Prism 8. All physiology data (respiratory rate, dEMG amplitude, minute dEMG, heart rate, blood pressure and esophageal pressure) from frequency-response, experiments from the two transgenic mouse lines were separately analyzed with one- or two-way repeated measures ANOVA followed by Dunnett’s or Tukey’s HSD post-hoc tests. Statistical significance was defined as p < 0.05. All the statistical details were reported in the figure legends.
Acknowledgments
This study was supported by a grant (1078943) to S.B.M. from the National Health and Medical Research Council of Australia (NHMRC), a grant (DP210103740) to S.B.M. from the Australian Research Council and a University of Melbourne early career researcher grant (1859105) to A.A.K.M. A.E.M. currently holds a Discovery Early Career Researcher Award (DE230101079) from the Australian Research Council.
The authors would like to thank Dr Lincon Stamp and Dr Marlene Hao (Department of Anatomy and Physiology) for providing us with heterozygous Wnt1-Cre and homozygous ChR2 mouse lines, Dr Phil Ryan (The Florey Institute of Neuroscience and Mental Health) for providing us with CGRP-Cre mouse line and Dr Ellie Cho (Biological Optical Microscopy Platform [BOMP], The University of Melbourne) for her technical guidance on image processing in Fiji and members of BOMP.
Author contributions
A.A.K.M. and S.B.M. conceptualized the experiments and wrote the manuscript with feedback from all co-authors. A.A.K.M. and T.G.B. performed the physiological recording experiments. A.A.K.M. and M.W.T. performed viral tracing experiments. M.W.T. was also involved in the animal care of all physiological recording experiments and mouse colony maintenance. W.S.K. and S.T.Y. was involved in setting up of ex vivo vagal compound action potential recordings and their data analysis. R.B. performed the immunohistochemistry on brain sections. A.K.D. and A.E.M. were involved in the optimization of initial in vivo optical stimulation experiments.
Declaration of interests
S.B.M. reports receiving grants from Merck, Bellus Health and Reckitt Benkiser, and remuneration for consultancy from Merck, Bellus Health, Reckitt Benkiser and Nerre Therapeutics and has served on advisory committees for Merck, Reckitt Benkiser and Trevi Therapeutics, all of which are unrelated to the contents of the current manuscript.
Published: February 9, 2024
Footnotes
Supplemental information can be found online at https://doi.org/10.1016/j.isci.2024.109182.
Supplemental information
References
- 1.Kistemaker L.E.M., Prakash Y.S. Airway Innervation and Plasticity in Asthma. Physiology. 2019;34:283–298. doi: 10.1152/physiol.00050.2018. [DOI] [PMC free article] [PubMed] [Google Scholar]
- 2.Mazzone S.B., Canning B.J. In: Handbook of Clinical Neurology. Buijs R.M., Swaab D.F., editors. Elsevier; 2013. Chapter 18 - Autonomic neural control of the airways; pp. 215–228. [DOI] [PubMed] [Google Scholar]
- 3.Mazzone S.B., Undem B.J. Vagal Afferent Innervation of the Airways in Health and Disease. Physiol. Rev. 2016;96:975–1024. doi: 10.1152/physrev.00039.2015. [DOI] [PMC free article] [PubMed] [Google Scholar]
- 4.Dubreuil V., Barhanin J., Goridis C., Brunet J.-F. Breathing with phox2b. Philos. Trans. R. Soc. Lond. B Biol. Sci. 2009;364:2477–2483. doi: 10.1098/rstb.2009.0085. [DOI] [PMC free article] [PubMed] [Google Scholar]
- 5.D'amico-Martel A., Noden D.M. Contributions of placodal and neural crest cells to avian cranial peripheral ganglia. Am. J. Anat. 1983;166:445–468. doi: 10.1002/aja.1001660406. [DOI] [PubMed] [Google Scholar]
- 6.Narayanan C.H., Narayanan Y. Neural crest and placodal contributions in the development of the glossopharyngeal-vagal complex in the chick. Anat. Rec. 1980;196:71–82. doi: 10.1002/ar.1091960108. [DOI] [PubMed] [Google Scholar]
- 7.Jessen K.R., Mirsky R. The origin and development of glial cells in peripheral nerves. Nat. Rev. Neurosci. 2005;6:671–682. doi: 10.1038/nrn1746. [DOI] [PubMed] [Google Scholar]
- 8.Kupari J., Häring M., Agirre E., Castelo-Branco G., Ernfors P. An Atlas of Vagal Sensory Neurons and Their Molecular Specialization. Cell Rep. 2019;27:2508–2523.e4. doi: 10.1016/j.celrep.2019.04.096. [DOI] [PMC free article] [PubMed] [Google Scholar]
- 9.McGovern A.E., Davis-Poynter N., Yang S.K., Simmons D.G., Farrell M.J., Mazzone S.B. Evidence for multiple sensory circuits in the brain arising from the respiratory system: an anterograde viral tract tracing study in rodents. Brain Struct. Funct. 2015;220:3683–3699. doi: 10.1007/s00429-014-0883-9. [DOI] [PubMed] [Google Scholar]
- 10.McGovern A.E., Driessen A.K., Simmons D.G., Powell J., Davis-Poynter N., Farrell M.J., Mazzone S.B. Distinct brainstem and forebrain circuits receiving tracheal sensory neuron inputs revealed using a novel conditional anterograde transsynaptic viral tracing system. J. Neurosci. 2015;35:7041–7055. doi: 10.1523/JNEUROSCI.5128-14.2015. [DOI] [PMC free article] [PubMed] [Google Scholar]
- 11.Driessen A.K., Farrell M.J., Dutschmann M., Stanic D., McGovern A.E., Mazzone S.B. Reflex regulation of breathing by the paratrigeminal nucleus via multiple bulbar circuits. Brain Struct. Funct. 2018;223:4005–4022. doi: 10.1007/s00429-018-1732-z. [DOI] [PubMed] [Google Scholar]
- 12.Bałuk P., Gabella G. Innervation of the guinea pig trachea: a quantitative morphological study of intrinsic neurons and extrinsic nerves. J. Comp. Neurol. 1989;285:117–132. doi: 10.1002/cne.902850110. [DOI] [PubMed] [Google Scholar]
- 13.Baluk P., Nadel J.A., McDonald D.M. Substance P-immunoreactive sensory axons in the rat respiratory tract: a quantitative study of their distribution and role in neurogenic inflammation. J. Comp. Neurol. 1992;319:586–598. doi: 10.1002/cne.903190408. [DOI] [PubMed] [Google Scholar]
- 14.Yamamoto Y., Ootsuka T., Atoji Y., Suzuki Y. Morphological and quantitative study of the intrinsic nerve plexuses of the canine trachea as revealed by immunohistochemical staining of protein gene product 9.5. Anat. Rec. 1998;250:438–447. doi: 10.1002/(sici)1097-0185(199804)250:4<438::Aid-ar7>3.0.Co;2-t. [DOI] [PubMed] [Google Scholar]
- 15.Yamamoto Y., Sato Y., Taniguchi K. Distribution of TRPV1- and TRPV2-immunoreactive afferent nerve endings in rat trachea. J. Anat. 2007;211:775–783. doi: 10.1111/j.1469-7580.2007.00821.x. [DOI] [PMC free article] [PubMed] [Google Scholar]
- 16.Mazzone S.B., Tian L., Moe A.A.K., Trewella M.W., Ritchie M.E., McGovern A.E. Transcriptional Profiling of Individual Airway Projecting Vagal Sensory Neurons. Mol. Neurobiol. 2020;57:949–963. doi: 10.1007/s12035-019-01782-8. [DOI] [PubMed] [Google Scholar]
- 17.Kollarik M., Dinh Q.T., Fischer A., Undem B.J. Capsaicin-sensitive and -insensitive vagal bronchopulmonary C-fibres in the mouse. J. Physiol. 2003;551:869–879. doi: 10.1113/jphysiol.2003.042028. [DOI] [PMC free article] [PubMed] [Google Scholar]
- 18.Su Y., Barr J., Jaquish A., Xu J., Verheyden J.M., Sun X. Identification of lung innervating sensory neurons and their target specificity. Am. J. Physiol. Lung Cell Mol. Physiol. 2022;322:L50–L63. doi: 10.1152/ajplung.00376.2021. [DOI] [PMC free article] [PubMed] [Google Scholar]
- 19.Kim S.-H., Patil M.J., Hadley S.H., Bahia P.K., Butler S.G., Madaram M., Taylor-Clark T.E. Mapping of the Sensory Innervation of the Mouse Lung by Specific Vagal and Dorsal Root Ganglion Neuronal Subsets. eneuro. 2022;9 doi: 10.1523/ENEURO.0026-22.2022. ENEURO.0026-0022.2022. [DOI] [PMC free article] [PubMed] [Google Scholar]
- 20.Hennel M., Harsanyiova J., Ru F., Zatko T., Brozmanova M., Trancikova A., Tatar M., Kollarik M. Structure of vagal afferent nerve terminal fibers in the mouse trachea. Respir. Physiol. Neurobiol. 2018;249:35–46. doi: 10.1016/j.resp.2018.01.001. [DOI] [PMC free article] [PubMed] [Google Scholar]
- 21.Farrell M.J., Bautista T.G., Liang E., Azzollini D., Egan G.F., Mazzone S.B. Evidence for multiple bulbar and higher brain circuits processing sensory inputs from the respiratory system in humans. J. Physiol. 2020;598:5771–5787. doi: 10.1113/jp280220. [DOI] [PubMed] [Google Scholar]
- 22.Driessen A.K., McGovern A.E., Behrens R., Moe A.A.K., Farrell M.J., Mazzone S.B. A role for neurokinin 1 receptor expressing neurons in the paratrigeminal nucleus in bradykinin-evoked cough in guinea-pigs. J. Physiol. 2020;598:2257–2275. doi: 10.1113/JP279644. [DOI] [PubMed] [Google Scholar]
- 23.Moe A.A.K., McGovern A.E., Mazzone S.B. Jugular vagal ganglia neurons and airway nociception: A target for treating chronic cough. Int. J. Biochem. Cell Biol. 2021;135 doi: 10.1016/j.biocel.2021.105981. [DOI] [PubMed] [Google Scholar]
- 24.Driessen A.K., Farrell M.J., Mazzone S.B., McGovern A.E. The Role of the Paratrigeminal Nucleus in Vagal Afferent Evoked Respiratory Reflexes: A Neuroanatomical and Functional Study in Guinea Pigs. Front. Physiol. 2015;6 doi: 10.3389/fphys.2015.00378. [DOI] [PMC free article] [PubMed] [Google Scholar]
- 25.Chang R.B., Strochlic D.E., Williams E.K., Umans B.D., Liberles S.D. Vagal Sensory Neuron Subtypes that Differentially Control Breathing. Cell. 2015;161:622–633. doi: 10.1016/j.cell.2015.03.022. [DOI] [PMC free article] [PubMed] [Google Scholar]
- 26.Tsaava T., Datta-Chaudhuri T., Addorisio M.E., Masi E.B., Silverman H.A., Newman J.E., Imperato G.H., Bouton C., Tracey K.J., Chavan S.S., Chang E.H. Specific vagus nerve stimulation parameters alter serum cytokine levels in the absence of inflammation. Bioelectron. Med. 2020;6:8. doi: 10.1186/s42234-020-00042-8. [DOI] [PMC free article] [PubMed] [Google Scholar]
- 27.Kim S.H., Hadley S.H., Maddison M., Patil M., Cha B., Kollarik M., Taylor-Clark T.E. Mapping of Sensory Nerve Subsets within the Vagal Ganglia and the Brainstem Using Reporter Mice for Pirt, TRPV1, 5-HT3, and Tac1 Expression. eNeuro. 2020;7 doi: 10.1523/eneuro.0494-19.2020. [DOI] [PMC free article] [PubMed] [Google Scholar]
- 28.Rajendran P.S., Challis R.C., Fowlkes C.C., Hanna P., Tompkins J.D., Jordan M.C., Hiyari S., Gabris-Weber B.A., Greenbaum A., Chan K.Y., et al. Identification of peripheral neural circuits that regulate heart rate using optogenetic and viral vector strategies. Nat. Commun. 2019;10:1944. doi: 10.1038/s41467-019-09770-1. [DOI] [PMC free article] [PubMed] [Google Scholar]
- 29.Lovelace J.W., Ma J., Yadav S., Chhabria K., Shen H., Pang Z., Qi T., Sehgal R., Zhang Y., Bali T., et al. Vagal sensory neurons mediate the Bezold-Jarisch reflex and induce syncope. Nature. 2023;623:387–396. doi: 10.1038/s41586-023-06680-7. [DOI] [PMC free article] [PubMed] [Google Scholar]
- 30.Neuhuber W.L., Kressel M., Stark A., Berthoud H.-R. Vagal efferent and afferent innervation of the rat esophagus as demonstrated by anterograde DiI and DiA tracing: Focus on myenteric ganglia. J. Auton. Nerv. Syst. 1998;70:92–102. doi: 10.1016/S0165-1838(98)00034-4. [DOI] [PubMed] [Google Scholar]
- 31.Cunningham E.T., Jr., Sawchenko P.E. Central neural control of esophageal motility: A review. Dysphagia. 1990;5:35–51. doi: 10.1007/BF02407391. [DOI] [PubMed] [Google Scholar]
- 32.Park H., Conklin J.L. Neuromuscular control of esophageal peristalsis. Curr. Gastroenterol. Rep. 1999;1:186–197. doi: 10.1007/s11894-999-0033-3. [DOI] [PubMed] [Google Scholar]
- 33.Furness J.B. The enteric nervous system and neurogastroenterology. Nat. Rev. Gastroenterol. Hepatol. 2012;9:286–294. doi: 10.1038/nrgastro.2012.32. [DOI] [PubMed] [Google Scholar]
- 34.Stauss H.M. Differential hemodynamic and respiratory responses to right and left cervical vagal nerve stimulation in rats. Phys. Rep. 2017;5 doi: 10.14814/phy2.13244. [DOI] [PMC free article] [PubMed] [Google Scholar]
- 35.Han W., Tellez L.A., Perkins M.H., Perez I.O., Qu T., Ferreira J., Ferreira T.L., Quinn D., Liu Z.W., Gao X.B., et al. A Neural Circuit for Gut-Induced Reward. Cell. 2018;175:665–678.e23. doi: 10.1016/j.cell.2018.08.049. [DOI] [PMC free article] [PubMed] [Google Scholar]
- 36.Chiang C.H., Gabella G. Quantitative study of the ganglion neurons of the mouse trachea. Cell Tissue Res. 1986;246:243–252. doi: 10.1007/bf00215886. [DOI] [PubMed] [Google Scholar]
- 37.Watanabe N., Horie S., Michael G.J., Keir S., Spina D., Page C.P., Priestley J.V. Immunohistochemical co-localization of transient receptor potential vanilloid (TRPV)1 and sensory neuropeptides in the guinea-pig respiratory system. Neuroscience. 2006;141:1533–1543. doi: 10.1016/j.neuroscience.2006.04.073. [DOI] [PubMed] [Google Scholar]
- 38.Mazzone S.B., Lim L.H.K., Wagner E.M., Mori N., Canning B.J. Sympathetic nerve-dependent regulation of mucosal vascular tone modifies airway smooth muscle reactivity. J. Appl. Physiol. 2010;109:1292–1300. doi: 10.1152/japplphysiol.00632.2010. [DOI] [PMC free article] [PubMed] [Google Scholar]
- 39.Terada M., Iwanaga T., Takahashi-Iwanaga H., Adachi I., Arakawa M., Fujita T. Calcitonin Gene-Related Peptide (CGRP)-Immunoreactive Nerves in the Tracheal Epithelium of Rats An Immunohistochemical Study by Means of Whole Mount Preparations. Arch. Histol. Cytol. 1992;55:219–233. doi: 10.1679/aohc.55.219. [DOI] [PubMed] [Google Scholar]
- 40.Bałuk P., Fujiwara T., Matsuda S. The fine structure of the ganglia of the guinea-pig trachea. Cell Tissue Res. 1985;239:51–60. doi: 10.1007/BF00214902. [DOI] [PubMed] [Google Scholar]
- 41.Danielian P.S., Muccino D Fau - Rowitch D.H., Rowitch Dh Fau - Michael S.K., Michael Sk Fau - McMahon A.P., McMahon A.P. Modification of gene activity in mouse embryos in utero by a tamoxifen-inducible form of Cre recombinase. Curr. Biol. 1998;8:1323–1326. doi: 10.1016/s0960-9822(07)00562-3. [DOI] [PubMed] [Google Scholar]
- 42.Lewis A.E., Vasudevan H.N., O’Neill A.K., Soriano P., Bush J.O. The widely used Wnt1-Cre transgene causes developmental phenotypes by ectopic activation of Wnt signaling. Dev. Biol. 2013;379:229–334. doi: 10.1016/j.ydbio.2013.04.026. [DOI] [PMC free article] [PubMed] [Google Scholar]
- 43.Scott M.M., Williams K.W., Rossi J., Lee C.E., Elmquist J.K. Leptin receptor expression in hindbrain Glp-1 neurons regulates food intake and energy balance in mice. J. Clin. Invest. 2011;121:2413–2421. doi: 10.1172/JCI43703. [DOI] [PMC free article] [PubMed] [Google Scholar]
- 44.Madisen L., Mao T., Koch H., Zhuo J.-M., Berenyi A., Fujisawa S., Hsu Y.-W.A., Garcia A.J., 3rd, Gu X., Zanella S., et al. A toolbox of Cre-dependent optogenetic transgenic mice for light-induced activation and silencing. Nat. Neurosci. 2012;15:793–802. doi: 10.1038/nn.3078. [DOI] [PMC free article] [PubMed] [Google Scholar]
- 45.Carter M.E., Soden M.E., Zweifel L.S., Palmiter R.D. Genetic identification of a neural circuit that suppresses appetite. Nature. 2013;503:111–114. doi: 10.1038/nature12596. [DOI] [PMC free article] [PubMed] [Google Scholar]
- 46.Paxinos G., Franklin K.B.J. Second Edition. Academic Press; 2001. The Mouse Brain in Stereotaxic Coordinates. [Google Scholar]
- 47.Liu Y., Broberg M.C.G., Watanabe M., Rollins A.M., Jenkins M.W. SLIME: robust, high-speed 3D microvascular mapping. Sci. Rep. 2019;9:893. doi: 10.1038/s41598-018-37313-z. [DOI] [PMC free article] [PubMed] [Google Scholar]
Associated Data
This section collects any data citations, data availability statements, or supplementary materials included in this article.
Supplementary Materials
Data Availability Statement
-
•
All data reported in this paper will be shared by the lead contact upon reasonable request.
-
•
This paper does not report original code.
-
•
Any additional information required to reanalyze the data reported in this paper is available from the lead contact upon request.