

Abstract
Background
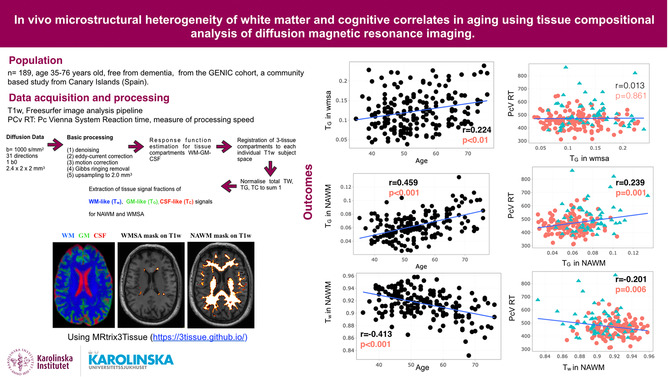
Age‐related cognitive decline is linked to changes in the brain, particularly the deterioration of white matter (WM) microstructure that accelerates after the age of 60. WM deterioration is associated with mild cognitive impairment and dementia, but the origin and role of white matter signal abnormalities (WMSA) seen in standard MRI remain debated due to their heterogeneity. This study explores the potential of single‐shell 3‐tissue constrained spherical deconvolution (SS3T‐CSD), a novel technique that models diffusion data in terms of gray matter (TG), white matter (Tw), and cerebrospinal fluid (TC), to differentiate WMSA from normal‐appearing white matter and better understand the interplay between changes in WM microstructure and decline in cognition.
Methods
A total of 189 individuals from the GENIC cohort were included. MRI data, including T1‐weighted and diffusion images, were obtained. Preprocessing steps were performed on the diffusion MRI data, followed by the SS3T‐CSD. WMSA were segmented using FreeSurfer. Statistical analyses were conducted to assess the association between age, WMSA volume, 3‐tissue signal fractions (Tw, TG, and TC), and neuropsychological variables.
Results
Participants above 60 years old showed worse cognitive performance and processing speed compared to those below 60 (p < .001). Age was negatively associated with Tw in normal‐appearing white matter (p < .001) and positively associated with TG in both WMSA (p < .01) and normal‐appearing white matter (p < .001). Age was also significantly associated with WMSA volume (p < .001). Higher processing speed was associated with lower Tw and higher TG, in normal‐appearing white matter (p < .01 and p < .001, respectively), as well as increased WMSA volume (p < .001). Similarly, lower MMSE scores correlated with lower Tw and higher TG in normal‐appearing white matter (p < .05). High cholesterol and hypertension were associated with higher WMSA volume (p < .05).
Conclusion
The microstructural heterogeneity within normal‐appearing white matter and WMSA is associated with increasing age and cognitive variation, in cognitively unimpaired individuals. Furthermore, the 3‐tissue signal fractions are more specific to potential white matter alterations than conventional MRI measures such as WMSA volume. These findings also support the view that the WMSA volumes may be more influenced by vascular risk factors than the 3‐tissue metrics. Finally, the 3‐tissue metrics were able to capture associations with cognitive tests and therefore capable of capturing subtle pathological changes in the brain in individuals who are still within the normal range of cognitive performance.
Keywords: WMSA, SS3T‐CSD, GENIC, diffusion, aging
This study investigates the relationship between age‐related cognitive decline, white matter signal abnormalities (WMSA), and changes in white matter (WM) microstructure. Using single‐shell 3‐tissue constrained spherical deconvolution (SS3T‐CSD), we can differentiate WMSA from normal‐appearing white matter and analyze their association with cognition. Participants above 60 years old show worse cognitive performance, and their age is negatively associated with normal‐appearing WM microstructure (Tw) and positively associated with WMSA and normal‐appearing WM (TG). WMSA volume is significantly associated with age, and higher processing speed is linked to lower Tw and higher TG. The 3‐tissue signal fractions offer greater specificity for white matter alterations than conventional measures. These findings highlight the interplay between WM microstructure, cognitive decline, and vascular risk factors.
1. INTRODUCTION
The World Health Organization (WHO) estimated that in 2015, around 47 million people worldwide were living with dementia, and this number is expected to triple by 2050 (Prince et al., 2015). Unfortunately, there is to date no cure nor disease‐modifying treatments for dementia; therefore, further research in the aging field is of the great importance (Cummings et al., 2019; Ferreira et al., 2018). Age‐related cognitive decline is primarily explained by changes of the brain including reductions in gray matter volume and enlargement of the ventricles. Over time, the brain loses 5% of its volume with each decade past the age of 40 (Bonte et al., 2017; Driscoll et al., 2009; Knoops et al., 2012; Nagai & Kario, 2009; Peters, 2006; Takao et al., 2012). Additionally, there is deterioration of the white matter microstructure, which accelerates after the age of 60 (Abe et al., 2008; Davis et al., 2009; Grieve et al., 2005; King et al., 2014; Madden et al., 2017; Marstaller et al., 2015). The brain is particularly vulnerable to central hemodynamic alterations due to increased blood pressure, arterial stiffening, and atherosclerosis leading to white matter damage (Badji et al., 2019; Gunning‐Dixon et al., 2009). White matter deterioration is often associated with mild cognitive impairment and dementia (Bombois et al., 2007; Peters, 2006; Skoog, 1998; Yoshita et al., 2006) explaining the interest in understanding the origin and role of white matter signal abnormalities (WMSA) seen in magnetic resonance imaging (MRI).
In vivo MRI can identify the appearance of WMSA characterized by hyperintense signal on T2‐weighted images or hypointense signal in T1‐weighted images (Cedres et al., 2020). Nevertheless, the exact role of WMSA in influencing cognitive changes, variations, decline, and their biological interpretation remains a matter of debate, primarily due to their potentially heterogeneous etiology (Mito et al., 2020). The literature suggests that these WMSA may be preceded by microstructural changes that can be detected with diffusion tensor imaging (DTI) (Maillard et al., 2014). DTI metrics such as fractional anisotropy (FA) are negatively associated with age, while mean diffusivity (MD) is positively associated with age (Abe et al., 2008; Lebel et al., 2012). However, DTI metrics like FA and MD lack specificity, which makes the biological interpretation behind these changes difficult (Badji et al., 2019). Indeed, it can be hypothesized that the observation of a reduction in FA may be due to various microstructural tissue changes such as a reduction in neurite density or an increase in the dispersion of neurite orientation distribution (Beaulieu, 2009). Advances in diffusion imaging have provided novel models to overcome this problem. For instance, a novel approach was introduced to probe the underlying microstructural properties of the WM by modelling the diffusion data in terms of 3‐tissue signal space: gray matter (GM), white matter (WM), and cerebrospinal fluid (CSF) (Dhollander et al., 2017; Dhollander & Connelly, 2016a; Khan et al., 2020; Mito et al., 2020). Probing microstructural properties of the WM is important for differentiating true age‐related white matter changes from partial volume effects and CSF contamination. DTI metrics are less specific in this regard, making it harder to discern tissue‐specific contributions to changes in FA. The technique, which is known as single‐shell 3‐tissue constrained spherical deconvolution (SS3T‐CSD, Dhollander & Connelly, 2016b; https://3Tissue.github.io), allows us to model WMSA and normal‐appearing white matter as well as other tissues and fluids (free water). This technique can distinguish different processes behind various types of tissue signals, including WMSA, despite their homogeneous appearance on conventional MRI images (T2w, T1w). However, the SS3T‐CSD has only been applied in individuals with Alzheimer's disease or stroke patients, and its potential in the field of healthy aging is still unknown.
The goal of this study was to make a first step toward a better understanding of the age‐related changes behind white matter signal abnormalities and normal‐appearing white matter in healthy aging by investigating cognitively unimpaired individuals with the SS3T‐CSD methodology. The SS3T‐CSD technique allows us to interpret the results based on how alike the diffusion signal properties are to those derived from normal white matter, grey matter, and CSF (or free water). We tested (i) the association between age and the different SS3T‐CSD metrics in contrast to its association with the established marker of WMSA; and (ii) the association of SS3T‐CSD metrics with neuropsychological measures of processing speed and global cognition. Finally, we looked at the association between age, neuropsychological measures, SS3T‐CSD metrics, and vascular risk factors. We hypothesized that an older age would be associated with a higher WMSA volume as well as a decreased WM tissue signal fraction in both white matter signal abnormalities and normal‐appearing white matter, which would translate onto reduced cognitive performance.
2. MATERIALS AND METHODS
2.1. Participants
A total of 189 individuals (ages between 35 and 76 years old, mean age 53.80 ± 9.63) were included from the GENIC cohort (Ferreira et al., 2015), a community‐based study from the Canary Islands (Spain). Inclusion criteria were as follows: (1) normal cognitive performance in comprehensive neuropsychological assessment using pertinent clinical normative data; (2) preserved activities of daily living and global cognition, operationalized as a Blessed Rating Dementia Scale (BRDS) (Blessed et al., 1968) score ≤4, a Functional Activity Questionnaire (FAQ) (Kurosaki, n.d.) score ≤5, and a Mini‐Mental State Examination (MMSE) (Folstein et al., 1975) score ≥ 24; (3) no abnormal findings such as tumors, hippocampal sclerosis, etc., in MRI according to an experienced neuroradiologist; (4) no medical history of neurological or psychiatric disorders (including a diagnosis of major depression), systemic diseases, or head trauma; and (5) no history of substance abuse. For the current study, we also required all participants to have MRI data available, including three‐dimensional T1‐weighted and diffusion images. Subjects' recruitment in the GENIC cohort was done through primary care centers, advertisements in local schools, relatives, and acquaintances of the research staff, covering a representative sample in terms of age, sex, and education as explained in previous publications (Cedres et al., 2019). Participation was voluntary, and all participants provided written informed consent approved by the local ethics committee.
2.2. Cognitive and clinical assessment
Cognitive examination was performed by experienced neuropsychologists. Participants underwent a series of tests covering various cognitive domains (e.g., processing speed, attention, executive functions, memory) (Ferreira et al., 2015). For the current study, we selected the MMSE as a stablished measure of global cognitive performance as well as the Pc Vienna System Reaction time (PCv RT) test as a measure of processing speed (Ferreira et al., 2015), in line with our study aims and hypotheses. The Wechsler Adult Intelligence Scale (WAIS‐III) Information subtest (Wechsler, 1972) was scored and used as an indicator of crystallized intelligence/educational attainment as in previous studies (Cedres et al., 2019; Correia et al., 2015; Ferreira et al., 2014; Ferreira et al., 2015). Functional status was assessed with the Functional Activities Questionnaire (FAQ) and the Blessed Dementia Rating Scale (BDRS). In addition, information about a history of stroke and cardiovascular risk factors such as high cholesterol, hypertension, and diabetes were self‐reported by the participants.
2.3. Image acquisition
All participants were scanned on a 3.0 T GE imaging system (General Electric, Milwaukee, WI, USA), at the Hospital Universitario de Canarias in Tenerife, Spain. For the current study, we selected the 3D T1‐weighted (T1w) fast spoiled gradient echo (FSPGR) sequence and the diffusion MRI (dMRI) sequences. The T1w acquisition was done with sagittal slices of 1.0‐mm isotropic resolution, repetition time/echo time/inversion time = 8.73/1.74/650 ms, field of view 250 × 250 mm, matrix 250 × 250 mm, and flip angle 12°. Diffusion MRI (dMRI) data were acquired with 64 axial slices of 2.4 × 2 × 2 mm resolution, with no gaps between slices. Acquisition parameters were as follows: repetition time/echo time 15,000/72 ms, field of view 256 × 256 mm, matrix 128 × 128 mm, flip angle 90°, 31 isotropically distributed gradient orientations (b = 1000 s/mm2), and 1 image without diffusion weighting (b = 0 s/mm2). Whole‐brain and skull coverage were required for the MRI datasets, and quality control was carried out on all MR images according to previously published criteria (Simmons et al., 2011).
2.4. Image processing
The dMRI data were processed using a combination of commands in the MRtrix3 package (Tournier et al., 2019) and the MRtrix3Tissue (https://3tissue.github.io/) fork of MRtrix3, for the purpose of the 3‐tissue response function estimation and SS3T‐CSD, as well as the FMRIB Software Library (FSL) (Jenkinson et al., 2012) and Advanced Normalization Tools (ANTs) (Avants et al., 2014).
Preprocessing steps included denoising (Veraart et al., 2016), motion and eddy current‐induced distortion correction (Andersson & Sotiropoulos, 2016), Gibbs ringing removal (Kellner et al., 2016), and bias field correction (Tustison et al., 2010). The dMRI data were spatially upsampled to a 2.0‐mm isotropic voxel grid (Raffelt et al., 2012). Following these initial preprocessing steps, a fully automated unsupervised method to obtain 3‐tissue response functions (representing single‐fiber WM, GM, and CSF) from the data themselves was used (Dhollander et al., 2017). WM fiber orientation distributions (FODs), as well as GM and CSF compartments, were then computed using SS3T‐CSD based on the group‐averaged response functions for WM, GM, and CSF. Global intensity normalization and bias field correction in the log‐domain across subjects were also performed (Dhollander et al., 2021).
Spatial alignment of the dMRI and T1w data was performed for each participant by first registering each participant's average b = 0 image on participant's own T1w image. We applied a rigid‐affine transformation, estimated via a mutual information cost function optimization using the FMRIB's linear image registration tool (FLIRT) (Jenkinson et al., 2002; Jenkinson & Smith, 2001). The WM, GM, and CSF tissue compartment maps were then warped to T1w images using the warp obtained from this registration.
2.5. Segmentation of white matter signal abnormalities
Segmentation of white matter signal abnormalities (WMSA) was performed with FreeSurfer 6.0.0 (https://surfer.nmr.mgh.harvard.edu/). The details of the procedure are described in prior publications (Brands et al., 2006) (Fischer et al., 2007). Briefly, the pipeline includes motion correction, averaging of T1w images, removal of non‐brain tissue, automated Talairach transformation, and segmentation of the subcortical WM and GM volumetric structures. FreeSurfer detects hypointensities on T1w images and automatically labels them as WMSA using a probabilistic procedure (Fischl et al., 2002). This procedure has shown high sensitivity in measuring WM damage (Salat et al., 2010). In addition, these WMSA are strongly correlated with hyperintensity volumes measured on T2/FLAIR (Cedres et al., 2020). We randomly selected 20 subjects to qualitatively compare the WMSA mask from the T1w images (hypointensities) and the WMSA mask from FLAIR images (hyperintensities) available from the same participants. We observed very similar segmentation, and therefore, the WMSA mask output from T1w images was used for statistical analysis. The WMSA masks were also binarized, and a normal‐appearing white matter mask was also computed by subtracting the WMSA mask from the entire WM mask. Finally, we also extracted the total intracranial volume estimated by FreeSurfer for analysis. All image processing was done through The HiveDB system (Muehlboeck et al., 2014).
2.6. Representing the composition of white matter signal abnormalities and normal‐appearing white matter as 3‐tissue diffusion signal fractions
For each subject, we extracted the total WM‐, GM‐, and CSF‐like signals as obtained from SS3T‐CSD within both WMSA and normal‐appearing white matter. We used the same terminology as previously (Khan et al., 2020; Mito et al., 2020), that is, WM‐like, GM‐like, and CSF‐like tissue signals (Tw, TG, and TC), to refer to the general properties of the diffusion signal without necessarily implying specific biological properties of tissues used to calibrate the model. An important step was to normalize the tissue compartment signals to sum to unity as done previously (Dhollander et al., 2019; Khan et al., 2020; Mito et al., 2020), in order to obtain the respective 3‐tissue signal fractions TW, TG, and TC (the WM‐like, GM‐like, and CSF‐like tissue signal fractions, respectively) and allow for their relative interpretation. For example, a combined decrease of TW and increase of TC might indicate a loss of WM (by means of loss of axonal matter), which might be replaced by increased free water volume.
A flow chart diagram shown in Figure 1 highlights the main features of our processing workflow. We established a highly rigorous sanity check protocol to ensure the feasibility of implementing the SS3T‐CSD methodology in our dataset. Initially, this involved initially evaluating the tissue response function for all 189 participants, as detailed in the Figure S1. Once the FreeSurfer pipeline was done and the tissue fractions (WM, GM, and CSF) warped to T1w, we inspected for each subject: (i) the native T1w image, (ii) the WMSA mask, and (iii) the WM, GM, and CSF tissue compartments in T1 space to carefully assess both the WMSA segmentation and the accuracy of our registration.
FIGURE 1.
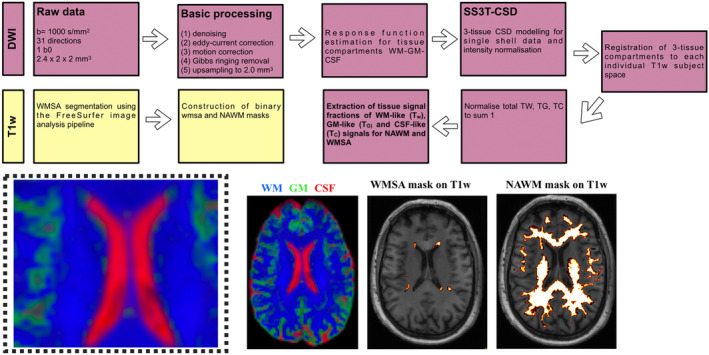
Flow chart summarizing the key processing steps of the single‐shell 3‐tissue constrained spherical deconvolution (SS3T‐CSD) and T1‐weighted (T1w) pipelines. T1w: Segmentation of white matter signal abnormalities (WMSA) was performed with FreeSurfer. Once segmented, the WMSA masks were binarized. A normal‐appearing white matter mask was also computed by subtracting the WMSA mask from the entire white matter (WM) mask. DWI: Single‐shell, b = 1000, 31 gradient directions diffusion data were processed using a combination of commands in the MRtrix3 package as well as the FMRIB Software Library. Basic processing included points 1–5. A fully automated unsupervised method to obtain 3‐tissue response function estimation for tissue compartments WM‐GM‐CSF was used. WM fiber orientation distributions (FODs), as well as gray matter (GM) and cerebrospinal fluid (CSF) compartments, were then computed using a SS3T‐CSD. Spatial alignment of the diffusion and T1w data was performed for each participant. Finally, we normalized the tissue fractions to sum to unity to extract the 3‐tissue signal fractions Tw, TG, and TC within WMSA and normal‐appearing white matter (NAWM).
2.7. Statistical analysis
All statistical analyses were carried out using the R software environment (version 3.5.2) (Team, 2018). The histograms of WMSA volume and all 3‐tissue signal fractions were assessed to identify eventual outliers prior to manual visual sanity check.
To approach our two specific study questions or aims, the age variable was used in its continuous form. Additionally, since previous studies have shown that the age‐related brain changes seem to accelerate after the age of 60 (Abe et al., 2008; Davis et al., 2009; Madden et al., 2017; Marstaller et al., 2015), we also stratified the cohort into two groups of participants below and above 60 years old. This stratification had two purposes: (i) initial description and characterization of the cohort, and (ii) to have a control group (i.e., individuals below 60 years) for correction of the WMSA volume measure: prior to statistical analysis, the WMSA volume was residualized for sex and the total intracranial volume estimated by FreeSurfer as done previously (Badji et al., 2021; Falahati et al., 2016; Voevodskaya et al., 2014). In brief, the algorithm fits a generalized linear model (GLM) to the WMSA volume variable in the control group (individuals below 60 years old) to assess the effects of the predictors (sex and intracranial volume) on the outcome in the absence of the group effect. This allows us to model the covariates‐related effects as linear drift. Then, the regression coefficient of the resulting GLM model is used to remove the covariates‐related effects from all participants and obtain adjusted values.
Differences in demographics and clinical variables between participants below and above 60 years old were assessed with the Wilcoxon test for continuous variables or the chi‐squared test for binary variables.
The association of age with WMSA volume and all 3‐tissue signal fractions (Tw, TG, and TC) computed within WMSA and normal‐appearing white matter was assessed through Spearman's correlations. Similarly, the association between WMSA volume and all 3‐tissue signal fractions (Tw, TG, and TC) computed within WMSA and normal‐appearing white matter with neuropsychological variables (PC Vienna RT, MMSE) was also assessed through Spearman's correlations. In addition, to compare the 3‐tissue signal fractions with the established WMSA marker, we compared the correlation coefficients between age and WMSA volume versus age and the 3‐tissue signal fractions (Tw, TG, and TC) using a bootstrap approach. For a given 3‐tissue signal fraction, from our initial sample of n participants, we resampled n individuals with replacement and computed the difference between the correlation coefficient of the 3‐tissue signal fraction and age minus the correlation coefficient of WMSA volume and age. We repeated that process 10,000 times and used the empirical distribution of the 10,000 differences to compute a 90% confidence interval for the difference between the two correlation coefficients. If the interval contained the value 0, we could affirm that the correlation coefficients were statistically equivalent. A similar bootstrap approach was performed to compare the correlation coefficients between cognitive performance (assessed by PCv RT or MMSE) and WMSA volume vs. cognitive performance and the 3‐tissue signal fractions (Tw, TG, and TC). Finally, we report a correlation matrix representing the Spearman correlation coefficient among all clinical, neuropsychological, and MRI variables of interest in this study to summarize all findings as well as shed light onto the associations between these variables and vascular risk factors.
Adjustment for multiple testing was performed using the false discovery rate (FDR) procedure (Benjamini & Hochberg, 1995). Since the p‐threshold adjustment for significance under the Benjamini–Hochberg procedure not only depends on the number of tests but also on the calculated p‐value for each test, original/uncorrected p‐values were reported and only the significant ones after correction were highlighted in bold. The adjusted threshold under which a p‐value is declared significant after the FDR correction is reported in the legend of each table/figure.
3. RESULTS
3.1. Participants' characteristics
Table 1 shows the demographic and clinical characteristics of the whole sample as well as the comparison between individuals below and above 60 years old. As expected, there were significant age‐related differences in global cognitive performance (p < .001 for MMSE) and processing speed (p < .001 for PCv RT), with older participants showing worse performance. Relative to participants younger than 60, participants older than 60 years more frequently had vascular risk factors present.
TABLE 1.
Demographics and basic clinical characteristics of the cohort.
| Whole sample (n = 184) | Individuals under the age of 60 (n = 132) | Individuals above the age of 60 (n = 52) | p‐value | |
|---|---|---|---|---|
| Age [35–76] | 53.80 ± 9.63 | 48.89 ± 5.89 | 66.29 ± 4.72 | / |
| Sex (N of woman) | 101 | 73 [55.3%] | 28 [53.8%] | .99 |
| Information (WAIS‐III) | 16.99 ± 5.78 | 16.89 ± 5.68 | 17.23 ± 6.08 | .64 |
| BDRS | 0.54 ± 0.89 | 0.49 ± 0.83 | 0.66 ± 1.02 | .29 |
| FAQ | 0.25 ± 0.59 | 0.28 ± 0.63 | 0.19 ± 0.44 | .57 |
| MMSE | 28.94 ± 1.12 | 29.15 ± 0.98 | 28.40 ± 1.27 | <.001 |
| PcVRT | 473.05 ± 80.22 | 456.46 ± 60.82 | 515.15 ± 105.22 | <.001 |
| Vascular risk factors | ||||
| History of stroke | 1 [0.54%] | 0 [0%] | 1 [0.1%] | / |
| History of cholesterol | 38 [20.6%] | 21 [15.9%] | 17 [32.7%] | <.05 |
| History of hypertension | 38 [20.6%] | 15 [11.3%] | 23 [44.2%] | <.001 |
| History of diabetes | 4 [2.17%] | 0 [0%] | 4 [0.7%] | / |
Note: Values correspond to the mean ± standard deviation except for sex and vascular risk factors (count [percentage] is reported instead). p‐value corresponds to results of group comparisons between individuals below and above 60 years old. No statistical analysis was done on the variables, history of stroke, and history of diabetes due to the low number of cases with a positive history in these variables. Results with uncorrected p < .05 are shown. Significant results after FDR are highlighted in bold. The adjusted threshold with FDR is p = .025.
Abbreviations: BDRS, blessed dementia rating scale; FDR, false discovery rate; FAQ, functional activities questionnaire; MMSE, mini‐mental state examination; PcV RT, personal computer Vienna reaction time; WAIS‐III, Wechsler adult intelligence scale (WAIS‐III).
Table 2 shows the MRI characteristics of the cohort. As expected, there were significant age‐related differences in WMSA volume (p < .001) and in Tw in NAWM (p < .001). Participants older than 60 years also had significantly higher TG in both NAWM and WMSA, compared to participants younger than 60 years.
TABLE 2.
MRI characteristics of the cohort.
| Whole sample (n = 184) | Individuals under the age of 60 (n = 132) | Individuals above the age of 60 (n = 52) | p‐value | |
|---|---|---|---|---|
| WMSA volume | 1740.10 ± 1427.20 | 1377.41 ± 1047.14 | 2660.71 ± 1813.21 | <.001 |
| Tw in WMSA | 0.63 ± 0.07 | 0.64 ± 0.07 | 0.62 ± 0.07 | .23 |
| TG in WMSA | 0.12 ± 0.04 | 0.12 ± 0.04 | 0.14 ± 0.05 | <.01 |
| TC in WMSA | 0.24 ± 0.07 | 0.24 ± 0.07 | 0.24 ± 0.07 | .45 |
| Tw in NAWM | 0.91 ± 0.02 | 0.92 ± 0.02 | 0.89 ± 0.02 | <.001 |
| TG in NAWM | 0.06 ± 0.02 | 0.06 ± 0.02 | 0.08 ± 0.02 | <.001 |
| TC in NAWM | 0.02 ± 0.004 | 0.02 ± 0.004 | 0.02 ± 0.006 | .83 |
Note: Values correspond to the mean ± standard deviation. p‐value corresponds to results from group comparisons between individuals below and above 60 years old. WMSA refers to white matter signal abnormalities; NAWM refers to normal‐appearing white matter; Tw, TG, and TC refer to the tissue signal fractions of the white matter‐like, gray matter‐like, and cerebrospinal fluid (CSF)‐like diffusion signals, respectively. Results with uncorrected p < .05 are shown. Significant results after false discovery rate (FDR) are in bold. Adjusted threshold with FDR is p = .029 for all MRI variables.
3.2. Association of age with 3‐tissue compositions of WMSA and normal‐appearing white matter and WMSA volume
Age was negatively associated with Tw in normal‐appearing white matter and positively associated with TG in both WMSA and normal‐appearing white matter (Table 2, Figure 2). In addition, age was significantly associated with WMSA volume (r = 0.504, p < .001). The 90% bootstrap empirical confidence interval on the difference between the correlation of TG in normal‐appearing white matter and age and the correlation of WMSA volume and age is [−0.165, 0.075]. We can therefore affirm that the correlations are statistically comparable. The other five confidence intervals do not contain the value 0, and hence, we cannot conclude on statistical equivalence.
FIGURE 2.
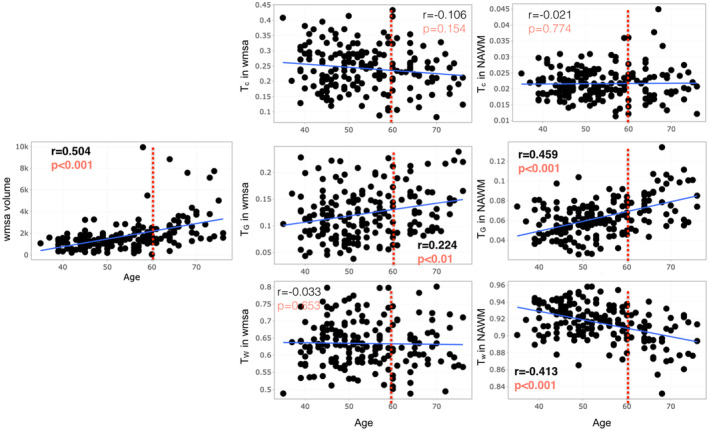
Scatter plots for Spearman correlation analysis of age with the relative 3‐tissue signal fractions (Tw, TG, and TC) within white matter signal abnormalities (WMSA) and normal‐appearing white matter as well as WMSA volume. WMSA refers to white matter signal abnormalities; NAWM refers to normal‐appearing white matter; Tw, TG, and TC mean tissue fractions of the white matter, gray matter, and cerebrospinal fluid (CSF), respectively. Results with uncorrected p < .05 are shown. Significant results after FDR are in bold red. Adjusted thresholds with FDR are p = .028.
3.3. Association of 3‐tissue compositions of WMSA and normal‐appearing white matter and WMSA volume with cognitive function
Figure 3 shows that higher PcV RT is associated with lower Tw in normal‐appearing white matter (r = −0.201, p = .006, Figure 3) as well as higher TG in normal‐appearing white matter (r = 0.239, p = .001, Figure 3). Higher PcV RT is also associated with increased WMSA volume (r = 0.251, p < .001). A similar trend can be seen regarding MMSE in relation to Tw in normal‐appearing white matter and TG in normal‐appearing white matter (Figure 4). A lower MMSE score appears to be correlated with lower Tw in normal‐appearing white matter (r = 0.149, p = .042, Figure 4), along with a higher TG in normal‐appearing white matter (r = −0.176, p = .016, Figure 4), but these results did not maintain statistical significance following FDR correction.
FIGURE 3.
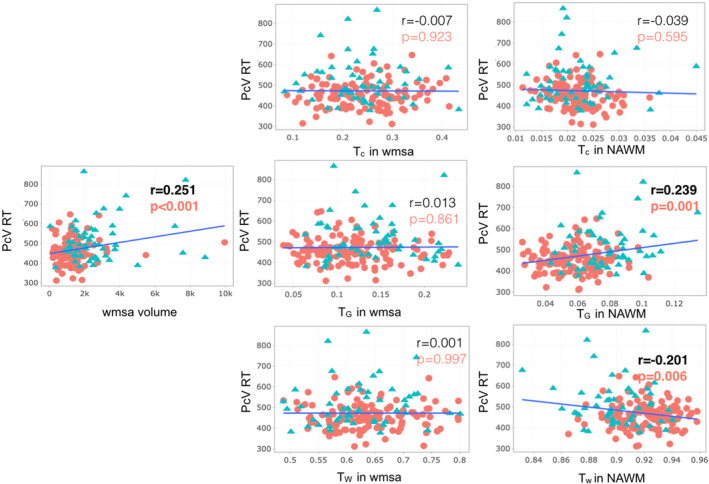
Scatter plots for Spearman correlation analysis of Pc Vienna System Reaction time (PCv RT) with the relative 3‐tissue signal fractions (Tw, TG, and TC) within white matter signal abnormalities (WMSA) and normal‐appearing white matter as well as WMSA volume. PcV RT, Personal computer Vienna Reaction time; WMSA refers to white matter signal abnormalities; NAWM refers to normal‐appearing white matter; Tw, TG, and TC mean tissue fractions of the white matter, gray matter, and cerebrospinal fluid (CSF), respectively. Results with uncorrected p < .05 are shown. Significant results after false discovery rate (FDR) are in bold red. The adjusted threshold with FDR is p = .01. Color code: red circle refers to participants under 60 years old, and blue triangle refers to participants older than 60. WMSA volume is in mm3.
FIGURE 4.
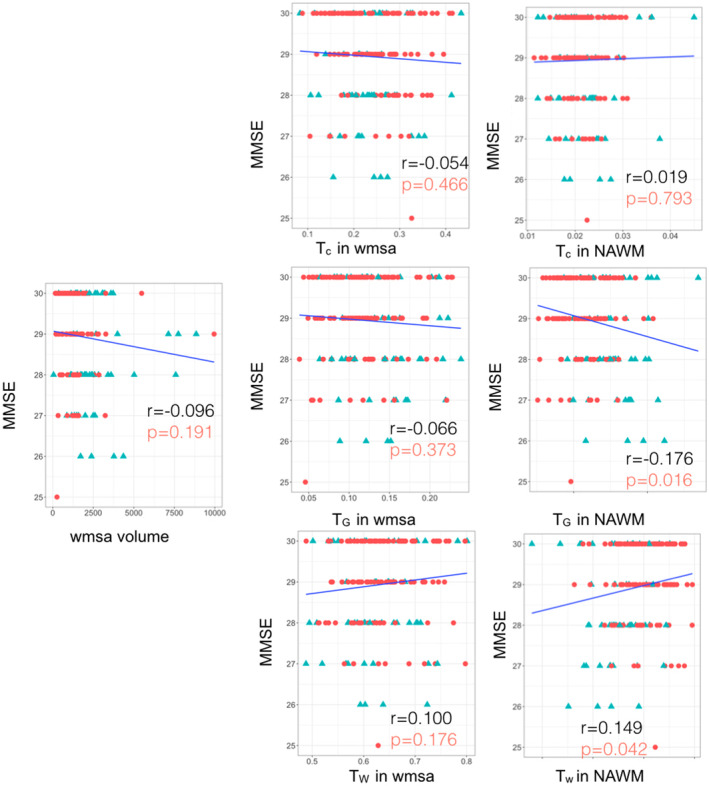
Scatter plots for Spearman correlation analysis of MMSE with the relative 3‐tissue signal fractions (Tw, TG, and TC) within white matter signal abnormalities (WMSA) and normal‐appearing white matter as well as WMSA volume. Mini‐mental state examination (MMSE); WMSA refers to white matter signal abnormalities; NAWM refers to normal‐appearing white matter; Tw, TG, and TC mean tissue fractions of the white matter, gray matter, and cerebrospinal fluid (CSF), respectively. Results with uncorrected p < .05 are shown. Significant results after false discovery rate (FDR) are in bold red. The adjusted threshold with FDR is p = .01. Color code: red circle refers to participants under 60 years old, and blue triangle refers to participants older than 60.
The 90% bootstrap empirical confidence interval on the difference between the correlation of TC, or TG, or TW in normal‐appearing white matter and PcV and the correlation of WMSA volume and PcV is [−0.371, 0.008; −0.290, 0.021; −0.284, 0.047], respectively. These correlations are hence statistically equivalent. A similar result was found between the correlation of TG in WMSA and PcV and the correlation of WMSA volume and PcV is [−0,115, 0,131].
The 90% bootstrap empirical confidence interval on the difference between the correlation of TC, or TG, in normal‐appearing white matter and MMSE and the correlation of WMSA volume and MMSE is [−0.056, 0.306; −0.190, 0.079], respectively, which means that these correlations are statistically equivalent. Similar results were found between the correlation of TC, or TG, in WMSA and MMSE and the correlation of WMSA volume and MMSE [−0.149, 0.246; −0.128, 0.183].
Figure S1 shows that both high cholesterol and hypertension were also associated with WMSA volume in our participants, and as such, that participants with a higher WMSA volume more often reported to have high cholesterol and hypertension. High cholesterol was also found to be associated with TG in normal‐appearing white matter Figure S1.
4. DISCUSSION
4.1. The association of age with 3‐tissue metrics is in contrast to the association of age with WMSA volume
This study provides evidence on the statistically significant association between age and WMSA volume, which is an established finding (Zhuang et al., 2018). Indeed, WMSA are frequent in the brains of elderly individuals but are also seen in middle‐aged individuals (Ferreira et al., 2017; Williams et al., 2010). In addition, WMSA have been consistently associated with a broad spectrum of outcomes such as subtle functional impairment, variability in cognitive performance, cognitive decline and dementia, and even with a high prevalence of neuropsychiatric disorders such as major depressive disorder and schizophrenia (Benedictus et al., 2015; Chang et al., 2015; Grangeon et al., 2010; Smith et al., 2016; Yoon et al., 2014; Zhuang et al., 2018). However, the clinical manifestations of WMSA that arise solely with age are still a matter of debate. In this regard, our current cohort was cognitively unimpaired and has no clinical manifestations suggestive of neurological or psychiatric disorders.
In this study, we moved beyond the WMSA volume measure to further understand age‐related changes behind WMSA and cognitive performance. We did so by investigating the complete 3‐tissue diffusion signal composition (Tw, TG, and TC) to characterize the microstructural properties of normal‐appearing white matter and WMSA, for the first time in cognitively unimpaired individuals. This allowed us to interpret the results based on how alike the diffusion signal properties were to those derived from normal white matter, grey matter, and CSF (or free water). Using these metrics have advantages over WMSA volume measure in revealing additional information about abnormalities or changes in WM that otherwise looks normal (not captured or represented in the WMSA volume measure). As expected, age was negatively associated with normal‐appearing white matter Tw, the fraction that has microstructural characteristics of average WM that is reflecting healthy WM. More specifically, participants older than 60 years old had a lower Tw in NAWM than younger individuals. This finding provides good support for the validity of the imaging method and suggests an older/more degenerated WM tissue with increasing age. Interestingly, age was positively associated with an increase in TG in both WMSA and normal‐appearing white matter. These results for WMSA and normal‐appearing white matter are likely due to different underlying mechanisms. The increase in TG seen in WMSA should be interpreted as a tissue shift toward diffusion characteristics like that of the gray matter tissue, deviating from the white matter‐like signal. We previously suggested that an increase in TG could be compatible with astrogliosis (Mito et al., 2020), as the proliferation of glial cells is known to be a characteristic of WMSA (Fazekas et al., 1998). Proliferation of glial cells has a similar profile as grey matter cells on the diffusion data, that is, increased diffusivity and reduced anisotropy relative to healthy normal‐appearing white matter. However, several histopathological studies have shown that WMSA exhibit a broad range of neuropathological features beyond proliferation of glial cells, reflecting the heterogeneity of WMSA. Some alternative explanations are related to diffuse myelin rarefaction (Román, 1991), progressive subcortical gliosis (Brun & Englund, 1986), dilatation of perivascular spaces (Marín‐Padilla & Knopman, 2011), and varying degrees of demyelination (Fazekas et al., 1998). Dilatation of perivascular spaces and myelin or axonal loss would in contrast likely be accompanied by increases in interstitial fluid and reflected by an increase in the TC fraction (representing free water), as previously shown in periventricular white matter lesions in Alzheimer's disease (Mito et al., 2020). Interestingly, Khan et al. also previously reported increases not only in TG but also in TC in periventricular WMSA in stroke patients (Khan et al., 2020). This study suggested that thin rims of periventricular tissue are characterized by subependymal gliosis associated with the loss of the ependymal lining, whereas periventricular caps and irregular patches exhibit myelin pallor that may be linked to secondary changes from the transependymal movement of fluid into the periventricular region (Chimowitz et al., 1992; Kertesz et al., 1988; Khan et al., 2020). Since we did not find any association of TC with age in our current study, it is possible that increases in TG reflect a very early event of glial proliferation in cognitively unimpaired individuals, which extends to increases in interstitial fluid and myelin or axonal loss reflected by the TC metric in pathological populations such as stroke.
It is worth noting that vascular risk factors are known to be important contributors to the development and progression of WMSA (Fu et al., 2005; Khan et al., 2020; Pantoni & Garcia, 1997). Our study confirms this affirmation and even shows that WMSA is more influenced by vascular risk factors than any 3‐tissue metrics. The 3‐tissue metrics can therefore be of great value for future studies looking at white matter degeneration that is not primarily related to cardiovascular diseases and risk factors. Nevertheless, our study highlights that hypercholesterolemia may be associated with increased gliosis as reflected by an increase in TG.
In addition to the age‐related differences behind WMSA, we also found an age‐related increase in TG in normal‐appearing white matter. Although the correlation between age and WMSA volume is stronger than age and TG in normal‐appearing white matter, similar correlations were detected and the later gives more detailed information about the underlying relationship between age and white matter microstructure. We speculate that such an increase could explain an early process of white matter tissue degeneration (e.g., relatively less axonal matter, with the “freed up space” being filled partially with other (glial) cells). However, it is also possible that preceding pathological alterations may be present in normal‐appearing white matter adjacent to WMSA. Indeed, previous studies have suggested that WMSA may only represent an extreme end of pathophysiological changes in white matter (O'Sullivan et al., 2001). Our results suggest that it may be possible to detect very early microstructural changes in normal‐appearing white matter that precede the development of WMSA on conventional MRI. This should be tested on longitudinal studies, consistent with previous DTI reports showing that white matter microstructural changes precede the development of WMSA visible on FLAIR imaging (Maillard et al., 2014).
4.2. The association of cognitive measures with 3‐tissue metrics in contrast to the association of cognitive measures with WMSA volume
The brain can be seen as a network of neurons connected by white matter bundles that are able to transfer information (Mesulam, 1990). Therefore, white matter changes play an important role in age‐related cognitive decline. By measuring water self‐diffusion in white matter tracts, diffusion MRI is particularly useful for the investigation of microstructural changes related to aging. In particular, DTI studies have highlighted that altered white matter microstructure contributes to a disconnection among distributed neural systems, with a consistent effect on processing speed and executive function (Badji et al., 2019; Charlton et al., 2006; Madden et al., 2009; Tarumi et al., 2015; Vernooij et al., 2009). In addition, the literature suggests that the relationship between white matter microstructure and cognition exhibits an anterior–posterior gradient (Madden et al., 2009). However, as mentioned previously, DTI metrics (e.g., FA) are not specific and, therefore, the underlying mechanisms behind age‐related differences in cognition are still poorly understood.
White matter signal abnormalities are common among older adults and have been correlated with lower cognitive performance (DeCarli et al., 1995; Gunning‐Dixon et al., 2009; Madden et al., 2009), which is in line with our current finding for WMSA volume and PcV RT. The present study is to the best of our knowledge the first study to further investigate age‐related differences in cognition using SS3T‐CSD‐derived 3‐tissue signal fractions and map the corresponding distinct 3‐tissue profile in cognitively unimpaired individuals. We found that the age‐related differences in processing speed were associated with a lower Tw (i.e., more degenerated white matter) as well as a higher TG in normal‐appearing white matter. Similar trends were found with general cognition (assessed by MMSE). However, the results were not significant after correction for multiple comparisons. This result is in line with the hypothesis that astrogliosis, as captured by increases in TG in normal‐appearing white matter, reflects early microstructural changes before the likely appearance of irreversible WMSA.
It is worth noting that the 3‐tissue metrics were able to capture associations with both cognitive tests (PcV RT and MMSE), while WMSA volume only captured a significant association with PcV RT. This is relevant since MMSE is known to not be very sensitive to detect subtle cognitive changes in healthy individuals. Perhaps, the 3‐tissue metrics can capture different pathological changes in the brain with a subclinical cognitive correlate in individuals who are still within the normal range of cognitive performance. In addition, the correlation coefficient of the association between MMSE and TG in normal‐appearing white matter was found higher than the one for WMSA volume, which means that TG in normal‐appearing white matter as a significantly greater correlation with MMSE than WMSA volume. This is very important and promoting the importance of the 3‐tissue signal fractions.
4.3. Probing microstructure with diffusion MRI
An important result of the present study was to confirm the feasibility of SS3T‐CSD in assessing the microstructural heterogeneity of the white matter in vivo in cognitively healthy individuals who do not have prominent WMSA or WM changes, in contrast to previously studied cohorts of patients with Alzheimer's disease and Stroke (Khan et al., 2020; Mito et al., 2020). The limited understanding of the contribution of WMSA to aging or neurodegenerative diseases including Alzheimer's disease could be due to the simplistic way in which these lesions are usually investigated in vivo (e.g., volume of hyperintense or hypointense WMSA), despite post‐mortem evidence indicating that they are pathologically complex (Braffman et al., 1988; Fazekas et al., 1993; Gouw et al., 2008). To the best of our knowledge, this is only the third study in the literature, showing that diffusion MRI could function as an in vivo probe to assess the heterogeneity of white matter microstructure within WMSA and normal‐appearing white matter. It is also the first study using SS3T‐CSD in the field of normal aging (cognitively unimpaired individuals). The other two previous studies using SS3T‐CSD were successfully conducted in stroke and Alzheimer's disease patients using high‐resolution diffusion data (Khan et al., 2020; Mito et al., 2020) On the contrary, our study is the first one showing the feasibility of SS3T‐CSD using standard‐resolution “real‐world” diffusion MRI (i.e., single‐shell, low b‐value (b = 1000) and non‐isotropic resolution), for the purpose of analyzing 3‐tissue signal fractions.
Previous diffusion MRI studies have attempted to investigate changes in the white matter microstructure using DTI through metrics such as fractional anisotropy and/or mean diffusivity (Altamura et al., 2016; de Groot et al., 2000; Poulakis et al., 2021; Taylor et al., 2007). However, the diffusion tensor is a limited model that cannot properly describe the white matter microstructure in voxels containing more than one fibre population (a.k.a. most white matter voxels) (Jeurissen et al., 2013; Jones et al., 2013; Mito et al., 2020). In addition, despite their sensitivity to the white matter microstructure, DTI metrics lack specificity, which hampers our ability to interpret them reliably and can in many cases be misleading (Badji & Westman, 2020). For instance, a reduction in FA may be due to a reduction in neurite density or an increase in the dispersion of neurite orientation distribution (Beaulieu, 2009). Furthermore, fiber‐specific damage to axons can even result in increases of FA when a crossing‐fiber geometry is present. In contrast, the SS3T‐CSD methodology used in our current study allowed us to investigate the white matter microstructure by means of tissue signal fractions (Dhollander & Connelly, 2016a, 2016b; Dhollander et al., 2017). One of the main advantages of this method is its ability to fit the white matter signal in voxels that also contain other tissue types, by incorporating different tissue compartments in addition to white matter in the signal. This is done using single‐shell data alone, enabling both a shorter acquisition time and the ability to distinguish between different processes behind homogeneous appearance on conventional MRI (Mito et al., 2020).
4.4. Limitations and future directions
This work represents the initial exploration of the age‐related changes in the WM microstructure using SS3T‐CSD‐derived 3‐tissue signal fractions, which provided valuable information on WM microstructural changes underlying age‐related differences in processing speed and global cognition, and independent of vascular risk factors. However, several limitations should be highlighted. Firstly, we should mention that diffusion MRI is known to have geometrical distortion, we thoroughly assessed for the co‐registration of T1 and b0, and then, the registration of our tissue fractions with T1 to ensure reliable alignment (see Figure S2). Data can be provided upon request for verification. We also created an FOD template using population template in MRtrix by manually selecting a subgroup of 30 participants. All metrics of interest were registered to this template, and we rigorously checked that all tissue fractions were aligned with this template. Afterward, we looked at the relationship between age and the tissue fractions computed in both T1 space and template space and confirmed that the results were similar despite different registration procedure (Figures S3 and S4). Secondly, the accurate quantification of 3‐tissue metrics using SS3T‐CSD in regions with crossing‐fiber tracts or low SNR can be challenging. Specialized diffusion imaging techniques, like multi‐shell or multi‐tissue approaches, may provide more suitable metrics than single‐shell diffusion protocols and should be considered in future studies using our pipeline. Thirdly, although we interpret our results based on how alike the diffusion signal properties derived from normal white matter, gray matter, and CSF are, we cannot directly infer an interpretation of the results in terms of their pathological basis. As such, future work that correlates the tissue fractions metrics with post‐mortem histology is needed to validate their interpretation within this specific context. The major advantage of characterizing the white matter microstructure using this 3‐tissue signal representation is that we were able to identify the heterogeneity within WMSA that could not be identified with the well‐stablished measure of WMSA volume or other common in vivo imaging techniques. However, distinguishing between different (types of) white matter lesions would have been interesting given that some lesions are believed to be more closely associated with neurodegeneration, whereas others are thought to be less deleterious (Fazekas et al., 1987). Future work that characterizes lesions based on their location (e.g., periventricular vs. deep or based on their distance from the ventricular surface) may provide additional insight into age‐related changes in the white matter microstructure. Finally, while this work is a proof of concept for the feasibility of SS3T‐CSD to probe the microstructural heterogeneity of the white matter in vivo using standard‐resolution diffusion MRI, we did not compare our findings with diffusion MRI acquired at higher b‐values or with resolutions below a 2‐mm isotropic voxel. Higher b‐values give better fiber orientation estimations by means of increased signal contrast, particularly in regions with crossing‐fiber populations. In addition, higher b‐values imply an increased contrast‐to‐noise ratio, which is beneficial for any CSD method to properly resolve the WM fiber orientation distributions. Future work using SS3T‐CSD on standard‐resolution “real‐world” diffusion MRI could consider comparing their results with diffusion data acquired with data with higher b‐values.
5. CONCLUSION
Using SS3T‐CSD, we demonstrate that microstructural heterogeneity within normal‐appearing white matter and WMSA is associated with increasing age and cognitive decline, in cognitively unimpaired individuals. Furthermore, the 3‐tissue signal fractions were more specific to potential underlying white matter alterations than conventional MRI measures such as WMSA volume. These findings also support the view that the WMSA volumes are heterogeneous and may be more influenced by vascular risk factors than the 3‐tissue metrics. Finally, the 3‐tissue metrics were able to capture associations with cognitive tests (PcV RT and MMSE) and therefore capable of capturing subtle pathological changes in the brain in individuals who are still within the normal range of cognitive performance.
CONFLICT OF INTEREST STATEMENT
There is no conflict of interest.
Supporting information
Data S1. Supporting Information.
Data S2. Supporting Information.
Data S3. Supporting Information.
Data S4. Supporting Information.
ACKNOWLEDGMENTS
This study was funded by the Swedish Foundation for Strategic Research (SSF); the Strategic Research Programme in Neuroscience at Karolinska Institutet (StratNeuro); the Swedish Research Council (VR); the regional agreement on medical training and clinical research (ALF) between Stockholm County Council and Karolinska Institutet; Center for Medical Innovation (CIMED); the Swedish Alzheimer Foundation; the Swedish Brain Foundation; the Swedish Parkinson's foundation (Parkinsonfonden); King Gustaf V:s and Queen Victorias Foundation; Demensfonden; Stiftelsen Olle Engkvist Byggmästare; Birgitta och Sten Westerberg; Foundation for Geriatric Diseases at Karolinska Institutet; Loo och Hans Ostermans stiftelse för medicinsk forskning; Stiftelsen Gamla Tjänarinnor; Gun & Bertil Stohnes Stiftelse; and Neuro‐fonden. The authors would like to thank Dr. Antonio Rodríguez for providing access to participants and helpful assistance; the Servicio de Resonancia Magnética para Investigaciones Biomédicas del SEGAI (University of La Laguna, Spain); and Lucio Diaz‐Flores for radiological assessment of the MRI scans. Data used in preparation of this article are part of the GENIC database (Group of Neuropsychological Studies of the Canary Islands, University of La Laguna, Spain. Principal investigators: Dr. José Barroso and Dr. Daniel Ferreira. Contact: Dr. Daniel Ferreira, daniel.ferreira.padilla@ki.se). The following collaborators contributed to the GENIC database but did not participate in analysis or writing of this report (in alphabetic order by family name): Rut Correia, Patricia Diaz, Aida Figueroa, Nerea Figueroa, Eloy García, Lissett González, Teodoro González, Zaira González, Cathaysa Hernández, Edith Hernández, Nira Jiménez, Judith López, Cándida Lozano, Alejandra Machado, Yaiza Molina, María Antonieta Nieto, Roraima Pérez, María Sabucedo, Elena Sirumal, Marta Suárez, Manuel Urbano, and Pedro Velasco.
Badji, A. , Cedres, N. , Muehlboeck, J.‐S. , Khan, W. , Dhollander, T. , Barroso, J. , Ferreira, D. , & Westman, E. (2024). In vivo microstructural heterogeneity of white matter and cognitive correlates in aging using tissue compositional analysis of diffusion magnetic resonance imaging. Human Brain Mapping, 45(4), e26618. 10.1002/hbm.26618
Daniel Ferreira and Eric Westman are shared senior authors.
DATA AVAILABILITY STATEMENT
The data that support the findings of this study are available on request from the corresponding author. The data are not publicly available due to privacy or ethical restrictions.
REFERENCES
- Abe, O. , Yamasue, H. , Aoki, S. , Suga, M. , Yamada, H. , Kasai, K. , Masutani, Y. , Kato, N. , Kato, N. , & Ohtomo, K. (2008). Aging in the CNS: Comparison of gray/white matter volume and diffusion tensor data. Neurobiology of Aging, 29, 102–116. [DOI] [PubMed] [Google Scholar]
- Altamura, C. , Scrascia, F. , Quattrocchi, C. C. , Errante, Y. , Gangemi, E. , Curcio, G. , Ursini, F. , Silvestrini, M. , Maggio, P. , Beomonte Zobel, B. , Rossini, P. M. , Pasqualetti, P. , Falsetti, L. , & Vernieri, F. (2016). Regional MRI diffusion, White‐matter Hyperintensities, and cognitive function in Alzheimer's disease and vascular dementia. Journal of Clinical Neurology, 12, 201–208. [DOI] [PMC free article] [PubMed] [Google Scholar]
- Andersson, J. L. R. , & Sotiropoulos, S. N. (2016). An integrated approach to correction for off‐resonance effects and subject movement in diffusion MR imaging. NeuroImage, 125, 1063–1078. [DOI] [PMC free article] [PubMed] [Google Scholar]
- Avants, B. B. , Tustison, N. J. , Stauffer, M. , Song, G. , Wu, B. , & Gee, J. C. (2014). The insight ToolKit image registration framework. Frontiers in Neuroinformatics, 8, 44. [DOI] [PMC free article] [PubMed] [Google Scholar]
- Badji, A. , Pereira, J. B. , Shams, S. , Skoog, J. , Marseglia, A. , Poulakis, K. , Rydén, L. , Blennow, K. , Zetterberg, H. , Kern, S. , Zettergren, A. , Wahlund, L. O. , Girouard, H. , Skoog, I. , & Westman, E. (2021). Cerebrospinal fluid biomarkers, brain structural and cognitive performances between normotensive and hypertensive controlled, uncontrolled and untreated 70‐year‐old adults. Frontiers in Aging Neuroscience, 13, 777475. [DOI] [PMC free article] [PubMed] [Google Scholar]
- Badji, A. , Sabra, D. , Bherer, L. , Cohen‐Adad, J. , Girouard, H. , & Gauthier, C. J. (2019). Arterial stiffness and brain integrity: A review of MRI findings. Ageing Research Reviews, 53, 100907. [DOI] [PubMed] [Google Scholar]
- Badji, A. , & Westman, E. (2020). Cerebrovascular pathology in Alzheimer's disease: Hopes and gaps. Psychiatry Research: Neuroimaging, 306, 111184. [DOI] [PubMed] [Google Scholar]
- Beaulieu, C. (2009). Chapter 6‐the biological basis of diffusion anisotropy. In Johansen‐Berg H. & Behrens T. E. J. (Eds.), Diffusion MRI (pp. 105–126). Academic Press. [Google Scholar]
- Benedictus, M. R. , van Harten, A. C. , Leeuwis, A. E. , Koene, T. , Scheltens, P. , Barkhof, F. , Prins, N. D. , & van der Flier, W. M. (2015). White matter Hyperintensities relate to clinical progression in subjective cognitive decline. Stroke, 46, 2661–2664. [DOI] [PubMed] [Google Scholar]
- Benjamini, Y. , & Hochberg, Y. (1995). Controlling the false discovery rate: A practical and powerful approach to multiple testing. Journal of the Royal Statistical Society: Series B (Methodological), 57(1), 289–300. [Google Scholar]
- Blessed, G. , Tomlinson, B. E. , & Roth, M. (1968). The association between quantitative measures of dementia and of senile change in the cerebral grey matter of elderly subjects. The British Journal of Psychiatry, 114, 797–811. [DOI] [PubMed] [Google Scholar]
- Bombois, S. , Debette, S. , Delbeuck, X. , Bruandet, A. , Lepoittevin, S. , Delmaire, C. , Leys, D. , & Pasquier, F. (2007). Prevalence of subcortical vascular lesions and association with executive function in mild cognitive impairment subtypes. Stroke, 38, 2595–2597. 10.1161/strokeaha.107.486407 [DOI] [PubMed] [Google Scholar]
- Bonte, S. , Vandemaele, P. , Verleden, S. , Audenaert, K. , Deblaere, K. , Goethals, I. , & Van Holen, R. (2017). Healthy brain ageing assessed with 18F‐FDG PET and age‐dependent recovery factors after partial volume effect correction. European Journal of Nuclear Medicine and Molecular Imaging, 44, 838–849. 10.1007/s00259-016-3569-0 [DOI] [PubMed] [Google Scholar]
- Braffman, B. H. , Zimmerman, R. A. , Trojanowski, J. Q. , Gonatas, N. K. , Hickey, W. F. , & Schlaepfer, W. W. (1988). Brain MR: Pathologic correlation with gross and histopathology. 2. Hyperintense white‐matter foci in the elderly. American Journal of Roentgenology, 151, 559–566. 10.2214/ajr.151.3.559 [DOI] [PubMed] [Google Scholar]
- Brands, A. M. A. , Kessels, R. P. C. , Hoogma, R. P. L. M. , Henselmans, J. M. L. , van der Beek Boter, J. W. , Kappelle, L. J. , de Haan, E. H. F. , & Biessels, G. J. (2006). Cognitive performance, psychological well‐being, and brain magnetic resonance imaging in older patients with type 1 diabetes. Diabetes, 55, 1800–1806. [DOI] [PubMed] [Google Scholar]
- Brun, A. , & Englund, E. (1986). A white matter disorder in dementia of the Alzheimer type: A pathoanatomical study. Annals of Neurology, 19, 253–262. [DOI] [PubMed] [Google Scholar]
- Cedres, N. , Ferreira, D. , Machado, A. , Shams, S. , Sacuiu, S. , Waern, M. , Wahlund, L.‐O. , Zettergren, A. , Kern, S. , Skoog, I. , & Westman, E. (2020). Predicting Fazekas scores from automatic segmentations of white matter signal abnormalities. Aging, 12, 894–901. [DOI] [PMC free article] [PubMed] [Google Scholar]
- Cedres, N. , Machado, A. , Molina, Y. , Diaz‐Galvan, P. , Hernández‐Cabrera, J. A. , Barroso, J. , Westman, E. , & Ferreira, D. (2019). Subjective cognitive decline below and above the age of 60: A multivariate study on neuroimaging, cognitive, clinical, and demographic measures. Journal of Alzheimer's Disease, 68, 295–309. [DOI] [PubMed] [Google Scholar]
- Chang, K. J. , Lee, S. , Lee, Y. , Lee, K. S. , Hwan Back, J. , Jung, Y. K. , Lim, K. Y. , Noh, J. S. , Kim, H. C. , Roh, H. W. , Choi, S. H. , Kim, S. Y. , Joon Son, S. , & Hong, C. H. (2015). Severity of white matter hyperintensities and length of hospital stay in patients with cognitive impairment: A CREDOS (clinical research Center for Dementia of South Korea) study. Journal of Alzheimer's Disease, 46, 719–726. [DOI] [PubMed] [Google Scholar]
- Charlton, R. A. , Barrick, T. R. , McIntyre, D. J. , Shen, Y. , O'Sullivan, M. , Howe, F. A. , Clark, C. A. , Morris, R. G. , & Markus, H. S. (2006). White matter damage on diffusion tensor imaging correlates with age‐related cognitive decline. Neurology, 66, 217–222. [DOI] [PubMed] [Google Scholar]
- Chimowitz, M. I. , Estes, M. L. , Furlan, A. J. , & Awad, I. A. (1992). Further observations on the pathology of subcortical lesions identified on magnetic resonance imaging. Archives of Neurology, 49, 747–752. [DOI] [PubMed] [Google Scholar]
- Correia, R. , Nieto, A. , Ferreira, D. , Sabucedo, M. , & Barroso, J. (2015). Fund of Information is more strongly associated with neuropsychological functioning than education in older Spanish adults. Archives of Clinical Neuropsychology, 30, 310–321. [DOI] [PubMed] [Google Scholar]
- Cummings, J. , Lee, G. , Ritter, A. , Sabbagh, M. , & Zhong, K. (2019). Alzheimer's disease drug development pipeline: 2019. Alzheimer's & Dementia, 5, 272–293. [DOI] [PMC free article] [PubMed] [Google Scholar]
- Davis, S. W. , Dennis, N. A. , Buchler, N. G. , White, L. E. , Madden, D. J. , & Cabeza, R. (2009). Assessing the effects of age on long white matter tracts using diffusion tensor tractography. NeuroImage, 46, 530–541. [DOI] [PMC free article] [PubMed] [Google Scholar]
- de Groot, J. C. , de Leeuw, F. E. , Oudkerk, M. , van Gijn, J. , Hofman, A. , Jolles, J. , & Breteler, M. M. (2000). Cerebral white matter lesions and cognitive function: The Rotterdam scan study. Annals of Neurology, 47, 145–151. [DOI] [PubMed] [Google Scholar]
- DeCarli, C. , Murphy, D. G. , Tranh, M. , Grady, C. L. , Haxby, J. V. , Gillette, J. A. , Salerno, J. A. , Gonzales‐Aviles, A. , Horwitz, B. , & Rapoport, S. I. (1995). The effect of white matter hyperintensity volume on brain structure, cognitive performance, and cerebral metabolism of glucose in 51 healthy adults. Neurology, 45, 2077–2084. [DOI] [PubMed] [Google Scholar]
- Dhollander, T. , & Connelly, A. (2016a). A novel iterative approach to reap the benefits of multi‐tissue CSD from just single‐shell (+b = 0) diffusion MRI data. In Proceedings of International Society of Magnetic Resonance in Medicine. ISMRM. [Google Scholar]
- Dhollander, T. , & Connelly, A. (2016b). Generating a T1‐like contrast using 3‐tissue constrained spherical deconvolution results from single‐shell (or multi‐shell). In Diffusion MR data, in: ISMRM workshop on breaking the barriers of diffusion MRI (p. 6). ISMRM. [Google Scholar]
- Dhollander, T. , Mito, R. , Raffelt, D. , & Connelly, A. (2019). Improved white matter response function estimation for 3‐tissue constrained spherical deconvolution. In Proceedings of the International Society for Magnetic Resonance in Medicine. ISMRM. [Google Scholar]
- Dhollander, T. , Raffelt, D. , & Connelly, A. (2017). Towards interpretation of 3‐tissue constrained spherical deconvolution results in pathology. In 25th International Society of Magnetic Resonance in Medicine 25, 1815. ISMRM. [Google Scholar]
- Dhollander, T. , Tabbara, R. , Rosnarho‐Tornstrand, J. , Tournier, J. D. , Raffelt, D. , & Connelly, A. (2021). Multi‐tissue log‐domain intensity and inhomogeneity normalisation for quantitative apparent fibre density. In 29th proceedings of International Society of Magnetic Resonance in Medicine 2472. ISMRM. [Google Scholar]
- Driscoll, I. , Davatzikos, C. , An, Y. , Wu, X. , Shen, D. , Kraut, M. , & Resnick, S. M. (2009). Longitudinal pattern of regional brain volume change differentiates normal aging from MCI. Neurology, 72, 1906–1913. [DOI] [PMC free article] [PubMed] [Google Scholar]
- Falahati, F. , Ferreira, D. , Soininen, H. , Mecocci, P. , Vellas, B. , Tsolaki, M. , Kłoszewska, I. , Lovestone, S. , Eriksdotter, M. , Wahlund, L.‐O. , Simmons, A. , Westman, E. , & AddNeuroMed consortium and the Alzheimer's Disease Neuroimaging Initiative . (2016). The effect of age correction on multivariate classification in Alzheimer's disease, with a focus on the characteristics of incorrectly and correctly classified subjects. Brain Topography, 29, 296–307. [DOI] [PMC free article] [PubMed] [Google Scholar]
- Fazekas, F. , Chawluk, J. B. , & Alavi, A. (1987). MR signal abnormalities at 1.5 T in Alzheimer's dementia and normal aging. American Journalism, 149, 351–356. [DOI] [PubMed] [Google Scholar]
- Fazekas, F. , Kleinert, R. , Offenbacher, H. , Schmidt, R. , Kleinert, G. , Payer, F. , Radner, H. , & Lechner, H. (1993). Pathologic correlates of incidental MRI white matter signal hyperintensities. Neurology, 43, 1683–1689. [DOI] [PubMed] [Google Scholar]
- Fazekas, F. , Schmidt, R. , & Scheltens, P. (1998). Pathophysiologic mechanisms in the development of age‐related white matter changes of the brain. Dementia and Geriatric Cognitive Disorders, 9(Suppl 1), 2–5. [DOI] [PubMed] [Google Scholar]
- Ferreira, D. , Correia, R. , Nieto, A. , Machado, A. , Molina, Y. , & Barroso, J. (2015). Cognitive decline before the age of 50 can be detected with sensitive cognitive measures. Psicothema, 27, 216–222. [DOI] [PubMed] [Google Scholar]
- Ferreira, D. , Machado, A. , Molina, Y. , Nieto, A. , Correia, R. , Westman, E. , & Barroso, J. (2017). Cognitive variability during middle‐age: Possible association with neurodegeneration and cognitive reserve. Frontiers in Aging Neuroscience, 9, 188. [DOI] [PMC free article] [PubMed] [Google Scholar]
- Ferreira, D. , Molina, Y. , Machado, A. , Westman, E. , Wahlund, L.‐O. , Nieto, A. , Correia, R. , Junqué, C. , Díaz‐Flores, L. , & Barroso, J. (2014). Cognitive decline is mediated by gray matter changes during middle age. Neurobiology of Aging, 35, 1086–1094. [DOI] [PubMed] [Google Scholar]
- Ferreira, D. , Wahlund, L.‐O. , & Westman, E. (2018). The heterogeneity within Alzheimer's disease. Aging, 10, 3058–3060. [DOI] [PMC free article] [PubMed] [Google Scholar]
- Fischer, P. , Krampla, W. , Mostafaie, N. , Zehetmayer, S. , Rainer, M. , Jungwirth, S. , Huber, K. , Bauer, K. , Hruby, W. , Riederer, P. , & Tragl, K. H. (2007). VITA study: White matter hyperintensities of vascular and degenerative origin in the elderly. Journal of Neural Transmission. Supplementum, 181–188. [DOI] [PubMed] [Google Scholar]
- Fischl, B. , Salat, D. H. , Busa, E. , Albert, M. , Dieterich, M. , Haselgrove, C. , van der Kouwe, A. , Killiany, R. , Kennedy, D. , Klaveness, S. , Montillo, A. , Makris, N. , Rosen, B. , & Dale, A. M. (2002). Whole brain segmentation: Automated labeling of neuroanatomical structures in the human brain. Neuron, 33, 341–355. [DOI] [PubMed] [Google Scholar]
- Folstein, M. F. , Folstein, S. E. , & McHugh, P. R. (1975). Mini‐mental state. Journal of Psychiatric Research, 12, 189–198. 10.1016/0022-3956(75)90026-6 [DOI] [PubMed] [Google Scholar]
- Fu, J. H. , Lu, C. Z. , Hong, Z. , Dong, Q. , Luo, Y. , & Wong, K. S. (2005). Extent of white matter lesions is related to acute subcortical infarcts and predicts further stroke risk in patients with first ever ischaemic stroke. Journal of Neurology, Neurosurgery, and Psychiatry, 76, 793–796. [DOI] [PMC free article] [PubMed] [Google Scholar]
- Gouw, A. A. , van der Flier, W. M. , Fazekas, F. , van Straaten, E. C. W. , Pantoni, L. , Poggesi, A. , Inzitari, D. , Erkinjuntti, T. , Wahlund, L. O. , Waldemar, G. , Schmidt, R. , Scheltens, P. , Barkhof, F. , & LADIS Study Group . (2008). Progression of white matter hyperintensities and incidence of new lacunes over a 3‐year period: The Leukoaraiosis and disability study. Stroke, 39, 1414–1420. [DOI] [PubMed] [Google Scholar]
- Grangeon, M. C. , Seixas, C. , Quarantini, L. C. , Miranda‐Scippa, A. , Pompili, M. , Steffens, D. C. , Wenzel, A. , Lacerda, A. L. T. , & de Oliveira, I. R. (2010). White matter Hyperintensities and their association with Suicidally in major affective disorders: A meta‐analysis of magnetic resonance imaging studies. CNS Spectrums, 15, 375–381. [DOI] [PMC free article] [PubMed] [Google Scholar]
- Grieve, S. M. , Clark, C. R. , Williams, L. M. , Peduto, A. J. , & Gordon, E. (2005). Preservation of limbic and paralimbic structures in aging. Human Brain Mapping, 25, 391–401. [DOI] [PMC free article] [PubMed] [Google Scholar]
- Gunning‐Dixon, F. M. , Brickman, A. M. , Cheng, J. C. , & Alexopoulos, G. S. (2009). Aging of cerebral white matter: A review of MRI findings. International Journal of Geriatric Psychiatry, 24, 109–117. [DOI] [PMC free article] [PubMed] [Google Scholar]
- Jenkinson, M. , Bannister, P. , Brady, M. , & Smith, S. (2002). Improved optimization for the robust and accurate linear registration and motion correction of brain images. NeuroImage, 17, 825–841. [DOI] [PubMed] [Google Scholar]
- Jenkinson, M. , Beckmann, C. F. , Behrens, T. E. J. , Woolrich, M. W. , & Smith, S. M. (2012). FSL. Neuroimage, 62, 782–790. [DOI] [PubMed] [Google Scholar]
- Jenkinson, M. , & Smith, S. (2001). A global optimisation method for robust affine registration of brain images. Medical Image Analysis, 5, 143–156. [DOI] [PubMed] [Google Scholar]
- Jeurissen, B. , Leemans, A. , Tournier, J.‐D. , Jones, D. K. , & Sijbers, J. (2013). Investigating the prevalence of complex fiber configurations in white matter tissue with diffusion magnetic resonance imaging. Human Brain Mapping, 34, 2747–2766. [DOI] [PMC free article] [PubMed] [Google Scholar]
- Jones, D. K. , Knösche, T. R. , & Turner, R. (2013). White matter integrity, fiber count, and other fallacies: The do's and don'ts of diffusion MRI. NeuroImage, 73, 239–254. [DOI] [PubMed] [Google Scholar]
- Kellner, E. , Dhital, B. , Kiselev, V. G. , & Reisert, M. (2016). Gibbs‐ringing artifact removal based on local subvoxel‐shifts. Magnetic Resonance in Medicine, 76, 1574–1581. [DOI] [PubMed] [Google Scholar]
- Kertesz, A. , Black, S. E. , Tokar, G. , Benke, T. , Carr, T. , & Nicholson, L. (1988). Periventricular and subcortical Hyperintensities on magnetic resonance imaging. Archives of Neurology, 45, 404–408. [DOI] [PubMed] [Google Scholar]
- Khan, W. , Egorova, N. , Khlif, M. S. , Mito, R. , Dhollander, T. , & Brodtmann, A. (2020). Three‐tissue compositional analysis reveals in‐vivo microstructural heterogeneity of white matter hyperintensities following stroke. NeuroImage, 218, 116869. [DOI] [PubMed] [Google Scholar]
- King, K. S. , Peshock, R. M. , Rossetti, H. C. , McColl, R. W. , Ayers, C. R. , Hulsey, K. M. , & Das, S. R. (2014). Effect of normal aging versus hypertension, abnormal body mass index, and diabetes mellitus on white matter hyperintensity volume. Stroke, 45, 255–257. [DOI] [PMC free article] [PubMed] [Google Scholar]
- Knoops, A. J. G. , Gerritsen, L. , van der Graaf, Y. , Mali, W. P. T. M. , & Geerlings, M. I. (2012). Loss of entorhinal cortex and hippocampal volumes compared to whole brain volume in normal aging: The SMART‐Medea study. Psychiatry Research, 203, 31–37. [DOI] [PubMed] [Google Scholar]
- Kurosaki, H. C. (n.d.). Measurement of functional activities in older adults in the community of gerontology. [DOI] [PubMed]
- Lebel, C. , Gee, M. , Camicioli, R. , Wieler, M. , Martin, W. , & Beaulieu, C. (2012). Diffusion tensor imaging of white matter tract evolution over the lifespan. NeuroImage, 60, 340–352. [DOI] [PubMed] [Google Scholar]
- Madden, D. J. , Bennett, I. J. , & Song, A. W. (2009). Cerebral white matter integrity and cognitive aging: Contributions from diffusion tensor imaging. Neuropsychology Review, 19, 415–435. [DOI] [PMC free article] [PubMed] [Google Scholar]
- Madden, D. J. , Parks, E. L. , Tallman, C. W. , Boylan, M. A. , Hoagey, D. A. , Cocjin, S. B. , Packard, L. E. , Johnson, M. A. , Chou, Y.‐H. , Potter, G. G. , Chen, N.‐K. , Siciliano, R. E. , Monge, Z. A. , Honig, J. A. , & Diaz, M. T. (2017). Sources of disconnection in neurocognitive aging: Cerebral white‐matter integrity, resting‐state functional connectivity, and white‐matter hyperintensity volume. Neurobiology of Aging, 54, 199–213. [DOI] [PMC free article] [PubMed] [Google Scholar]
- Maillard, P. , Fletcher, E. , Lockhart, S. N. , Roach, A. E. , Reed, B. , Mungas, D. , DeCarli, C. , & Carmichael, O. T. (2014). White matter hyperintensities and their penumbra lie along a continuum of injury in the aging brain. Stroke, 45, 1721–1726. [DOI] [PMC free article] [PubMed] [Google Scholar]
- Marín‐Padilla, M. , & Knopman, D. S. (2011). Developmental aspects of the intracerebral microvasculature and perivascular spaces: Insights into brain response to late‐life diseases. Journal of Neuropathology and Experimental Neurology, 70, 1060–1069. [DOI] [PMC free article] [PubMed] [Google Scholar]
- Marstaller, L. , Williams, M. , Rich, A. , Savage, G. , & Burianová, H. (2015). Aging and large‐scale functional networks: White matter integrity, gray matter volume, and functional connectivity in the resting state. Neuroscience, 290, 369–378. [DOI] [PubMed] [Google Scholar]
- Mesulam, M. (1990). Large‐scale neurocognitive networks and distributed processing for attention, language, and memory. Annals of Neurology, 28(5), 597–613. [DOI] [PubMed] [Google Scholar]
- Mito, R. , Dhollander, T. , Xia, Y. , Raffelt, D. , Salvado, O. , Churilov, L. , Rowe, C. C. , Brodtmann, A. , Villemagne, V. L. , & Connelly, A. (2020). In vivo microstructural heterogeneity of white matter lesions in healthy elderly and Alzheimer's disease participants using tissue compositional analysis of diffusion MRI data. Neuroimage Clinical, 28, 102479. [DOI] [PMC free article] [PubMed] [Google Scholar]
- Muehlboeck, J.‐S. , Westman, E. , & Simmons, A. (2014). TheHiveDB image data management and analysis framework. Frontiers in Neuroinformatics, 7, 49. [DOI] [PMC free article] [PubMed] [Google Scholar]
- Nagai, M. , & Kario, K. (2009). Blood pressure, aging, vascular disease, and their effects on brain volume. American Journal of Hypertension, 22(11), 1135. [DOI] [PubMed] [Google Scholar]
- O'Sullivan, M. , Summers, P. E. , Jones, D. K. , Jarosz, J. M. , Williams, S. C. , & Markus, H. S. (2001). Normal‐appearing white matter in ischemic leukoaraiosis: A diffusion tensor MRI study. Neurology, 57, 2307–2310. [DOI] [PubMed] [Google Scholar]
- Pantoni, L. , & Garcia, J. H. (1997). Pathogenesis of leukoaraiosis: A review. Stroke, 28, 652–659. [DOI] [PubMed] [Google Scholar]
- Peters, R. (2006). Ageing and the brain. Postgraduate Medical Journal, 82, 84–88. 10.1136/pgmj.2005.036665 [DOI] [PMC free article] [PubMed] [Google Scholar]
- Poulakis, K. , Reid, R. I. , Przybelski, S. A. , Knopman, D. S. , Graff‐Radford, J. , Lowe, V. J. , Mielke, M. M. , Machulda, M. M. , Jack, C. R., Jr. , Petersen, R. C. , Westman, E. , & Vemuri, P. (2021). Longitudinal deterioration of white‐matter integrity: Heterogeneity in the ageing population. Brain Communications, 3, fcaa238. [DOI] [PMC free article] [PubMed] [Google Scholar]
- Prince, M. , Wimo, A. , Guerchet, M. , Ali, G. C. , Wu, Y. T. , & Prina, M. (2015). World Alzheimer report 2015: The global impact of dementia (p. 2015). Alzheimer's Disease International. [Google Scholar]
- Raffelt, D. , Tournier, J.‐D. , Rose, S. , Ridgway, G. R. , Henderson, R. , Crozier, S. , Salvado, O. , & Connelly, A. (2012). Apparent fibre density: A novel measure for the analysis of diffusion‐weighted magnetic resonance images. NeuroImage, 59, 3976–3994. 10.1016/j.neuroimage.2011.10.045 [DOI] [PubMed] [Google Scholar]
- Román, G. C. (1991). White matter lesions and normal‐pressure hydrocephalus: Binswanger disease or hakim syndrome? AJNR. American Journal of Neuroradiology, 12(1), 40–41. [PMC free article] [PubMed] [Google Scholar]
- Salat, D. H. , Tuch, D. S. , van der Kouwe, A. J. W. , Greve, D. N. , Pappu, V. , Lee, S. Y. , Hevelone, N. D. , Zaleta, A. K. , Growdon, J. H. , Corkin, S. , Fischl, B. , & Rosas, H. D. (2010). White matter pathology isolates the hippocampal formation in Alzheimer's disease. Neurobiology of Aging, 31, 244–256. [DOI] [PMC free article] [PubMed] [Google Scholar]
- Simmons, A. , Westman, E. , Muehlboeck, S. , Mecocci, P. , Vellas, B. , Tsolaki, M. , Kłoszewska, I. , Wahlund, L.‐O. , Soininen, H. , Lovestone, S. , Evans, A. , & Spenger, C. (2011). The AddNeuroMed framework for multi‐centre MRI assessment of Alzheimer's disease: Experience from the first 24 months. International Journal of Geriatric Psychiatry, 26, 75–82. 10.1002/gps.2491 [DOI] [PubMed] [Google Scholar]
- Skoog, I. (1998). A review on blood pressure and ischaemic white matter lesions. Dementia and Geriatric Cognitive Disorders, 9(Suppl 1), 13–19. [DOI] [PubMed] [Google Scholar]
- Smith, C. D. , Johnson, E. S. , Van Eldik, L. J. , Jicha, G. A. , Schmitt, F. A. , Nelson, P. T. , Kryscio, R. J. , Murphy, R. R. , & Wellnitz, C. V. (2016). Peripheral (deep) but not periventricular MRI white matter hyperintensities are increased in clinical vascular dementia compared to Alzheimer's disease. Brain and Behavior, 6, e00438. 10.1002/brb3.438 [DOI] [PMC free article] [PubMed] [Google Scholar]
- Takao, H. , Hayashi, N. , & Ohtomo, K. (2012). A longitudinal study of brain volume changes in normal aging. European Journal of Radiology, 81, 2801–2804. [DOI] [PubMed] [Google Scholar]
- Tarumi, T. , de Jong, D. L. K. , Zhu, D. C. , Tseng, B. Y. , Liu, J. , Hill, C. , Riley, J. , Womack, K. B. , Kerwin, D. R. , Lu, H. , Munro Cullum, C. , & Zhang, R. (2015). Central artery stiffness, baroreflex sensitivity, and brain white matter neuronal fiber integrity in older adults. NeuroImage, 110, 162–170. [DOI] [PMC free article] [PubMed] [Google Scholar]
- Taylor, W. D. , Bae, J. N. , MacFall, J. R. , Payne, M. E. , Provenzale, J. M. , Steffens, D. C. , & Krishnan, K. R. R. (2007). Widespread effects of hyperintense lesions on cerebral white matter structure. AJR. American Journal of Roentgenology, 188, 1695–1704. [DOI] [PubMed] [Google Scholar]
- Team, RC . (2018). R: A language and environment for statistical computing (p. 2012). R Foundation for Statistical Computing. [Google Scholar]
- Tournier, J.‐D. , Smith, R. , Raffelt, D. , Tabbara, R. , Dhollander, T. , Pietsch, M. , Christiaens, D. , Jeurissen, B. , Yeh, C.‐H. , & Connelly, A. (2019). MRtrix3: A fast, flexible and open software framework for medical image processing and visualisation. NeuroImage, 202, 116137. [DOI] [PubMed] [Google Scholar]
- Tustison, N. J. , Avants, B. B. , Cook, P. A. , Zheng, Y. , Egan, A. , Yushkevich, P. A. , & Gee, J. C. (2010). N4ITK: Improved N3 bias correction. IEEE Transactions on Medical Imaging, 29, 1310–1320. [DOI] [PMC free article] [PubMed] [Google Scholar]
- Veraart, J. , Fieremans, E. , & Novikov, D. S. (2016). Diffusion MRI noise mapping using random matrix theory. Magnetic Resonance in Medicine, 76, 1582–1593. [DOI] [PMC free article] [PubMed] [Google Scholar]
- Vernooij, M. W. , Ikram, M. A. , Vrooman, H. A. , Wielopolski, P. A. , Krestin, G. P. , Hofman, A. , Niessen, W. J. , Van der Lugt, A. , & Breteler, M. M. B. (2009). White matter microstructural integrity and cognitive function in a general elderly population. Archives of General Psychiatry, 66, 545–553. [DOI] [PubMed] [Google Scholar]
- Voevodskaya, O. , Simmons, A. , Nordenskjöld, R. , Kullberg, J. , Ahlström, H. , Lind, L. , Wahlund, L. O. , Larsson, E. M. , Westman, E. , & Alzheimer's Disease Neuroimaging Initiative . (2014). The effects of intracranial volume adjustment approaches on multiple regional MRI volumes in healthy aging and Alzheimer's disease. Frontiers in Aging Neuroscience, 6, 264. [DOI] [PMC free article] [PubMed] [Google Scholar]
- Wechsler, D. (1972). Wechsler adult intelligence scale‐‐administration and scoring manual (Vol. 2). The Psychological Corporation. [Google Scholar]
- Williams, L. R. , Hutchinson, C. E. , Jackson, A. , Horan, M. A. , Jones, M. , McInnes, L. , Rabbitt, P. M. A. , & Pendleton, N. (2010). Clinical correlates of cerebral white matter hyperintensities in cognitively normal older adults. Archives of Gerontology and Geriatrics, 50, 127–131. [DOI] [PubMed] [Google Scholar]
- Yoon, B. , Shim, Y. S. , Cheong, H.‐K. , Hong, Y.‐J. , Lee, K.‐S. , Park, K. H. , Ahn, K. J. , Kim, D. J. , Kim, Y.‐D. , Choi, S. H. , & Yang, D.‐W. (2014). White matter Hyperintensities in mild cognitive impairment: Clinical impact of location and interaction with lacunes and medial temporal atrophy. Journal of Stroke and Cerebrovascular Diseases, 23, e365–e372. 10.1016/j.jstrokecerebrovasdis.2013.12.040 [DOI] [PubMed] [Google Scholar]
- Yoshita, M. , Fletcher, E. , Harvey, D. , Ortega, M. , Martinez, O. , Mungas, D. M. , Reed, B. R. , & DeCarli, C. S. (2006). Extent and distribution of white matter hyperintensities in normal aging, MCI, and AD. Neurology, 67, 2192–2198. [DOI] [PMC free article] [PubMed] [Google Scholar]
- Zhuang, F.‐J. , Chen, Y. , He, W.‐B. , & Cai, Z.‐Y. (2018). Prevalence of white matter hyperintensities increases with age. Neural Regeneration Research, 13, 2141–2146. [DOI] [PMC free article] [PubMed] [Google Scholar]
Associated Data
This section collects any data citations, data availability statements, or supplementary materials included in this article.
Supplementary Materials
Data S1. Supporting Information.
Data S2. Supporting Information.
Data S3. Supporting Information.
Data S4. Supporting Information.
Data Availability Statement
The data that support the findings of this study are available on request from the corresponding author. The data are not publicly available due to privacy or ethical restrictions.