

Abstract
Determining whether weekend catch-up sleep (CUS) is related to high risk of depression in the general middle-aged population in Korea. This study is a cross-sectional study analyzing data from 2016 to 2017 collected in the Korea National Health and Nutrition Examination Survey VII-1, 2; less than 35 years, and more than 65 years were excluded. Interviews on sociodemographic characteristics, mood and sleep-related profiles, and comorbid medical conditions were conducted. Participants were divided into three groups according to weekday sleeping time (< 6 h, 6 to ≤ 8 h, and ≥ 8 h). Weekend CUS was identified when nocturnal sleep extension occurred over the weekend. The risk of depression was evaluated using the PHQ-9. The PHQ-9 score differed among the three groups. The prevalence of moderate to severe depressive symptom and PHQ-9 score ≥ 10 was the highest in the group sleep over 8 h and the next highest in the group sleep less than 6 h. In the group sleep less than 6 h, PHQ-9 score ≥ 10 was significantly higher in the without CUS group than the with CUS group. The risk of depression in middle-aged individuals was associated with both short and long sleep duration, and the severity and prevalence of depression were lower in the group with CUS when a shortened sleep pattern was observed.
Supplementary Information
The online version contains supplementary material available at 10.1007/s41105-022-00415-3.
Keywords: Weekend catch-up sleep, Depression, Sleep debt, Sleep deprivation, PHQ-9
Introduction
Depression is a common mental disorder affecting approximately 261 million people worldwide [1]. And evidence from previous studies suggests that sleep and depression are interrelated. Insomnia is independent risk factor of depression [2]. Sleep disturbance and shortened sleep schedules are risk factors for depression, suicide, increased mortality, and can perpetuate sleep dysfunction [3, 4]. Sleep deprivation is also associated with increased anxiety and depression [4]. Short night-time sleeping has been shown to be an independent risk factor for the emergence and persistence of depression symptoms [5].
In women, sleep problems are common during perimenopause, and one-third of women between the ages of 40 and 64 complain of poor sleep [6]. Middle-aged women were at a higher risk of developing depression, stress, anxiety, and experiencing emotional distress [7].
Recently, people often do not get enough sleep or suffer from sleep problems. According to the Centers for Disease Control and Prevention (CDC), sleeping less than 7 h per night was more common in individuals 35–54 years of age, compared to other age groups among US adults [8]. Many work factors associate with sleep quality [9], and sleep deprivation is associated with daytime dysfunction, such as drowsy driving or reduced work productivity [10].
Many people tend to sleep more on weekends if they do not get enough sleep during the weekdays. And weekend “catch-up sleep” (CUS) is a behavior to cope with weekday sleep debt [11]. According to the 2008 “Sleep in America” poll, more than half of the respondents slept less on workdays than on non-workdays, and the respondents who spent less than 6 h in bed on workdays, slept more on weekends [12]. Presumably, CUS during weekends compensates for the lack of sleep during the week, so it would be beneficial for their health. Even though there were no studies that revealed a clear causal relationship of CUS and health benefit, some studies suggest benefits of CUS. According to one study, more weekend sleep may potentially mitigate the effect of weekday sleep deprivation on blood pressure [13]. Other studies found that weekend sleep extension may have protective biological effects in preventing sleep-restriction-induced, or related, obesity [14], and cardio-metabolic risk [15]. One study also showed that weekend CUS is associated with better health-related quality of life (HRQOL), assessed by the EuroQol-5 dimension (EQ-5D) utility score [11].
The primary aim of this study was to determine whether weekend CUS affects depression in the general, middle-aged, Korean population.
Materials and methods
Study subjects
Subjects were selected based on data from the 2016 and 2017 Korea National Health and Nutrition Examination Survey (KNHANES VII-1, 2). The KNHANES is a nationwide representative cross-sectional survey conducted by the Korea Centers for Disease Control and Prevention. The KNHANES uses a stratified, multistage probability sampling design for the selection of household units. The selection was made from sampling units based on age, gender, and geographic area. Informed consent was obtained from all participants included in the study.
Of all the participants in KNHANES VII-1, 2 (2016–2017), 9123 individuals younger than 35 and older than 65 years old were excluded from this study, as well as 3958 participants who did not participate in the survey about sleep and the Patient Health Questionnaire-9 (PHQ-9). Finally, 3196 participants (1352 men and 1844 women) were included in the analyses.
The Institutional Review Board of Kyung Hee University Hospital approved the design of the present study and ensured that individuals were not identifiable by providing linkable anonymous data to the researchers. Waiver of informed consent for this study was approved by the Institutional Review Board, and the study was approved (Approval No. KHUH 2019-07-026) after it was reviewed for ethical issues.
Measurements
Sleep duration, chronotype, social jetlag, and weekend CUS
Participants’ average weekday and weekend sleep durations were calculated based on their responses to the following questions: (1) On a weekday (or working day), at what time do you go to sleep and at what time do you get up? (2) On a weekend (or the day when you do not work, the day before you do not work), at what time do you go to sleep and at what time do you get up?” Average sleep duration was calculated using the following formula: (weekday sleep duration × 5 + weekend sleep duration × 2)/7.
According to the weekday sleep duration, subjects were classified into 3 groups: sleeps less than 6 h, sleeps 6–8 h, and sleeps longer than 8 h.
To quantify chronotype and social jetlag, we extracted and utilized several variables, such as the midpoint of sleep on free days (MSF), midpoint of sleep on workdays (MSW), sleep duration on workdays (SDW), and sleep duration on free days (SDF), using the sleep-related questions mentioned above. “Midpoint of sleep on free days corrected for sleep extension on free days (MSFsc)” is used as an indicator of chronotype [16]. Each participant’s MSFsc was calculated using the following equation: MSFsc = MSF – 0.5*{SDF – (5*SDW + 2*SDF)/7} [17]. MSFsc is represented as local time. If sleep duration on free days was shorter than or equal to sleep duration on workdays, MSFsc was equal to MSF. Social jetlag is calculated as the difference between the midpoint of sleep duration on free days and sleep duration on workdays (MSF-MSW). “With weekend CUS” was defined as sleep duration on weekends being longer than that on weekdays.
PHQ-9
The PHQ-9 is an instrument to screen, diagnose, and measure the severity of depression [18]. The validity and reliability of the Korean version of the Patient Health Questionnaire-9 (PHQ-9), which was used in this study, has been previously validated [19].
In this study, the PHQ-9 was used in two ways, first for evaluating the risk of depression and then for rating the severity of a subject's depressive symptoms. According to the Diagnostic and Statistical Manual of Mental Disorder, Fourth Edition (DSM-IV), we utilized subjects’ responses to the 9 items for evaluating the risk of major depressive disorder (MDD) [18]. Although the PHQ-9 has been validated on the DSM-IV, the main diagnostic criteria for MDD in the DSM-5 have not changed, so it can also be applied to the DSM-5 [18].
We also categorized subjects based on the severity of their depressive symptoms (none, 0; minimal, 1–4; mild, 5–9; moderate, 10–14; moderately severe, 15–19; or severe, 20–27) [18]. According to a previous validation study in clinical populations in the United States, a PHQ-9 score of 10 or higher had 88% specificity and 88% sensitivity for detecting MDD [18]. The prevalence of depression in KNHANES is similar to that in other countries [20]. For this reason, we adapted this cutoff value and classified subjects whose PHQ-9 score is 10 or higher.
Covariates: anthropometric, demographic, lifestyle, and health status
The KNHANES consists of a health interview survey, health behavior survey, health examination survey, and a nutrition survey. Participants’ height (cm) and body weight (kg) were measured, and their BMI was calculated as weight (in kilograms) divided by the square of the height (in meters). The demographic variables (age, sex, education level, marital status, and monthly income) and lifestyle factors (smoking status, alcohol consumption, and physical activity level), socioeconomic status (education level, marital status, monthly income) were collected using self-administered questionnaires. Physical activity level was evaluated using the Korean Global Physical Activity Questionnaire (GPAQ) [21]. Each participant's physical activity level was quantified into the metabolic equivalent of task-minute per week and classified into three levels (high, moderate, or low) according to the analysis and calculation guidelines of the GPAQ [21].
To evaluate the overall health status for each participant, a comorbidity score was calculated using the Charlson comorbidity index (CCI) [22]. The comorbidities used to calculate the CCI were identified and obtained through the survey. The CCI score was calculated for each participant as the participant’s total comorbid conditions and weighted according to the disease type and severity [22]. The point values were summed for a total number, to which one point was added for each decade greater than forty years of age.
Statistical analysis
To compare the basic demographics, anthropometric characteristics, lifestyle factors, and CCI, all participants were divided into three groups (weekday sleep duration < 6 h, 6 to ≤ 8 h, and ≥ 8 h). Characteristics of sleep patterns including weekday and weekend sleep duration, average week sleep duration, MSFsc, social jetlag, and weekend CUS behavior were also compared across the three groups. In addition, the high risk of depression (PHQ-9 score ≥ 10) and severity of depressive symptoms were compared across the groups.
Continuous variables are presented as estimated mean ± standard errors and compared using analysis of variance (ANOVA). Categorical variables are presented as unweighted numbers and estimated percentages compared using the chi-squared (χ2) test. Multiple comparisons between groups were performed by Bonferroni method.
Second, univariate and multivariate logistic regression analyses were performed to evaluate the association between weekend CUS and the high risk of depression (PHQ-9 score ≥ 10) by sleeping duration.
Third, to evaluate the influence of weekend CUS behavior, unadjusted and adjusted mean PHQ-9 score groups were compared according to weekday sleep duration categories.
For data management and analysis, STATA version 13.0 (StataCorp., College Station, TX, USA) was used. The P values of all the results reported below are bilateral, and the significance level was set at P < 0.05.
Results
Baseline characteristics of the study participants
Table 1 shows the baseline characteristics of the study subjects classified into 3 groups according to sleep duration. Of 3196 participants, the sleep less than 6 h group comprised 937 subjects (29.3%), sleep 6–8 h group comprised of 1438 subjects (44.9%), and the sleep duration of more than 8 h group comprised 821 (25.6%) subjects. According to the comparison of the three groups, significant differences were seen for several variables among groups.
Table 1.
Baseline characteristics of study participants according to weekday sleep duration
| Variable | Subjects sleep < 6 h (n = 937) |
6 ≤ subjects sleep < 8 h (n = 1438) |
8 h ≤ subjects sleep (n = 821) |
P value |
|---|---|---|---|---|
| Age (year) | 49.25 ± 0.28a | 48.79 ± 0.38a | 48.79 ± 0.31a | 0.204 |
| Male sex, n (weighted %) | 385 (48.8) | 659 (53.7) | 308 (45.3) | 0.001* |
| Body mass index (kg/m2) | 24.53 ± 0.11a | 24.28 ± 0.11a | 23.96 ± 0.14a | 0.122 |
| Smoking status, n (weighted %) | 0.141 | |||
| Never smoker | 730 (74.4) | 1138 (76.2) | 657 (77.5) | |
| Ex-smoker | 33 (4.6) | 46 (3.7) | 19 (2.0) | |
| Current smoker | 173 (20.8) | 252 (20.0) | 144 (20.4) | |
| High-risk drinker, n (weighted %) | 132 (15.2) | 190 (14.9) | 112 (15.5) | 0.964 |
| Physical activity, n (weighted %) | 0.009* | |||
| Low physical activity | 506 (54.7) | 757 (51.1) | 491 (57.5) | |
| Moderate physical activity | 327 (34.9) | 535 (38.0) | 276 (35.2) | |
| High physical activity | 104 (12.3) | 146 (10.7) | 54 (7.1) | |
| Household income, n (weighted %) | 0.007 | |||
| Low | 95 (9.6) | 102 (7.1) | 103 (12.8) | |
| Low-middle | 239 (24.3) | 326 (21.9) | 196 (22.8) | |
| High-middle | 279 (31.2) | 459 (32.6) | 264 (32.0) | |
| High | 323 (34.7) | 550 (38.2) | 256 (32.2) | |
| Education level, n (weighted %) | < 0.001* | |||
| ≤ elementary school | 119 (12.7) | 141 (9.8) | 91 (11.1) | |
| Middle school | 86 (9.1) | 156 (10.8) | 120 (14.6) | |
| High school | 323 (34.4) | 496 (34.5) | 303 (36.9) | |
| ≥ College | 409 (43.6) | 643 (44.7) | 306 (37.3) | |
| Marital status | 0.205 | |||
| Single | 53 (6.8) | 66 (5.2) | 46 (7.2) | |
| Separated/divorced/widowed | 91 (8.8) | 141 (9.6) | 63 (7.3) | |
| Married | 793 (84.2) | 1231 (85.0) | 712 (85.3) | |
| Menopause (female) | 0.042 | |||
| No | 274 (50.1) | 407 (53.4) | 294 (58.9) | |
| Yes | 277 (49.8) | 369 (46.5) | 216 (46.0) | |
| Work schedule pattern | 0.031 | |||
| Daytime | 575 (61.4) | 1020 (70.9) | 493 (60.0) | |
| Evening time (14:00–24:00) | 69 (7.4) | 73 (5.1) | 60 (7.3) | |
| Night time (21:00–8:00) | 1 5(1.6) | 10 (0.7) | 6 (0.7) | |
| Shift worker | 46 (4.9) | 49 (3.4) | 30 (3.7) | |
| Others | 0 (0) | 2 (0.1) | 2 (0.2) | |
| Non-working | 232 (24.8) | 284 (19.7) | 230 (28.0) | |
| Sleep duration, weekday (hour) | 5.45 ± 0.02a | 6.97 ± 0.01b | 8.45 ± 0.03c | < 0.001* |
| Sleep duration, weekend (hour) | 6.56 ± 0.05a | 7.64 ± 0.03b | 8.65 ± 0.04c | < 0.001* |
| Sleep duration, average (hour) | 5.77 ± 0.03a | 7.16 ± 0.01b | 8.51 ± 0.02c | < 0.001* |
| MSFsc (local time) | 3:33 AM ± 5.4 min ab | 3:22 AM ± 2.4 min a | 3:48 AM ± 4.2 min b | 0.095 |
| Social jetlag (hours) | 0.74 ± 0.04a | 0.66 ± 0.02a | 0.66 ± 0.05a | 0.080 |
| Weekend catch-up sleep | 524 (55.6) | 733 (51.8) | 260 (31.6) | < 0.001* |
| CCI | 0.82 ± 0.03a | 0.76 ± 0.03a | 0.82 ± 0.04a | 0.159 |
Multiple comparison: a < b < c, a = ab ac, abc = a,b. High-risk drinkers were defined as men consuming > 14 glasses of alcohol per week, and women consuming > 7 glasses of alcohol per week. Monthly household income was divided into quartiles
MSFsc Midpoint of sleep on free days corrected for sleep extension on free days, CCI Charlson comorbidity index score
*P values by analysis of variance for continuous variables, chi-squared (χ2) test for categorical variables
The mean age (49.25 ± 0.28 years vs. 48.79 ± 0.38 years vs. 48.79 ± 0.31 years, respectively; P = 0.204) and BMI (24.53 ± 0.11 kg/m2 vs. 24.28 ± 0.11 kg/m2 vs. 23.96 ± 0.14 kg/m2, respectively; P = 0.122) of the subjects in the three groups was not significantly different. Also, differences in mean CCI were not significant among the three groups (0.82 ± 0.03 vs. 0.76 ± 0.03 vs. 0.82 ± 0.04, respectively; P = 0.159).
The proportion of men in the sleep more than 8 h group was the least of all groups (48.8% vs. 53.7% vs. 45.3%, P = 0.001). Physical activity level (P = 0.009), household income (P = 0.007), and education level (P < 0.001) were also significantly different among the three groups.
The proportion of weekend CUS behavior group in the sleep less than 6 h group was higher than that in the other groups (less than 6 h: 55.6% vs. 6–8 h: 51.8% vs. more than 8 h: 31.6%, P < 0.001).
Comparison of the level of depressive symptoms severity, and PHQ-9 score ≥ 10 according to weekend CUS
Supplement Table 1 presents the distribution of the level of depression symptoms severity and the participants with a PHQ-9 score ≥ 10 according to sleep duration. The prevalence of moderate (PHQ-9 score 10–14) to severe (PHQ-9 score 15–19) symptom calculated by PHQ-9 was the highest in the group slept more than 8 h followed by the group slept less than 6 h. (moderate: 3.0% vs. 2.0% vs. 3.6%, severe: 0.7% vs. 0.0% vs. 0.9%) And the prevalence of more than 10 PHQ-9 scores was also highest in the group with sleep for more than 8 h (5.1% vs. 3.0% vs. 6.0%, P = 0.007).
Association between weekend CUS and depression
Table 2 presents the odds ratios (ORs) and 95% confidence intervals (Cis) for the participants with a PHQ-9 score of ≥ 10 based on the presence of weekend CUS, or not, as the independent variable according to the three sleep duration groups. In the crude logistic analyses, the ORs for participants with a PHQ-9 score of ≥ 10 significantly increased for the non-CUS group in the group with sleep less than 6 h (crude OR = 2.28, 95% CI 1.31–3.98, P = 0.003). After the crude logistic regression analyses, we performed multivariate logistic regression analyses. Confounders, such as CCI, sex, BMI, physical activity level, alcohol consumption, smoking status, household income, education level, and marital status, were adjusted. The OR for the participants with a PHQ score of ≥ 10 also increased in the non-CUS group with sleep less than 6 h (OR = 1.92, 95% CI 1.03–3.58). However, in the groups with sleep for 6–8 h and sleep for more than 8 h, the associations between weekend CUS and the participants with PHQ-9 score ≥ 10 were not statistically significant.
Table 2.
ORs and 95% CI for PHQ-9 score of 10 or higher according to weekend catch-up sleep
| Variable | With weekend catch-up sleep (n = 1517) | Without catch-up sleep (n = 1679) | P value |
|---|---|---|---|
| Subjects sleep < 6 h (n = 937) | |||
| PHQ-9 score ≥ 10 (n = 57) | |||
| Event, n | 21 | 36 | |
| Crude OR (95% CI) | 0.43 (0.25–0.76) | 1 | 0.003* |
| Adjusted OR (95%CI) | 0.51 (0.27–0.96) | 1 | 0.039* |
| 6 h ≤ subjects sleep < 8 h (n = 1438) | |||
| PHQ-9 score ≥ 10 (n = 57) | |||
| Event, n | 22 | 23 | |
| Crude OR (95% CI) | 1.28 (0.66–2.50) | 1 | 0.456 |
| Adjusted OR (95%CI) | 1.83 (0.92–3.66) | 1 | 0.083 |
| 8 h ≤ subjects sleep (n = 821) | |||
| PHQ-9 score ≥ 10 (n = 44) | |||
| Event, n | 9 | 35 | |
| Crude OR (95% CI) | 0.46 (0.19–1.11) | 1 | 0.084 |
| Adjusted OR (95%CI) | 0.66 (0.24–1.81) | 1 | 0.428 |
Adjusted for Charlson comorbidity index, sex, BMI, physical activity, alcohol consumption, smoking status, household income, education level, and marital status
OR odds ratio, CI confidence interval, CUS catch-up sleep, PHQ-9 Patient Health questionnaire-9
We also compared the mean PHQ-9 score between the CUS and non-CUS groups in each sleep duration group. (Fig. 1) Unadjusted mean PHQ-9 score comparisons showed that in the group with sleep less than 6 h, the weekend CUS group scored significantly less than the non-CUS group. (2.37 ± 0.16 vs. 3.16 ± 0.19, respectively; P = 0.002) In the case of adjusted mean PHQ-9 score comparisons, the scores were statistically different between the CUS and non-CUS groups in the group with sleep less than 6 h (2.39 ± 0.15 vs. 2.95 ± 0.23, respectively; P = 0.046) and 6 to 8 h (2.48 ± 0.14 vs. 2.01 ± 0.11, respectively; P = 0.011). Interestingly, in the group with sleep 6 to 8 h, the mean PHQ-9 score was higher in the weekend CUS group.
Fig. 1.
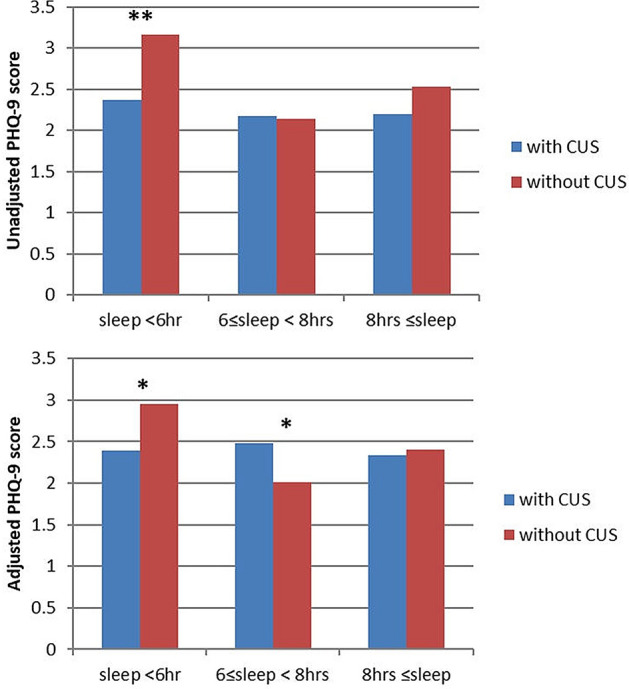
Comparison of mean PHQ-9 score according to weekday sleep duration and weekend CUS. Comparison of mean PHQ-9 scores according to weekday sleep duration and weekend CUSs. The bars from left to right are weekday sleep duration < 6 h, 6–8 h, and 8 h ≤ in the weekend CUS group and non-CUS group. Means were adjusted for Charlson comorbidity index, sex, BMI, physical activity, alcohol consumption, smoking status, household income, education level, and marital status. *P value < 0.05. PHQ-9 Patient Health questionnaire-9, CUS catch-up sleep. * P < 0.05, ** P < 0.005
Discussion
We analyzed the association between sleep duration and the risk of depression calculated by PHQ-9. The risk of depression differed among the three groups. The proportion of participants with PHQ-9 score of 10 or higher which means high risk of depression was relatively high in the group with less than 6 h and more than 8 h of sleep, which is partially consistent with other studies [23, 24]. And this study has shown the benefits of weekend CUS in the case of lack of sleep on weekdays.
The group performing weekend CUS in the group with less than 6 h of weekday sleep time had mild depressive symptoms. This can be interpreted in two ways. First, weekend CUS may help improve depressive symptoms. In a study of rural American populations, the association between PHQ-2 [25] and sleep duration (less than 7 h, 7–8 h, and > 8 h) was analyzed. After adjusting for age, sex, race, education, employment status, income, and BMI, shortened sleep time was associated with depressive symptoms, and improved sleep habits was recommended for mental health (adjusted prevalence OR = 2.12, 95% CI 1.49–3.01) [26]. Likewise, this study assumes that lifestyles modification including longer weekend sleep times will help improve depression risk and severity. For those who are depressed and lack of sleep on weekdays, we may recommend weekend CUS to improve their depressive symptoms. Second, weekend CUS may been compensatory. People tend to sleep more on weekends if they cannot sleep during the week, but this does not mean that weekend CUS is only explained by lack of sleep during the week [11]. People who can do CUS may be those who have the ability to compensate for sleep and are relatively only mildly depressed, if at all. In any case, weekend CUS is associated with milder depressive symptoms. Therefore, weekend CUS can be recommended to depressed patients, especially those with shortened sleep schedules.
Sleep disturbance is an important symptom of depression, and it is known that depression is associated with altered sleep habits and patterns [27]. The relationship between altered sleep and depression is remarkable, and there are several studies about this [28].
Work stress causes sleep problems [9] and increases the prevalence and severity of depression [29]. The median age of the labor force in the U.S. is 41.9 [30]. Incidentally, middle-aged people are more vulnerable to sleep problems and depression problems caused by work-stress, compared with other age groups. In addition, given the detrimental impact of sleep problems and depression on work efficiency, sleep problems and depression are considered more especially disadvantageous for this age group.
This highlights the importance of understanding the relationship between depression and sleep in middle-aged individuals. To do this, we analyzed the correlation between depression and sleep in this particular age group.
We performed subgroup analysis of menopausal status and working schedules. Weekday sleeping hours were significantly different among working patterns of participants (P = 0.031). However, there was no statistically significant difference between work patterns and the high risk of depression. only one thing, the PHQ-9 score ≥ 10 was significantly higher in nonworking group, which may be due to the unemployment status affecting depression severity [31]. Except that case, no significant difference was observed (Supplement Table 2).
In postmenopausal women, insomnia and sleep disturbances increase along with the incidence of depression. In this study, weekday sleep duration was significantly different depending on menopause, and it similar result to previous studies [7, 32]. But in the subgroup analysis, menopause did not affect depression. Many studies have shown association between menopausal status and mood [33, 34]. But a study implied age and postmenopausal duration were factor affecting mood as well [35]. Because the number of respondent about menopausal status was small, we did not age-adjusted analysis. Additional age-adjusted studies are needed.
There were some limitations to this study. The design of the study is cross-sectional, so it is difficult to identify an accurate causal relationship. This study investigated sleep patterns in the form of a self-reported questionnaire, which might have some inherent error. Because there were no data on naps, the effects of naps on depression could not be analyzed. We could not get data about taking antidepressants, the severity of depressive symptoms might be underestimate. The dataset is a nationwide health and nutrition evaluation questionnaire and there was no detailed information on specific diseases or symptoms, so we could not analyze sleep apnea, daytime sleepiness, and chronic insomnia, which could affect sleep and depressive symptoms. The KNHNES dataset did not include data about MDD but had PHQ-9 questionnaire. Further study directly analyzing MDD is needed.
In the group with sleep 6–8 h, the mean PHQ-9 score was higher in the weekend CUS group. It seems to be inconsistent with other results. In the group with sleep 6–8 h which is a healthy sleep pattern, CUS may phenotype of depression rather than compensatory behavior for sleep deprivation. But clear interpretation could not be made, and that is a limitation of the study. Follow-up studies, such as longitudinal studies or intervention studies, will be informative and help better characterize the interplay between depression and sleep disturbances.
In conclusion, high risk of depression in middle-aged individuals was associated with both shorter and longer sleep schedules, and the severity and risk of depression were lower in the group supplemented with weekend CUS in those with shortened sleep schedules. Therefore, it is expected that it would be helpful to recommend weekend CUS to patients with depression and increase sleep times, to improve depression symptoms.
Supplementary Information
Below is the link to the electronic supplementary material.
Funding
Chung-Ang University (Research Grant 2022).
Declarations
Conflict of interest
The authors have no potential conflicts of interest to disclose.
Footnotes
Publisher's Note
Springer Nature remains neutral with regard to jurisdictional claims in published maps and institutional affiliations.
References
- 1.James SL, Abate D, Abate KH, Abay SM, et al. Global, regional, and national incidence, prevalence, and years lived with disability for 354 diseases and injuries for 195 countries and territories, 1990–2017: a systematic analysis for the Global Burden of Disease Study 2017. Lancet. 2018;392:1789–1858. doi: 10.1016/S0140-6736(18)32279-7. [DOI] [PMC free article] [PubMed] [Google Scholar]
- 2.Kim WJ, Joo W-T, Baek J, Sohn SY, et al. Factors Associated with Insomnia among the elderly in a Korean rural community. Psychiatry Investig. 2017;14:400–406. doi: 10.4306/pi.2017.14.4.400. [DOI] [PMC free article] [PubMed] [Google Scholar]
- 3.Kalmbach DA, Arnedt JT, Song PX, Guille C, et al. Sleep disturbance and short sleep as risk factors for depression and perceived medical errors in first-year residents. Sleep. 2017 doi: 10.1093/sleep/zsw073. [DOI] [PMC free article] [PubMed] [Google Scholar]
- 4.Babson KA, Trainor CD, Feldner MT, Blumenthal H. A test of the effects of acute sleep deprivation on general and specific self-reported anxiety and depressive symptoms: an experimental extension. J Behav Ther Exp Psychiatry. 2010;41:297–303. doi: 10.1016/j.jbtep.2010.02.008. [DOI] [PMC free article] [PubMed] [Google Scholar]
- 5.Li Y, Wu Y, Zhai L, Wang T, et al. Longitudinal association of sleep duration with depressive symptoms among middle-aged and older Chinese. Sci Rep. 2017;7:11794. doi: 10.1038/s41598-017-12182-0. [DOI] [PMC free article] [PubMed] [Google Scholar]
- 6.Freedman RR. Menopause and sleep. Menopause. 2014;21:534–535. doi: 10.1097/GME.0000000000000243. [DOI] [PubMed] [Google Scholar]
- 7.Guérin E, Goldfield G, Prud'homme D. Trajectories of mood and stress and relationships with protective factors during the transition to menopause: results using latent class growth modeling in a Canadian cohort. Arch Womens Ment Health. 2017;20:733–745. doi: 10.1007/s00737-017-0755-4. [DOI] [PubMed] [Google Scholar]
- 8.CDC. Short Sleep Duration Among US Adults. 2017 [updated 2017 May 2, 2017; cited May 28, 2021]; https://www.cdc.gov/sleep/data_statistics.html.
- 9.Vleeshouwers J, Knardahl S, Christensen JO. Effects of psychological and social work factors on self-reported sleep disturbance and difficulties initiating sleep. Sleep. 2016;39:833–846. doi: 10.5665/sleep.5638. [DOI] [PMC free article] [PubMed] [Google Scholar]
- 10.Jarrin DC, McGrath JJ, Silverstein JE, Drake C. Objective and subjective socioeconomic gradients exist for sleep quality, sleep latency, sleep duration, weekend oversleep, and daytime sleepiness in adults. Behav Sleep Med. 2013;11:144–158. doi: 10.1080/15402002.2011.636112. [DOI] [PMC free article] [PubMed] [Google Scholar]
- 11.Oh YH, Kim H, Kong M, Oh B, et al. Association between weekend catch-up sleep and health-related quality of life of Korean adults. Medicine (Baltimore) 2019;98:e14966. doi: 10.1097/MD.0000000000014966. [DOI] [PMC free article] [PubMed] [Google Scholar]
- 12.Foundation NS. 2008 Sleep, Performance and the Workplace. 2008 [updated 2008 March 3, 2008; cited May 28, 2021]; https://www.sleepfoundation.org/professionals/sleep-americar-polls/2008-sleep-performance-and-workplace.
- 13.Gupta N, Maranda L, Gupta R. Differences in self-reported weekend catch up sleep between children and adolescents with and without primary hypertension. Clin Hypertension. 2018;24:7. doi: 10.1186/s40885-018-0092-6. [DOI] [PMC free article] [PubMed] [Google Scholar]
- 14.Im HJ, Baek SH, Chu MK, Yang KI, et al. Association between weekend catch-up sleep and lower body mass: population-based study. Sleep. 2017 doi: 10.1093/sleep/zsx089. [DOI] [PubMed] [Google Scholar]
- 15.Pizinger TM, Aggarwal B, St-Onge MP. Sleep extension in short sleepers: an evaluation of feasibility and effectiveness for weight management and cardiometabolic disease prevention. Front Endocrinol (Lausanne) 2018;9:392. doi: 10.3389/fendo.2018.00392. [DOI] [PMC free article] [PubMed] [Google Scholar]
- 16.Roenneberg T, Wirz-Justice A, Merrow M. Life between clocks: daily temporal patterns of human chronotypes. J Biol Rhythms. 2003;18:80–90. doi: 10.1177/0748730402239679. [DOI] [PubMed] [Google Scholar]
- 17.Roenneberg T, Kuehnle T, Pramstaller PP, Ricken J, et al. A marker for the end of adolescence. Curr Biol. 2004;14:R1038–R1039. doi: 10.1016/j.cub.2004.11.039. [DOI] [PubMed] [Google Scholar]
- 18.Kroenke K, Spitzer RL, Williams JB. The PHQ-9: validity of a brief depression severity measure. J Gen Intern Med. 2001;16:606–613. doi: 10.1046/j.1525-1497.2001.016009606.x. [DOI] [PMC free article] [PubMed] [Google Scholar]
- 19.Han C, Jo SA, Kwak JH, Pae CU, et al. Validation of the Patient Health Questionnaire-9 Korean version in the elderly population: the Ansan Geriatric study. Compr Psychiatry. 2008;49:218–223. doi: 10.1016/j.comppsych.2007.08.006. [DOI] [PubMed] [Google Scholar]
- 20.Shin C, Kim Y, Park S, Yoon S, et al. Prevalence and associated factors of depression in general population of Korea: results from the Korea National Health and Nutrition Examination Survey, 2014. J Korean Med Sci. 2017;32:1861–1869. doi: 10.3346/jkms.2017.32.11.1861. [DOI] [PMC free article] [PubMed] [Google Scholar]
- 21.Lee J, Lee C, Min J, Kang DW, et al. Development of the Korean Global Physical Activity Questionnaire: reliability and validity study. Glob Health Promot. 2020;27:44–55. doi: 10.1177/1757975919854301. [DOI] [PubMed] [Google Scholar]
- 22.Charlson M, Szatrowski TP, Peterson J, Gold J. Validation of a combined comorbidity index. J Clin Epidemiol. 1994;47:1245–1251. doi: 10.1016/0895-4356(94)90129-5. [DOI] [PubMed] [Google Scholar]
- 23.Liu BP, Wang XT, Liu ZZ, Wang ZY, et al. Depressive symptoms are associated with short and long sleep duration: a longitudinal study of Chinese adolescents. J Affect Disord. 2020;263:267–273. doi: 10.1016/j.jad.2019.11.113. [DOI] [PubMed] [Google Scholar]
- 24.Jiang J, Li Y, Mao Z, Wang F, et al. Abnormal night sleep duration and poor sleep quality are independently and combinedly associated with elevated depressive symptoms in Chinese rural adults: Henan Rural Cohort. Sleep Med. 2020;70:71–78. doi: 10.1016/j.sleep.2019.10.022. [DOI] [PubMed] [Google Scholar]
- 25.Kroenke K, Spitzer RL, Williams JB. The Patient Health Questionnaire-2: validity of a two-item depression screener. Med Care. 2003;41:1284–1292. doi: 10.1097/01.MLR.0000093487.78664.3C. [DOI] [PubMed] [Google Scholar]
- 26.Chang JJ, Salas J, Habicht K, Pien GW, et al. The association of sleep duration and depressive symptoms in rural communities of Missouri, Tennessee, and Arkansas. J Rural Health. 2012;28:268–276. doi: 10.1111/j.1748-0361.2011.00398.x. [DOI] [PMC free article] [PubMed] [Google Scholar]
- 27.Palagini L, Baglioni C, Ciapparelli A, Gemignani A, et al. REM sleep dysregulation in depression: state of the art. Sleep Med Rev. 2013;17:377–390. doi: 10.1016/j.smrv.2012.11.001. [DOI] [PubMed] [Google Scholar]
- 28.Brand S, Kirov R. Sleep and its importance in adolescence and in common adolescent somatic and psychiatric conditions. Int J Gen Med. 2011;4:425–442. doi: 10.2147/IJGM.S11557. [DOI] [PMC free article] [PubMed] [Google Scholar]
- 29.Lin TC, Lin HS, Cheng SF, Wu LM, et al. Work stress, occupational burnout and depression levels: a clinical study of paediatric intensive care unit nurses in Taiwan. J Clin Nurs. 2016;25:1120–1130. doi: 10.1111/jocn.13119. [DOI] [PubMed] [Google Scholar]
- 30.Statistics USBoL. Median age of the labor force, by sex, race, and ethnicity. 2020 [updated 2020 September 1, 2020; cited May 28, 2021]; https://www.bls.gov/emp/tables/median-age-labor-force.htm.
- 31.Zuelke AE, Luck T, Schroeter ML, Witte AV, et al. The association between unemployment and depression—results from the population-based LIFE-adult-study. J Affect Disord. 2018;235:399–406. doi: 10.1016/j.jad.2018.04.073. [DOI] [PubMed] [Google Scholar]
- 32.Kalleinen N, Polo-Kantola P, Himanen S-L, Alhola P, et al. Sleep and the menopause—do postmenopausal women experience worse sleep than premenopausal women? Menopause Int. 2008;14:97–104. doi: 10.1258/mi.2008.008013. [DOI] [PubMed] [Google Scholar]
- 33.Bromberger JT, Kravitz HM, Chang YF, Cyranowski JM, et al. Major depression during and after the menopausal transition: Study of Women's Health Across the Nation (SWAN) Psychol Med. 2011;41:1879–1888. doi: 10.1017/S003329171100016X. [DOI] [PMC free article] [PubMed] [Google Scholar]
- 34.Soares CN. Depression and menopause: an update on current knowledge and clinical management for this critical window. Med Clin North Am. 2019;103:651–667. doi: 10.1016/j.mcna.2019.03.001. [DOI] [PubMed] [Google Scholar]
- 35.Campbell KE, Dennerstein L, Finch S, Szoeke CE. Impact of menopausal status on negative mood and depressive symptoms in a longitudinal sample spanning 20 years. Menopause. 2017;24:490–496. doi: 10.1097/GME.0000000000000805. [DOI] [PubMed] [Google Scholar]
Associated Data
This section collects any data citations, data availability statements, or supplementary materials included in this article.