

Key Points
Question
Do health care workers benefit from improved health sector finances?
Findings
In this difference-in-differences study, only health care workers in higher-earning occupations (eg, registered nurses, physicians, and managers) experienced increases in annual income after state-level Medicaid expansion, which has been shown to improve health care organization finances. Health care workers in lower-earning occupations (eg, health aides, attendants, service staff) were more likely to report coverage under the Medicaid program after expansion and less likely to hold employer–sponsored health insurance.
Meaning
Improved health care organization finances may increase inequality in the health care workforce, with implications for compounding structural inequalities within the industry and worker and patient health and well-being.
Abstract
Importance
The extent to which changes in health sector finances impact economic outcomes among health care workers, especially lower-income workers, is not well known.
Objective
To assess the association between state adoption of the Affordable Care Act’s Medicaid expansion—which led to substantial improvements in health care organization finances—and health care workers’ annual incomes and benefits, and whether these associations varied across low- and high-wage occupations.
Design, Setting, and Participants
Difference-in-differences analysis to assess differential changes in health care workers’ economic outcomes before and after Medicaid expansion among workers in 30 states that expanded Medicaid relative to workers in 16 states that did not, by examining US individuals aged 18 through 65 years employed in the health care industry surveyed in the 2010-2019 American Community Surveys.
Exposure
Time-varying state-level adoption of Medicaid expansion.
Main Outcomes and Measures
Primary outcome was annual earned income; secondary outcomes included receipt of employer–sponsored health insurance, Medicaid, and Supplemental Nutrition Assistance Program benefits.
Results
The sample included 1 322 263 health care workers from 2010-2019. Health care workers in expansion states were similar to those in nonexpansion states in age, sex, and educational attainment, but those in expansion states were less likely to identify as non-Hispanic Black. Medicaid expansion was associated with a 2.16% increase in annual incomes (95% CI, 0.66%-3.65%; P = .005). This effect was driven by significant increases in annual incomes among the top 2 highest-earning quintiles (β coefficient, 2.91%-3.72%), which includes registered nurses, physicians, and executives. Health care workers in lower-earning quintiles did not experience any significant changes. Medicaid expansion was associated with a 3.15 percentage point increase in the likelihood that a health care worker received Medicaid benefits (95% CI, 2.46 to 3.84; P < .001), with the largest increases among the 2 lowest-earning quintiles, which includes health aides, orderlies, and sanitation workers. There were significant decreases in employer–sponsored health insurance and increases in SNAP following Medicaid expansion.
Conclusion and Relevance
Medicaid expansion was associated with increases in compensation for health care workers, but only among the highest earners. These findings suggest that improvements in health care sector finances may increase economic inequality among health care workers, with implications for worker health and well-being.
This study examines the difference in health care worker compensation between states that expanded and those that did not expand Medicaid after the passage of the Affordable Care Act.
Introduction
There are vast inequalities in compensation among health care workers, who comprise a range of occupations, including health aides, service workers, nurses, physicians, and executives.1,2,3,4 Health care workers’ economic outcomes may be affected by changes in health care organization finances, which are subject to market forces such as payment reforms or consolidation. Relative to physicians or nurses,5,6,7,8 less is known about the market drivers of compensation among those in the lower-income brackets. Lower-income health care workers constitute the majority of the health care workforce1,2,9and are increasingly recognized as critical for the provision of health care, particularly as the supply of some workers (eg, home health aides) has not risen to meet demand.10 Low-income health care workers also experience a high prevalence of poverty and are underrepresented racial and ethnic minority women, who have faced systemic barriers to economic advancement.2,11,12,13 Altogether, this segment of the workforce represents essential frontline workers who are at socioeconomic risk.
This study examined the relationship between Medicaid expansion under the Affordable Care Act (ACA) and incomes and benefits for health care workers. Medicaid expansion represents a useful case study given its scope, importance to recent health policy efforts, and its well-established role in improving health care organizations’ finances in expansion states.14,15,16,17,18,19,20 Although health care organizations may have shared their financial improvements with its workforce with better wages or benefits, those in lower-income occupations may have been less likely to benefit due to long-standing occupational stratification, limited bargaining power, prevalence of contract work, or greater substitutability with workers from non–health care settings.1,6,11 Additionally, understanding the spillover effects of Medicaid expansion on low-income health care workers is important given emerging evidence on the relationship between economic circumstances and health outcomes among workers themselves21 and the patients they serve.22
Methods
This study of public, deidentified data did not constitute human subjects research and did not require institutional review board approval.
Data Sources and Sample
We used individual-level data from the IPUMS (Integrated Public Use Microdata Series) 2010-2019 American Community Survey (ACS).23 The ACS is a large, annual, nationally representative survey (1% sample) of the noninstitutionalized civilian population conducted by the US Census Bureau containing information on industry, occupation, income, earnings, and noncash benefits. State-level Medicaid expansion data were obtained from the Kaiser Family Foundation.24
For analyses of the primary outcome (annual income), and most secondary outcomes (receipt of employer–sponsored health insurance, enrollment in Medicaid or the Supplemental Nutrition Assistance Program [SNAP], total hours worked), the study sample was restricted to working-age respondents (ages 18-65 years) reporting current employment in the health care industry (defined using standard industry classification codes; eTable 1 in Supplement 1). We categorized health care workers using industrial codes to ensure that workers in occupations that did not work directly with patient, such as hospital or clinic administration or sanitation workers, were included.2 For 1 secondary outcome (likelihood of being employed in the health care sector), we expanded our sample to include all currently employed ACS respondents (ages, 18-65 years).
Exposure
The exposure was an indicator for whether a respondent resided in a state that expanded Medicaid by December 31, 2018. We chose this date to ensure sufficient follow-up periods to facilitate difference-in-difference comparisons. The exposure term was equal to 1 if the respondent was surveyed in a year after Medicaid expansion occurred in their state, and 0 otherwise.
We excluded respondents from states that had expanded Medicaid for adults up to 100% of the federal poverty level prior to 2014 and treated states that expanded Medicaid after 2018 as nonexpansion states given limited follow-up.25,26 A complete list of the 46 states included and expansion dates for 30 states can be found in Figure 1 and eTables 2 and 3 in Supplement 1.
Figure 1. Medicaid Expansion Status by State.

Respondents from states that had expanded Medicaid for adults up to 100% of the federal poverty level prior to 2014. States that expanded Medicaid after 2018 were excluded because follow-up would be limited to less than a year for most respondents. The District of Columbia was excluded because it had an ACA-like option for low-income adults since 2010. Removing respondents from these states did not change any of the substantive findings. Data on expansion year come from the KFF (formerly Kaiser Family Foundation).
Outcomes
The primary outcome was the natural logarithm of annual income among health care workers. We chose this transform given the well-known skew in earnings. We computed inflation-adjusted annual incomes for respondents by summing wages with additional business and farm income.2
We considered 3 benefit-related secondary outcomes: (1) received employer–sponsored health insurance, a common benefit that is more likely to be provided as compensation becomes more generous27; (2) received Medicaid; or (3) received SNAP, given that lower-income health care workers often qualify for and access the latter 2 programs.2 We examined SNAP given the known association between Medicaid participation and SNAP receipt28 and because uptake of SNAP provides important context on the degree of economic precarity among this population. We also assessed whether the labor force was expanding or working more to meet the demands of the newly insured under Medicaid expansion with 2 additional outcomes: (1) among workers, the likelihood that an individual was working in health care and (2) among health care workers, total hours worked.
Statistical Analysis
First, we examined whether Medicaid expansion was associated with differential changes in logged annual incomes among health care workers using a difference-in-differences study design (eMethods in Supplement 1). We adjusted for respondent age and age squared, educational attainment (≤high school, some college, associate’s degree, ≥4-year college degree), sex (male, female), and race and ethnicity (self-reported Hispanic, non-Hispanic Black, non-Hispanic White, and non-Hispanic other). We accounted for time invariant state-level characteristics that may be correlated with the likelihood of a state adopting Medicaid as well as secular trends in health care employment using state fixed effects. Race and ethnicity were self-reported using closed categories, aggregated by the research team into 4 distinct categories, and assessed given historical occupational stratification in health care.
We also report estimates from an event study specification (eMethods in Supplement 1).29,30 These specifications facilitate assessments of violations of the parallel trends assumption, as well as how outcomes may differentially change with exposure over time.31 We chose an event time window from 4 years before the expansion to 5 years after it to ensure a relatively balanced panel of states.
We then examined whether associations between Medicaid expansion and logged annual incomes varied across health care worker income classes. To create measures of income classes, we regressed income on occupation–level fixed effects, age and age squared,32,33 sex, level of education, and survey year. We used data for respondents surveyed in the pre-ACA period for these regressions to remove any effects of Medicaid expansion on income class membership. We then used these regressions to compute predicted incomes for all sample respondents, thereafter, grouping respondents into equally-sized quintile bins based on predicted income.34 This procedure effectively groups similarly remunerated occupations into broad, comparable income-based categories, allowing us to examine a wide array of occupations, including those with small sample sizes. Occupational categories represented in each predicted income class are in eTable 4 in Supplement 1. We used a joint significance test (Wald, F test) to assess whether differences in estimates across income classes were statistically significant (eMethods in Supplement 1).
We thereafter examined differential changes in the secondary outcomes of receipt of SNAP, employer–sponsored health insurance, or Medicaid benefits among health care workers as well as changes in the size of the health care labor force and hours worked, employing the same regression setup as for the primary outcome.
Given that the timing of Medicaid expansion varied across states and potential impacts may vary across workers, we estimated our models using the approach of d’Chaisemartin and D’Haultfoeuille,30,35 which addresses biases that may arise in two-way fixed-effect models due to staggered policy adoption and heterogeneous treatment effects.36 We considered estimates from standard two-way fixed-effects models as a sensitivity check.
For all models, we used ACS sample weights and adjusted for clustering at the state-level; P values were from 2-sided tests, with statistical significance deemed as P < .05. Analyses were conducted using Stata/MP, version 16.1 (StataCorp).
Results
Sample Characteristics
The sample included 1 322 263 health care workers in 46 states between 2010 and 2019 (Table 1). There were 809 465 health care workers in 30 expansion states, and 512 798 health care workers in 16 nonexpansion states. Characteristics of health care workers were similar between expansion and nonexpansion states in age (unadjusted mean [SD], 42 [12] years vs 42 vs [12] years), sex (unadjusted percent female, 77.43% vs 78.85%), and educational attainment (unadjusted percent bachelor’s degree, 41.58% vs 38.02%). Health care workers in expansion states were less likely to identify as non-Hispanic Black (unadjusted percent, 12.06% vs 20.62%), earned slightly more (unadjusted mean [SD], $60 817 [$73 620] vs $56 329 [$70 467]), and were more likely to report having employer–sponsored health insurance (unadjusted percent, 79.51% vs 76.93%) and Medicaid benefits (unadjusted percent, 6.93% vs 3.96%; Table 2). The average number of hours worked per week was similar for health care workers in both expansion and nonexpansion states (unadjusted mean, 38 vs 39 hours). (See eTable 5 in Supplement 1 for sample characteristics stratified by predicted income classes.)
Table 1. Baseline Characteristics of Health Care Workers Included in the Estimation Sample, Stratified by Exposurea.
| No. (%) of health care workers | ||
|---|---|---|
| Expansion states (n = 809 465) | Nonexpansion states (n = 512 798) | |
| No. of statesb | 30 | 16 |
| Demographic characteristics | ||
| Age, mean (SD), y | 42 (12) | 42 (12) |
| Sex | ||
| Female | 626 767 (77.43) | 404 352 (78.85) |
| Male | 182 698 (22.57) | 108 445 (21.15) |
| Race and ethnicityc | ||
| Hispanic | 93 380 (11.54) | 65 440 (12.76) |
| Non-Hispanic Black | 97 630 (12.06) | 105 726 (20.62) |
| Non-Hispanic White | 541 382 (66.88) | 317 721 (61.96) |
| Other | 80 807 (9.98) | 25 848 (5.04) |
| Education | ||
| High school or less | 156 458 (19.33) | 106 539 (20.78) |
| Some college | 181 464 (22.42) | 119 181 (23.24) |
| Associate’s degree | 134 972 (16.67) | 92 132 (17.97) |
| ≥Bachelor’s degree | 336 571 (41.58) | 194 945 (38.02) |
Data on health care workers were obtained from the American Community Survey (ACS), 2010-2019 waves. See the Methods section for a definition of the ACS. Data are self-reported and collected using closed-ended questions. Health care workers were identified using standard industry codes (eTable 1 in Supplement 1). Exposure status was determined at the state of residence level, using data from the Kaiser Family Foundation. Unless otherwise specified, cells report raw number of health care workers, with proportions calculated using ACS sample weights in parenthesis. Means (SDs) refer to quantities computed using ACS sample weights.
See eTable 2 in Supplement 1 for states included in each exposure group.
Race and ethnicity were self-reported in the ACS by respondents using closed categories, aggregated by the research team into 4 distinct categories, and assessed given the historical processes of occupational stratification in health care. Other refers to any individual who did not identify as Hispanic, non-Hispanic Black, or non-Hispanic White.
Table 2. Summary Statistics of Outcomes Among Health Care Workers Included in the Estimation Samplea.
| No. (%) of health care workers | ||
|---|---|---|
| Expansion states (n = 809 465) | Nonexpansion states (n = 512 798) | |
| No. of statesb | 30 | 16 |
| Primary outcome | ||
| Annual income, mean (SD), $ | 60 817 (73 620) | 56 329 (70 467) |
| Secondary outcomes | ||
| Employer–sponsored health insurance | 643 605 (79.51) | 394 493 (76.93) |
| Medicaid | 56 126 (6.93) | 20 321 (3.96) |
| SNAP | 65 805 (8.13) | 51 299 (10.00) |
| Any health insurance | 753 488 (93.08) | 457 451 (89.21) |
| Usual hours worked per week, mean (SD) | 38 (11) | 39 (11) |
Abbreviation: SNAP, Supplemental Nutrition Assistance Program.
Data on health care workers were obtained from the American Community Survey (ACS) 2010-2019 waves. (See the Methods section for a definition of ACS.) For a definition of how health care workers were identified and how exposure status was determined, see footnote a in Table 1. Unless otherwise specified, cells report raw number of health care workers, with proportions calculated using ACS sample weights in parenthesis. Means (SDs) refer to quantities computed using ACS sample weights.
See eTable 2 in Supplement 1 for states included in each exposure group.
Difference-in-Differences Estimates for Primary Outcome
Estimates pertaining to the primary outcome of logged annual income can be interpreted as percentage changes. In adjusted models, health care workers in Medicaid expansion states experienced a 2.16% increase in annual income (95% CI, 0.66%-3.65%; P = .005) after expansion occurred relative to health care workers in nonexpansion states (Table 3). Estimates from standard 2-way fixed-effects models were similar, although slightly less precisely estimated (eTable 6 in Supplement 1).
Table 3. Difference-in-Differences Estimates of Changes in Income and Benefit Receipt Before and After State-Level Medicaid Expansiona.
| No. of health care workers | Unadjusted means | Absolute difference in differencesb | ||||||||
|---|---|---|---|---|---|---|---|---|---|---|
| Expansion states | Nonexpansion states | |||||||||
| Before | After | Difference | Before | After | Difference | Unadjusted | Adjusted, % (95% CI)c | P value | ||
| Primary outcomes | ||||||||||
| Logged annual incomed | 1 321 921 | 10.20 | 10.30 | 0.10 | 10.15 | 10.23 | 0.08 | 0.02 | 2.16 (0.66 to 3.65) | .005 |
| Secondary outcomes | ||||||||||
| Employer–sponsored health insurance | 1 322 263 | 0.61 | 0.63 | 0.02 | 0.57 | 0.59 | 0.02 | 0.00 | −0.81 (−1.89 to 0.27) | .14 |
| Medicaid | 1 322 263 | 0.11 | 0.16 | 0.05 | 0.10 | 0.10 | 0.00 | 0.05 | 3.15 (2.46 to 3.84) | <.001 |
| SNAP | 1 322 263 | 0.13 | 0.11 | −0.02 | 0.15 | 0.13 | −0.02 | 0.00 | 0.72 (0.06 to 1.4) | .07 |
Abbreviations: ACS American Community Survey; SNAP, Supplemental Nutrition Assistance Program.
Each row reports results from a separate regression. Estimates are scaled to reflect changes in percent of income or percent point of employer–sponsored health insurance, Medicaid, and SNAP. The sample includes all health care workers identified in the ACS. (See the Methods section for a definition of ACS.)
Models were estimated using the method of d’Chaisemartin and D’Haultfoeuille29,34 adjusted for respondent age, educational attainment, sex, and race and ethnicity; time invariant state-level fixed effects; and national calendar year trends.
The 95% CI are based on standard errors that adjust for cluster at the state (policy) level. See the Methods section for further details.
Means and unadjusted differences correspond to annual incomes, whereas the difference-in-differences estimates correspond to the logged annual income.
Figure 2 provides event study estimates. Each point represents the adjusted difference in logged annual income among health care workers in expansion and nonexpansion states relative to a preexpansion reference year (event year = −1). Patterns revealed little evidence of preexisting trends in the outcome (if anything, preexisting trends were in the opposite direction of the postexpansion estimates). There were immediate increases in incomes in the expansion year, followed by gradual increases in later years.
Figure 2. Event Study Estimates of Expansion States Relative to Nonexpansion States Before and After State-Level Medicaid Expansion.
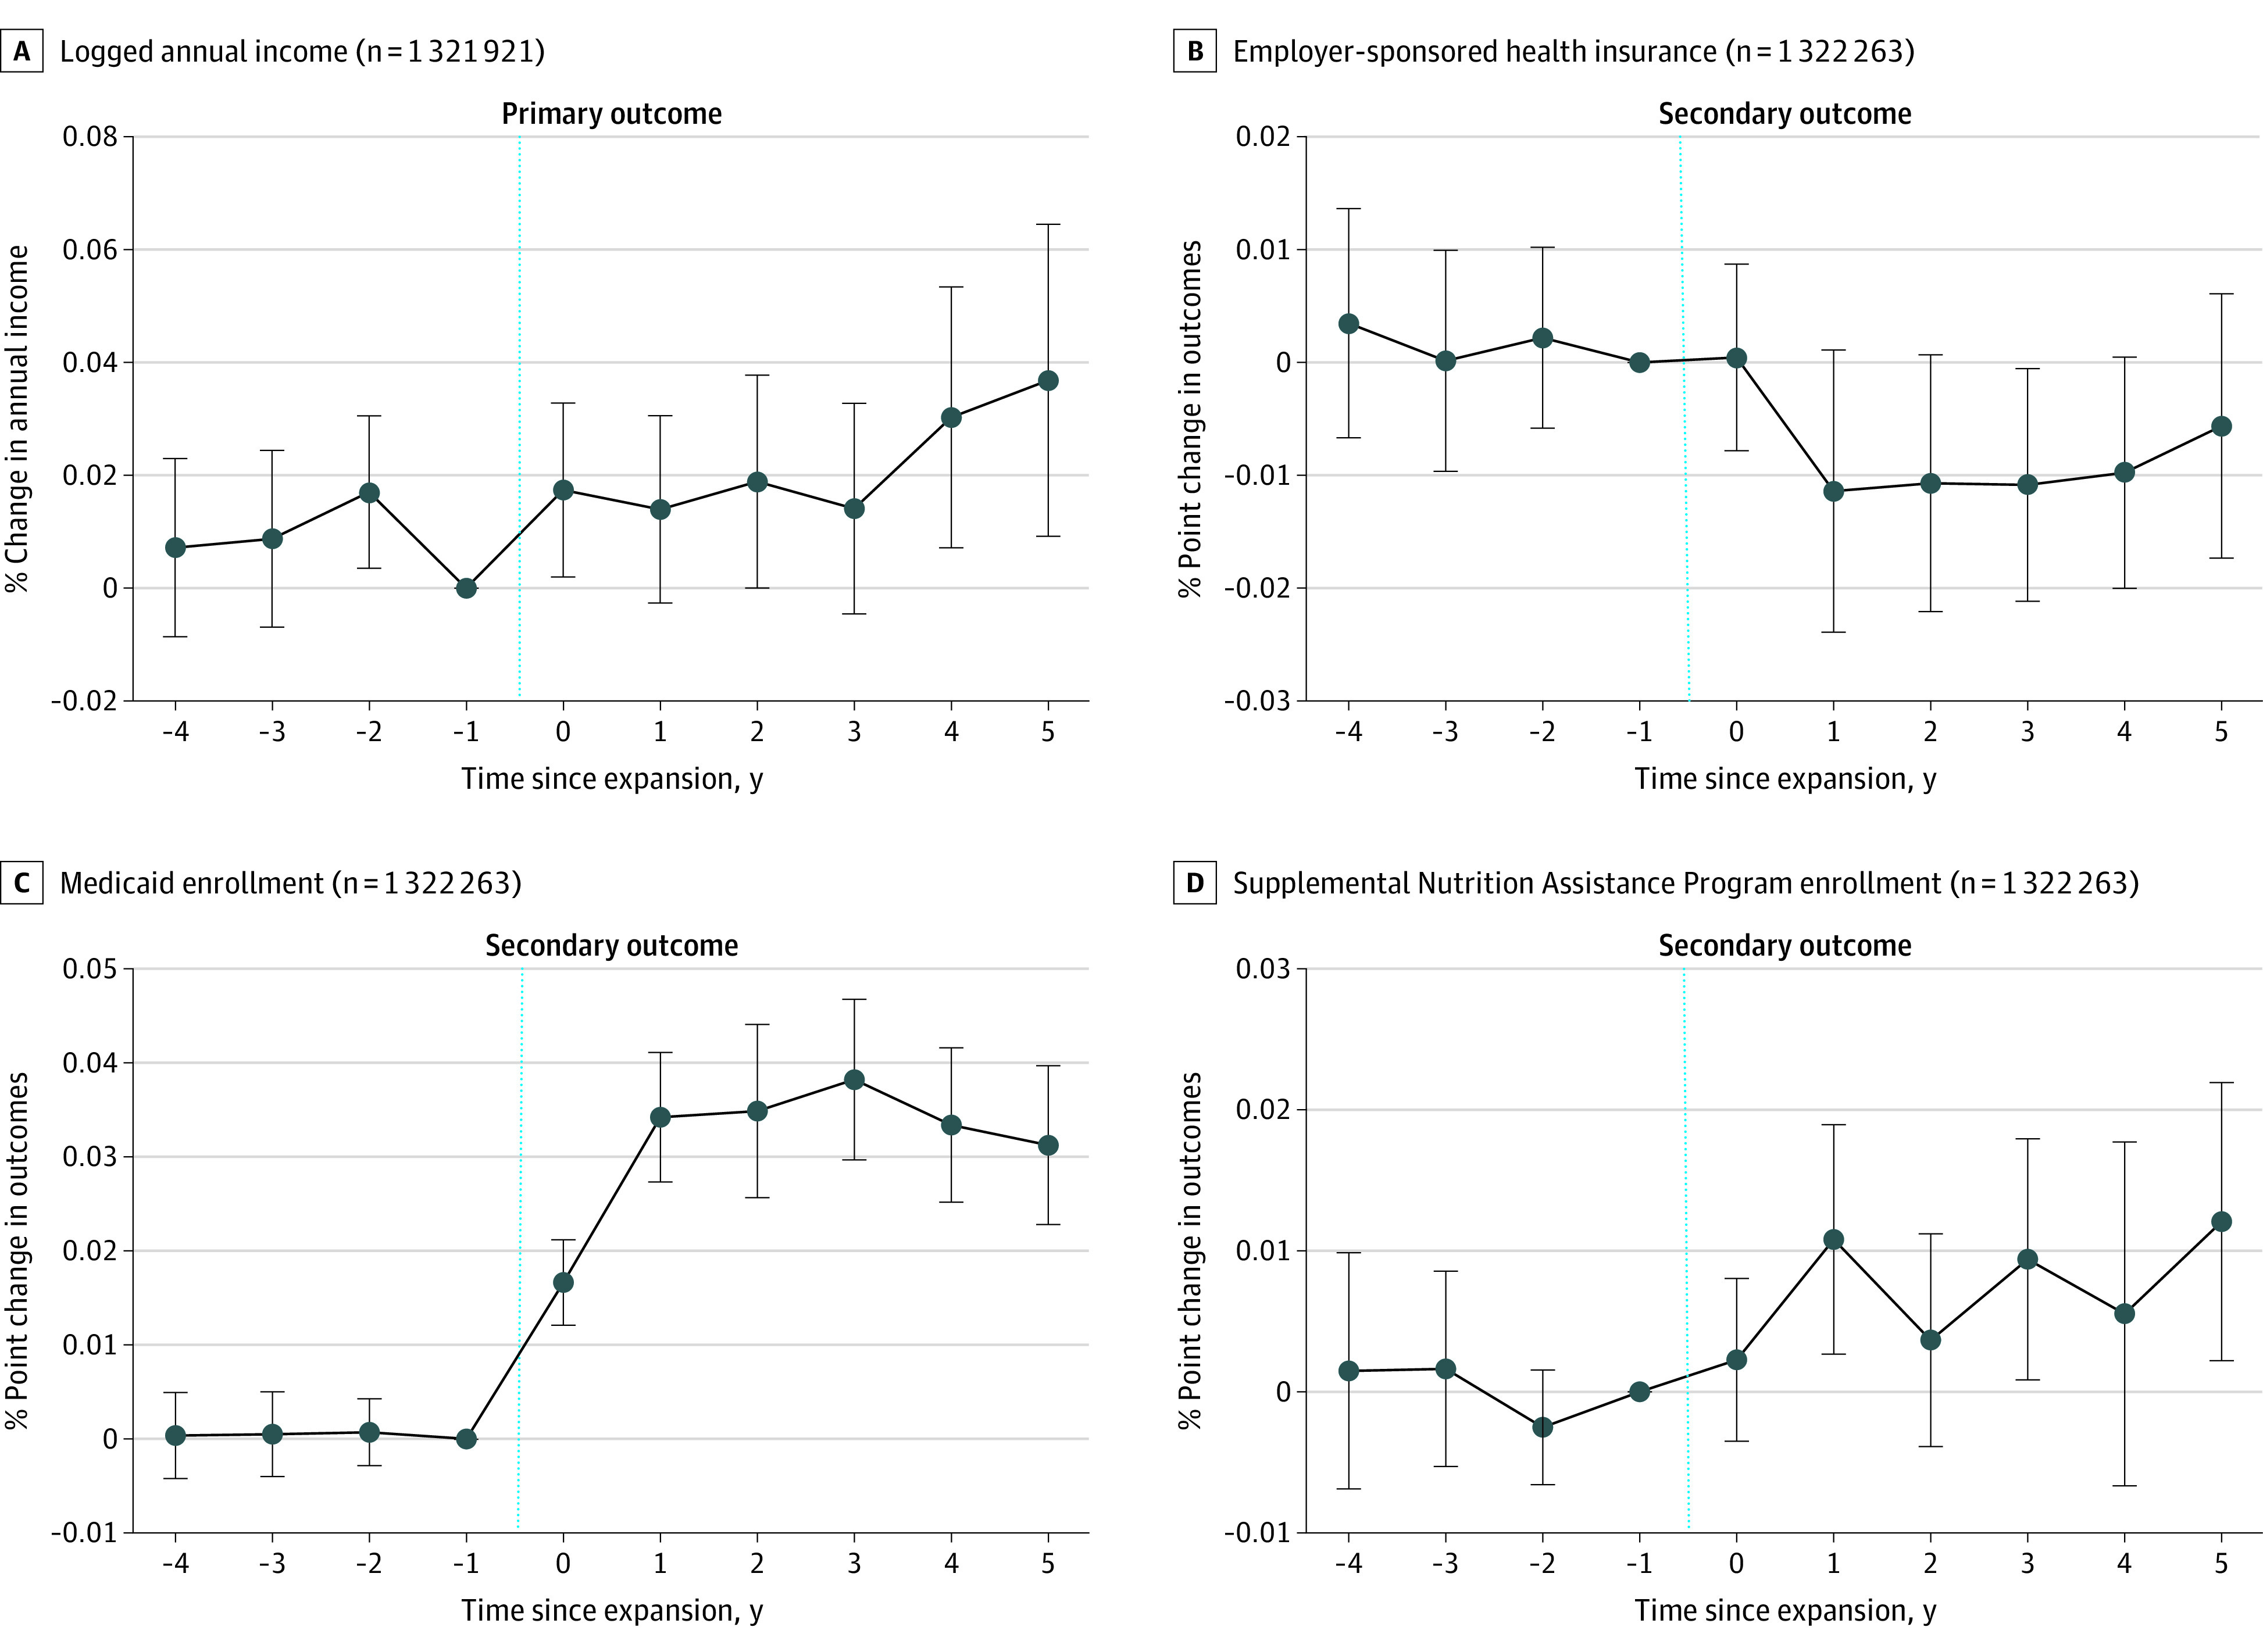
Each panel reports estimates from a separate event study regression specification. The y-axis plots regression β coefficients for each event time. These βs are unscaled, but can be multiplied by 100 to recover either the percent change or percent point change. In all panels, the x-axes represent the number of years relative to the timing of state Medicaid expansions. All models were estimated using the method of d’Chaisemartin and D’Haultfoeuille29-34 and were adjusted for respondent age, educational attainment, sex, race and ethnicity, time invariant state-level fixed effects, and national calendar year trends. The 95% CIs are based on standard errors that adjust for cluster at the state (policy) level. The vertical blue dotted line represents the period immediately before the Medicaid expansion. (See the Methods section for further details.)
We found heterogeneous changes in income after Medicaid expansion across quintiles of predicted income (eTable 8 in Supplement 1; F statistic, 4.38; P = .004) in 2-way fixed-effect models. Medicaid expansion was associated with significant increases in annual incomes of health care workers only in the fourth and fifth (highest) quintiles (Figure 3), which predominantly comprised registered nurses, physicians, and managers (eTable 4 in Supplement 1). The fifth (highest) quintile experienced a 3.72% increase in annual incomes after Medicaid expansion (95% CI, 1.57 to 5.87; P < .001). In the bottom 3 quintiles, which included nursing aides, non–nursing health aides, cleaners, housekeepers, and office staff, changes in income were smaller and not significant. In the lowest-quintile group, health care workers in expansion states experienced a nonsignificant 1.1% decrease in incomes relative to those in nonexpansion states (95% CI, −3.69% to 1.49%; P = .41). (eFigure 1 in Supplement 1 reports event study estimates for each quintile.)
Figure 3. Differences-in-Differences Estimates of Changes in Income and Private and Public Benefits .
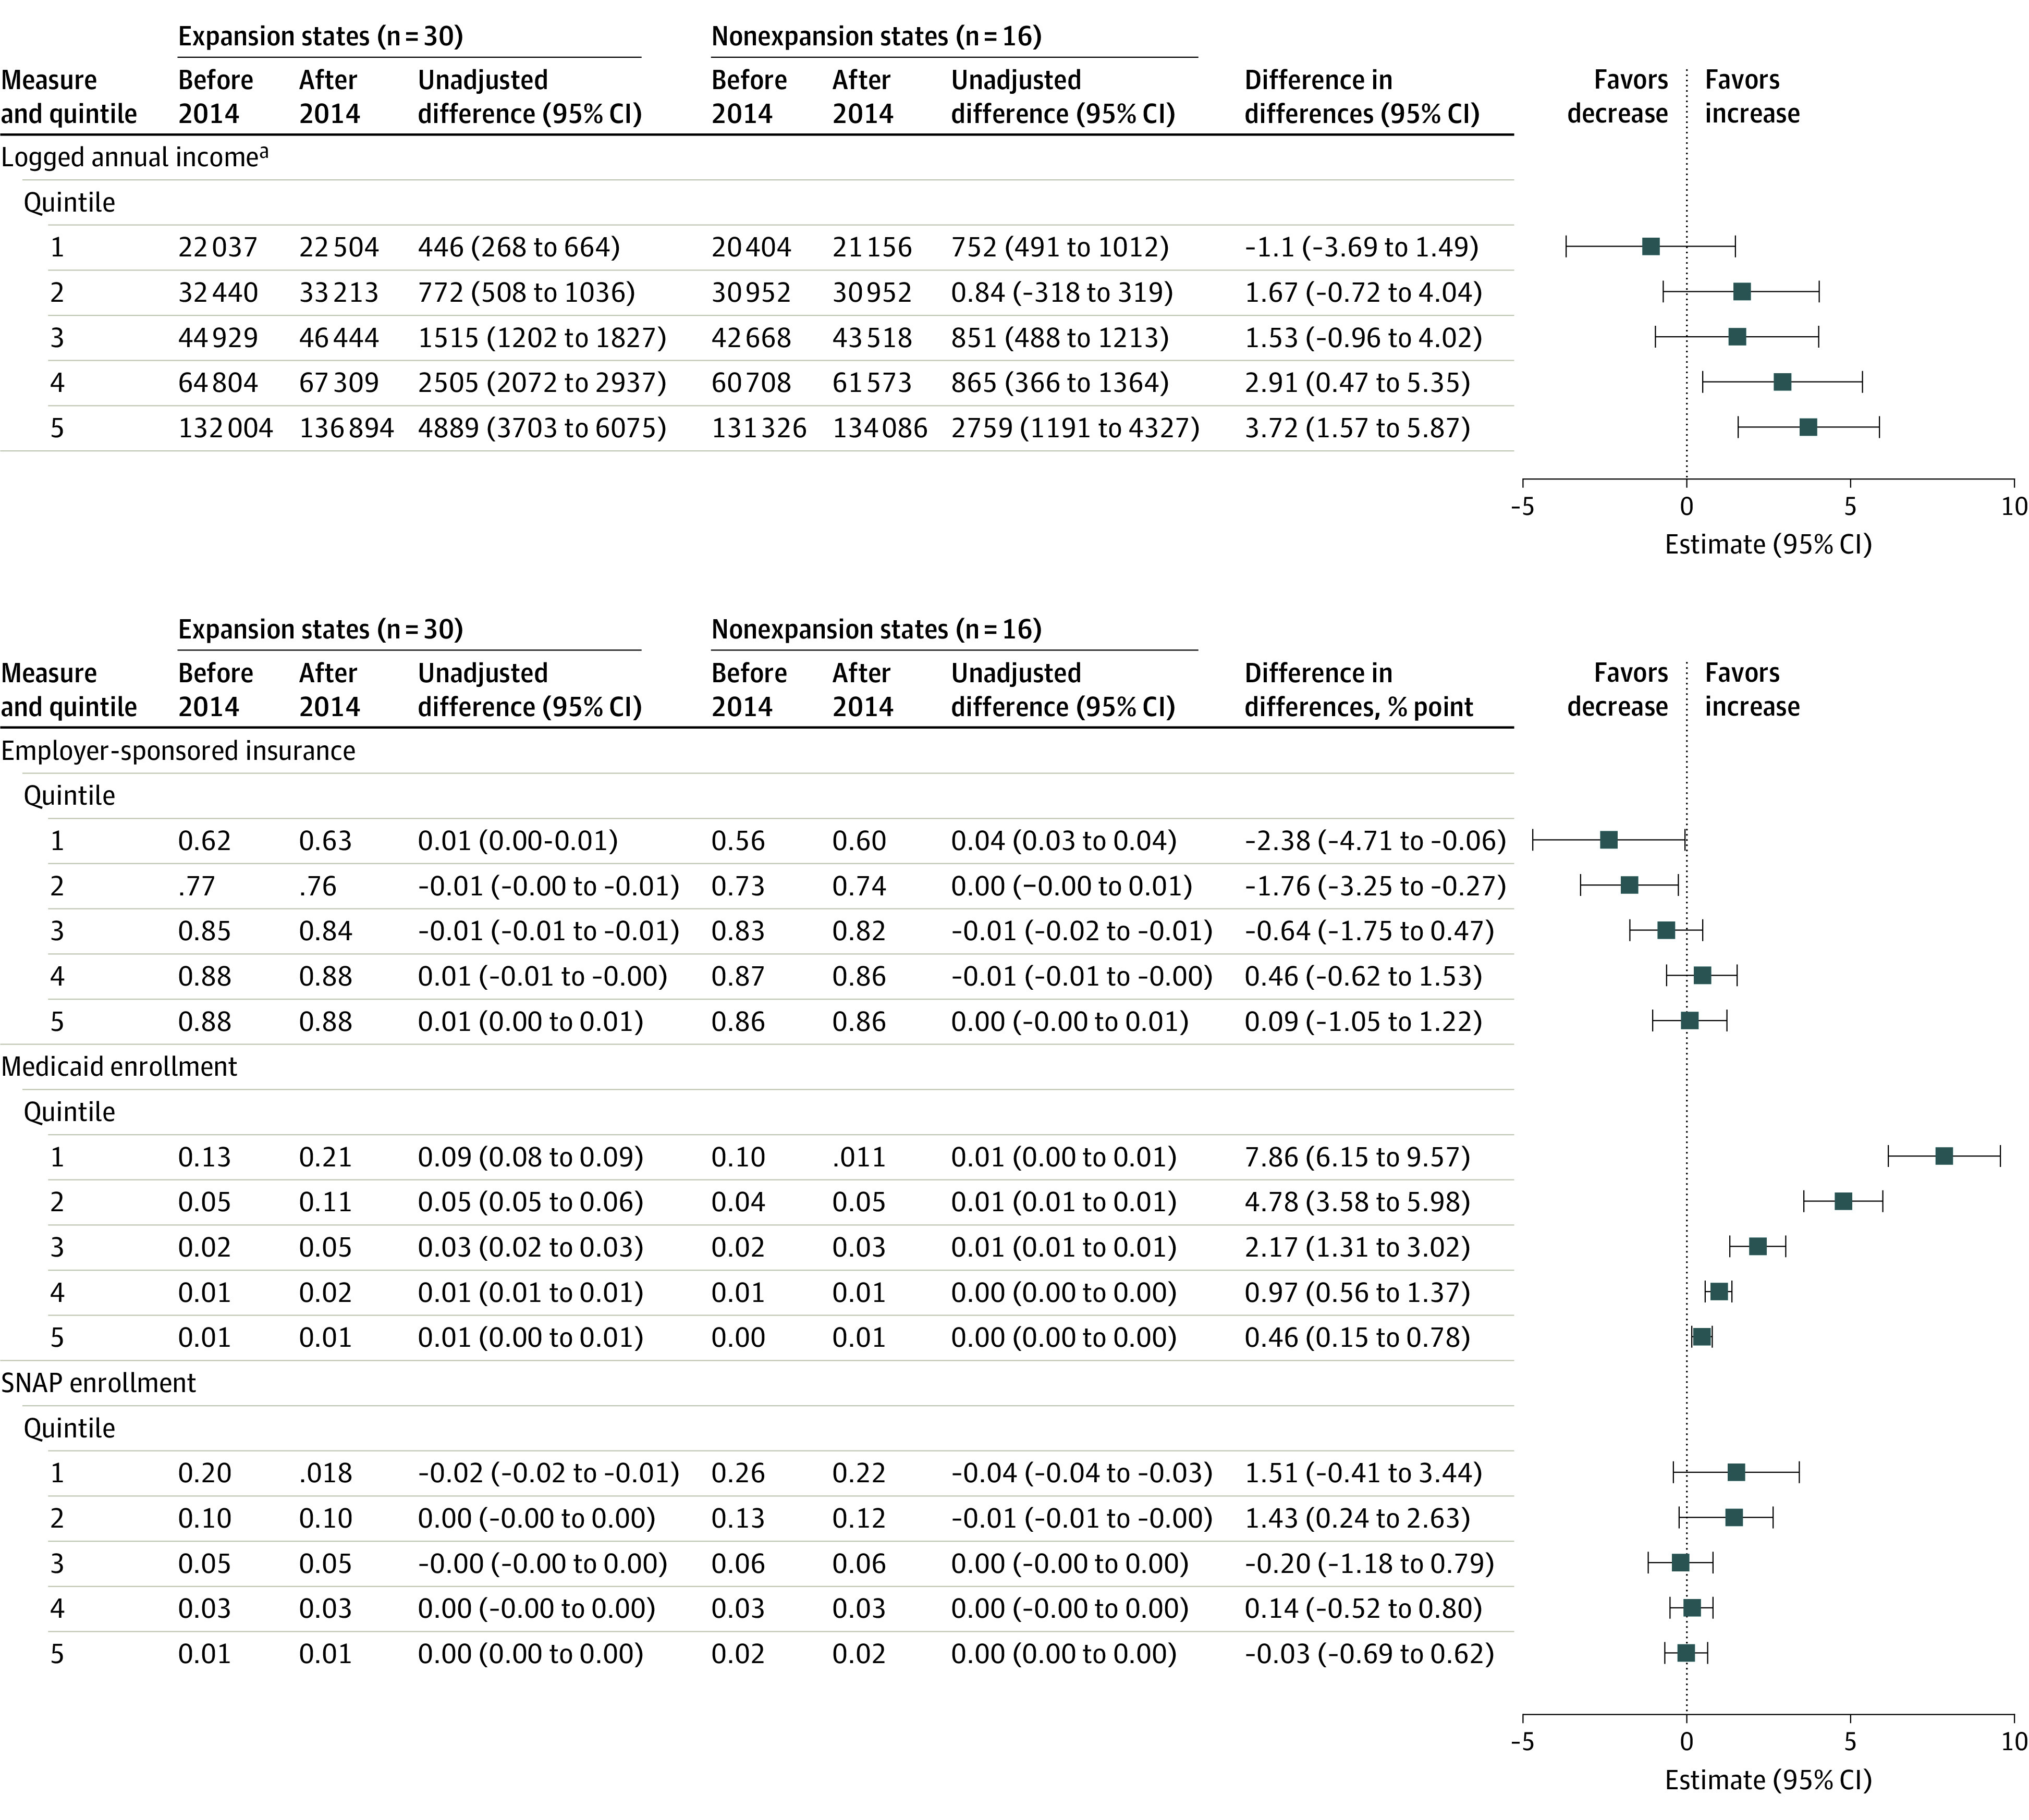
Each panel reports estimates from 5 separate regressions, 1 for each quintile of predicted income class for each outcome. Estimates are scaled to reflect changes in percent for income or percentage point for employer–sponsored health insurance, Medicaid, and SNAP (Supplemental Nutrition Assistance Program) in the outcomes. All models were estimated using the method of d’Chaisemartin and D’Haultfoeuille29,34 and were adjusted for respondent age, educational attainment, sex, and race and ethnicity; time invariant state-level fixed effects; and national calendar year trends. The 95% CIs are based on standard errors that adjust for cluster at the state (policy) level.
aMeans and unadjusted differences correspond to annual incomes, whereas the difference-in-differences estimates correspond to the logged annual incomes.
Difference-in-Differences Estimates for Secondary Outcomes
Benefits
Estimates pertaining to secondary outcomes can be interpreted as percentage point changes. There was no significant change in the receipt of employer–sponsored health insurance (β = −0.81; 95% CI, −1.89 to 0.27; P = .14; Table 2). However, there were significant changes in the percentage of those receiving Medicaid benefits (β = 3.15 percentage points; 95% CI, 2.46 to 3.84, P < .001; 68% increase relative to the preexpansion mean) and in receipt of SNAP benefits (β = 0.72 percentage points; 95% CI, 0.06 to1.4; P = .07). Event study estimates for all 3 outcomes showed little evidence of preexisting trends, with some significant event-time estimates for employer–sponsored health insurance and SNAP benefits (Figure 3). Event studies also revealed different temporal trends in the relationship between Medicaid expansion and the secondary outcomes: Medicaid participation among health care workers rose in expansion states relative to nonexpansion states during the first expansion year; any relative changes in employer–sponsored health insurance and SNAP receipt among health care workers followed a year after.
Differences existed in the association between Medicaid expansion and secondary outcomes across income quintiles (Figure 3; eTables 7 and 8 in Supplement 1). Health care workers in the 2 lowest-income quintiles were less likely to report receiving employer–sponsored health insurance coverage after the Medicaid expansion (quintile 1, −2.38 percentage points; 95% CI, −4.71 to −0.06; P = .04; 3.9% decrease relative to the preexpansion mean; quintile 2, −1.76 percentage points; 95% CI, −3.25 to −0.27; P = .02; 2.5% decrease relative to the preexpansion mean), with no differences among higher-income quintiles. Changes in Medicaid participation varied across predicted income quintiles: Health care workers in expansion states in the lowest-income quintile reported the largest increase in Medicaid coverage after expansion relative to those in nonexpansion states (β = 7.86 percentage points; 95% CI, 6.15 to 9.57; P < .001), whereas those in the highest-income quintile reported a statistically significant, but smaller increase (β = 0.46 percentage points; 95% CI, 0.15 to 0.78; P < .001). No significant or substantive change in insurance coverage from any source was found (eTable 7 in Supplement 1). Statistically significant increases in SNAP participation were found for health care workers in the second lowest-income quintile (β = 1.43 percentage points; 95% CI, 0.24 to 2.63; P = .02). (See eFigures 2-4 in Supplement 1 for corresponding event studies.)
Workforce Characteristics
There were no significant changes in the likelihood of employment in the health care sector (β = 0.07 percentage points; 95% CI, −0.17 to 0.30; P = .58; eTable 7 in Supplement 1). There were differentials, though nonsignificant, increases in total hours worked (β = 17.46 hours; 95% CI, −0.32 to 35.24; P = .05; eTable 7 in Supplement 1).
Discussion
This national study suggests that incomes for health care workers residing in expansion states increased after expansion relative to health care workers in nonexpansion states. This finding was driven by the highest–earning health care workers, which included registered nurses, physicians, and managers. Health care workers in lower-earning occupations did not experience significant increases in annual incomes. Instead, these workers were more likely to participate in Medicaid and less likely to receive employer–sponsored health insurance after expansion.
These findings yield several implications. First, they suggest that insurance expansions, which led to financial windfalls in health care organizations,14,15,16,17,18,19 may have benefitted only a subset of workers in ways that can exacerbate economic inequality. These findings may reflect differences in the demand for different types of work (which may differentially increase with greater insurance coverage for the population) as well as the supply of available workers. However, these findings may also reflect well-known occupational stratification in health care, in which lack of bargaining power, employment by contracting agencies, and other market features may limit gains from improvements in overall health system finances for lower-income occupations. Given that lower–income health care workers tend to be women from minoritized groups1,2 and face higher mortality risks,21 the findings in the current study suggest a potential mechanism by which health system finances may inadvertently contribute to structural marginalization. The lack of increases in income among lower-income health care workers may also have consequences for health care quality, given evidence that increasing compensation for lower–income health care workers with patient-facing roles (eg, health aides or nursing home workers) has been associated with improvements in patient safety and experience.22 This finding may also have consequences for health care access because the current supply of health aides and nursing home workers may be insufficient to meet the growing needs of an aging and multimorbid population.10
The findings in the current study of increases in Medicaid participation and reductions in employer–sponsored health insurance receipt among lower–income health care workers are consistent with several possibilities. It is possible that Medicaid incentivized workers to choose a cheaper public option over their private insurance coverage or led employers to raise premiums for their own coverage leading to substitions.37,38 It is also possible that Medicaid expansion, through offering a publicly funded alternative, offset some costs borne by health care employers or contract agencies in providing benefits to low-income employees. If this type of substitution were to occur, it would represent another mechanism, in addition to reductions in uncompensated care, by which health care organizations may have benefitted from Medicaid expansion. Whether substitution from employer–sponsored health insurance to Medicaid is good for workers is not clear. On the one hand, the findings may reflect that Medicaid expansion fostered greater agency in job selection among lower-income workers.39,40,41 Work from the pre-ACA era shows that few people substitute Medicaid for private health insurance coverage voluntarily.42 On the other hand, Medicaid may also be associated with administrative burdens and narrower network options for beneficiaries relative to private health insurance coverage, resulting in the introduction of additional barriers to care for a population of workers already at-risk of adverse health outcomes.43,44 It is possible that in the ACA-era, Medicaid coverage could dominate high-contribution, employer–sponsored health insurance options offered by employers given that Medicaid coverage can offer greater financial protection than private insurance and often has similar benefit structures.44,45 Regardless, although these results suggest reciprocal (but not fully offsetting) changes in Medicaid and employer–sponsored health insurance participation, it is important to note that significant increases were found in health care workers who report having any health care coverage.
Finally, these results suggest that the health care workforce may not have expanded commensurately to meet demands of the newly insured population. Although this may not have led to compromised access to care for patients,46 this finding, consistent with prior work,47 suggests that financial resources that accrued to health care organizations were not devoted to reducing the demand on existing workers. Worker well-being is critical to organizational performance48,49 with potential implications for patient safety and health care quality.50 Health care workers already faced high rates of burnout before COVID-19,51,52 which was exacerbated by the pandemic.53 Although the results of the current study show that health care organizations may translate financial gains into investing in some workers, they may be doing a disservice by not equally investing in lower-income workers as well. Taken together, these findings contribute to the literature on how health care organizations respond to financial gain by showing one of many ways such organizations do (or do not) allocate their profits.
Limitations
This study had several limitations. First, despite a quasi-experimental approach, there may be other unmeasured trends in the health care sector varying at the state-year level, such as preemptive changes in employment in anticipation of Medicaid expansion, that are correlated with Medicaid expansion in ways that affected economic outcomes among health care workers. Second, the mechanisms underlying these results cannot be elaborated because to do so would require more detailed information from specific employers (eg, salary and benefits for all workers in a health system) than is available. Similarly, given the repeated cross-section nature of these data, individual-level changes in wages and benefits were not observed. Individual data at the employer level were not available, which also precluded the ability to assess variation across different health care settings. Given prior work indicating the financial benefits of Medicaid expansion accrued to hospitals, primary care clinics, community health centers, and nursing homes, these findings could be generalized to some extent.54,55 Finally, self-reported data may be subject to measurement error. In particular, self-reported income data among health care workers may differ from incomes reported in tax documents.7
Conclusions
Medicaid expansion was associated with increases in annual income for health care workers but only among those in the highest-income strata. These findings suggest that improvements in health care sector finances may increase economic inequality among health care workers, with implications for worker health and well-being.
eMethods 1. Statistical models
eTable 1. Industry classification codes used to identify health care workers
eTable 2. Medicaid expansion and non-expansion states
eTable 3. Dates of Medicaid expansion
eTable 4. Occupations represented in predicted income classes
eTable 5. Sample characteristics, stratified by predicted income classes
eTable 6. Differences-in-differences estimates using two-way fixed effects models
eTable 7. Differences-in-differences estimates for additional workforce outcomes
eTable 8. Difference-in-difference estimates for primary and secondary outcomes interacted by quintile
eFigure 1. Event study estimates of changes in income among HCWs before and after state-level Medicaid expansion stratified by income quintile
eFigure 2. Event study estimates of changes in ESHI among HCWs before and after state-level Medicaid expansion stratified by income quintile
eFigure 3. Event study estimates of changes in Medicaid among HCWs before and after state-level Medicaid expansion stratified by income quintile
eFigure 4. Event study estimates of changes in SNAP among HCWs before and after state-level Medicaid expansion stratified by income quintile
Data Sharing Statement
References
- 1.Dill J, Hodges MJ. Is healthcare the new manufacturing? industry, gender, and “good jobs” for low- and middle-skill workers. Soc Sci Res. 2019;84:102350. doi: 10.1016/j.ssresearch.2019.102350 [DOI] [PubMed] [Google Scholar]
- 2.Himmelstein KEW, Venkataramani AS. Economic vulnerability among US female health care workers: potential impact of a $15-per-hour minimum wage. Am J Public Health. 2019;109(2):198-205. doi: 10.2105/AJPH.2018.304801 [DOI] [PMC free article] [PubMed] [Google Scholar]
- 3.Ahmed AM, Kadakia K, Ahmed A, Shultz B, Li X. Trends in labor unionization among US health care workers, 2009-2021. JAMA. 2022;328(24):2404-2411. doi: 10.1001/jama.2022.22790 [DOI] [PMC free article] [PubMed] [Google Scholar]
- 4.Matta S, Nicholas LH. Changes in unemployment among health care workers following the COVID-19 pandemic. JAMA. 2022;328(16):1639-1641. doi: 10.1001/jama.2022.17608 [DOI] [PMC free article] [PubMed] [Google Scholar]
- 5.Cantor J, Whaley C, Simon K, Nguyen T. US health care workforce changes during the first and second years of the COVID-19 pandemic. JAMA Health Forum. 2022;3(2):e215217. doi: 10.1001/jamahealthforum.2021.5217 [DOI] [PMC free article] [PubMed] [Google Scholar]
- 6.Prager E, Schmitt M. Employer consolidation and wages: evidence from hospitals. Am Econ Rev. 2021;111(2):397-427. doi: 10.1257/aer.20190690 [DOI] [Google Scholar]
- 7.Gottlieb JD, Polyakova M, Rinz K, Shiplett H, Udalova V. Who values human capitalists’ human capital? the earnings and labor supply of US physicians. National Bureau of Economic Research; 2023.Working paper 31469.
- 8.Cutler DM. The good and bad news of health care employment. JAMA. 2018;319(8):758-759. doi: 10.1001/jama.2018.1054 [DOI] [PubMed] [Google Scholar]
- 9.Ung L, Stanford FC, Chodosh J. “All labor has dignity”—the case for wage equity for essential health care workers. N Engl J Med. 2021;385(17):1539-1542. doi: 10.1056/NEJMp2108695 [DOI] [PMC free article] [PubMed] [Google Scholar]
- 10.Kreider AR, Werner RM. The home care workforce has not kept pace with growth in home and community-based services. Health Aff (Millwood). 2023;42(5):650-657. doi: 10.1377/hlthaff.2022.01351 [DOI] [PMC free article] [PubMed] [Google Scholar]
- 11.Dill J, Duffy M. Structural racism and Black women’s employment in the US health care sector. Health Aff (Millwood). 2022;41(2):265-272. doi: 10.1377/hlthaff.2021.01400 [DOI] [PMC free article] [PubMed] [Google Scholar]
- 12.Islas IG, Brantley E, Portela Martinez M, Salsberg E, Dobkin F, Frogner BK. Documenting Latino representation in the US health workforce. Health Aff (Millwood). 2023;42(7):997-1001. doi: 10.1377/hlthaff.2022.01348 [DOI] [PubMed] [Google Scholar]
- 13.McCormack G, Avery C, Spitzer AKL, Chandra A. Economic vulnerability of households with essential workers. JAMA. 2020;324(4):388-390. doi: 10.1001/jama.2020.11366 [DOI] [PMC free article] [PubMed] [Google Scholar]
- 14.Blavin F. Association between the 2014 Medicaid expansion and US hospital finances. JAMA. 2016;316(14):1475-1483. doi: 10.1001/jama.2016.14765 [DOI] [PubMed] [Google Scholar]
- 15.Chatterjee P, Qi M, Werner RM. Association of Medicaid expansion with quality in safety-net hospitals. JAMA Intern Med. 2021;181(5):590-597. doi: 10.1001/jamainternmed.2020.9142 [DOI] [PMC free article] [PubMed] [Google Scholar]
- 16.Dranove D, Garthwaite C, Ody C. Uncompensated care decreased at hospitals in Medicaid expansion states but not at hospitals in nonexpansion states. Health Aff (Millwood). 2016;35(8):1471-1479. doi: 10.1377/hlthaff.2015.1344 [DOI] [PubMed] [Google Scholar]
- 17.Rhodes JH, Buchmueller TC, Levy HG, Nikpay SS. Heterogeneous effects of the ACA Medicaid expansion on hospital financial outcomes. Contemp Econ Policy. 2020;38(1):81-93. doi: 10.1111/coep.12428 [DOI] [Google Scholar]
- 18.Nikpay S, Buchmueller T, Levy H, Singh SR. The relationship between uncompensated care and hospital financial position: implications of the ACA Medicaid expansion for hospital operating margins. J Health Care Finance. 2016;43(2):73-89. Accessed July 20, 2023. https://www.healthfinancejournal.com/index.php/johcf/article/view/103 [Google Scholar]
- 19.Lindrooth RC, Perraillon MC, Hardy RY, Tung GJ. Understanding the relationship between Medicaid expansions and hospital closures. Health Aff (Millwood). 2018;37(1):111-120. doi: 10.1377/hlthaff.2017.0976 [DOI] [PubMed] [Google Scholar]
- 20.Luo Q, Moghtaderi A, Markus A, Dor A. Financial impacts of the Medicaid expansion on community health centers. Health Serv Res. 2022;57(3):634-643. doi: 10.1111/1475-6773.13897 [DOI] [PMC free article] [PubMed] [Google Scholar]
- 21.Matta S, Chatterjee P, Venkataramani AS. The income-based mortality gradient among US health care workers: cohort study. J Gen Intern Med. 2021;36(9):2870-2872. doi: 10.1007/s11606-020-05989-7 [DOI] [PMC free article] [PubMed] [Google Scholar]
- 22.Ruffini K. Worker earnings, service quality, and firm profitability: evidence from nursing homes and minimum wage reforms. Rev Econ Stat. Published online November 15, 2022. [Google Scholar]
- 23.Ruggles S, Flood S, Sobek M, et al. IPUMS USA: version 14.0 [dataset]. IPUMS. 2023.
- 24.Medicaid waiver tracker: approved and pending section 1115 waivers by state. KFF. Published December 10, 2020. Accessed December 14, 2020. https://www.kff.org/medicaid/issue-brief/medicaid-waiver-tracker-approved-and-pending-section-1115-waivers-by-state/
- 25.Wherry LR, Miller S. Early coverage, access, utilization, and health effects associated with the Affordable Care Act Medicaid expansions: a quasi-experimental study. Ann Intern Med. 2016;164(12):795-803. doi: 10.7326/M15-2234 [DOI] [PMC free article] [PubMed] [Google Scholar]
- 26.Carey CM, Miller S, Wherry LR. The impact of insurance expansions on the already insured: the Affordable Care Act and Medicare. Am Econ J Appl Econ. 2020;12(4):288-318. doi: 10.1257/app.20190176 [DOI] [Google Scholar]
- 27.Blumenthal D. Employer-sponsored health insurance in the United States–origins and implications. N Engl J Med. 2006;355(1):82-88. doi: 10.1056/NEJMhpr060703 [DOI] [PubMed] [Google Scholar]
- 28.Baicker K, Taubman SL, Allen HL, et al. ; Oregon Health Study Group . The Oregon experiment—effects of Medicaid on clinical outcomes. N Engl J Med. 2013;368(18):1713-1722. doi: 10.1056/NEJMsa1212321 [DOI] [PMC free article] [PubMed] [Google Scholar]
- 29.Goodman-Bacon A. Difference-in-differences with variation in treatment timing. J Econom. 2021;224(2):254-277. doi: 10.1016/j.jeconom.2021.03.014 [DOI] [Google Scholar]
- 30.de Chaisemartin C, D’Haultfœuille X. Difference-in-differences estimators of intertemporal treatment effects. Soc Sci Res Network; Revised December 7, 2023. Accessed October 1, 2023.
- 31.Venkataramani AS, Bair EF, O’Brien RL, Tsai AC. Association between automotive assembly plant closures and opioid overdose mortality in the United States: a difference-in-differences analysis. JAMA Intern Med. 2020;180(2):254-262. doi: 10.1001/jamainternmed.2019.5686 [DOI] [PMC free article] [PubMed] [Google Scholar]
- 32.Heckman JJ, Lochner LJ, Todd PE. Earnings functions, rates of return and treatment effects: the mincer equation and beyond. In: Hanushek E, Welch F, eds. Handbook of the Economics of Education. Vol 1. Elsevier; 2006:307-458, . [Google Scholar]
- 33.Mincer J. Schooling, Experience, and Earnings. Human Behavior & Social Institutions No. 2. National Bureau of Economic Research Inc; 1974. [Google Scholar]
- 34.Isen A, Rossin-Slater M, Walker WR. Every breath you take—every dollar you’ll make: the long-term consequences of the Clean Air Act of 1970. J Polit Econ. 2017;125(3):848-902. doi: 10.1086/691465 [DOI] [Google Scholar]
- 35.de Chaisemartin C, D’Haultfœuille X. Two-way fixed effects estimators with heterogeneous treatment effects. Am Econ Rev. 2020;110(9):2964-2996. doi: 10.1257/aer.20181169 [DOI] [Google Scholar]
- 36.de Chaisemartin C, D’Haultfœuille X. Two-way fixed effects and differences-in-differences with heterogeneous treatment effects: a survey. Econometric J. 2022;26(3)C1-C30. doi: 10.1093/ectj/utac017 [DOI] [Google Scholar]
- 37.Gruber J, Simon K, Kosali S. Crowd-out 10 years later: have recent public insurance expansions crowded out private health insurance? J Health Econ. 2008;27(2):201-217. doi: 10.1016/j.jhealeco.2007.11.004 [DOI] [PubMed] [Google Scholar]
- 38.Buchmueller T, Cooper P, Simon K, Vistnes J. The effect of SCHIP expansions on health insurance decisions by employers. Inquiry. 2005;42(3):218-231. doi: 10.5034/inquiryjrnl_42.3.218 [DOI] [PubMed] [Google Scholar]
- 39.Staiger B, Helfer M, Van Parys J. The effect of Medicaid expansion on the take-up of disability benefits by race and ethnicity. Health Econ. 2024;33(3):526-540. doi: 10.1002/hec.4783 [DOI] [PubMed] [Google Scholar]
- 40.Hamersma S, Kim M. The effect of parental Medicaid expansions on job mobility. J Health Econ. 2009;28(4):761-770. doi: 10.1016/j.jhealeco.2009.04.003 [DOI] [PMC free article] [PubMed] [Google Scholar]
- 41.Callison K, Sicilian P. Economic freedom and the Affordable Care Act: Medicaid expansions and labor mobility by race and ethnicity. Public Finance Rev. 2018;46(2):301-324. doi: 10.1177/1091142116668254 [DOI] [Google Scholar]
- 42.Seiber EE, Sahr TR. Public-private substitution among Medicaid adults: evidence from Ohio. Medicare Medicaid Res Rev. 2011;1(1):001.01.a01. [DOI] [PMC free article] [PubMed] [Google Scholar]
- 43.Dunn A, Gottlieb JD, Shapiro AH, Sonnenstuhl DJ, Tebaldi P. A denial a day keeps the doctor away*. Q J Econ. 2024;139(1):187-233. doi: 10.1093/qje/qjad035 [DOI] [Google Scholar]
- 44.Wallace J. What does a provider network do? evidence from random assignment in Medicaid managed care. Am Econ J Econ Policy. 2023;15(1):473-509. doi: 10.1257/pol.20210162 [DOI] [Google Scholar]
- 45.Gunja M, Collins S, Blumenthal D, Doty M, Beutel S. How Medicaid enrollees fare compared with privately insured and uninsured adults. Commonwealth Fund. April 2017. Accessed October 1, 2023. [PubMed]
- 46.Parzuchowski A, Oronce C, Guo R, Tseng CH, Fendrick AM, Mafi JN. Evaluating the accessibility and value of U.S. ambulatory care among Medicaid expansion states and non-expansion states, 2012-2015. BMC Health Serv Res. 2023;23(1):723. doi: 10.1186/s12913-023-09696-x [DOI] [PMC free article] [PubMed] [Google Scholar]
- 47.Neprash HT, Zink A, Sheridan B, Hempstead K. The effect of Medicaid expansion on Medicaid participation, payer mix, and labor supply in primary care. J Health Econ. 2021;80:102541. doi: 10.1016/j.jhealeco.2021.102541 [DOI] [PubMed] [Google Scholar]
- 48.Sasser WE, Schlesinger LA, Heskett JL. Service Profit Chain. Simon and Schuster; 1997. [Google Scholar]
- 49.Heskett JL, Jones TO, Loveman GW, Sasser WE, Schlesinger LA. Putting the service-profit chain to work. Harvard Bus Rev. Published online July 1, 2008. Accessed July 21, 2023. https://hbr.org/2008/07/putting-the-service-profit-chain-to-work
- 50.Hall LH, Johnson J, Watt I, Tsipa A, O’Connor DB. Healthcare staff wellbeing, burnout, and patient safety: a systematic review. PLoS One. 2016;11(7):e0159015. doi: 10.1371/journal.pone.0159015 [DOI] [PMC free article] [PubMed] [Google Scholar]
- 51.Dyrbye LN, West CP, Satele D, et al. Burnout among US medical students, residents, and early career physicians relative to the general US population. Acad Med. 2014;89(3):443-451. doi: 10.1097/ACM.0000000000000134 [DOI] [PubMed] [Google Scholar]
- 52.Dyrbye LN, Shanafelt TD, Sinsky CA, et al. Burnout among health care professionals: a call to explore and address this underrecognized threat to safe, high-quality care. NAM Perspect. Published online July 5, 2017. Accessed October 1, 2023. doi: 10.31478/201707b [DOI] [Google Scholar]
- 53.Shanafelt TD, West CP, Sinsky C, et al. Changes in burnout and satisfaction with work-life integration in physicians and the general US working population between 2011 and 2020. Mayo Clin Proc. 2022;97(3):491-506. doi: 10.1016/j.mayocp.2021.11.021 [DOI] [PubMed] [Google Scholar]
- 54.Van Houtven CH, McGarry BE, Jutkowitz E, Grabowski DC. Association of Medicaid expansion under the Patient Protection and Affordable Care Act with use of long-term care. JAMA Netw Open. 2020;3(10):e2018728. doi: 10.1001/jamanetworkopen.2020.18728 [DOI] [PMC free article] [PubMed] [Google Scholar]
- 55.Farb G. Health centers: trends in revenue and grants supported by the community health center fund. US Government Accountability Office. Published March 2, 2023. Accessed October 26, 2023. https://www.gao.gov/products/gao-23-106664
Associated Data
This section collects any data citations, data availability statements, or supplementary materials included in this article.
Supplementary Materials
eMethods 1. Statistical models
eTable 1. Industry classification codes used to identify health care workers
eTable 2. Medicaid expansion and non-expansion states
eTable 3. Dates of Medicaid expansion
eTable 4. Occupations represented in predicted income classes
eTable 5. Sample characteristics, stratified by predicted income classes
eTable 6. Differences-in-differences estimates using two-way fixed effects models
eTable 7. Differences-in-differences estimates for additional workforce outcomes
eTable 8. Difference-in-difference estimates for primary and secondary outcomes interacted by quintile
eFigure 1. Event study estimates of changes in income among HCWs before and after state-level Medicaid expansion stratified by income quintile
eFigure 2. Event study estimates of changes in ESHI among HCWs before and after state-level Medicaid expansion stratified by income quintile
eFigure 3. Event study estimates of changes in Medicaid among HCWs before and after state-level Medicaid expansion stratified by income quintile
eFigure 4. Event study estimates of changes in SNAP among HCWs before and after state-level Medicaid expansion stratified by income quintile
Data Sharing Statement