

Abstract
Background:
Patients with resectable noncardia gastric cancer may be subjected to perioperative chemotherapy (PEC), postoperative chemoradiation (POCR), or postoperative chemotherapy (POC). We analyzed these treatment strategies to determine optimal therapy based on nodal status.
Method:
The National Cancer Database was used to identify patients with resected noncardia gastric cancer (2004–2016). Patients were stratified based on clinical nodal status–negative (cLN−), positive (cLN+) and pathological nodal status (pLN−, pLN+). In cLN− patients who underwent upfront resection and were upstaged to pLN+, POC, and POCR were compared. Overall survival (OS) with PEC, POCR, and POC were compared in cLN− and cLN+.
Results:
We identified 6142 patients (cLN−: 3831; cLN+: 2311). In cLN− patients who underwent upfront resection (N = 3423), 69% were upstaged to pLN+ disease (N = 2499; POCR = 1796, POC = 703). On MVA, POCR was associated with significantly improved OS when compared to POC (hazard ratio [HR]: 0.75; p < 0.001).
In patients with cLN− disease (PEC = 408; POCR = 2439; POC = 984), PEC(HR: 0.77; p = 0.01) and POCR(HR: 0.81; p < 0.001) were associated with improved OS compared with POC. In cLN+ group (PEC = 452; POCR = 1284; POC = 575), POCR was associated with improved OS compared with POC (HR: 0.81; p < 0.01), and trend towards improved OS was noted when PEC(HR: 0.83; p = 0.055) was compared with POC.
Conclusion:
Postoperative chemoradiation may be the preferred treatment strategy over postoperative chemotherapy in non‐cardia gastric cancer patients who receive upfront resection and are upstaged from clinically node negative to pathologically node positive disease.
Keywords: gastric cancer, multimodal treatment in gastric cancer, noncardia gastric cancer
1 |. INTRODUCTION
Gastric cancer (GC) is third in terms of overall mortality with over a million new cases each year worldwide with a higher prevalence in Eastern and Central Asian countries.1–3 In terms of prognosis, lymphatic spread or nodal involvement has an immense influence on overall survival (OS).1 Metastatic lymph node ratio and the number of lymph nodes removed during gastrectomy also have prognostic implications on long‐term survival.4,5
Perioperative chemotherapy (PEC), postoperative chemoradiation therapy (POCR), and postoperative chemotherapy (POC) are acceptable treatment strategies in GC. Studies have suggested the use of lymph node status to influence adjuvant treatment selection.6 The ARTIST trial in D2 resected gastric cancer patients showed no significant difference in disease free survival (DFS) between POC (capecitabine + cisplatin) and POCR (p = 0.086) but a subgroup analysis showed improved DFS with POCR in pathologically node positive patients (p = 0.036).7 This difference was not maintained in the ARTIST 2 trial8 which compared adjuvant single‐agent S1, S1 with oxaliplatin (SOX), and postoperative chemoradiation with S‐1 and oxaliplatin (SOXRT) in patients with node‐positive gastric cancer after D2 resection. No significant difference in DFS was seen with S1 (p = 0.074) and SOX (p = 0.870) when compared with SOXRT.
The purpose of this study is to use the National Cancer Database (NCDB) to compare OS in POC and POCR in NCGC patients with clinically node negative disease (cLN−) who underwent upfront resection and were upstaged to pathologically node positive disease (pLN+). We aim to compare OS in PEC, POCR, and POC based on clinical nodal status.
2 |. MATERIALS AND METHODS
2.1 |. Data source
The NCDB was used to identify patients for this study.9 The NCDB is a clinical oncology database sourced from hospital registry data collected from more than 1500 Commission on Cancer‐accredited facilities. These data are used to analyze and track patients with malignant neoplastic diseases, their treatment, and outcomes. This data is used to explore trends in cancer care and serves as the basis for quality improvements.
2.2 |. Patient selection criteria
All patients with gastric cancer from 2004 to 2016, who were above 18 years of age and underwent definitive resection were identified from the NCDB. Patients with gastric cancer in the cardia, metastatic disease, patients treated with a palliative intent, unknown clinical nodal status, patients previously treated for cancer, patients who received intraoperative chemotherapy, patients treated with other treatment modalities (such as surgery alone, neoadjuvant chemotherapy/radiation), and patients with unknown sequence of treatment in relation to surgery were excluded.
2.3 |. Methods
This study was exempt from institutional review board approval as it used deidentified data sourced from NCDB. A retrospective analysis was conducted in all patients with non‐metastatic NCGC who underwent definitive resection and were treated with PEC, POCR, or POC. Patients were divided into two cohorts based on their clinical nodal status—node negative (cLN−) and node positive (cLN+) disease. Correlation between clinical nodal status and pathological nodal status (pathologically node negative—pLN− and positive—pLN+) was analyzed—concordant (cLN− and pLN−) and discordant (cLN− and pLN+). In patients with cLN− disease who underwent upfront resection, OS was compared based on receipt on POC and POCR in patients who remained pLN− and in patients upstaged to pLN+ disease.
In patients with cLN− and cLN+ disease, OS was compared based on receipt of PEC, POCR, and POC. Additional subgroup analysis was performed in the optimally treated cohort in patients with both cLN− and cLN+ disease. Optimal treatment was defined as initiation of chemotherapy within 45 days of diagnosis (PEC), resection within 45 days of diagnosis (POCR and POC), negative margins, ≥15 lymph nodes resected, adjuvant therapy within 90 days of resection (POCR and POC), and adequate standard (45 Gy) radiation dose (POCR).
2.4 |. Statistics
Statistical analysis was carried out using SAS 9.4. Descriptive statistics was used to summarize patient clinicodemographic and tumor characteristics. Kaplan–Meier curves were used to assess OS and log‐rank test was used to compare survival curves. Univariate analysis (UVA) and multivariable analysis (MVA) using the Cox proportional hazards model facilitated the investigation of the effects of different treatment strategies and variables on OS. A backward selection with an alpha level of removal of 0.2 was used. A p‐value of <0.05 was statistically significant.
3 |. RESULTS
3.1 |. Patient clinicodemographic and tumor characteristics
We identified 6142 patients with non‐metastatic NCGC who met our selection criteria. Of these patients, 62.37% were cLN− (N = 3831) and 37.63% were cLN+ (N = 2311) (Figure 1).
FIGURE 1.
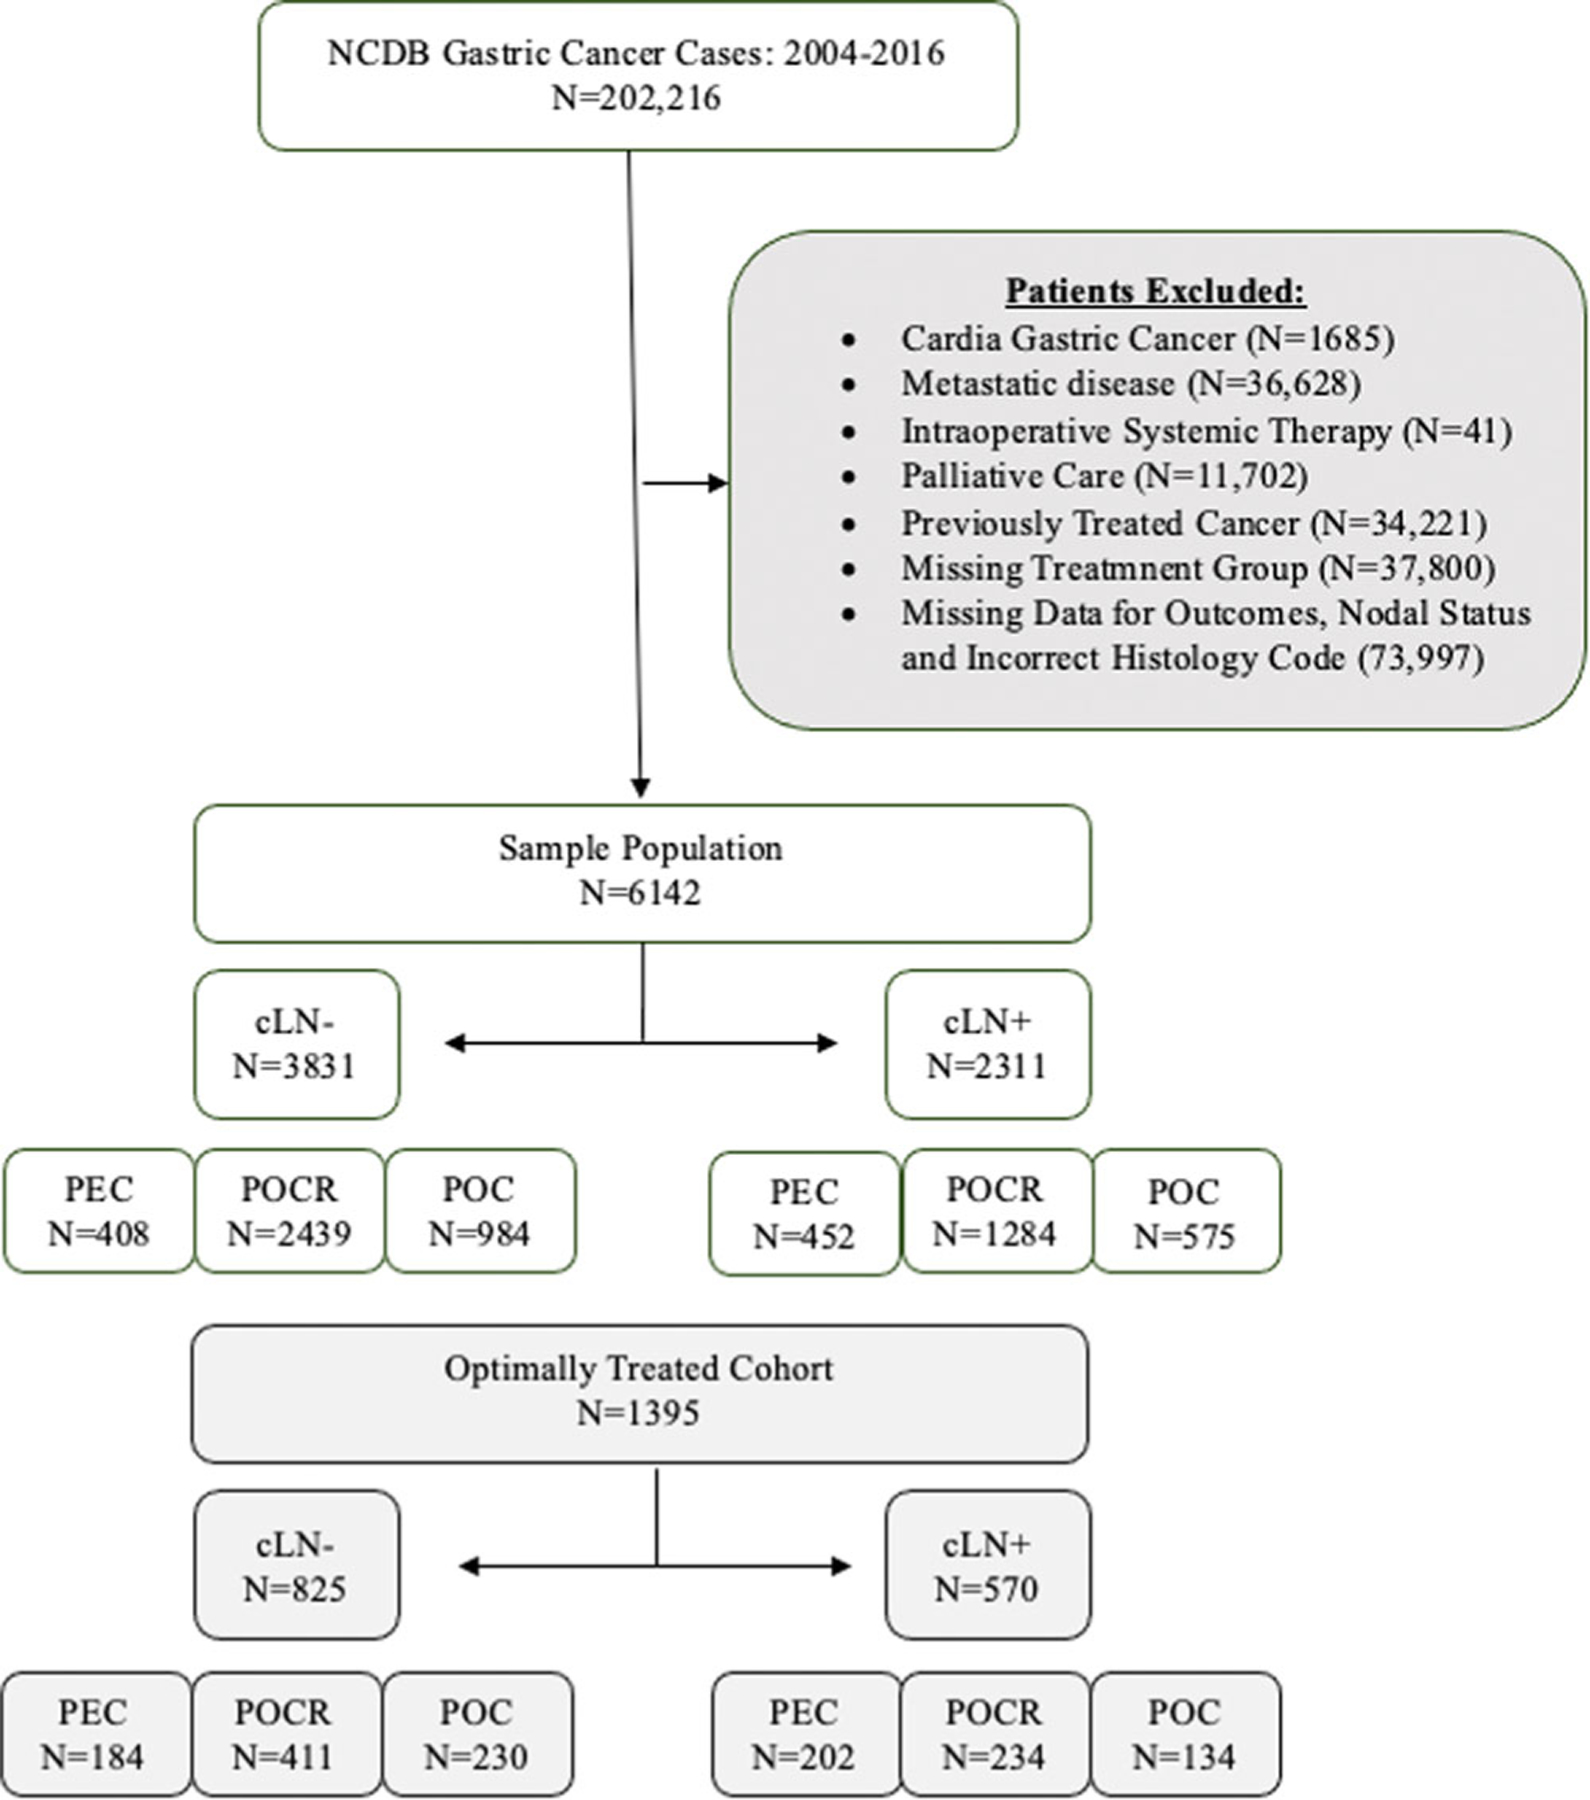
Schematic depicting inclusion and exclusion criteria of patients with resected non‐cardia gastric cancer stratified by clinical nodal disease status and treatment strategy. cLN−, clinically node‐ negative disease; cLN+, clinically node‐positive disease; NCDB, National Cancer Database; PEC, perioperative chemotherapy; POC, postoperative chemotherapy; POCR, postoperative chemoradiation therapy.
In patients with cLN− disease, majority were treated with POCR (N = 2439, 63.66%) therapy followed by POC (N = 984, 25.68%) and PEC (N = 408, 10.64%). The median age in this cohort was 63 years with majority of patients having a Charlson–Deyo score of 0 (68.9%). The majority were male (57.5%), and of White race (62.2%) (Table 1). Most of the tumors were clinically T1–T2 (54.7%) with poorly differentiated/undifferentiated histology (76.6%).
TABLE 1.
Descriptive statistics including patient demographics and tumor characteristics in all patients with resectable noncardia gastric cancer and in patients who meet optimal treatment selection criteria stratified by their clinical nodal disease status—Clinically node‐negative disease and clinically node positive disease.
| All patient analysis |
Optimally treated cohort |
||||
|---|---|---|---|---|---|
| Variable | Level | Clinically node‐negative disease N (%) = 3831 |
Clinically node‐positive disease N (%) = 2311 |
Clinically node‐negative disease N (%) = 825 |
Clinically node‐positive disease N (%) = 570 |
| Median age | 63 | 62 | 61 | 61 | |
| Age | Below median | 1965 (51.3) | 1166 (50.5) | 420 (50.9) | 302 (53.0) |
| Above median | 1866 (48.7) | 1145 (49.5) | 405 (49.1) | 268 (47.0) | |
| Sex | Male | 2209 (57.7) | 1366 (59.1) | 460 (55.8) | 347 (60.9) |
| Female | 1622 (42.3) | 945 (40.9) | 365 (44.2) | 223 (39.1) | |
| Race | White | 2383 (62.2) | 1382 (59.8) | 517 (62.7) | 342 (60.0) |
| Black | 789 (20.6) | 537 (23.2) | 135 (16.4) | 114 (20.0) | |
| Other | 659 (17.2) | 392 (17.0) | 173 (21.0) | 114 (20.0) | |
| Primary payor | Private/not insured | 1782 (46.5) | 1137 (49.2) | 429 (52.0) | 291 (51.1) |
| Medicare/Medicaid/other government | 2049 (53.5) | 1174 (50.8) | 396 (48.0) | 279 (48.9) | |
| Facility type | Nonacademic/research program | 2084 (57.1) | 1215 (55.1) | 392 (50.8) | 257 (47.6) |
| Academic/research program | 1565 (42.9) | 989 (44.9) | 380 (49.2) | 283 (52.4) | |
| Missing | 182 | 107 | 53 | 30 | |
| Median income quartiles | <$38 000 | 817 (21.4) | 509 (22.1) | 141 (17.2) | 118 (20.8) |
| 2008–2012 | $38 000–$47 999 | 790 (20.7) | 477 (20.7) | 157 (19.1) | 97 (17.1) |
| $48 000–$62 999 | 1019 (26.7) | 589 (25.6) | 215 (26.2) | 139 (24.5) | |
| >=$63 000 | 1188 (31.1) | 730 (31.7) | 309 (37.6) | 214 (37.7) | |
| Missing | 17 | 6 | 3 | 2 | |
| Charlson–Deyo Score | 0 | 2640 (68.9) | 1668 (72.2) | 617 (74.8) | 434 (76.1) |
| 1+ | 1191 (31.1) | 643 (27.8) | 208 (25.2) | 136 (23.9) | |
| Year of diagnosis | 2006–2010 | 1360 (35.5) | 1043 (45.1) | 258 (31.3) | 229 (40.2) |
| 2011–2016 | 2471 (64.5) | 1268 (54.9) | 567 (68.7) | 341 (59.8) | |
| Grade | Well/moderately differentiated | 862 (23.4) | 484 (21.9) | 188 (23.7) | 119 (21.9) |
| Poorly differentiated/undifferentiated | 2827 (76.6) | 1725 (78.1) | 604 (76.3) | 425 (78.1) | |
| Missing | 142 | 102 | 33 | 26 | |
| Regional lymph nodes | Negative | 1220 (33.1) | 199 (8.7) | 260 (31.6) | 73 (12.8) |
| Positive | 2466 (66.9) | 2076 (91.3) | 564 (68.4) | 496 (87.2) | |
| Missing | 145 | 36 | 1 | 1 | |
| Surgical margins status | Negative | 3150 (83.8) | 1796 (79.8) | 825 (100.0) | 570 (100.0) |
| Positive | 610 (16.2) | 456 (20.2) | 0 | 0 | |
| Missing | 71 | 59 | 0 | 0 | |
| Vital status | Dead | 1814 (47.4) | 1361 (58.9) | 316 (38.3) | 285 (50.0) |
| Alive | 2017 (52.6) | 950 (41.1) | 509 (61.7) | 285 (50.0) | |
| Clinical T | 1–2 | 1167 (54.7) | 588 (29.3) | 251 (53.5) | 146 (29.2) |
| 3 | 749 (35.1) | 1007 (50.2) | 178 (38.0) | 264 (52.8) | |
| 4 | 216 (10.1) | 411 (20.5) | 40 (8.5) | 90 (18.0) | |
| Missing | 1699 | 305 | 356 | 70 | |
| Clinical N | 0 | 3831 (100.0) | 0 | 825 (100.0) | 0 |
| 1 | 0 | 1363 (59.0) | 0 | 325 (57.0) | |
| 2–3 | 0 | 948 (41.0) | 0 | 245 (43.0) | |
| Pathologic T | 0–2 | 717 (23.7) | 363 (20.4) | 145 (21.2) | 92 (20.9) |
| 3 | 1315 (43.5) | 839 (47.2) | 331 (48.3) | 212 (48.2) | |
| 4 | 991 (32.8) | 574 (32.3) | 209 (30.5) | 136 (30.9) | |
| Missing | 808 | 535 | 140 | 130 | |
| Pathologic N | 0 | 1141 (33.9) | 189 (9.9) | 240 (31.6) | 72 (15.0) |
| 1 | 896 (26.6) | 583 (30.6) | 173 (22.8) | 121 (25.3) | |
| 2 | 645 (19.2) | 516 (27.0) | 143 (18.8) | 115 (24.0) | |
| 3 | 686 (20.4) | 620 (32.5) | 204 (26.8) | 171 (35.7) | |
| Missing | 463 | 403 | 65 | 91 | |
| Chemotherapy type | Unknown | 295 (7.70) | 192 (8.30) | 39 (4.72) | 35 (6.14) |
| Single‐agent chemotherapy | 1591 (41.52) | 699 (30.24) | 298 (36.12) | 129 (22.63) | |
| Multiagent chemotherapy | 1945 (50.77) | 1419 (61.40) | 488 (59.15) | 406 (71.22) | |
| Surgery of primary site | Unknown/other | 713 (18.9) | 430 (18.57) | 124 (15.02) | 101 (17.71) |
| Gastrectomy, NOS | 862 (22.50) | 484 (20.94) | 165 (20) | 114 (20) | |
| Antrectomy, lower | 137 (3.57) | 72 (3.11) | 30 (3.63) | 239 (41.92) | |
| Lower (distal) gastrectomy | 886 (23.12) | 445 (19.25) | 209 (25.33) | 120 (21.05) | |
| Upper (proximal) gastrectomy | 107 (2.79) | 55 (2.37) | 17 (2.06) | 15 (2.63) | |
| Near total or total gastrectomy, NOS | 42 (1.09) | 27 (1.16) | 9 (1.09) | 7 (1.22) | |
| Near total gastrectomy | 70 (1.82) | 36 (1.55) | 19 (2.30) | 13 (2.28) | |
| Total gastrectomy | 410 (10.70) | 311 (13.45) | 95 (11.51) | 79 (13.85) | |
| Gastrectomy, NOS with removal of portion of esophagus* | 27 (0.70) | 17 (0.73) | 9 (1.09) | 5 (0.87) | |
| Partial or subtotal gastrectomy* | 182 (4.75) | 97 (4.19) | 36 (4.36) | 18 (3.15) | |
| Near total or total gastrectomy* | 69 (1.80) | 80 (3.46) | 17 (2.06) | 19 (3.33) | |
| Gastrectomy** | 42 (1.09) | 31 (1.34) | 14 (1.69) | 9 (1.57) | |
| Partial or subtotal gastrectomy** | 158 (4.12) | 126 (5.45) | 44 (5.33) | 27 (4.73) | |
| Near total or total gastrectomy** | 88 (2.29) | 62 (2.68) | 25 (3.03) | 21 (3.68) | |
| Radical gastrectomy** | 40 (1.04) | 38 (1.64) | 12 (1.45) | 11 (1.92) | |
| Gastrectomy, NOS with removal of portion of esophagus* | 27 (0.70) | 17 (0.73) | 9 (1.09) | 5 (0.87) | |
Abbreviation: NOS, not otherwise specified.
Gastrectomy resection when only portions of esophagus are included in procedure.
Gastrectomy resections with organs other than esophagus. Portions of esophagus may or may not be included in the resection.
In patients with cLN+ disease, majority were treated with POCR (N = 1284, 55.56%) therapy followed by POC (N = 575, 24.88%) and PEC (N = 452, 19.55%). The median age in this cohort was 62 years with majority of patients having a Charlson–Deyo core of 0 (72.2%). The majority were male (59.1%) and of White race (59.8%). Most of the tumors were clinically T3 (50.2%) with poorly differentiated/undifferentiated histology (78.1%).
Patient clinicodemographic and tumor characteristics stratified by the type of treatment received—PEC, POCR and POC is available in the supplemental section (Supporting Information File S1).
3.2 |. Concordance between clinically node negative disease and pathological nodal status
In patients with cLN− disease, 10.64% (N = 408) received chemotherapy first (PEC cohort) while 89.35% (N = 3,423) underwent upfront resection (POC and POCR cohorts). In patients who received chemotherapy first (PEC cohort), concordance between cLN‐ and pLN− was 56.50%, and 43.50% of patients were upstaged to pLN+ disease. In patients who received upfront resection (POCR/POC cohort), concordance between cLN− and pLN‐ disease was 31%, and 69% were upstaged to pLN+ disease (Figure 2).
FIGURE 2.

Pie chart represents patients with noncardia gastric cancer who are clinically lymph node negative and (A) received chemotherapy as their first definitive treatment (perioperative chemotherapy cohort; (B) received upfront surgery (postoperative chemotherapy and postoperative chemoradiation cohorts) as their first definitive treatment. Concordance is defined as clinically node negative disease that remains pathologically node negative upon resection. Discordance is clinically node negative disease upstaged to pathologically node positive disease. PEC, perioperative chemotherapy; POC, postoperative chemotherapy; POCR, postoperative chemoradiation.
3.3 |. Survival analysis in patients with cLN− disease who underwent upfront resection: POC and POCR
Of the 3423 patients with cLN− disease who underwent upfront resection and remained pLN− (N = 924; POCR = 643, POC = 281), no significant difference in median OS was noted between POCR and POC (81.5 months vs. 92.8 months, p = 0.608, respectively) (Figure 3). The 5‐year OS was 56.7% in patients who received POCR and 60.7% in patients who received POC. In both UVA (Supporting Information File S2) and MVA, no significant difference in OS was noted when treated with POCR (hazard ratio [HR] 1.04, p = 0.75) therapy compared to POC (Table 2).
FIGURE 3.
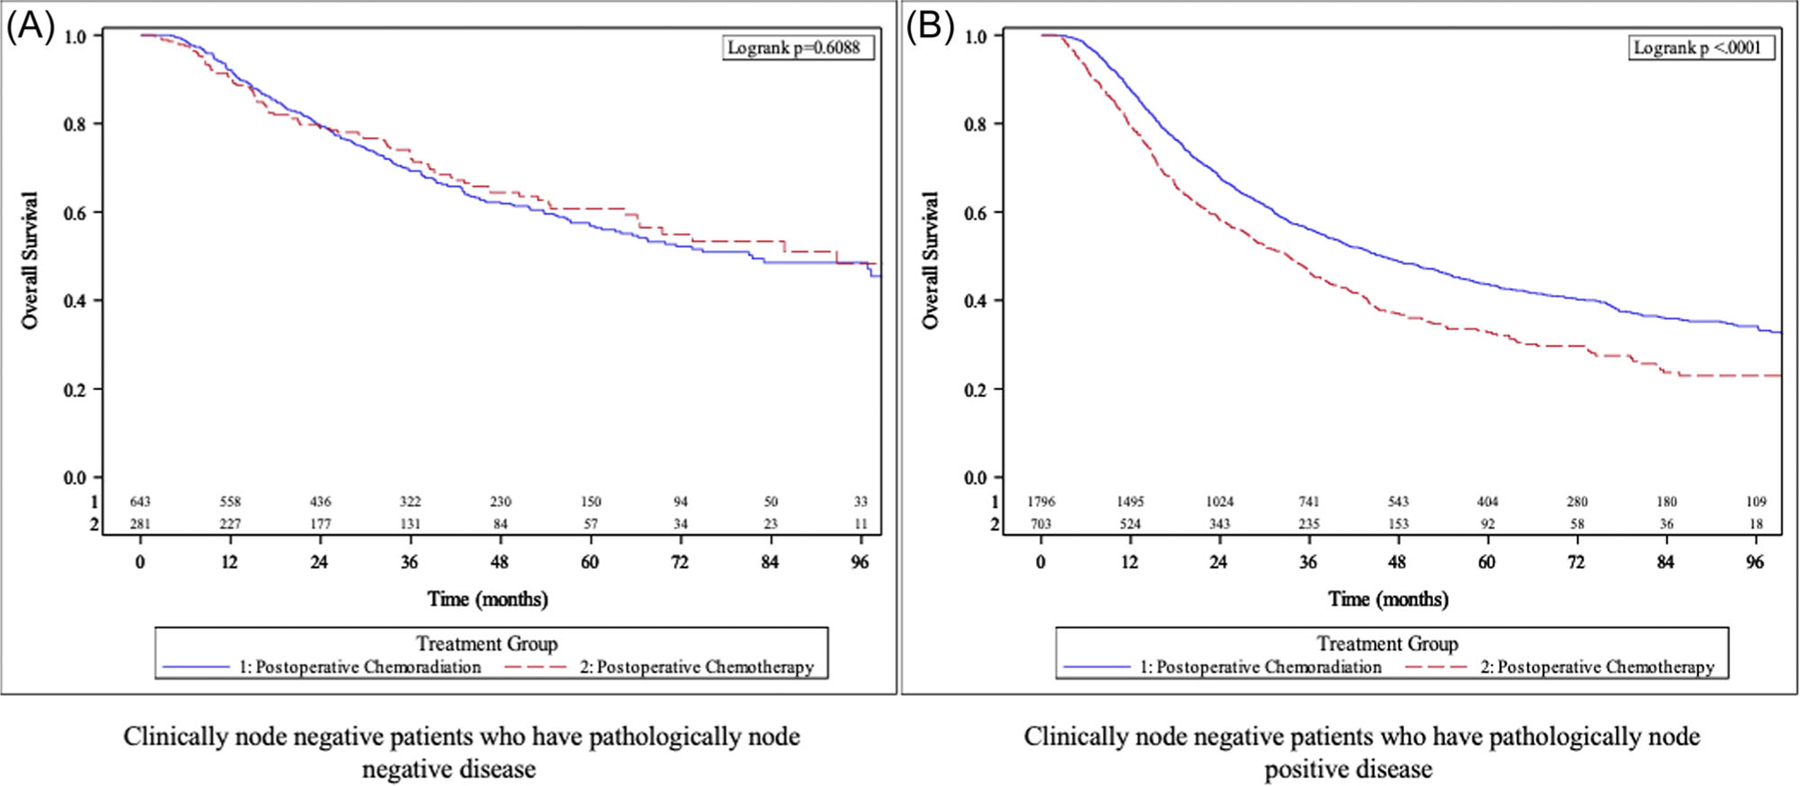
Kaplan–Meier analysis in all non‐cardia gastric cancer patients with clinically node negative disease who received upfront surgery stratified by receipt of postoperative chemotherapy vs postoperative chemoradiation therapy—(A) patients with pathologically node negative disease and (B) patients with pathologically node positive disease.
TABLE 2.
Multivariable analysis utilizing Cox proportional hazard model in all patients with resected noncardia gastric cancer diagnosed with clinically node‐negative disease stratified by pathological nodal disease status—Pathologically node‐negative disease and pathologically node‐positive disease.
| Clinically node‐negative disease |
|||||||
|---|---|---|---|---|---|---|---|
| Pathologically node‐negative disease |
Pathologically node‐positive disease |
||||||
| Covariate | Level | HR (95% CI) | HR p‐value | Overall p‐value | HR (95% CI) | HR p‐value | Overall p‐value |
| Treatment group | Postoperative chemoradiation | 1.04 (0.79–1.37) | 0.754 | 0.754 | 0.75 (0.66–0.85) | <0.001 | <0.001 |
| Postoperative chemotherapy | ‐ | ‐ | ‐ | ‐ | |||
| Age | Above median | 1.29 (0.96–1.73) | 0.093 | 0.093 | 1.38 (1.22–1.55) | <0.001 | <0.001 |
| Below median | ‐ | ‐ | ‐ | ‐ | |||
| Race | Black | 0.75 (0.55–1.01) | 0.061 | 0.095 | 1.03 (0.88–1.19) | 0.746 | <0.001 |
| Other | 0.77 (0.52–1.14) | 0.189 | 0.69 (0.57–0.82) | <0.001 | |||
| White | ‐ | ‐ | ‐ | ‐ | |||
| Median income quartiles 2008–2012 | $38 000–$47 999 | ‐ | 1.02 (0.86–1.22) | 0.789 | 0.014 | ||
| $48 000–$62 999 | 0.80 (0.67–0.95) | 0.010 | |||||
| >=$63 000 | 0.90 (0.75–1.06) | 0.207 | |||||
| <$38 000 | ‐ | ‐ | |||||
| Facility type | Nonacademic/research program | 1.23 (0.95–1.58) | 0.116 | 0.116 | 1.30 (1.14–1.47) | <0.001 | <0.001 |
| Academic/research program | ‐ | ‐ | ‐ | ‐ | |||
| Charlson–Deyo Score | 1+ | ‐ | 1.15 (1.02–1.29) | 0.026 | 0.026 | ||
| 0 | ‐ | ‐ | |||||
| Primary payor | Private/not insured | 0.65 (0.48–0.88) | 0.006 | 0.006 | ‐ | ||
| Medicare/Medicaid/other government | ‐ | ‐ | |||||
| Year of diagnosis | 2011–2016 | ‐ | 1.10 (0.97–1.25) | 0.121 | 0.121 | ||
| 2006–2010 | ‐ | ‐ | |||||
| Facility location | Northeast | 0.53 (0.37–0.74) | <0.001 | <0.001 | 0.85 (0.72–1.00) | 0.045 | <0.001 |
| Midwest | 0.79 (0.59–1.07) | 0.128 | 1.17 (1.00–1.37) | 0.046 | |||
| West | 0.53 (0.36–0.79) | 0.002 | 1.08 (0.90–1.29) | 0.418 | |||
| South | ‐ | ‐ | ‐ | ‐ | |||
| Grade | Poorly differentiated/undifferentiated | 1.92 (1.44–2.55) | <0.001 | <0.001 | 1.30 (1.12–1.52) | <0.001 | <0.001 |
| Well/moderately differentiated | ‐ | ‐ | ‐ | ‐ | |||
| Regional lymph nodes positive | Positive | 2.22 (1.13–4.37) | 0.021 | 0.021 | 1.37 (1.06–1.77) | 0.016 | 0.016 |
| Negative | - | - | - | - | |||
| Surgical margins status | Positive | 2.45 (1.82–3.30) | <0.001 | <0.001 | 2.10 (1.83–2.41) | <0.001 | <0.001 |
| Negative | - | - | - | - | |||
Note: Pathologically node‐negative disease: Number of observations in the original data set = 1141. Number of observations used = 805. Pathologically node‐positive disease: Number of observations in the original data set = 2690. Number of observations used = 2203.
Abbreviations: CI, confidence interval; HR, hazard ratio.
In cLN− patients upstaged to pLN+ disease (N = 2499; POCR = 1796, POC = 703), median OS was higher in patients treated with POCR therapy compared to POC (45.6 months vs. 33 months, respectively, p < 0.0001) (Figure 3). The 5‐year OS was 43.7% in patients who received POCR compared to 32.8% in patients who received POC. In both UVA and MVA, patients treated with POCR were associated with significantly improved OS when compared to POC (HR 0.75, p = <0.001). Additional variables associated with OS on MVA are highlighted in Table 2.
3.4 |. Survival analysis in cLN− and cLN+ cohorts—PEC, POCR, and POC
In patients with cLN− disease, median OS was highest in patients who received PEC (91.2 months) followed by POCR therapy (53.7 months) and POC (40.3 months) (p < 0.0001) (Figure 4). The 5‐year survival rates were 58.3% in patients who received PEC, 47.1% for POCR, and 40.3% for POC. In both UVA (Supporting Information File S3) and MVA (Table 3), both PEC (HR 0.77, p = 0.01) and POCR (HR 0.81, p < 0.001) were associated with improved OS compared with POC. No statistically significant difference in OS was seen between POCR (HR 1.05, p = 0.629) and PEC on MVA.
FIGURE 4.

Kaplan–Meier survival analysis in all patients with resected non‐cardia gastric cancer stratified by receipt of perioperative chemotherapy versus postoperative chemoradiation therapy vs postoperative chemotherapy in patients with (A) clinically node negative disease and (B) clinically node positive disease.
TABLE 3.
Multivariate analysis utilizing cox proportional hazards model for overall survival in all patients with resected noncardia gastric cancer stratified by clinical nodal disease status—Clinically node‐negative disease and clinically node‐positive disease, in patients treated with perioperative chemotherapy, postoperative chemoradiation therapy, and postoperative chemotherapy.
| Clinically node‐negative disease OS (months) |
Clinically node positive diseaseOS (months) |
||||||
|---|---|---|---|---|---|---|---|
| Covariate | Level | HR (95% CI) | HR p‐value | Overall p‐value | HR (95% CI) | HR p‐value | Overall p‐value |
| Treatment group | Perioperative chemotherapy | 0.77 (0.62–0.95) | 0.017 | <0.001 | 0.83 (0.68–1.00) | 0.055 | 0.008 |
| Postoperative chemoradiation | 0.81 (0.72–0.90) | <0.001 | 0.81 (0.71–0.93) | 0.002 | |||
| Postoperative chemotherapy | ‐ | ‐ | ‐ | ‐ | |||
| Postoperative chemoradiation | 1.05 (0.86–1.29) | 0.629 | <0.001 | 0.98 (0.82–1.17) | 0.846 | 0.008 | |
| Postoperative chemotherapy | 1.30 (1.05–1.62) | 0.017 | 1.21 (1.00–1.47) | 0.055 | |||
| Perioperative chemotherapy | ‐ | ‐ | ‐ | ‐ | |||
| Age | Above median | 1.41 (1.27–1.56) | <0.001 | <0.001 | 1.43 (1.27–1.60) | <0.001 | <0.001 |
| Below median | ‐ | ‐ | ‐ | ‐ | |||
| Race | Black | 0.95 (0.83–1.08) | 0.440 | <0.001 | 1.14 (0.99–1.31) | 0.063 | <0.001 |
| Other | 0.72 (0.62–0.85) | <0.001 | 0.76 (0.64–0.91) | 0.003 | |||
| White | ‐ | ‐ | ‐ | ‐ | |||
| Median income quartiles 2008–2012 | $38 000–$47 999 | 1.00 (0.86–1.16) | 0.989 | 0.106 | ‐ | ||
| $48 000–$62 999 | 0.86 (0.74–1.00) | 0.043 | |||||
| >=$63 000 | 0.91 (0.78–1.05) | 0.191 | |||||
| <$38 000 | ‐ | ‐ | |||||
| Facility type | Nonacademic/research program | 1.29 (1.16–1.44) | <0.001 | <0.001 | 1.19 (1.05–1.34) | 0.006 | 0.006 |
| Academic/research program | ‐ | ‐ | ‐ | ‐ | |||
| Charlson–Deyo Score | 1+ | 1.15 (1.04–1.28) | 0.008 | 0.008 | ‐ | ||
| 0 | ‐ | ‐ | |||||
| Facility location | Northeast | 0.76 (0.66–0.87) | <0.001 | <0.001 | 0.77 (0.66–0.90) | <0.001 | 0.007 |
| Midwest | 1.08 (0.95–1.23) | 0.237 | 0.96 (0.82–1.11) | 0.555 | |||
| West | 0.93 (0.80–1.09) | 0.353 | 0.97 (0.81–1.16) | 0.719 | |||
| South | ‐ | ‐ | ‐ | ‐ | |||
| Grade | Poorly differentiated/undifferentiated | 1.44 (1.26–1.64) | <0.001 | <0.001 | 1.40 (1.21–1.62) | <0.001 | <0.001 |
| Well/moderately differentiated | ‐ | ‐ | ‐ | ‐ | |||
| Regional lymph nodes positive | Positive | 1.72 (1.53–1.94) | <0.001 | <0.001 | 2.26 (1.68–3.05) | <0.001 | <0.001 |
| Negative | ‐ | ‐ | ‐ | ‐ | |||
| Surgical margins | Positive | 2.19 (1.94–2.46) | <0.001 | <0.001 | 1.85 (1.62–2.11) | <0.001 | <0.001 |
| Negative | ‐ | ‐ | ‐ | ‐ | |||
Note: Clinically node‐negative disease: Number of observations in the original data set = 3831. Number of observations used = 3332. Clinically node‐positive disease: Number of observations in the original data set = 2311. Number of observations used = 2044.
Abbreviations: CI, confidence interval; HR, hazard ratio.
In patients with cLN+ disease, median OS was highest in patients who received PEC (52.9 months) followed by POCR (32.8 months) and POC (24.7 months) (p < 0.0001) (Figure 4). The 5‐year survival rates are 47.4% for PEC, 36% for POCR, and 31.9% for POC. Both PEC and POCR were associated with improved OS compared with POC on UVA (p < 0.001). On MVA, PEC (HR 0.83, p = 0.055) was associated with a trend towards improved OS compared with POC, while POCR (HR 0.81, p = 0.002) was associated with a statistically significant improvement in OS compared with POC. No statistically significant difference in OS was seen between POCR (HR 0.98, p = 0.84) and PEC on MVA. Additional variables associated with OS are highlighted in Table 3.
3.5 |. Survival analysis in optimally treated cohort in cLN− and cLN+ disease—PEC, POCR, and POC
A per our optimal treatment selection criteria, 22.7% (N = 1395) of patients were identified. Of the 1395 patients, 825 patients had cLN− disease, and 570 patients had cLN+ disease. Descriptive statistics in patients with cLN− and cLN+ disease is similar to that described in Section 3.1 (Table 1).
In patients with cLN− disease (PEC = 181, POCR = 411, POC = 230), median OS was highest in patients treated with PEC (not reached), followed by POCR (80.2 months), and POC (73.3 months) with a trend towards statistical significance (p = 0.073) (Supporting Information File S4). The 5‐year survival rates were 57.6% for PEC, 56.3% for POCR, and 51.9% for POC. While PEC was associated with improved OS compared with POC (HR 0.70, p = 0.032) on UVA (Supporting Information File S5), this difference was not maintained on MVA (HR 0.89, p = 0.50) (Supporting Information File S6). POCR was associated with a trend towards improved OS compared with POC (HR 0.80, p = 0.086) on UVA. On MVA, POCR (0.74, p = 0.029) was associated with improved OS compared to POC; no significant difference in OS was seen when POCR (HR 0.84, p = 0.30) was compared with PEC.
In patients with cLN+ disease (PEC = 202, POCR = 234, POC = 134), median OS was highest in patients treated with PEC (60.8 months), followed by POCR (50.4 months), and POC (31.7 months) (p = 0.019) (Supporting Information File S4). The 5‐year survival rates were 50.3% for PEC, 43.8% for POCR, and 41.8% for POC. While PEC was associated with improved OS compared with POC (HR 0.64, p = 0.005) on UVA, this difference was not maintained on MVA (HR 0.90, p = 0.55) (Supporting Information File S6). POCR was associated with a trend towards improved OS compared to POC (HR 0.75, p = 0.052) on UVA. On MVA, POCR (0.67, p = 0.012) was associated with improved OS compared with POC. Receipt of POCR (HR 0.75, p = 0.067) was associated with a trend towards improved OS when compared with PEC. Additional variables associated with OS on MVA are highlighted in Supporting Information File S6.
4 |. DISCUSSION
The purpose of this study was to utilize the NCDB to identify the optimal adjuvant treatment strategy in non‐metastatic NCGC patients who underwent definitive resection and were upstaged from cLN− to pLN+ disease by comparing POC and POCR. We analyzed the correlation between cLN− and pathological nodal status and compared PEC, POCR, and POC based on clinical nodal status. Our study revealed that POCR is associated with improved OS compared to POC in NCGC patients who received upfront resection and were upstaged from cLN− to pLN+ disease. Only 31% of patients with cLN− disease have concordant pathological nodal disease status, while the majority are upstaged from cLN− to pLN+ disease (69%). Both PEC and POCR were associated with improved OS compared with POC in patients with cLN− disease. In patients with cLN+ disease, POCR was associated with improved OS and PEC was associated with a trend towards improved OS when both were compared to POC.
Multimodal treatment strategies including PEC, POCR, and POC have been established as the standard of care in resectable NCGC10–12 but the role of clinical and pathological nodal status in influencing these strategies is yet to be determined. In our study, no significant difference between POC and POCR was seen in NCGC patients who were both cLN− and pLN−. In patients upstaged to pLN + disease, POCR was associated with improved OS compared to POC. The ARTIST 1 trial compared POC (capecitabine + cisplatin) and POCR in patients with D2 resected GC and showed no difference in 3‐year (DFS) rates between the two treatment strategies (78.2% for POCR and 74.2% for POC, p = 0.086).7 A sub‐group analysis in the same study in node‐positive patients showed an association with improved 3‐year DFS (76% vs. 72%, p = 0.036) with POCR. This was maintained on MVA when controlled for pathologic stage (HR 0.68, p = 0.047). This formed the basis for the ARTIST 2 trial which investigated single agent chemotherapy (S1), multiagent chemotherapy—S1 + Oxaliplatin (SOX), and POCR (SOX + radiation therapy) in node‐positive gastric cancer patients with D2 resection.8 SOX was associated with a longer 3‐year DFS compared to S1 (74.3% vs. 64.8%, p = 0.042). No significant difference in 3‐year DFS was found between S1 and SOXRT (64.8% for S1 and 72.8% for SOXRT, p = 0.074) or between SOX and SOXRT (74.3% for SOX vs. 72.8% for SOXRT, p = 0.879). No significant difference in DFS was seen between POC (S1/SOX ‐ 69.6%) and POCR (SOXRT – 72.8%)(no p‐ value available). While our study results are similar to the ARTIST 1 trial, our study is different in design and patient population as we only analyzed patients with cLN− disease who were upstaged to pLN+ disease. We did not stratify chemotherapy as single agent or multiagent in our POC cohort for analysis and hence our results differ from the ARTIST 2 trial. We would also like to point out that our analysis was based on OS and we were unable analyze DFS as it not a variable available in the NCDB.
None of the trials mentioned above analyzed the influence of clinical nodal status in treatment outcomes. Our study revealed both PEC and POCR were associated with improved OS compared with POC alone irrespective of patients’ clinical nodal status. The CRITICS trial in 2018, showed no difference in OS between POC (epirubicin, cisplation or oxaliplatin, and capecitabine) and POCR (HR 1.01, p = 0.90) in GC patients treated with preoperative chemotherapy and at least D1 + dissection.13 Our study is different from the CRITICS trial as the POCR cohort in our study did not receive any neoadjuvant treatment. Thus, it is difficult to compare it to our study. When we analyzed correlation between cLN− and pathological nodal disease status, only 56.50% of patients in the PEC cohort and 30.97% patients in the upfront resection cohort (POCR/POC) were both cLN− and pLN−. In the remaining 43.5% of patients in the PEC cohort and 69% in the upfront resection cohort (POCR/POC), the patients were upstaged from cLN− to pLN+ disease. This indicates that a cLN− disease status is not a reliable indicator of pathological nodal disease status.
The limitations of this study include the retrospective design which can lead to a selection bias. There is no data on disease‐free survival or the extent of lymphadenectomy as it is not a variable captured in the NCDB. We also do not have information on details related to the type of systemic chemotherapy administered including number of cycles, dosage, and toxicities related to treatment. Exclusion of patients due to missing data including sequence of therapy in relation to surgery is another limitation of this study. There is no data on the intent‐to‐treat population as only patients who received a definitive resection were analyzed. Despite these limitations, our study analyzes a large population database and examines the reliability of a negative clinical nodal disease status diagnosis and the role of clinical and pathological nodal disease status in decision making and opting multimodal treatment strategies for select patients.
5 |. CONCLUSION
Negative clinical nodal disease status in resectable noncardia gastric cancer is not a reliable indicator of pathological nodal disease status. Postoperative chemoradiation may be the preferred treatment strategy over postoperative chemotherapy in nonmetastatic non-cardia gastric cancer patients who receive upfront resection and are upstaged from clinically node negative disease to pathologically node positive disease. Perioperative chemotherapy and postoperative chemoradiation are acceptable treatment strategies irrespective of clinical nodal disease status.
Supplementary Material
ACKNOWLEDGMENTS
Supported in part by the Contardi Research Fellowship and the Adriaan Weststrate Memorial Fund. The acknowledged parties had no role in the study design; in the collection, analysis, and interpretation of data; in the writing of the report; and in the decision to submit the article for publication. Research reported in this publication was supported in part by the Biostatistics Shared Resource of Winship Cancer Institute of Emory University and NIH/NCI under award number P30CA138292. The content is solely the responsibility of the authors and does not necessarily represent the official views of the National Institutes of Health.
Abbreviations:
- CGC
cardia gastric cancer
- PEC
perioperative chemotherapy
- POC
postoperative chemotherapy
- POCR
postoperative chemoradiation therapy
Footnotes
CONFLICTS OF INTEREST STATEMENT
The authors declare no conflicts of interest.
SUPPORTING INFORMATION
Additional supporting information can be found online in the Supporting Information section at the end of this article.
DATA AVAILABILITY STATEMENT
The data that support the findings of this study are available from the corresponding author upon reasonable request.
REFERENCES
- 1.National Cancer Institute. Surveillance, epidemiology and end results program. Cancer Stat Facts: Stomach Cancer https://seer.cancer.gov/statfacts/html/stomach.html
- 2.Fitzmaurice C, Allen C, Barber RM, et al. Collaboration, G.B.o.D.C. Global, regional, and national cancer incidence, mortality, years of life lost, years lived with disability, and disability‐adjusted life‐years for 32 cancer groups, 1990 to 2015: a systematic analysis for the global burden of disease study. JAMA Oncol 2017;3(4):524–548. [DOI] [PMC free article] [PubMed] [Google Scholar]
- 3.Balakrishnan M, George R, Sharma A, Graham DY. Changing trends in stomach cancer throughout the world. Curr Gastroenterol Rep 2017;19(8):36. [DOI] [PMC free article] [PubMed] [Google Scholar]
- 4.Gholami S, Janson L, Worhunsky DJ, et al. Number of lymph nodes removed and survival after gastric cancer resection: an analysis from the US gastric cancer collaborative. J Am Coll Surg 2015;221(2): 291–299. [DOI] [PMC free article] [PubMed] [Google Scholar]
- 5.Alatengbaolide A, Lin D, Li Y, et al. Lymph node ratio is an independent prognostic factor in gastric cancer after curative resection (R0) regardless of the examined number of lymph nodes. Am J Clin Oncol 2013;36(4):325–330. [DOI] [PubMed] [Google Scholar]
- 6.Datta J, McMillan MT, Ecker BL, et al. Implications of lymph node staging on selection of adjuvant therapy for gastric cancer in the United States: a propensity score‐matched analysis. Ann Surg 2016;263(2):298–305. [DOI] [PubMed] [Google Scholar]
- 7.Park SH, Sohn TS, Lee J, et al. Phase III trial to compare adjuvant chemotherapy with capecitabine and cisplatin versus concurrent chemoradiotherapy in gastric cancer: final report of the adjuvant chemoradiotherapy in stomach tumors trial, including survival and subset analyses. J Clin Oncol 2015;33(28):3130–3136. [DOI] [PubMed] [Google Scholar]
- 8.Park SH, Lim DH, Sohn TS, et al. A randomized phase III trial comparing adjuvant single‐agent S1, S‐1 with oxaliplatin, and postoperative chemoradiation with S‐1 and oxaliplatin in patients with node‐positive gastric cancer after D2 resection: the ARTIST 2 trial(☆). Ann Oncol 2021;32(3):368–374. [DOI] [PubMed] [Google Scholar]
- 9.American College of Surgeons, National Cancer Database. Available from: https://www.facs.org/quality-programs/cancer/ncdb
- 10.Cunningham D, Allum WH, Stenning SP, et al. Perioperative chemotherapy versus surgery alone for resectable gastroesophageal cancer. N Engl J Med 2006;355(1):11–20. [DOI] [PubMed] [Google Scholar]
- 11.Macdonald JS, Smalley SR, Benedetti J, et al. Chemoradiotherapy after surgery compared with surgery alone for adenocarcinoma of the stomach or gastroesophageal junction. N Engl J Med 2001;345(10):725–730. [DOI] [PubMed] [Google Scholar]
- 12.Bang YJ, Kim YW, Yang HK, et al. Adjuvant capecitabine and oxaliplatin for gastric cancer after D2 gastrectomy (CLASSIC): a phase 3 open‐label, randomised controlled trial. The Lancet 2012;379(9813):315–321. [DOI] [PubMed] [Google Scholar]
- 13.Cats A, Jansen EPM, van Grieken NCT, et al. Chemotherapy versus chemoradiotherapy after surgery and preoperative chemotherapy for resectable gastric cancer (CRITICS): an international, open‐label, randomised phase 3 trial. Lancet Oncol 2018;19(5):616–628. [DOI] [PubMed] [Google Scholar]
Associated Data
This section collects any data citations, data availability statements, or supplementary materials included in this article.
Supplementary Materials
Data Availability Statement
The data that support the findings of this study are available from the corresponding author upon reasonable request.