

Abstract
Background:
Studies are increasingly examining the relationship between the neighborhood environment and cognitive decline; yet, few have investigated associations between multiple neighborhood features and Alzheimer’s disease and related dementias (ADRD).
Objective:
We investigated the relationship between neighborhood features and ADRD cumulative incidence from 2010 to 2014 in the South Carolina Alzheimer’s Disease Registry (SCADR).
Methods:
Diagnosed ADRD cases of age were ascertained from the SCADR by ZIP code and census tract. Neighborhood features from multiple secondary sources included poverty, air pollution [particulate matter with a diameter of 2.5 micrometers or less ()], and rurality at the census-tract level and access to healthy food, recreation facilities, and diabetes screening at the county level. In addition to using Poisson generalized linear regression to estimate ADRD incident rate ratios (IRR) with 95% confidence intervals (CIs), we applied integrated nested Laplace approximations and stochastic partial differential equations (INLA-SPDE) to address disparate spatial scales. We estimated associations between neighborhood features and ADRD cumulative incidence.
Results:
The average annual ADRD cumulative incidence was 690 per 100,000 people per census tract (95% CI: 660, 710). The analysis was limited to 98% of census tracts with a population old (i.e., 1,081 of 1,103). The average percent of families living below the federal poverty line per census tract was 18.8%, and of census tracts were considered rural. The average percent of households with limited access to healthy food was 6.4%. In adjusted models, every ) increase of was associated with 65% higher ADRD cumulative incidence (; 95% CI: 1.30, 2.09), where at or below is considered healthy. Compared to large urban census tracts, rural and small urban tracts had 10% (; 95% CI: 1.00, 1.23) and 5% (; 95% CI: 0.96, 1.16) higher ADRD, respectively. For every percent increase of the county population with limited access to healthy food, ADRD was 2% higher (; 95% CI: 1.01, 1.04).
Conclusions:
Neighborhood environment features, such as higher air pollution levels, were associated with higher neighborhood ADRD incidence. The INLA-SPDE method could have broad applicability to data collected across disparate spatial scales. https://doi.org/10.1289/EHP13183
Introduction
Alzheimer’s disease (AD) impacts an estimated 5.7 million adults in the US1 and is ranked, along with other forms of dementia, as the sixth leading cause of death.2 AD, together with related dementias (collectively termed ADRD), affected an estimated 11% of older adults (those aged 65 and older) in South Carolina in 2019,3 similar to the US national prevalence (11%) among older adults.4 As the older adult population is projected to rapidly increase in the next 40 years, the prevalence of ADRD will also increase.5 Additionally, ADRD is a large economic burden to society, with an estimated total cost of in 2022.6 Given that there are no current effective treatments for ADRD, identifying novel, macro-level factors that influence the incidence of ADRD is necessary to determine resource allocation (e.g., of age-related health services and caregiver support) and to identify potential area-level interventions.
Neighborhood economic conditions can influence health in several ways.7,8 For example, economically disadvantaged neighborhoods often have more environmental toxicants (e.g., air pollution), fewer material resources (e.g., less healthy food outlets), and lower access to high quality of health care.9,10 Exposure to adverse environmental conditions has also been associated with poorer well-being among older adults.11 A recent review concluded that older adults who live in more disadvantaged neighborhoods have poorer cognitive functioning.12 Environmental conditions may be especially salient determinants of health in older adults who are more likely to be dependent on resources within their immediate physical environments due to financial or mobility constraints.13
Previous research has identified candidate features of the neighborhood environment that could potentially contribute to the development of ADRD and increased cognitive decline, including higher poverty,12 increased air pollution,14 rurality,15 limited access to healthy food,16 limited access to community resources,17 as well as poor quality of health care.18 Previous systematic reviews describe higher poverty, lower income areas to be consistently associated with poorer cognition.10,12 Air pollution can bioaccumulate and increase risk of brain damage, which can then increase ADRD risk.11,19 Some South Carolina cities—with major disparities in a wide range of health conditions that could serve as an example for future research studies in other locations—are disproportionately affected by air pollution.20 A recent study predicted that air quality will worsen in certain South Carolina counties (e.g., Abbeville, Berkeley, Charleston) with higher non-Hispanic (NH)-black populations and that are closer in proximity to industrial parks.21 Similarly, studies have shown that limited access to healthy food increases risk of hypertension,22 obesity,23 and type 2 diabetes,24 all of which have been shown to increase risk for ADRD.25 Higher rates of these health conditions have been observed in NH-black compared to NH-white adults.26–28 These disparities are created and perpetuated by systematic differences in health-supportive environments and race-based experiences of discrimination.29 Importantly, a longitudinal study in Japan demonstrates that lower access to grocery stores selling fresh produce is associated with increased risk of ADRD.16
Studies also report higher ADRD rates in rural compared to urban areas.30 Residence in rural neighborhoods may increase ADRD risk via mechanisms similar to economic deprivation, such as lower access to healthy food, health care, and recreation facilities. Another potential reason for higher ADRD rates in rural areas is that greater geographic distance between people and places in rural areas leads to higher rates of social isolation, which can increase risk for ADRD.31 Further, studies suggest that remaining socially active vs. being socially isolated supports brain health and can reduce the risk of ADRD.32 Nonetheless, prior neighborhood studies are mostly conducted in densely populated urban areas, such as New York City, whereas South Carolina is more rural. By the US Census’ definition, in 2010, South Carolina ranked 17th in terms of the percent of the population living in a rural area: 33.7% rural compared to 28.8% of the overall US population.33 Given the known rural health disparities in South Carolina,34 especially among NH-black compared to NH-white populations,35 further research is required to determine whether a similar pattern of ADRD risk by rural neighborhoods exists.
In contrast to the effects of poorer neighborhood environments, several studies note that affluent neighborhoods are associated with better cognitive function among older adults.17,36,37 Past research shows that the higher density of neighborhood resources including recreation facilities can promote protective health behaviors (e.g., physical activity) and facilitate mental stimulation (e.g., social interaction), both of which can ultimately improve cognitive function38–40 and protect against ADRD.25 Also, higher quality of health care, such as screening for diabetes, may also protect against ADRD.
While there is a growing body of evidence regarding the potential links between neighborhood features and cognition,10 little research focuses on potential associations between neighborhood environments and neurocognitive disorders, such as ADRD. Leveraging a unique comprehensive source of diagnosed ADRD cases from the South Carolina Alzheimer’s Disease Registry (SCADR),3 this study helps fill this important literature gap by determining whether a broad range of neighborhood features are associated with higher ADRD cumulative incidence in South Carolina. In particular, we a) examined the geographic distribution of ADRD cumulative incidence and b) determined the area-level association between census tract and county level neighborhood features and ADRD incidence from 2010 to 2014 in South Carolina among those old and by race/ethnicity using the integrated nested Laplace approximation with stochastic partial differential equations (INLA-SPDE) method to overcome ecological methodological limitations. We hypothesized that both the prevalence of adverse neighborhood conditions and ADRD cumulative incidence would be higher among predominantly NH-black vs. NH-white census tracts. We hypothesized the following would be associated with higher ADRD incidence: higher poverty, higher air pollution levels, rural areas, limited access to healthy food, fewer recreation facilities, and lower screening for diabetes. Additionally in stratified racial/ethnic models, we hypothesized that the magnitude of these census-tract and county-level associations would be stronger among NH-black compared to NH-white populations.
Methods
Data Sources
We linked publicly available sources for our study to geographic features in the state from the 2010 US Census Topologically Integrated Geographic Encoding and Referencing (TIGER) line files.41 We collected census tract level population estimates from the 2010 US Decennial Census Summary File 1 (Census)42 and poverty from the 2010–2014 American Community Survey (ACS).43 Environmental toxicants were obtained from the 2010 Center for Air, Climate, and Energy Solutions (CACES)44 and rurality from the 2010 US Department of Agriculture Rural-Urban Commuting Area (RUCA).33 We used the following to collect data on other important covariates available at the county level: 2013 Census County Business Patterns (i.e., number of recreation facilities),45 the 2010 Dartmouth Atlas of Care (i.e., diabetes screening),46 and the 2010 USDA Food Environment Atlas (i.e., limited access to healthy food).47 Finally, we retrieved ADRD cases from the SCADR for years 2010–2014,3 allowing us to have a sufficient number of incident cases from the registry while considering a short time span, since neighborhoods can change over time. Data from the SCADR comes from a variety of sources to capture as many diagnoses as possible, including inpatient hospitalizations, emergency departments, mental health records, Medicaid, memory clinics, chart abstracts, vital records, and sources that contain clinical data, such as long-term care evaluations. This study was deemed exempt by the institutional review board at the University of South Carolina and by the National Institute of Environmental Health Sciences’ institutional review board.
Study Population: Incident Cases of ADRD Aggregated to the Census Tract Level
The SCADR provides information on each case, including type of ADRD (i.e., AD, vascular, mixed, or other), which is diagnostic data based on International Classification of Diseases 9/10 Clinical Modifications codes that were not necessarily confirmed with biomarker data. Individuals reported in the SCADR have been diagnosed by a physician, but the method or confirmation of diagnosis is not reported (Table S1). Additional information provided by the SCADR included source from which records were obtained (i.e., South Carolina Department of Mental Health, long-term care evaluation, inpatient, emergency room, Medicaid, and Home Health), age and year of diagnosis, sex/gender (i.e., male, female, and unknown), and race/ethnicity (i.e., NH-white, NH-black, Asian, American Indian, other than listed, Hispanic, unknown). The SCADR receives information on individuals’ sex/gender and race/ethnicity from the patient’s record and does not further collapse racial/ethnic categories.
ADRD incident cases among those diagnosed during the study’s time frame, and not previously diagnosed from another place, were retrieved from the SCADR () (Figure 1). We did not differentiate between types of ADRD diagnosis due to poor validity of the different types of ADRD diagnoses.1 Only hospital-based sources (e.g., in-patient hospitalization, emergency departments—which do not include Medicaid cases), which comprised 65% of the SCADR sample, were available at the residential address level. The remaining sources (e.g., Medicaid) adhere to federal requirements that mandate patient deidentification to avoid release of patients’ protected health information and thus cases from nonhospital-based sources are available only at the ZIP code level, for ZIP codes with at least 10 cases.
Figure 1.

Flow chart of Alzheimer’s disease and related dementias (ADRD) incident case selection.
Individual ADRD cases were excluded from the analysis based on the following residential address and age criteria: addresses not located in South Carolina (; 1,931 from hospital-based and 417 from nonhospital-based sources); cases of age (; 302 from hospital-based and 703 from nonhospital-based sources), as cases in this age group are typically attributed to early onset ADRD that is strongly associated with a genetic predisposition; and cases with missing demographic information on sex/gender and race/ethnicity ( from nonhospital-based sources only).
The remaining 40,529 observations from hospital-based sources were geocoded using Google Maps API via JSON (JavaScript Object Notation) embedded within SAS (9.4) macros.48 A total of 92 cases had residential addresses that matched multiple geolocations within a 10-mile radius and were reassigned a geolocation equal to the average of locations (i.e., the average of latitude and longitude of the multiple matches). Next, the geocoded ADRD incident cases were aggregated to the 2010 census tracts and included in subsequent analyses.
The remaining 18,527 observations from nonhospital-based sources available at the ZIP code level were assigned to census tracts using the Department of Housing and Urban Development (HUD)’s Office of Policy and Development and Research ZIP Code Crosswalk Data Files, which provide a correspondence between ZIP codes and census tracts in a procedure called crosswalk (Table S2).49 ZIP codes from each year were assigned to the 2010 census tract based on the first quarter of the respective ZIP code’s year, except for ADRD data from 2010 and 2011, which were assigned to census tracts using the 2012 ZIP code files because HUD’s 2010 and 2011 crosswalk files are for the 2000 census tract geographies. Each case was assigned proportionally to census tracts within the case’s ZIP, following the proportion of the ZIP’s residential addresses in each tract. The appropriate crosswalk file for each case was chosen based on the case’s year of entry into the ADRD registry. Nonhospital cases from 2012, 2013, and 2014 used the Q1 2012, Q1 2013, and Q1 2014 crosswalk files, respectively. These crosswalk files contain tract information based on the 2010 US Census.42 To assign the 2010 and 2011 nonhospital cases to census tracts, we used the Q1 2012 crosswalk file (whose tract information is from 2010 census data). Of the 18,527 nonhospital cases that were crosswalked, 1,065 cases were excluded after no census tract matching the ZIP code was found in the crosswalk file. The remaining 17,462 incident cases were successfully assigned to census tracts by the crosswalk procedure. Combined with incident cases from hospital-based sources, a total of 57,990 incident cases were aggregated to the census tract level.
Exposure Assessment: Neighborhood Features
Neighborhood features investigated included poverty, environmental toxicants related to air pollution, rurality, access to healthy food, access to recreation facilities, and quality of health care and were linked to the SCADR at the census tract level. We quantified poverty as the percent of families below the federal poverty line. The following environmental toxicants related to air pollution as the annual average concentration were considered: carbon monoxide (CO), sulfur dioxide (), nitrogen dioxide (), particulate matter with a diameter of 10 micrometers or less (), and particulate matter with a diameter of 2.5 micrometers or less (). We measured ozone () as the summer average. We collapsed the 10 categories of rurality into three meaningful categories: a) large urban (metropolitan area core; ), b) small urban (metropolitan area high commuting and metropolitan area low commuting; ), and c) rural (micropolitan area core, micropolitan high commuting, micropolitan low commuting, small town core, small town high commuting, small town low commuting, and rural areas; ). As a measure of limited access to healthy food, we used the percent of the county population who lives in poverty and who is more than 1 to 10 miles from a grocery store, as used in a previous study.16 As a measure of residents’ access to recreation facilities, we used the number of recreation facilities in the county. As a measure of the quality of health care in a county, we used the average annual percent of Medicare enrollees with diabetes 65–75 years of age having a hemoglobin A1c test, also used in a previous study.50 Poverty was scaled to a 10% change to improve interpretability for public health significance while considering recommended standard cut points,51 was scaled at , and access to recreation facilities was expressed as a z-score. Table S3 lists the variables used, and all exposure variables were linked to ADRD incidence at the census tract level.
Outcome Assessment: Census Tract-Level ADRD Cumulative Incidence
We calculated census tract level ADRD cumulative incidence per 100,000 people among those old in South Carolina from 2010 to 2014. The total population of individuals old in each census tract was obtained from the Census. Standardized counts (adjusted by age, sex/gender, and race/ethnicity by the direct standardization method, using the 2010 US Census population as the standard population) were divided by the respective population to calculate empirical standardized cumulative incidence. Standardized counts among NH-black and NH-white cases were also calculated. Other (i.e., Asian, American Indian, Hispanic, and other) racial/ethnic groups were not included in this analysis due to small sample sizes. Among 1,103 census tracts, 22 were removed due to population being old, and one was removed due to lack of information on poverty. The final sample for analysis included 1,081 census tracts (98.0% of tracts in South Carolina).
Potential Modifier: Race/Ethnicity
To determine if there is potential modification by race/ethnicity between neighborhood features and ADRD incidence, we stratified ADRD by NH-black and NH-white incidence.
Statistical Analyses
Standardized cumulative ADRD incidence was mapped at the census tract level using R version 4.2.2 and 2010 TIGER Line Files.41
To determine the association between neighborhood features and ADRD cumulative incidence, we modeled the census tract-level ADRD cumulative incidence with an offset Poisson generalized linear regression model with correlated spatial random effect.52 With the expected number of standardized case counts for tract , and the population at risk in tract , this model assumes a log-linear relationship between the covariates (i.e., neighborhood features) and expected ADRD cumulative incidence .
Each term represents the value of the covariate in tract . Each term represents the value in tract of the continuous, two-dimensional latent Gaussian random field (GRF) with Matérn covariance structure that accounts for spatial correlation in the model. Rewriting this expression as
frames the model as a Poisson generalized linear mixed model with as the model’s offset term and as the standardized counts in tract . Data processing was executed using SAS software version 9.4 (SAS Institute) and R version 4.2.2.
Given the need to estimate the number of ADRD cases for census tracts with sparse or no data, we took a Bayesian vs. frequentist approach and fit the model using the INLA-SPDE method.53–55
In our multilevel analysis, we include covariates at the census tract and county level in one model. Computationally feasible estimation of the spatial correlation represented by is accomplished by approximating the continuous GRF with a discrete Gaussian Markov random field (GMRF) defined on a “mesh” or set of nodes in the analysis domain. Without this approximation, estimating the spatial correlation would be too computationally demanding, as it would require computing with dense precision matrices. The discrete GMRF approximation to the continuous GRF with Matérn covariance allows computations via sparse rather than dense precision matrices. Subsequent variable selection was conducted by removing covariates from the model if their effect was not statistically significant. was the only air pollutant included in our analysis because the other pollutants were omitted due to high correlation with and/or lack of evidence of a statistically significant association with the outcome variable (i.e., ADRD incidence). To test for differences by race/ethnicity, we added respective interaction terms (e.g., poverty race) to the overall model. Finally, goodness of fit was assessed via plots of model residuals. We presented results from these regression analyses as incidence rate ratios (IRR) with 95% confidence intervals (CIs). Data processing was executed using SAS software version 9.4 (SAS Institute).
Our analysis used the default prior distributions from the R-INLA software package (version 22.05.07).53–55 The random spatial effect terms follow a normal hyper-prior distribution with prior for precision , which provides a large mean for . The fixed effects take on diffuse normal prior distributions . We refit the model with two alternative sets of priors and found that both alternative sets were more noninformative (higher variance) than the R-INLA default priors. The results were not sensitive to the prior distributions’ variance, indicating the data contains sufficient information to obtain Bayesian estimates of the model parameters; therefore, we used the default R-INLA priors.56
The strength of the spatial correlation is measured by estimating the range parameter , which is related to the GRF’s Matérn covariance’s scale parameter by . The range parameter indicates the distance at which the spatial correlation drops to , so that larger values of suggest longer-range correlation effects.
Sensitivity Analyses
To assess the sensitivity of the model results to certain subgroups of the data, we fit the model among the overall population excluding each subgroup separately: skilled nursing facilities, hospital cases, nonhospital cases, and AD only cases. While skilled nursing facilities tend to be located in large urban areas, they also generally include older adults with co-morbidities who may have physical disabilities and thus have limited interactions with their neighborhood environment. Hospital cases also tend to be located in large urban areas where access to resources, such as recreation facilities, is higher. Meanwhile, nonhospital cases were obtained from Medicaid and Home Health sources, which may differ in neighborhood feature. Finally, while there is poor validity of different types of ADRD diagnoses, there are different proposed biological mechanisms for the different types of ADRD, and thus different types of ADRD may be impacted differently by neighborhood features.
Results
Neighborhood Features
Among South Carolina census tracts, the average percent of families living below the federal poverty line was 18.8% [standard deviation ]. Approximately 20% of census tracts were considered rural, and tracts had an average of () (Table 1). Among counties, the average percent of households with limited access to healthy food was 6.4% (). The average number of recreation facilities per 100,000 people per county was 5.8 (). The average number of people with diabetes 65–75 years of age per county that received HbA1c screening was 83.2% () (Table 1).
Table 1.
Distribution of neighborhood features, South Carolina, 2010–2014 ( census tracts).
| Neighborhood features | (%) or |
|---|---|
| Povertya,b | |
| 0%–10% [ (%)] | 275 (25.4) |
| 11%–20% [ (%)] | 383 (35.4) |
| 21%–30% [ (%)] | 250 (23.1) |
| 31%–40% [ (%)] | 110 (10.2) |
| 41%–50% [ (%)] | 41 (3.8) |
| 51%–60% [ (%)] | 14 (1.3) |
| 61%–70% [ (%)] | 6 (0.6) |
| 71%–80% [ (%)] | 1 (0.1) |
| 81%–90% [ (%)] | 0 (0.0) |
| 91%–100% [ (%)] | 1 (0.1) |
| Annual average pollutants ()a,c | |
| CO | |
| Rurality [ (%)]a,d | |
| Rural [ (%)] | 209 (19.3) |
| Small urban [ (%)] | 241 (22.3) |
| Large urban [ (%)] | 631 (58.4) |
| Percent of households with limited access to healthy food and low income ()e,f | |
| Number of recreation facilities per 100,000 people ()e,g | |
| Percent of individuals with diabetes who receive HbA1c screening ()e,h | |
Note: , particulate matter with a diameter of 2.5 micrometers or less; , particulate matter with a diameter of 10 micrometers or less; SD, standard deviation.
Unit of measure is census tract ().
Poverty is from the American Community Survey 5-year estimates of poverty status in the past 12 month defined as the percent of families below the federal poverty line.
cPollutants are estimates from Center for Air, Climate, & Energy Solutions (CACES) for 2010. PM refers to the average daily measure of fine particulate matter in micrograms per cubic meter.
Rurality was categorized using United States Department of Agriculture (USDA) Rural-Urban Commuting Area (RUCA) codes: 1, large urban (metropolitan area); 2–3, small urban (metropolitan area high commuting and metropolitan area low commuting); 4–10, rural (as micropolitan area core, micropolitan high commuting, micropolitan low community, small town core, small town high commuting, small town low commuting, and rural areas).
Unit of geographic area is county ().
Limited access to healthy food is based on 2010 estimates from the United States Department of Agriculture Economic Research Service Food Environment Atlas of the percent of population who lives in poverty and more than 1 or 10 miles from a grocery store.
Number of recreation facilities are identified using the North American Industry Classification System (NAICS) code 713940 in the 2010 County Business Pattern report.
Percent of individuals with diabetes that receive HbA1c screening is from Dartmouth Institute for Healthy Policy and Clinical Practice Dartmouth Atlas Project 2010 estimates for the average annual percent of Medicare enrollees with diabetes at 65–75 years of age having hemoglobin A1c test.
Age-Sex/Gender-Race/Ethnicity Standardized ADRD Cumulative Incidence
Overall, we observed ADRD cumulative incidence geographically distributed across the state with higher rates observed in the southern west region, known as the Low Country region (Figure 2; see Figure S1 for South Carolina region information). The annual standardized cumulative incidence in the overall population was 690 per 100,000 (95% CI: 660, 710).
Figure 2.
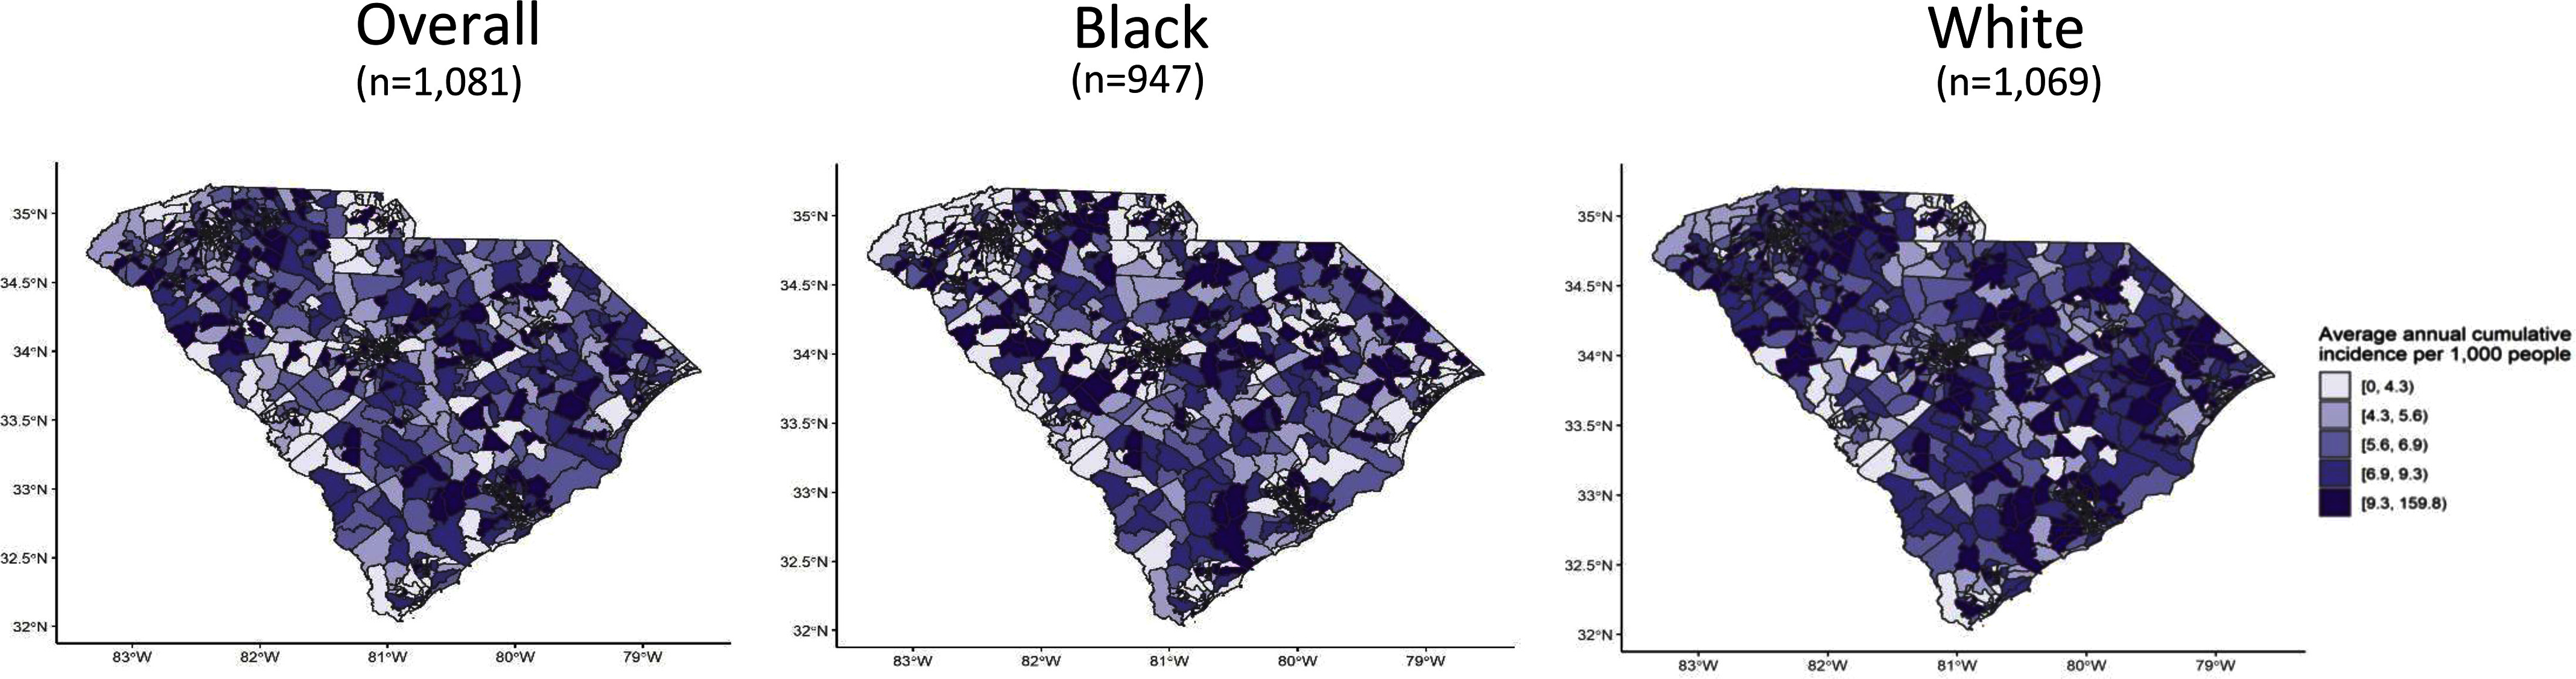
Alzheimer’s disease and related dementia (ADRD) standardized cumulative incidence by census tract, 2010–2014, South Carolina. Maps were generated in R version 4.2.2, and 2010 TIGER Line Files were used. The summary data can be found in Excel Table S1.
Neighborhood Features and ADRD Cumulative Incidence
In the adjusted model, for every 10% increase in families living below the federal poverty level, ADRD cumulative was 1% higher (; 95% CI: 0.97, 1.04) (Table 2). Among NH-white populations, for every 10% increase in families living below the federal poverty level, ADRD incidence was 7% higher (; 95% CI: 1.03, 1.10) (Table 3). Among NH-black populations, for every 10% increase in families living below the federal poverty level, ADRD was 5% lower (; 95% CI: 0.82, 1.09) (Table 3).
Table 2.
Alzheimer’s disease and related dementias (ADRD) standardized incidence rate ratios by neighborhood features among South Carolina census tracts by sources and/or types of cases, 2010–2014, South Carolina ( census tracts).
| Neighborhood features | All cases () | Excluding cases at skilled nursing facilities () | Excluding hospital cases () | Excluding nonhospital cases () | Excluding nonhospital and non-Alzheimer’s cases () |
|---|---|---|---|---|---|
| Povertya,b | 1.01 (0.97, 1.04) | 1.00 (0.97, 1.04) | 1.09 (1.00, 1.19) | 1.02 (1.00, 1.05) | 1.01 (0.98, 1.04) |
| Annual average a,c | 1.65 (1.30, 2.09) | 1.64 (1.30, 2.08) | 4.31 (2.15, 8.62) | 1.30 (1.05, 1.62) | 1.32 (1.03, 1.69) |
| Ruralitya,d | |||||
| Rural | 1.10 (1.00, 1.23) | 1.11 (1.00, 1.24) | 0.72 (0.53, 0.98) | 1.08 (0.97, 1.20) | 1.03 (0.92, 1.16) |
| Small urban | 1.05 (0.96, 1.15) | 1.06 (0.96, 1.16) | 0.62 (0.47, 0.82) | 1.00 (0.93, 1.08) | 1.00 (0.92, 1.09) |
| Large urban | 1.00e | 1.00e | 1.00e | 1.00e | 1.00e |
| Limited access to healthy foodf,g | 1.02 (1.01, 1.04) | 1.02 (1.01, 1.04) | 1.00 (0.97, 1.04) | 1.01 (0.99, 1.03) | 1.01 (1.00, 1.03) |
| Recreation facilities per 100,000 peoplef,h | 1.03 (0.98, 1.08) | 1.03 (0.98, 1.08) | 1.11 (0.97, 1.26) | 1.02 (0.97, 1.08) | 1.02 (0.96, 1.08) |
| Percent screened for diabetesf,i | 0.99 (0.98, 1.00) | 0.99 (0.98, 1.00) | 0.99 (0.96, 1.03) | 0.99 (0.98, 1.00) | 0.99 (0.98, 1.01) |
Note: Poisson generalized linear regression with integrated nested Laplace approximations and stochastic partial differential equations (INLA-SPDE) was used. To assess the sensitivity of the model results to certain subgroups of the data, the model was refit using those subgroups. Column 1 shows the results of the model including all ADRD cases. Column 2 excludes cases reported from skilled nursing facilities, which are clustered due to sharing the same geographic location. Column 3 show the model results when excluding all hospital cases and Column 4 excluding all nonhospital cases. Column 5 excludes nonhospital cases and cases that were not explicitly coded as Alzheimer’s or vascular dementia. , particulate matter with a diameter of 2.5 micrometers or less.
Unit of measure is census tract.
Poverty is defined as the percent of families below the federal poverty line.
Annual average is measured in .
Rurality was categorized using Rural-Urban Commuting Area codes: large urban (metropolitan area); small urban (metropolitan area high commuting and metropolitan area low commuting); rural (micropolitan area core, micropolitan high commuting, micropolitan low community, small town core, small town high commuting, small town low commuting, and rural areas).
Reference level.
Unit of measure is county.
Limited access to healthy food is the percent of population who lives in poverty and more than 1 or 10 miles from a grocery store and measured continuously.
Number of recreation facilities are identified using the North American Industry Classification System (NAICS) code 713940 and measured continuously.
Percent of individuals with diabetes that receive HbA1c screening estimates the average annual percent of Medicare enrollees with diabetes at 65–75 years of age having hemoglobin A1c test and measured continuously.
Table 3.
Alzheimer’s disease and related dementias (ADRD) standardized incidence rate ratios by neighborhood features and stratified by NH-black and NH-white populations, 2010–2014, South Carolina ( census tracts).
| Neighborhood features | NH-black and NH-white cases () | NH-white cases () | NH-black cases () |
|---|---|---|---|
| Povertya,b | 0.92 (0.89, 0.96) | 1.07 (1.03, 1.10) | 0.95 (0.82, 1.09) |
| Annual average a,c | 1.19 (0.96, 1.47) | 1.46 (1.16, 1.83) | 1.60 (0.55, 4.64) |
| Ruralitya,d | |||
| Rural | 1.10 (1.00, 1.21) | 1.09 (0.98, 1.21) | 1.29 (0.85, 1.98) |
| Small urban | 0.98 (0.91, 1.07) | 0.99 (0.91, 1.08) | 0.99 (0.62, 1.60) |
| Large urban | 1.00e | 1.00e | 1.00e |
| Limited access to healthy foodf,g | 1.04 (1.03, 1.05) | 1.03 (1.01, 1.04) | 1.01 (0.96, 1.07) |
| Recreation facilities per 100,000 peoplef,h | 1.05 (1.01, 1.10) | 1.04 (0.99, 1.09) | 0.88 (0.73, 1.06) |
| Percent screened for diabetesf,i | 1.00 (0.99, 1.01) | 0.99 (0.98, 1.01) | 1.01 (0.96, 1.06) |
Note: Poisson generalized linear regression with integrated nested Laplace approximations and stochastic partial differential equations (INLA-SPDE) was used. , particulate matter with a diameter of 2.5 micrometers or less.
Unit of measure is census tract.
Poverty is defined as the percent of families below the federal poverty line.
Annual average is measured in .
Rurality was categorized using Rural-Urban Commuting Area codes: large urban (metropolitan area); small urban (metropolitan area high commuting and metropolitan area low commuting); rural (micropolitan area core, micropolitan high commuting, micropolitan low community, small town core, small town high commuting, small town low commuting, and rural areas).
Reference level.
Unit of measure is county.
Limited access to healthy food is the percent of population who lives in poverty and more than 1 or 10 miles from a grocery store and measured continuously.
Number of recreation facilities are identified using the North American Industry Classification System (NAICS) code 713940 and measured continuously.
Percent of individuals with diabetes that receive HbA1c screening estimates the average annual percent of Medicare enrollees with diabetes at 65–75 years of age having hemoglobin A1c test and measured continuously.
For every increase in , ADRD cumulative incidence was 65% higher (; 95% CI: 1.30, 2.09) (Table 2), where at or below is considered healthy. Compared to large urban census tracts, rural and small urban tracts had 10% (; 95% CI: 1.00, 1.23) and 5% (; 95% CI: 0.96, 1.15) higher ADRD incidence, respectively. Excluding hospital cases, rural and small urban tracts had 28% (; 95% CI: 0.53, 0.98) and 38% (; 95% CI: 0.47, 0.82) lower ADRD incidence, respectively. For every percent increase of the county population with limited access to healthy food, ADRD incidence was 2% higher (; 95% CI: 1.01, 1.04). Every additional 3.8 recreation facilities per 100,000 people was associated with 3% higher ADRD incidence (; 95% CI: 0.98, 1.08). For every percent increase in individuals with diabetes screened for HbA1c, ADRD incidence was 1% lower (; 95% CI: 0.98, 1.00) (Table 2). Among the four subset analyses, we did not observe any other significant differences from the overall model (Table 2).
Although confidence intervals overlapped with each other and interaction terms were not statistically significant, results also showed that , rural areas, and limited access to healthy food were associated with higher ADRD incidence among both NH-white and NH-black populations (Table 3). Associations between number of recreation facilities as well as percent in diabetes screening and ADRD incidence were not significant in stratified models (Table 3).
Parameters of the Spatial Random Effect Model
Our model estimated the range parameter to be 0.022 (95% credible interval: 0.018, 0.027). With units being approximate degrees of latitude and one degree approximately equal to 69 miles, this corresponded to an estimate that spatial correlation drops to 0.1 at , suggesting that ADRD cumulative incidence in South Carolina does not demonstrate significant spatial correlation after adjusting for the model’s covariates.
Discussion
This study found that features of the neighborhood environment were associated with ADRD cumulative incidence among South Carolina census tracts—a state with high ADRD incidence and mortality.1 Consistent with our hypotheses (although not all estimates were statistically significant), we found that higher poverty levels, higher air pollution levels, more rural areas, and limited access to healthy food were related to higher census-tract ADRD incidence. We also found that higher screening for diabetes was related to lower census-tract ADRD incidence. Even though the magnitude of associations were not stronger among NH-black than NH-white populations, our racial/ethnic stratified results were in the expected direction where higher air pollution, more rural areas, and limited access to healthy food were associated with higher census-tract ADRD incidence and higher screening for diabetes was related to lower ADRD incidence. However, inconsistent with our hypothesis, higher poverty levels were associated with lower ADRD incidence among NH-black populations. Finally, the INLA-SPDE modeling approach allowed computationally efficient fitting of the Bayesian model to estimate the spatial correlation in standardized ADRD incidence rates after adjustment. Although our study showed no evidence of spatial correlation in ADRD incidence, the Bayesian model formulation allowed us to identify several factors associated with ADRD incidence while ruling out geographic proximity alone as a contributing factor.
Results suggest that features related to disadvantaged neighborhoods [e.g., higher poverty levels, air pollution (), and limited access to healthy food] were associated with higher ADRD cumulative incidence at the census-tract level. Previous studies also reported higher ADRD incidence,57 poorer cognitive functioning,10,12 and lower brain volume58 in neighborhoods with more socioeconomic disadvantage. Neighborhood disadvantage may be related to ADRD incidence via clustering of environmental toxicants,59 consistent with our and previous findings14,19 where higher air pollution was associated with higher ADRD census-tract incidence. Specifically, prior studies noted additional environmental pollutants, such as , were associated with AD.60 Although we excluded other pollutants (i.e., CO, , , , and ) from our analysis due to multicollinearity, they may still be relevant regarding ADRD incidence. It is possible that may be acting as a proxy exposure for the other highly correlated pollutants. Further, nationally based large studies reported long-term associations between environmental pollutants and ADRD incidence.61,62 Our study contributes to the literature by demonstrating an ecological association in South Carolina, a state rarely studied in neighborhood research. We also expand on the literature by demonstrating an ecological association between and ADRD incidence stratified by race/ethnicity where NH-black populations had a stronger magnitude, although confidence intervals overlapped with results from NH-white populations. This is similar to a national-based study that observed black individuals had increased risk of ADRD in relation to and .60 Our findings are important given the reported racial disparities in ADRD perpetuated by systematic differences while adjusting for multiple physical and social neighborhood features. Fewer resources and lower quality of care have also been proposed as ways that neighborhood disadvantage may be related to ADRD.63,64 For example, having fewer healthy food outlets limits nutritious options and so increases risk for poor health conditions, such as obesity, which is related to ADRD risk. Consistent with this idea, our results showed that lower access to healthy food was associated with higher ADRD census-tract incidence, similar to a previous study.16 Although our results were statistically significant while accounting for other neighborhood features as well as the spatial distribution, it is important for future research to replicate these findings using a more meaningful spatial scale for measuring limited access to healthy food (e.g., census tract instead of county level) given the potential of measurement error. We also observed that higher screening for diabetes was associated with lower ADRD census-tract incidence, comparable to a previous study that found better quality of care (e.g., better resident-to-staff ratio at the county-level) was associated with higher late-life well-being.65 We also interpret these results with caution, however, given that the measure of diabetes screening was at a large spatial scale (i.e., county level) where the data may be correlated with other factors. While future studies are needed to elucidate the exact mechanisms between disadvantaged neighborhoods and ADRD, these results add to a growing body of research reaffirming the impact of neighborhoods on health and health disparities, including ADRD.
We found that rural compared to urban census tracts had higher ADRD incidence, consistent with previous studies64,66,67 including a meta-analysis.15 However, this association was inverted in our sensitivity analysis excluding hospital cases (i.e., rural vs. large urban tracts were associated with lower ADRD incidence). While there may be more cases from urban areas, another explanation is that there are fewer health care resources and providers in rural settings68 and thus a lower likelihood of detecting ADRD.
Inconsistent with our hypothesis, results suggest that more recreation facilities were associated with higher ADRD census-tract incidence, although this did not reach statistical significance. Our nonsignificant findings may also reflect the aggregate measurement of recreation facilities assessed at the county-level. Counties are large geographic units with varying degrees of heterogeneity; therefore, access to recreation facilities differ depending on where one lives within the county. For example, more densely populated areas are likely to have more recreation facilities. Use of alternative measures to capture recreation facilities (as well as other measures related to physical activity and neighborhood walkability) at a smaller, more meaningful scale, may result in different statistical power to detect meaningful differences. A recent review that concluded the neighborhood-built environment is related to ADRD included studies that often reported nonsignificant associations between recreation centers (as well as other neighborhood resources) and cognitive function.69
Our findings that demonstrate associations between neighborhood features and ADRD are critical for addressing negative health impacts and to inform policy. Specifically, our results suggest a need to increase management of diabetes. Since past research calculated 30% population attributable risk of ADRD explained by different risk factors including type II diabetes,59 decreasing these factors from upstream interventions like diabetes screening, improving quality of care, and increasing access to care can delay and/or prevent ADRD. Our findings also suggest a need to increase access to health care in predominantly poor, rural, and/or minoritized racial/ethnic areas. There is an uneven, spatial distribution of health care resources where physicians tend to concentrate in areas of more economic wealth.64 Even a previous study noted lower AD-related services among community pharmacies in rural compared to urban counties.70 Higher incidence of ADRD in high-poverty, more rural neighborhoods with fewer resources and services suggests that programs aimed at promoting social and cognitive engagement may have greater impact if implemented in these low-resource areas.71 In addition to increasing health care access and improving health care quality, other services catered to areas with higher proportions of older adults can include activities offered by local organizations, affordable meal programs, and home care services. Services are vital to older adults by promoting social cohesion and supporting caregivers.32,72,73
Our study has several limitations. One limitation concerns the passive nature of data collection regarding the SCADR, where it is possible that those with low income, limited access to care, and/or live in a rural area may not visit a doctor until they are very sick or not visit at all, and thus might not be captured by the SCADR. Similarly, the age of diagnosis reported in the SCADR may be inaccurate as often people are diagnosed long after disease onset since AD symptoms may remain subclinical for decades74 or due to denial or stigma.75,76 The SCADR also includes diagnosed cases in South Carolina only, yet individuals are likely to seek treatment outside the state (e.g., edge effect) in nearby cities, such as Charlotte, NC, and thus not be captured in the SCADR. Also, use of measures from the ACS like poverty can be a limitation because data are based on probability samples, for which sampling frames change annually. To mitigate this problem, we used 5-year data estimates. Furthermore, we were unable to establish temporality. Although we used incident cases, temporality concerns remain, as often ADRD is diagnosed years after clinical onset, as previously mentioned. This also indicates the need for future research to use a life course framework to study ADRD because although these diseases are in late ages, there are things happening in the last decades and across one’s whole life that matters. Future research should also consider additional neighborhood measures, such as measures of the built environment at the census tract level, given that our study measured number of recreation facilities, limited access to healthy food, and diabetes screening at the county level. The County Business Patterns and Atlas of Care are not available at the county level. We ran into software issues using the 2010 Food Environment data at the census tract level and so had to use county level instead. Counties are not reflective of people’s neighborhoods given their large geographic size and nonrestrictive boundaries where people may travel to other counties for care and other resources. Future studies should also consider other neighborhood level measures, as measurement error as well as residual confounding are likely. Another limitation of our study concerns the assignment method of incident cases to census tracts and specifically the fact that nonhospital-based sources were only available at the ZIP code level due to the need to protect personally identifiable health information. Since zip codes are designed for mailing purposes, they frequently change and thus greatly overlap with census tracts, which reduces the accuracy of the crosswalk procedure.77 However, this was the only geographic information available from these data sources, which was important to include to have a population-based study. Given our research interest in assessing racial disparities, it was also important to retain ZIP code-only cases given that we observed a higher percent of NH-black cases from ZIP code-only cases (36.6%) compared to hospital-based cases (20.3%). A final limitation includes factors inherent to the ecological study design, including the inability to directly determine whether differences across areas are due to characteristics of the area themselves or to differences between the types of individuals living in different areas. However, our study is interested in identifying areas of high disease burden in need of resources, which are more effectively intervened on through policies and public health initiatives.
Despite the limitations, our study leverages a unique data source, the SCADR, allowing for population-based statewide research. Using multiple data sources with a history of validity checks (e.g., an algorithm to capture duplicate entries, such as overlap in Medicaid cases and hospital cases), the SCADR captures almost all diagnosed cases in South Carolina. Although our results are not generalizable to all US states, this is an important neighborhood context to study given that South Carolina ranks the eighth highest AD-related mortality rate.1 Our study also drew on diverse sources to measure several neighborhood features related to monitoring socioeconomic inequalities in health (e.g., air pollution, poverty)78 and contributing to a dearth of literature (e.g., food outlets, recreation facilities). Studying features of the built environment may inform interventions to address ADRD prevalence and disparities given that physical activity may play a mediating role between the neighborhood-built environment and ADRD.69 Despite filling these gaps, future research should investigate additional census-tract neighborhood features (e.g., green space, psychosocial stress) that contribute to ADRD rates to accurately assess racial/ethnic, sex/gender, and class disparities. A final strength includes the INLA-SPDE approximations allowed fitting a complex Bayesian model without computational bottlenecks, all while accounting for data features, such as spatial correlations, differences of geographic area reporting frequency, and differences in measurement of exposures.
Adverse neighborhood features were associated with higher ADRD cumulative incidence at the census-tract level, which underscores the need for a macro-level approach. Such approaches to allocate aging-related services to areas with high proportions of older adults and disadvantaged (e.g., poor, rural, predominant minoritized racial/ethnic areas, and higher air polluted areas) neighborhoods can help protect or improve older adults’ cognitive health at the population level. Understanding how ADRD is distributed in the population by neighborhoods informs both allocation of public health resources and direction of potential public policy initiatives. With this approach, we can illuminate environmental factors to modify in hopes of preventing or delaying ADRD.
Supplementary Material
Acknowledgments
Study concept and design: D.M. Alhasan, G. Larson, J.A. Hirsch, and C.L. Jackson. Acquisition of data: F.B. LaPorte, M.C. Miller, and D.M. Alhasan. Statistical analysis: G. Larson, N.S. MacNell, and B. Cai. Interpretation of data: D.M. Alhasan, G. Larson, F.B. LaPorte, and W.B. Jackson II. Drafting of the manuscript: D.M. Alhasan. Critical revision of the manuscript for important intellectual content: D.M. Alhasan, G. Larson, M.C. Lohman, B. Cai, F.B. LaPorte, M.C. Miller, W.B. Jackson II, N.S. MacNell, J.A. Hirsch, and C.L. Jackson. Administrative, technical, and material support: C.L. Jackson. Obtaining funding and study supervision: C.L. Jackson. Final approval: D.M. Alhasan, G. Larson, M.C. Lohman, B. Cai, F.B. LaPorte, M.C. Miller, W.B. Jackson II, N.S. MacNell, J.A. Hirsch, and C.L. Jackson.
The authors would like to thank the South Carolina Alzheimer’s Disease Registry funded by the South Carolina Department of Health and Human Services (contract no. A20190088A). We would also like to thank Drs. Marilyn Wende, Yuan Hong, Charity Brenneman, and Christian Douglas for their support on an earlier draft of the manuscript.
This work was funded by the Intramural Program at the NIH, National Institute of Environmental Health Sciences [Z1AES103325-01 (C.L.J.)] and by the National Institute of Aging [R01 AG072634 (J.A.H.)].
Conclusions and opinions are those of the individual authors and do not necessarily reflect the policies or views of EHP Publishing or the National Institute of Environmental Health Sciences.
References
- 1.Alzheimer’s Association. 2018. 2018 Alzheimer’s disease facts and figures. Alzheimers Dement 14(3):367–429, 10.1016/j.jalz.2018.02.001. [DOI] [Google Scholar]
- 2.Kochanek KD, Murphy SL, Xu J, Tejada-Vera B. 2016. Deaths: final data for 2014. Atlanta, GA: Centers for Disease Control and Prevention. http://www.cdc.gov/nchs/products/nvsr.htm [accessed 8 March 2023]. [PubMed] [Google Scholar]
- 3.Office for the Study of Aging. 2019. 2019 Annual Report South Carolina Alzheimer’s Disease Registry. Columbia, SC: Office for the Study of Aging. https://sc.edu/study/colleges_schools/public_health/documents/alzheimers_registry_report.pdf [accessed 15 January 2020]. [Google Scholar]
- 4.Hebert LE, Beckett LA, Scherr PA, Evans DA. 2001. Annual incidence of Alzheimer’s disease in the United States: projected to the years 2000 through 2050. Alzheimer Dis Assoc Disord 15(4):169–173, PMID: , 10.1097/00002093-200110000-00002. [DOI] [PubMed] [Google Scholar]
- 5.Barnes DE, Yaffe K. 2011. The projected effect of risk factor reduction on Alzheimer’s disease prevalence. Lancet Neurol 10(9):819–828, PMID: , 10.1016/S1474-4422(11)70072-2. [DOI] [PMC free article] [PubMed] [Google Scholar]
- 6.Alzheimer’s Association. 2022. 2022 Alzheimer’s disease facts and figures. Alzheimers Dement 18:700–789, PMID: , 10.1002/alz.12638. [DOI] [PubMed] [Google Scholar]
- 7.Krieger N, Feldman JM, Waterman PD, Chen JT, Coull BA, Hemenway D. 2017. Local residential segregation matters: stronger association of census tract compared to conventional city-level measures with fatal and non-fatal assaults (total and firearm related), using the index of concentration at the extremes (ICE) for racial, economic, and racialized economic segregation, Massachusetts (US), 1995–2010. J Urban Health 94(2):244–258, PMID: , 10.1007/s11524-016-0116-z. [DOI] [PMC free article] [PubMed] [Google Scholar]
- 8.Krieger N, Feldman JM, Kim R, Waterman PD. 2018. Cancer incidence and multilevel measures of residential economic and racial segregation for cancer registries. JNCI Cancer Spectr 2(1):pky009, PMID: , 10.1093/jncics/pky009. [DOI] [PMC free article] [PubMed] [Google Scholar]
- 9.Clarke P, Nieuwenhuijsen ER. 2009. Environments for healthy ageing: a critical review. Maturitas 64(1):14–19, PMID: , 10.1016/j.maturitas.2009.07.011. [DOI] [PubMed] [Google Scholar]
- 10.Wu YT, Prina AM, Brayne C. 2015. The association between community environment and cognitive function: a systematic review. Soc Psychiatry Psychiatr Epidemiol 50(3):351–362, PMID: , 10.1007/s00127-014-0945-6. [DOI] [PMC free article] [PubMed] [Google Scholar]
- 11.Clarke PJ, Weuve J, Barnes L, Evans DA, Mendes de Leon CF. 2015. Cognitive decline and the neighborhood environment. Ann Epidemiol 25(11):849–854, PMID: , 10.1016/j.annepidem.2015.07.001. [DOI] [PMC free article] [PubMed] [Google Scholar]
- 12.Besser LM, McDonald NC, Song Y, Kukull WA, Rodriguez DA. 2017. Neighborhood environment and cognition in older adults: a systematic review. Am J Prev Med 53(2):241–251, PMID: , 10.1016/j.amepre.2017.02.013. [DOI] [PMC free article] [PubMed] [Google Scholar]
- 13.Lang IA, Llewellyn DJ, Langa KM, Wallace RB, Huppert FA, Melzer D. 2008. Neighborhood deprivation, individual socioeconomic status, and cognitive function in older people: analyses from the English longitudinal study of ageing. J Am Geriatr Soc 56(2):191–198, PMID: , 10.1111/j.1532-5415.2007.01557.x. [DOI] [PMC free article] [PubMed] [Google Scholar]
- 14.Moulton PV, Yang W. 2012. Air pollution, oxidative stress, and Alzheimer’s disease. J Environ Public Health 2012:472751, PMID: , 10.1155/2012/472751. [DOI] [PMC free article] [PubMed] [Google Scholar]
- 15.Russ TC, Batty GD, Hearnshaw GF, Fenton C, Starr JM. 2012. Geographical variation in dementia: systematic review with meta-analysis. Int J Epidemiol 41(4):1012–1032, PMID: , 10.1093/ije/dys103. [DOI] [PMC free article] [PubMed] [Google Scholar]
- 16.Tani Y, Suzuki N, Fujiwara T, Hanazato M, Kondo K. 2019. Neighborhood food environment and dementia incidence: the Japan gerontological evaluation study cohort survey. Am J Prev Med 56(3):383–392, PMID: , 10.1016/j.amepre.2018.10.028. [DOI] [PMC free article] [PubMed] [Google Scholar]
- 17.Clarke PJ, Ailshire JA, House JS, Morenoff JD, King K, Melendez R, et al. 2012. Cognitive function in the community setting: the neighbourhood as a source of ’cognitive reserve’? J Epidemiol Community Health 66(8):730–736, PMID: , 10.1136/jech.2010.128116. [DOI] [PMC free article] [PubMed] [Google Scholar]
- 18.Wu Y-T, Brayne C, Liu Z, Huang Y, Sosa AL, Acosta D, et al. 2020. Neighbourhood environment and dementia in older people from high-, middle- and low-income countries: results from two population-based cohort studies. BMC Public Health 20(1):1330, PMID: , 10.1186/s12889-020-09435-5. [DOI] [PMC free article] [PubMed] [Google Scholar]
- 19.Ailshire J, Karraker A, Clarke P. 2017. Neighborhood social stressors, fine particulate matter air pollution, and cognitive function among older U.S. adults. Soc Sci Med 172:56–63, PMID: , 10.1016/j.socscimed.2016.11.019. [DOI] [PMC free article] [PubMed] [Google Scholar]
- 20.American Lung Association. 2019. State of the Air 2019. Chicago, IL: American Lung Association. http://scientificintegrityinstitute.org/ALASOTA042419.pdf [accessed 15 January 2023]. [Google Scholar]
- 21.Comert G, Darko S, Huynh N, Elijah B, Eloise Q. 2020. Evaluating the impact of traffic volume on air quality in South Carolina. Int J Transportation Sci Technol 9(1):29–41, 10.1016/j.ijtst.2019.05.008. [DOI] [Google Scholar]
- 22.Kaiser P, Diez Roux AV, Mujahid M, Carnethon M, Bertoni A, Adar SD, et al. 2016. Neighborhood environments and incident hypertension in the multi-ethnic study of atherosclerosis. Am J Epidemiol 183(11):988–997, PMID: , 10.1093/aje/kwv296. [DOI] [PMC free article] [PubMed] [Google Scholar]
- 23.Cummins S, Macintyre S. 2006. Food environments and obesity–neighbourhood or nation? Int J Epidemiol 35(1):100–104, PMID: , 10.1093/ije/dyi276. [DOI] [PubMed] [Google Scholar]
- 24.Paquet C, Coffee NT, Haren MT, Howard NJ, Adams RJ, Taylor AW, et al. 2014. Food environment, walkability, and public open spaces are associated with incident development of cardio-metabolic risk factors in a biomedical cohort. Health Place 28:173–176, PMID: , 10.1016/j.healthplace.2014.05.001. [DOI] [PubMed] [Google Scholar]
- 25.Livingston G, Sommerlad A, Orgeta V, Costafreda SG, Huntley J, Ames D, et al. 2017. Dementia prevention, intervention, and care. Lancet 390(10113):2673–2734, 10.1016/S0140-6736(17)31363-6. [DOI] [PubMed] [Google Scholar]
- 26.Aggarwal R, Chiu N, Wadhera RK, Moran AE, Raber I, Shen C, et al. 2021. Racial/ethnic disparities in hypertension prevalence, awareness, treatment, and control in the United States, 2013 to 2018. Hypertension 78(6):1719–1726, PMID: , 10.1161/HYPERTENSIONAHA.121.17570. [DOI] [PMC free article] [PubMed] [Google Scholar]
- 27.Wyatt SB, Winters KP, Dubbert PM. 2006. Overweight and obesity: prevalence, consequences, and causes of a growing public health problem. Am J Med Sci 331(4):166–174, PMID: , 10.1097/00000441-200604000-00002. [DOI] [PubMed] [Google Scholar]
- 28.Cheng YJ, Kanaya AM, Araneta MRG, Saydah SH, Kahn HS, Gregg EW, et al. 2019. Prevalence of diabetes by race and ethnicity in the United States, 2011–2016. JAMA 322(24):2389–2398, PMID: , 10.1001/jama.2019.19365. [DOI] [PMC free article] [PubMed] [Google Scholar]
- 29.Morland K, Wing S, Diez Roux A, Poole C. 2002. Neighborhood characteristics associated with the location of food stores and food service places. Am J Prev Med 22(1):23–29, PMID: , 10.1016/s0749-3797(01)00403-2. [DOI] [PubMed] [Google Scholar]
- 30.Jia J, Wang F, Wei C, Zhou A, Jia X, Li F, et al. 2014. The prevalence of dementia in urban and rural areas of China. Alzheimers Dement 10(1):1–9, PMID: , 10.1016/j.jalz.2013.01.012. [DOI] [PubMed] [Google Scholar]
- 31.Evans IEM, Martyr A, Collins R, Brayne C, Clare L. 2019. Social isolation and cognitive function in later life: a systematic review and meta-analysis. J Alzheimers Dis 70(s1):S119–S144, PMID: , 10.3233/JAD-180501. [DOI] [PMC free article] [PubMed] [Google Scholar]
- 32.Wang HX, Xu W, Pei JJ. 2012. Leisure activities, cognition and dementia. Biochim Biophys Acta 1822(3):482–491, PMID: , 10.1016/j.bbadis.2011.09.002. [DOI] [PubMed] [Google Scholar]
- 33.US Census Bureau. 2013. 2010 Census Urban and Rural Classification and Urban Area Criteria. Washington, DC: Economic Research Service, United States Department of Agriculture. [Google Scholar]
- 34.Eberth JM, Josey M, Trivedi T, Hibbert JD, Probst J. 2016. Colonoscopy Access and Utilization: Rural Disparities in the Carolinas, 2001–2010. Columbia, SC: South Carolina State Documents Depository. [Google Scholar]
- 35.Probst JC, Ajmal F. 2019. Social Determinants of Health among the Rural African American Population. Grand Forks, ND: Rural Health Research Gateway. [Google Scholar]
- 36.Rosso AL, Flatt JD, Carlson MC, Lovasi GS, Rosano C, Brown AF, et al. 2016. Neighborhood socioeconomic status and cognitive function in late life. Am J Epidemiol 183(12):1088–1097, PMID: , 10.1093/aje/kwv337. [DOI] [PMC free article] [PubMed] [Google Scholar]
- 37.Shih RA, Ghosh-Dastidar B, Margolis KL, Slaughter ME, Jewell A, Bird CE, et al. 2011. Neighborhood socioeconomic status and cognitive function in women. Am J Public Health 101(9):1721–1728, PMID: , 10.2105/AJPH.2011.300169. [DOI] [PMC free article] [PubMed] [Google Scholar]
- 38.Meyer OL, Mungas D, King J, Hinton L, Farias S, Reed B, et al. 2018. Neighborhood socioeconomic status and cognitive trajectories in a diverse longitudinal cohort. Clin Gerontol 41(1):82–93, PMID: , 10.1080/07317115.2017.1282911. [DOI] [PMC free article] [PubMed] [Google Scholar]
- 39.Richard L, Gauvin L, Kestens Y, Shatenstein B, Payette H, Daniel M, et al. 2013. Neighborhood resources and social participation among older adults: results from the VoisiNuage study. J Aging Health 25(2):296–318, PMID: , 10.1177/0898264312468487. [DOI] [PubMed] [Google Scholar]
- 40.Al Hazzouri AZ, Haan MN, Osypuk T, Abdou C, Hinton L, Aiello AE. 2011. Neighborhood socioeconomic context and cognitive decline among older Mexican Americans: results from the Sacramento area Latino study on aging. Am J Epidemiol 174(4):423–431, PMID: , 10.1093/aje/kwr095. [DOI] [PMC free article] [PubMed] [Google Scholar]
- 41.Bryson JE. 2023. Census TIGER/Line Shapefiles Technical Documentation. Washington DC: US Department of Commerce, Geography Division, United States Census Bureau. https://www.census.gov/programs-surveys/geography.html [accessed 9 April 2019]. [Google Scholar]
- 42.US Census Bureau. 2011. Summary File 1 Dataset. https://www.census.gov/data/datasets/2010/dec/summary-file-1.html [accessed 9 April 2019].
- 43.ACS Summary File Technical Documentation. 2015. 2014 ACS 1-year and 2010–2014 ACS 5-year Data Releases. American Community Survey Office. https://www2.census.gov/programs-surveys/acs/summary_file/2014/documentation/tech_docs/2014_SummaryFile_Tech_Doc.pdf [accessed 9 April 2019].
- 44.The Center for Air, Climate, and Energy Solutions. https://www.caces.us/ [accessed 9 April 2019].
- 45.US Census Bureau. 2012. County Business Patterns: 2010. 2010. https://www.census.gov/data/datasets/2010/econ/cbp/2010-cbp.html [accessed 9 April 2019].
- 46.Dartmouth Atlas Project. The Dartmouth Atlas of Health Care. https://www.dartmouthatlas.org/ [accessed 9 April 2019].
- 47.Economic Research Service (ERS), U.S. Department of Agriculture (USDA). 2023. Food Environment Atlas. https://www.ers.usda.gov/data-products/food-environment-atlas/ [accessed 8 March 2023].
- 48.Google. 2024. Overview: What is Geocoding? Mountainview, CA: Google Maps Platform. https://developers.google.com/maps/documentation/geocoding/overview [accessed 8 March 2023]. [Google Scholar]
- 49.Dinn A. 2023. HUD USPS Zip Code Crosswalk Files. Washington, DC: Office of Policy Development and Research. https://www.huduser.gov/portal/datasets/usps_crosswalk.html [accessed 2 February 2021]. [Google Scholar]
- 50.Spaulding A, Stallings-Smith S, Hamadi H, Park S, Niazi S, Apatu E. 2019. A community health case for psychiatric care: a cross-sectional study of county health rankings. Gen Hosp Psychiatry 57:1–6, PMID: , 10.1016/j.genhosppsych.2018.10.009. [DOI] [PubMed] [Google Scholar]
- 51.Toprani A, Hadler J. 2013. Selecting and Applying a Standard Area Based Socioeconomic Status Measure for Public Health Data: Analysis for New York City. Long Island City, NY: New York City Department of Health and Mental Hygiene. [Google Scholar]
- 52.Agresti A. 2003. Categorical Data Analysis Second Edition. Hoboken, NJ: John Wiley and Sons, Inc. [Google Scholar]
- 53.Lindgren F, Rue H, Lindström J. 2011. An explicit link between Gaussian fields and Gaussian Markov random fields: the stochastic partial differential equation approach. J R Statist Soc B 73(4):423–498, 10.1111/j.1467-9868.2011.00777.x. [DOI] [Google Scholar]
- 54.Rue H, Martino S, Chopin N. 2009. Approximate Bayesian inference for latent Gaussian models by using integrated nested Laplace approximations. J R Statist Soc B 71(2):319–392, 10.1111/j.1467-9868.2008.00700.x. [DOI] [Google Scholar]
- 55.Martins T, Simpson D, Lindgren F, Rue H. 2013. Bayesian computing with INLA new features. Comput Stat Data Analysis 67:68–83, 10.1016/j.csda.2013.04.014. [DOI] [Google Scholar]
- 56.Lombardo L, Opitz T, Huser R. 2019. Numerical recipes for landslide spatial prediction using R-INLA. In: Spatial Modeling in GIS and R for Earth and Environmental Sciences. Pourghasemi HR, Gokceoglu C, eds. Amsterdam, The Netherlands: Elsevier, 55–83. [Google Scholar]
- 57.Berr C, Gutierrez LA, Artero S, Helmer C, Dartigues J-F, Tzourio C, et al. 2015. Community environment and incident dementia: results from the three-city study. Alzheimer’s Dement 11(3):P150–P151, 10.1016/j.jalz.2015.07.078. [DOI] [Google Scholar]
- 58.Hunt JFV, Buckingham W, Kim AJ, Oh J, Vogt NM, Jonaitis EM, et al. 2020. Association of neighborhood-level disadvantage with cerebral and hippocampal volume. JAMA Neurol 77(4):451–460, PMID: , 10.1001/jamaneurol.2019.4501. [DOI] [PMC free article] [PubMed] [Google Scholar]
- 59.Livingston G, Huntley J, Sommerlad A, Ames D, Ballard C, Banerjee S, et al. 2020. Dementia prevention, intervention, and care: 2020 report of the Lancet commission. Lancet 396(10248):413–446, PMID: , 10.1016/S0140-6736(20)30367-6. [DOI] [PMC free article] [PubMed] [Google Scholar]
- 60.Shi L, Steenland K, Li H, Liu P, Zhang Y, Lyles RH, et al. 2021. A national cohort study (2000–2018) of long-term air pollution exposure and incident dementia in older adults in the United States. Nat Commun 12(1):6754, PMID: , 10.1038/s41467-021-27049-2. [DOI] [PMC free article] [PubMed] [Google Scholar]
- 61.Shi L, Zhu Q, Wang Y, Hao H, Zhang H, Schwartz J, et al. 2023. Incident dementia and long-term exposure to constituents of fine particle air pollution: a national cohort study in the United States. Proc Natl Acad Sci USA 120(1):e2211282119, PMID: , 10.1073/pnas.2211282119. [DOI] [PMC free article] [PubMed] [Google Scholar]
- 62.Hajat A, Park C, Adam C, Fitzpatrick AL, Ilango SD, Leary C, et al. 2023. Air pollution and plasma amyloid beta in a cohort of older adults: evidence from the ginkgo evaluation of memory study. Environ Int 172:107800, PMID: , 10.1016/j.envint.2023.107800. [DOI] [PMC free article] [PubMed] [Google Scholar]
- 63.Kirby JB, Kaneda T. 2005. Neighborhood socioeconomic disadvantage and access to health care. J Health Soc Behav 46(1):15–31, PMID: , 10.1177/002214650504600103. [DOI] [PubMed] [Google Scholar]
- 64.Jiang HJ, Begun JW. 2002. Dynamics of change in local physician supply: an ecological perspective. Soc Sci Med 54(10):1525–1541, PMID: , 10.1016/s0277-9536(01)00132-0. [DOI] [PubMed] [Google Scholar]
- 65.Vogel N, Ram N, Goebel J, Wagner GG, Gerstorf D. 2018. How does availability of county-level healthcare services shape terminal decline in well-being? Eur J Ageing 15(2):111–122, PMID: , 10.1007/s10433-017-0425-4. [DOI] [PMC free article] [PubMed] [Google Scholar]
- 66.Abner EL, Jicha GA, Christian WJ, Schreurs BG. 2016. Rural-urban differences in Alzheimer’s disease and related disorders diagnostic prevalence in Kentucky and West Virginia. J Rural Health 32(3):314–320, PMID: , 10.1111/jrh.12155. [DOI] [PMC free article] [PubMed] [Google Scholar]
- 67.Zhao Q, Zhou B, Ding D, Guo Q, Hong Z. 2010. Prevalence, mortality, and predictive factors on survival of dementia in Shanghai China. Alzheimer Dis Assoc Disord 24(2):151–158, PMID: , 10.1097/WAD.0b013e3181ca0929. [DOI] [PubMed] [Google Scholar]
- 68.Hung P, Deng S, Zahnd WE, Adams SA, Olatosi B, Crouch EL, et al. 2020. Geographic disparities in residential proximity to colorectal and cervical cancer care providers. Cancer 126(5):1068–1076, PMID: , 10.1002/cncr.32594. [DOI] [PubMed] [Google Scholar]
- 69.Chen X, Lee C, Huang H. 2022. Neighborhood built environment associated with cognition and dementia risk among older adults: a systematic literature review. Soc Sci Med 292:114560, PMID: , 10.1016/j.socscimed.2021.114560. [DOI] [PubMed] [Google Scholar]
- 70.Henkel PJ, Marvanova M. 2018. Rural disparities in Alzheimer’s disease-related community pharmacy care in the United States. J Rural Health 34(4):347–358, PMID: , 10.1111/jrh.12279. [DOI] [PubMed] [Google Scholar]
- 71.Meyer OL, Sisco SM, Harvey D, Zahodne LB, Glymour MM, Manly JJ, et al. 2017. Neighborhood predictors of cognitive training outcomes and trajectories in ACTIVE. Res Aging 39(3):443–467, PMID: , 10.1177/0164027515618242. [DOI] [PMC free article] [PubMed] [Google Scholar]
- 72.Rosso AL, Auchincloss AH, Michael YL. 2011. The urban built environment and mobility in older adults: a comprehensive review. J Aging Res 2011:816106, PMID: , 10.4061/2011/816106. [DOI] [PMC free article] [PubMed] [Google Scholar]
- 73.Sampson RJ. 1998. Local friendship ties and community attachment in mass society: a multilevel systemic model. American Sociological Review 53(5):766–779, 10.2307/2095822. [DOI] [Google Scholar]
- 74.Sperling RA, Aisen PS, Beckett LA, Bennett DA, Craft S, Fagan AM, et al. 2011. Toward defining the preclinical stages of Alzheimer’s disease: recommendations from the national institute on aging-Alzheimer’s association workgroups on diagnostic guidelines for Alzheimer’s disease. Alzheimers Dement 7(3):280–292, PMID: , 10.1016/j.jalz.2011.03.003. [DOI] [PMC free article] [PubMed] [Google Scholar]
- 75.Vernooij-Dassen MJFJ, Moniz-Cook ED, Woods RT, De Lepeleire J, Leuschner A, Zanetti O, et al. 2005. Factors affecting timely recognition and diagnosis of dementia across Europe: from awareness to stigma. Int J Geriatr Psychiatry 20(4):377–386, PMID: , 10.1002/gps.1302. [DOI] [PubMed] [Google Scholar]
- 76.Rewerska-Juśko M, Rejdak K. 2020. Social stigma of people with dementia. J Alzheimers Dis 78(4):1339–1343, PMID: , 10.3233/JAD-201004. [DOI] [PubMed] [Google Scholar]
- 77.Wilson R, Din A. 2018. Understanding and enhancing the US department of housing and urban development’s ZIP code crosswalk files. Spat Anal Methods 20(2):277–294. [Google Scholar]
- 78.Krieger N, Chen JT, Waterman PD, Soobader MJ, Subramanian SV, Carson R. 2002. Geocoding and monitoring of US socioeconomic inequalities in mortality and cancer incidence: does the choice of area-based measure and geographic level matter?: the public health disparities geocoding project. Am J Epidemiol 156(5):471–482, PMID: , 10.1093/aje/kwf068. [DOI] [PubMed] [Google Scholar]
Associated Data
This section collects any data citations, data availability statements, or supplementary materials included in this article.