

Abstract
MicroRNAs (miRNAs) are involved in post-transcriptional gene expression regulation and in mechanisms of cancer growth and metastases. In this light, miRNAs could be promising therapeutic targets and biomarkers in clinical practice. Therefore, we investigated if specific miRNAs and their target genes contribute to laryngeal squamous cell carcinoma (LSCC) development. We found a significant decrease of miR-449a in LSCC patients with nodal metastases (63.3%) compared with patients without nodal involvement (44%). The AmpliSeq Transcriptome of HNO-210 miR-449a-transfected cell lines allowed the identification of IL6-R as a potential target. Moreover, the downregulation of IL6-R and the phosphorylation reduction of the downstream signaling effectors, suggested the inhibition of the IL-6 trans-signaling pathway. These biochemical effects were paralleled by a significant inhibition of invasion and migration in vitro and in vivo, supporting an involvement of epithelial-mesenchymal transition. These findings indicate that miR-449a contributes to suppress the metastasization of LSCC by the IL-6 trans-signaling block and affects sensitivity to external stimuli that mimic pro-inflammatory conditions.
Keywords: MT: non-coding RNAs, microRNAs, gene expression, LSCC, metastases miR-449a, IL-6 trans-signaling
Graphical abstract
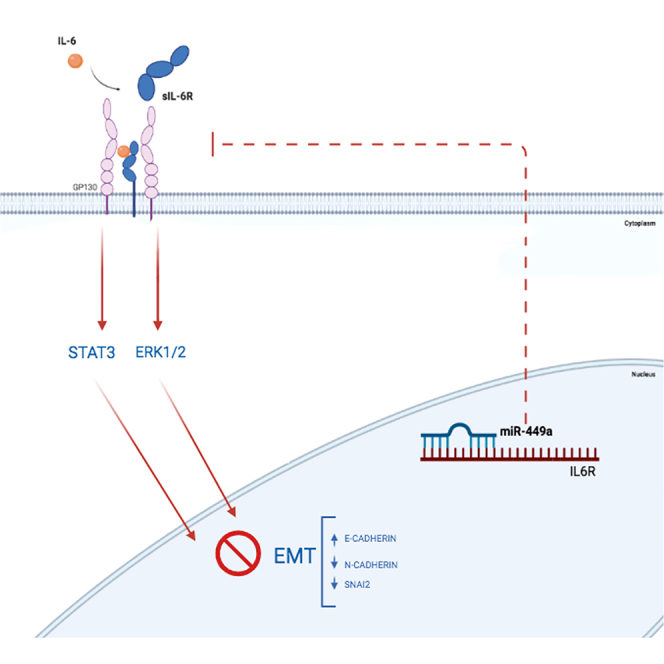
Cossu and colleagues investigated the role of miR-449a (downregulated in LSCC N+) and its target gene IL-6R. Mir-449a replacement in HNO-210 cell was able to suppress metastasis by blocking IL-6 trans-signaling. These findings were supported by significant inhibition of invasion and migration, in vitro and in vivo.
Introduction
Laryngeal carcinoma accounts for one-third of all HNCs, and for approximately 1%–2% of all malignancies. There are many risk factors for the occurrence of laryngeal squamous cell carcinoma (LSCC).1,2 As LSCC results from the uncontrolled proliferation of a squamous cell on the surface of the laryngeal epithelium,3 delays in diagnosing are strongly related to poor prognosis. Treatment often requires a multidisciplinary approach based on radiation, chemotherapy, chemoradiotherapy, and, more recently, targeted and immunological therapies.4 Cervical lymph nodes5 are early sites of LSCC metastases and often determine a change of the survival expectations being6 a crucial prognostic factor. Unluckily, the early detection of nodal micrometastases is not allowed by standard imaging, thus determining detrimental effects on the choice of the correct therapeutic strategies and on the clinical outcome of the patients. To overcome this important limitation, the discovery of new biomarker candidates is crucial for the definition of the disease extension and the mechanisms driving the development and metastasization of LSCC.7,8,9 In this regard, the detection of suitable biomarkers might be supportive for identifying personalized treatments and microRNAs (miRNAs) seem to be promising diagnostic and prognostic biomarkers. miRNAs are small evolutionarily conserved non-coding RNAs modulating gene expression at the post-transcriptional level by either inhibiting mRNA translation or decreasing their half-life. MiRNAs regulate many genes involved in signal transduction pathways,10 and their deregulation has been associated with cancer development and chemoresistance,11 showing either an oncogenic or a oncosuppressor role depending on their targets.6 Mir-449a belongs to a family of miRNAs with high homology sequence to the miR-34 family, with well consolidated anti-oncogenic functions.12 In fact, it has been reported to inhibit cell proliferation in various cancers, including breast,13 liver,14 gastric,15 and lung cancer16 by targeting a broad range of molecules involved in cell-cycle regulation and apoptosis. In several reports, miR-449a demonstrated its potential role in the regulation of several signaling pathways.17,18,19,20,21,22,23 In our previous report, we found miR-449a downregulation in LSCC tissues, which predicts the occurrence of nodal metastases.19 Taking this into account, in this study the biological role of miR-449a in LSCC cell models was analyzed. In detail, we proposed a mechanism by which miR-449a inhibited the downstream IL-6trans-signaling activation, also counteracting its stimulation by Hyper IL-6, overcoming endogenous buffering (sgp130),24 and blocking with sgp130fc molecules.
Results
Correlation of miR-449a tissue expression levels with LSCC lymph node involvement status
We have previously and preliminarily reported miR-449a downregulation in laryngeal cancer tissues from patients with nodal metastases.19 We have validated these data on a larger cohort of patients (n = 132: 60 N+ LSCC patients (with lymph node metastases) and 72 N– LSCC patients (without lymph node metastases). Analysis performed by qRT-PCR, revealed a statistically significant down-regulation of miR-449a expression in patients with lymph node metastases (chi square test, p = 0.030) (Figure 1).
Figure 1.

Downregulation of miR-449a was associated with nodal involvement in LSCC
Validation of miR-449a expression in primary cancer tissues from patients with LSCC with N+ lymph node involvement (n = 60) and without N– lymph node involvement (n = 72) by qRT-PCR (chi square test p = 0.030).
miRNA profiling of miR-449a on LSCC cell lines
We evaluated miR-449a endogenous expression levels in three squamous laryngeal and hypopharyngeal carcinoma cell lines by qRT-PCR: FaDu, UPCI:SCC-152, HNO-210 compared with human hypopharyngeal normal primary cells as a normal counterpart. We observed (Figure 2A) high basal miR-449a expression in FaDu cell lines and low basal miR-449a expression in HNO-210 cell models. Based on qRT-PCR data, we selected HNO-210 and FaDu cells for the subsequent experiments, because they showed low and high miR-449a expression levels, respectively. Constructed third-generation lentiviral vectors containing miR-449a inhibitor, miR-449a mimic, and empty-backbone (negative control sequence) were transfected in HNO-210 and FaDu cell lines (as described in Materials and methods). The over-expression of miR-449a in our selected cell models was assessed by qRT-PCR and miR-449a replacement occurred in both HNO-210 (15-fold higher than parental counterpart) (Figure 2B) and FaDu (20-fold higher than parental counterpart) cell lines (Figure 2C).
Figure 2.

Expression profile of miR-449a in LSCC cell lines
(A) Relative basal miR-449a expression levels (mean ± SD) in FaDu, UPCI:SCC152,HNO-210 cell lines vs. human hypopharyngeal normal cell. (B) miR-449a relative expression levels in HNO-210 cells. (C) miR-449a relative expression levels in FaDu cells. Each data point was obtained in triplicate and data are shown as mean ± SD (Student’s t test) ∗p < 0.05, ∗∗∗p < 0.001.
Expression profile and functional analysis of differentially expressed genes in HNO-210 transduced cells
Since our focus is cancer originating from the larynx, we selected miR-449a transduced HNO-210 cells to perform a transcriptional analysis, as they come from a laryngeal squamous carcinoma. Principal component analysis (PCA) of the AmpliSeq Transcriptome data suggested that replicates of each experimental group (empty-backbone, inhibitor, and miR-449a) clustered closely with each other, showing a good quality of the sequencing (Figure 3A). From data obtained after sequencing, using the DESeq2 method, we identified 217 upregulated and 126 downregulated genes comparing miR-449a and empty-backbone transduced cells (Table S1). As expected, minor transcript differences were found comparing miR-449a inhibitor with empty-backbone transduced cells (35 upregulated and 1 downregulated genes) (Table S2). In miR-449a transduced cells, among numerous differentially expressed genes (DEGs) we identified two statistically significantly decreased genes (Student’s t test, p ≤ 0.05) involved in tumor development mechanisms: IL-6R (involved in immune response and cell migration) and SNAI2 (involved in the regulation of cell-cell adhesion), shown in volcano plot representation (Figure 3B). Gene Ontology (GO) enrichment analysis for biological processes (BP) was performed to evaluate the function of regulated genes in comparisons between miR-449a and empty-backbone. Figure 3D showed the dotplot of significantly enriched (p < 0.01) and selected GO categories by over-representation analysis for down-regulated genes from comparison between miR-449a and empty-backbone (Table S3), confirming the implications of miR-449a in several BPs related to the immune response, IL-6 production and the JAK-STAT cascade. Furthermore, through evaluation of global gene expression changes by Gene Set Enrichment Analysis (GSEA), we assessed the expression changes of all detectable genes for the enrichment of specific gene sets in the comparison between miR-449a versus empty-backbone (Table S4). We created an enrichment map graph on GSEA analysis (Figure 3E). The top 30 most enriched categories based on NES (Normalized Enrichment Score) value and the bottom 30 least enriched categories were selected. AmpliSeq transcriptome results confirmed a differential expression of genes involved in immune pathways, among these, we selected interleukin-6 receptor (IL-6R) as the first target gene of interest to investigate.
Figure 3.

miR-449a genes modulation in HNO-210 transduced cells
(A) PCA of the AmpliSeq Transcriptome data. (B) Volcano plot shows the comparison between HNO-210 cells over-expressing miR-449a and the empty-backbone. (C) Boxplot of log2 expression for IL-6R and SNAI2 (p value of Student's test). The y axis represents log10 (false discovery rate [FDR]), while the x axis represents log2 HR. (D) Dotplot of enriched GO:BP categories selected for genes down-regulated by miR-449a compared with the empty-backbone. Dot sizes represent the number of downregulated genes associated with the GO term and dot colors represent the p value from the over-represented Fisher’ test. (E) Map of enrichment from GSEA in the comparison between miR-449a and empty-backbone. The sizes of the dots represent the number of major genes and the colors of the dots represent the normalized enrichment score (NES).
miR-449a suppresses tumor metastasis in vitro and in vivo via epithelial-mesenchymal transition
AmpliSeq transcriptome analysis in HNO-210 cells overexpressing miR-449a revealed a down-regulation of SNAI2; due to this, we decided to assess the anti-metastatic effects of miR-449a. Using transwell assays, we explored the property of miR-449a to inhibit cell migration and invasion in our cell models (HNO-210 and FaDu cell lines). Our results showed a significant inhibition of cell migration and invasive capabilities in both HNO-210 (−50% migrated cells) and FaDu cells (−30% migrated cells, −50% invaded cells) stably over-expressing miR-449a compared with the empty-backbone after 24 h (Figure 4A). In addition, to verify the effect of miR-449a in HNO-210 cells on epithelial-mesenchymal transition (EMT), we evaluated the expression of the principal key EMT markers. Our data confirmed up-regulation of E-cadherin expression and down-regulation of N-cadherin genes in miR-449a cell line by both immunofluorescence assay and qRT-PCR suggesting a reduction of EMT (Figures 4B and 4C). In addition, in miR-449a experimental model we found a statistically significant decrease of Vimentin and especially a strong reduction of SNAI2 expression level confirming the data obtained from transcriptional analysis (Figure 4C). These findings suggested a miR-449a-induced perturbation of EMT in inhibiting metastatic properties confirmed by xenografts in zebrafish larvae. In details, HNO-210 cells from the two different experimental groups (HNO-210 empty-backbone and HNO-210 miR-449a) were labeled with a red dye and engrafted in 2 day-old transgenic zebrafish larvae with green fluorescent vessels (approximately 200 cells/larvae were injected). 24 hours post injection (hpi), the cells were able to migrate in the head and tail regions of both experimental groups with no statistical differences between empty-backbone and miR-449a (Figure 4D, panel a, b). Interestingly at 72 hpi, the overexpression of miR-449a correlates with a statistically significant decrease in the invasiveness and metastatic potential of cancer cells, both in the head and tail, compared with empty-backbone (Figure 4D, panel c, d). Thus, miR-449a overexpression seems to play an important role in modulating invasive features also in the in vivo model.
Figure 4.

miR-449a leads to decrease invasion and migration in vitro and in vivo and downregulates SNAI2, N-cadherin, and Vimentin expression levels
(A) Graphs representing the effect of miR-449a expression on cell migration and invasion of HNO-210 and FaDu cells using the transwell assay (left graph panel: HNO-210; right graph panel: FaDu). The data were presented as means ± SD from three biological replicates. ∗p < 0.05; ∗∗p < 0.001; ∗∗∗p < 0.0005; ∗∗∗∗p < 0.0001; Student’s t test. (B) Immunofluorescence localization of E-cadherin and N-cadherin antibodies in HNO-210 cell line overexpressing miR-449a. (C) Relative expression levels of SNAI2, E-cadherin, N-cadherin and Vimentin by qRT-PCR HNO-210 transduced cells. A technical and experimental triplicate was carried out ∗p < 0.05; ∗∗p < 0.001; ∗∗∗p < 0.0005; ∗∗∗∗p < 0.0001; Student’s t test. (D) Transduced cells: HNO-210-empty-backbone and HNO-210-miR-449a cells were injected into the perivitelline space (PVS) of 48 h post fertilization (hpf) Tg (fli1:EGFP) zebrafish larvae. BV, blood vessels. Cells were fluorescently labeled with the CM-Dil cell tracker and the zebrafish tumor xenograft was analyzed at 24 and 72 hpi. The number of metastases was analyzed in the head and tail of the animals. Metastatic tumor cells are indicated in zebrafish with white arrows (left). Boxplots represent the number of metastatic larynx cancer cells in the head and tail of zebrafish Tg (fli1:eGFP) larvae at 24 and 72 hpi N, the number of larvae with metastases (≥2 in any position) divided by the total number of larvae analyzed (N = met/total). Scale bars, 100 μm. The p value was calculated from the linear longitudinal-log Poisson model (right). The results come from two independent experiments. All data are representative of three independent experiments.
miR-449a regulates IL-6R gene expression through IL-6-mediated trans-signaling in an HNO-210 transduced cell line
Based on the data obtained from the AmpliSeq Transcriptome analysis to verify if IL-6R is a target of miR-449a, a target prediction method was employed to assess whether miR-449a could bind the 3′ UTR promoter of IL-6R.25,26 The results of the in silico analysis confirmed the possible binding of miR-449a with 3′ UTR of IL-6R gene with prediction of seed sequences (as reported in Materials and methods). Luciferase reporter assay showed that miR-449a induced an approximately 45% reduction of WT-IL6R-driven luciferase activity. However, as expected, the mutated 3′ UTR sequence did not induce any significant change in luciferase activity (Figure 5A). Ago2 RNA immunoprecipitation (RIP) showed an increase of IL-6R transcript enrichment in miR-449a overexpressing HNO-210 cells. We also confirmed the enrichment of miR-449a in Ago2 immunoprecipitation compared with control (irrelevant IgG) in the same cell model (Figure 5B). Considering the above results, we questioned whether miR-449a can also regulate the expression levels of soluble IL-6R (sIL-6R) involved in IL6 trans-signaling pathway that, in turn, induces inflammatory effects, giving an aggressive phenotype to tumors. We have evaluated the production of soluble IL-6R (sIL-6R) and IL-6 by ELISA and by qRT-PCR in our experimental model. The results obtained by ELISA and qRT-PCR showed a significant reduction of sIL-6R expression at both protein (p = 0.018) and mRNA (p < 0.0001) levels (Figure 5C, left and the last panel). Moreover, ELISA showed a reduction of IL-6 levels (p = 0.0001) induced by miR-449a (Figure 5C, right). The results indicated the potential inhibition of IL-6 trans-signaling triggered by miR-449a. Nevertheless, when the buffering system, represented by sIL-6R occupation by sgp130, becomes overburdened, trans-signaling is activated. To simulate this condition, we stimulated our cell model with Hyper IL-6, which modulates IL-6 signaling independent of the membrane-bound IL-6R. The results demonstrated a notable decrease in the activation of the trans-signaling downstream pathway components pSTAT3 (Tyr705) (−64%) and pERK (Thr202; Tyr204) (−82%), due to changes in the endogenous activation and buffering system, in miR-449a overexpressing cell models. In the second experimental condition, the pre-treatment of blocking system (sgp130fc) was performed and we observed no modifications of STAT3 activation in miR-449a overexpressing and empty-backbone cell models, indicating the successful and complete endogenous blockade of IL-6 trans-signaling. In the third experimental condition, where a block of IL-6 trans-signaling (sgp130fc pretreatment) was followed by stimulation with Hyper IL-6, we observed no changes of the activation of the downstream IL-6 receptor pathway components. This outcome indicates that the reduction of the activation of the downstream IL-6R pathway is almost exclusively due to the upstream effect caused by the downregulation of the sIL-6R receptor mediated by miR-449a (Figure 5D). The IL-6R trans-signaling is involved in the regulation of EMT and metastases occurrence.27 As we have found that miR-449a low levels in cancer tissues were associated with nodal metastases in laryngeal cancer patients, we confirmed the role of miR-449a in the deregulation of EMT induced by IL-6 trans-signaling. In fact, we have found a significant downregulation of SNAI2 and N-cadherin expression after Hyper IL-6 stimulation (Figure 5E).
Figure 5.

miR-449a directly targets IL-6R and switches off IL-6 trans-signaling
(A) The putative miR-449a binding sites in IL-6R were predicted using online bioinformatics tools. The interaction between miR-449a and IL-6R was verified using a dual luciferase reporter assay. ∗p < 0.05; ∗∗p < 0.001; ∗∗∗p < 0.0005; ∗∗∗∗p < 0.0001 Student’s t test vs. control group. Each experiment was repeated three times. Bars indicate SDs. (B) RIP assay of the enrichment of Ago2 on IL-6R and miR-449a transcripts normalized to a negative control irrelevant IgG antibody (CTR) in HNO-210 cell line overexpressing miR-449a. (C) Levels of sIL-6R and IL-6R in HNO-210 cell culture medium by quantitative ELISA (left and right) and expression levels of sIL-6R in HNO-210 cells by qRT-PCR (last panel). The experiments were repeated three times in triplicate. Bars, SDs. (D) Western blots analysis of transduced HNO-210 cell models in different experimental conditions: (i) 0.1% serum starvation, (ii) Hyper IL-6 stimulation (20 ng/mL for 30 min), (iii) sgp130fc treatment (1,000 ng/mL for 1 h), and sgp130fc pretreatment followed by Hyper IL-6 stimulation. miR-449a modulation of IL-6 trans-signaling mediated by pStat3 Tyr705 – pERK (Thr202; Tyr204)—pAKT Ser473. Vinculin was used as loading control. The experiments were repeated at least three times giving always similar results. Columns represent the intensity of the different bands evaluated as arbitrary units. Bars are SDs. ANOVA ∗p < 0.01; ∗∗p < 0.05; ∗∗∗p < 0.005; ∗∗∗∗p < 0.0001. (E) Relative expression levels of SNAI2, E-cadherin, and N-cadherin of transduced HNO-210 cell models in different experimental conditions: (i) 0.1% serum starvation, (ii) Hyper IL-6 stimulation (20 ng/mL for 30 min), (iii) sgp130fc treatment (1,000 ng/mL for 1 h) and sgp130fc pretreatment followed by Hyper IL-6 stimulation. ANOVA ∗<0.01 ∗∗p < 0.05; ∗∗∗p < 0.005; ∗∗∗∗p < 0.0001. All data are representative of three independent experiments.
Discussion
miRNAs play key roles in almost all cell activities. In the present report, we investigated the role of miR-449a in the invasive properties of LSCC. The need to investigate the role of miRNAs in LSCC arises from the evidence that its diagnosis often occurs in a late phase, when nodal micrometastases are already established, with consequent downsized treatment and consequent poor prognosis. Seeking to address this urgent need, we have previously evaluated a low-density array of miRNAs in primary tumor tissues collected from LSCC patients with or without nodal metastases, and we found a correlation between decreased miR-449a expression and the occurrence of nodal metastases.19 Many studies have reported miR-449a involvement in cancer development, depicting a role as both a potential prognostic indicator and a therapeutic target for the treatment of different types of cancer.28 To understand the prognostic and therapeutic role of miR-449a, we validated miR-449a levels in a wide cohort of primary cancer LSCC tissues. Our study revealed a significant down-regulation of miR-449a in N+ tissues compared with the N– counterparts. Through molecular biology approaches, we demonstrate IL-6R as a target of miR-449a. These data were paralleled by the inhibition of invasion and motility of LSCC cell lines in vitro that was also confirmed in vivo in a metastatic model of zebrafish. Subsequent functional assays provided evidence of inhibition of the EMT in LSCC cell lines. In contrast, the strong impact of EMT on the development of nodal metastases from head and neck squamous cell carcinoma (HNSCC) has been demonstrated.29 Our transcriptomic results showed a strong down-regulation of SNAI2 gene. Therefore, we hypothesized that miR-449a was closely involved in the molecular mechanism of EMT. These results were confirmed by qRT-PCR and were paralleled by a significant increase in E-cadherin and decrease in N-cadherin, markers of EMT and a weak but significant decrease of Vimentin mRNA expression. Another important process involved in tumor development and metastases is inflammation, which is also strongly related to EMT. Indeed, during tumorigenesis, cells of the bone marrow linked to the innate immune system begin to produce a series of cytokines and chemokines in response to tumor-induced damage.27 Among the inflammatory tumor-promoting mediators, IL-6, a pro-inflammatory cytokine, is an indicator of poor prognosis in cancer patients. Recently, the role of EMT in regulating the metastatic cascade has been reported, encompassing the properties of invasion, migration, intravasation, and metastasis.30 The correlation between IL-6 and EMT signaling pathway has been established in breast cancer, lung carcinoma and colorectal cancers.31,32 Induction of EMT in cancer cell lines has been shown to induce the expression of IL-6 at levels more similar to SNAIL1 in oral keratinocytes.33,34 Conversely, IL-6 has been found to induce EMT in several tumors, particularly in HNSCC cells.35,36,37,38 IL-6 is produced both by cancer cells (especially following Ras or p53 mutations) and reactive stromal cells,27 and promotes both local and systemic inflammation. The dual role of IL-6 in the management of the inflammatory response is known. In fact, IL-6 has anti-inflammatory and protective properties mediating the immune response in the acute phase and leading to intestinal epithelial proliferation and tissue regeneration via the membrane-bound IL-6R (classical signaling). However, IL-6 is associated with the transition from acute to chronic immune responses and sustains several inflammatory and autoimmune diseases via the sIL-6R (trans-signaling).39 sIL-6R is generated by alternative splicing and proteolytic cleavage starting from the transmembrane IL-6R of specific cellular subsets,40 including leukocytes and neutrophils.41,42,43 The mechanism of action of sIL-6R isoform revolves around gp130, a non-binding receptor subunit which restores sensitivity to IL-6 in cells without membrane IL-6R.44 IL-6 trans-signaling presents a greater and longer lasting signal amplification of response to IL-6 stimuli24 and is also associated with immunological stress, chronic inflammation, and cancer. Indeed, blockade of IL-6 trans-signaling represents a promising therapeutic strategy in several diseases such as inflammatory bowel diseases,45 colon cancer,46 renal fibrosis, rheumatoid arthritis,47 and atherosclerosis. To better investigate IL-6 trans-signaling activation and modulation, it is possible to use last-generation molecules such as Hyper IL-6 and sgp130fc which can selectively activate or inhibit IL-6 trans-signaling pathways, respectively. Hyper IL-6 represents a powerful biological tool that activates trans-signaling without interfering with the classical signaling mediated by the interaction between IL-6 and its membrane receptor. Structurally, Hyper IL-6 is a fusion protein in which sIL-6R is linked by a 13-amino-acid flexible linker to IL-6, thereby forming a ligand/receptor interaction complex.48 Taking advantage of the antagonistic properties of wild-type sgp130fc on IL-6 trans-signaling,49 we used sgp130fc in which the extracellular portion of gp130 is fused to the fc portion of a human IgG1 antibody. Sgp130fc neutralizes IL-6/sIL-6R complex by inhibiting the activation of trans-signaling sparing the IL-6 classical signaling. IL-6 and sIL-6R alone cannot bind gp130, and the binding of natural sgp130 to membrane IL-6/IL-6R complexes occurs only in the absence of cell surface gp130.24 This allows the selectivity of the trans-signaling block. Moreover, some studies suggest that gp130 colocalizes and complexes with membrane IL-6R, thus preventing sgp130Fc access and the consequent inhibition of IL-6 classic signaling.48 Several studies have demonstrated that various signaling cascade pathways are activated in response to the interaction between IL-6 and sIL-6R including the JAK/STAT3, MEK/ERK, and PI3K/AKT pathways.50,51 Our data showed the effects of miR-449a in mediating a down-regulation of IL-6R by preventing STAT3 activation. Thereafter, we have evaluated if miR-449a was able to block the IL-6 trans-signaling pathway induced by sIL-6R production. Therefore, to verify this effect we performed a block of trans-signaling using the inhibitor sgp130fc (olamkicept) with or without Hyper IL-6 (IL-6-sIL-6R) in miR-449a-transduced HNO-210 cells. We confirmed that miR-449a has a strong effect in blocking the activation of all the targets of IL-6-induced trans-signaling. In terms of future clinical perspectives, we could suggest the evaluation of IL-6 trans signaling as a novel therapeutic target for the prevention of the metastatic state of LSCC tumors. These results proposed the potential use of miR-449a as both a strong predictive marker of nodal metastases in LSSC patients and as a potential target for therapeutic approaches in patients with LSCC affected by lymph node metastases.
Materials and methods
Clinical samples
All LSCC tissue samples were recruited at the Otolaryngology Division of the University of Naples “Federico II," University of Campania “L. Vanvitelli," AORN Hospital “Antonio Cardarelli” and Casa Sollievo della Sofferenza of S. Giovanni Rotondo. Sixty tissues from LSCC patients with lymph node metastases status (N+) and seventy two from LSCC patients without lymph node metastases status (N–) were enrolled in the screening set. All participants signed an individual consent form for participation in the study. For analysis, LSCC tissue samples (approximately 50 mg) were collected from primary lesions and surgical margins (2 cm). Macroscopically unchanged LSCC tissues were collected as a control group. The resected primary tumors were post-operatively subjected to the histopathological analysis. All samples were stored in RNAlater (Ambion, Life Technologies, Carlsbad, CA) and were kept at −80°C until RNA extraction.
Cell culture and in vitro transfection of LSCC cells
LSCC cell lines were purchased from CLS Cell Lines Service (Eppelheim, Germany) and ATCC. The HNO-210 cell line was grown in DMEM (MICROGEM DMEM Cat# AL066A), while the Human hypopharyngeal normal primary cell culture (CELPROGEN, Cat# 36074-04) cells were grown in human hypopharyngeal normal primary cell culture media (CELPROGEN, Cat# M36074-04). UPCI-SCC152 and FaDu lines were grown in Minimum Essential Media (MEM) (ATTC Cat# 30–2003). Cell line culture media were supplemented with 10% fetal bovine serum (FBS) (MICROGEM, Naples, Italy), 50 U/mL penicillin, 500 mg/mL streptomycin, and 4 mM glutamine (Gibco, Life Technologies, Carlsbad, CA) in a humidified atmosphere with 5% CO2 at 37°C. HNO-210 and FaDu tumor cells were seeded at a density of 4.0 × 10⁵ cells per well and treated with Lenti-III-mir-Off Control Virus, as an empty-backbone negative control, LentimiRa-Off-hsa-miR-449a Virus (antagomiR or inhibitor), and LentimiR-GFP-hsa-miR-449a (Applied Biological Materials Inc, abm, BC, Canada) at a multiplicity of infection of 10. Polybrene at a concentration of 4 μg/mL was used in growth media for each cell line to facilitate infection. After 24 h of incubation, the infection medium was removed and replaced with a complete growth medium for each cell line. Puromycin (Invitrogen, Waltham, MA) was then added to each complete cell growth medium at a final concentration of 0.5 μg/mL to aid in the selection of transfected cells.
RNA extraction and qRT-PCR
Total RNA extraction was performed following the protocol provided by the Total RNA Purification Kit (NORGENE Cat# 17200). Purified RNA sample was collected and quantified using the NanoDrop ND-1000 system (Technologies Inc., Wilmington, DE). cDNA was synthesized by HighCapacity cDNA Reverse Transcription Kit with RNase Inhibitor (Applied Biosystems, Waltham, MA - Cat# 4374966). For miR-449a expression analysis, real-time PCR was performed using TaqMan Fast Universal PCR Master Mix (Applied Biosystems - Cat# 4352042). U6 was used as an endogenous control. For E-cadherin, N-cadherin, SNAI2, and sIL-6R expression analysis, qRT-PCR was performed using PowerUp SYBR Green Master Mix (Applied Biosystems - Cat# A25742) on a Quant studio 5 Real-Time PCR system (Applied Biosystems). Relative transcript expression was measured using Quant studio real-time PCR software (Applied Biosystems). The threshold cycle (Ct) was automatically assigned by the SDS2.2 (Applied Biosystems) software package. Relative quantities (RQ) were determined using the equation RQ = 2 -ΔΔCt. All data were generated in triplicate (several TLDA plates) and expressed as mean ± SD. The primers and probes used in this study were shown in Table S5.
RNA sequencing library preparation and sequencing
RNA integrity was measured on the RNA 6000 Nano Bioanalyzer (Agilent Technologies, Inc.) and the RNA integrity number (RIN) was used as a parameter to define sample quality. RNA samples with an RIN equal to or greater than 7 were also quantified by Qubit Fluorometer (RNA HS Assay Kit - Invitrogen) and reverse transcribed using a Vilo SuperScript cDNA Synthesis Kit, according to the manufacturer’s instructions. The Reverse Transcription Master Mix used included: 5× Vilo Reaction Mix and 10× SuperScript Enzyme Mix. Briefly, 10 ng total RNA was reverse transcribed by adding 4.5 μL Master Mix to the samples. Barcoded libraries were generated using an Ion AmpliSeq Transcriptome Human Gene Expression Kit (Thermo Fisher Scientific, Waltham, MA). The resulting libraries were then used for downstream template preparation on the Ion Chef System and sequencing occurred on the Ion S5 System, according to the manufacturer’s instructions.
Migration and invasion assays
For migration and invasion assays, 5 × 10⁴ HNO-210 and FaDu cells were plated in serum-free medium on the upper chambers of transwell plates. In detail, for the migration assay the cells were plated on the upper uncoated membranes (Corning BioCoat 24-well inserts; pore size, 8 μm; Corning, Corning, NY - Cat# 354578); for the invasion assay, the cells were plated on the upper coated canisters with Matrigel (Corning BioCoat Matrigel Invasion Chamber; pore size, 8 μm - Cat# 354480). DMEM (MICROGEM DMEM Cat# AL066A) and MEM (ATTC Cat# 30-2003) culture media supplemented with 10% FBS were added to the lower chambers acting as chemoattractants. After 24 h, non-invasive cells were carefully removed using cotton swabs. Cells were fixed in 100% methanol and stained with 0.25% crystal violet (Sigma-Aldrich, St. Louis, MO). Migrated and invaded cells were counted at the microscope (Axio Vert. A1, Zeiss, Jena, Germany - Zeiss ZEN 3.5 software) in randomly selected fields.
Immunofluorescence assay
HNO-210 cells were plated 5 × 10⁴ in 24 multi wells on coverslips and after 90% fusion, PBS was washed three times for 5 min each time and fixed with 4% paraformaldehyde for 30 min at room temperature. The fixative was removed, and each well was washed three times in 1× PBS for 5 min. Cells were permeabilized for 5 min at RT with 0.5% Triton/PBS and then incubated with Blocking Buffer (2% BSA + 0.05% Triton X-100 + 5% serum in PBS) for 1 h at RT and primary antibodies were added: E-cadherin (dilution 1:400, Cell Signaling Technology, Danvers, MA - Cat# 24E10) and N-cadherin (dilution 1:400, Cell Signaling Technology – Cat# D4R1H) were diluted in Antibody Dilution Buffer and incubated overnight at 4°C. Subsequently, the primary antibody was removed and each well was washed three times in 1× PBS for 5 min. Cells were incubated with fluorochrome-conjugated secondary antibody Anti-Rabbit IgG (Alexa Fluor 488 Conjugate #4412) diluted in Antibody Dilution Buffer for 1 h at room temperature in the dark then washed three times in 1× PBS for 5 min. Nuclei were counterstained with DAPI (1 ng/mL working solution; Sigma-Aldrich). Images were captured using a LEICA SP5 X Laser Scanning Confocal Microscope (scale bar, 10 μm) (Leica Microsystems GmbH, Wetzlar, Germany).
Dual-luciferase reporter assay
HEK293 cell line were plated in six-well plates and transfected with miR-449a (mirVana miRNA mimic) (Life Technologies, Carlsbad, CA) and antagomir miR-449a (mirVana miRNA inhibitor) (Life Technologies), pGL3-IL6R-3′UTR-1-180-WT (GeneScript Biotech, Piscataway, NJ) control plasmid and mutated site IL-6R 3′UTR mut (actgtata) using Lipofectamine 2000 in Opti-MEM medium (Gibco, Life Technologies). After 24 h of transduction, cells were washed and Renilla signals were measured using Dual-Luciferase Reporter Assay System (Promega, Madison, WI) according to the manufacturer’s protocol.
RNA-binding protein immunoprecipitation
To validate the interaction between IL-6R transcript (mRNA) and miR-449a we used Millipore Magna RIP kit (Millipore Sigma, Darmstadt, Germany - Cat. no. 17-700) following the manufacturer’s instruction. HNO-210 cells (2.3 × 10⁷ in each experimental conditions) were washed with 10 mL cold PBS and harvested with cell scrapers followed by centrifugation at 1,500 rpm and 4°C for 5 min. HNO-210 cells were lysed using 100 μL RIP Lysis Buffer (150 mM KCl, 25 mM Tris pH 7.4, 5 mM EDTA, 0.5% NP40) supplemented with RNase and protease cocktail inhibitor (Cat. No. CS203219) and stored at −80°C. Magnetic beads for immunoprecipitation were prepared according to the kit instructions with 5 μg Argonaute-2 antibody (RIPAb+AGO2, Clone 9E8.2, Millipore) or Normal Rabbit irrelevant IgG (Cat. No. PP64B) as a negative control. RIP lysates were thawed and centrifuged at 14,000 rpm for 10 min at 4°C and incubated with immunoprecipitation buffer (RIP wash buffer, 0.5 mM EDTA; RNAse Inhibitor) with overnight rotation at 4°C. Samples were washed three times, the proteins were degraded using proteinase K at 55°C for 30 min with shaking, and then the RNA was purified using the phenol/chloroform method. The isolated RNA was measured using NanoDrop spectrophotometer (ND-1000 system- Technologies Inc., Wilmington, DE), and reverse transcribed by HighCapacity cDNA Reverse Transcription Kit containing RNase Inhibitor (Applied Biosystems - Cat# 4374966). The relative gene expression of miR-449a and IL-6R was measured by Quant studio 5 Real-Time PCR system (Applied Biosystems).
ELISA
Human IL-6R and IL-6 cytokine in cell culture supernatants were quantified using IL-6R and IL-6 Quantikine ELISA Kits (R&D Systems Cat# DR600, D6050). One hundred microliters of standards and supernatant (recovered after centrifugation) of HNO-210 cells transduced with miR-449a and inhibitor were added to the wells of a microplate precoated with a monoclonal antibody specific for human IL-6R and IL-6 and incubated for 2 h at room temperature. Each well was filled three times with 400 μL Wash Buffer and 200 μL of an enzyme-linked polyclonal antibody specific for human IL-6R and IL-6 were added to the wells and incubated for 2 h at room temperature. After three washes, 200 μL substrate solution were added to the wells and incubated for 20 min at room temperature. We added 50 μL Stop Solution to each well and determined a color change (from blue to yellow) in proportion to the amount of bound IL-6R and IL-6. The intensity of the wavelength measured on the spectrophotometer was set to 450 nm or 540 nm.
Protein extraction and western blot analysis after Hyper IL-6 stimulation and sgp130fc treatment
Transfected HNO-210 cell lines were seeded and starved overnight in 0.1% FBS medium. Cells was analyzed in different experimental conditions: 0.1% Serum Starvation, Hyper IL-6 R&D Systems (Recombinant Human IL-6/IL-6R Complex Chimera - Cat# 8954-SR) stimulation (20 ng/mL for 30 min), sgp130fc (Recombinant Human gp130 Fc Chimera - Cat# 671-GP) treatment (1,000 ng/mL for 1 h), sgp130fc pretreatment followed by Hyper IL-6 stimulation. Cell proteins were collected in 30 μL of cold lysis buffer (10 mM Tris-HCl pH 7.5, 150 mM NaCl, 50 mM EDTA, 1% Triton X-100) supplemented with 1 bmM DTT, 1 mM PMSF, and Protease and Phosphatase Inhibitor (Halt Protease and Phosphatase Inhibitor Single-Use Cocktail - Thermo Fisher Scientific - Cat# 78442) and electro-transferred to nitrocellulose membranes (Trans-Blot Turbo – Mini format – BioRad, Hercules, CA). Membranes were washed in TBST (10 mM Tris, pH 8.0, 150 mM NaCl, 0.05% Tween 20) and blocked for 1 h with TBST supplemented with 5% nonfat dry milk. Membranes with transferred proteins were incubated overnight with primary antibodies in TBST and 5% BSA 0.002% sodium azide. Membranes were then washed and incubated with horseradish peroxidase-conjugated secondary antibodies for 1 h at room temperature. Blots were developed using enhanced chemiluminescence detection reagents ECL (Immobilion ECL Ultra Western HRP Substrate - Cat# WBULS0500 Millipore) and acquired using ChemiDoc Imaging System (BioRad). Primary and secondary antibodies were shown in Table S6.
Zebrafish and xenotransplants
Animal experiments were performed in accordance with the European Council Directive 2010/63/EU and approved by Biogem SCARL Internal Ethics Committee (OPBA). The Tg (fli1:EGFP) zebrafish line, with green fluorescent blood vessels, was grown, maintained, and mated under standard conditions. Zebrafish eggs were obtained by natural spawning and kept in an incubator at 28°C for 48 h in E3 growth medium. Before injection, HNO-210 cells from the two different experimental groups (empty-backbone and miR-449a) were labeled with red cell tracker CM-Dil dye (Thermo Fisher Scientific) following the instructions of the manufacturer. At 2 days post fertilization, the embryos were dechorionated, anesthetized with 0.04% tricaine (Merck Millipore) and approximately 200 cells/embryo were injected into the perivitelline space of each animal using a PicoPump PV830 pneumatic injector (World Precision Instruments, Sarasota, FL) equipped with a borosilicate glass injection needle (Sutter Instrument, Novato, CVA); 24 hpi, the larvae with correct engraftment in the yolk sac were selected with the Leica M205 FA fluorescence stereomicroscope (Leica) and 11 kept in an incubator at 34°C for 72 h. Zebrafish larvae were anesthetized (with 0.04% tricaine) and evaluated at 24 and 72 hpi by fluorescence stereomicroscope. Embryo images were captured with the Leica DFC450C camera and were analyzed with ImageJ software (National Institutes of Health, Rockville, MD).
Bioinformatics and statistical analyses
Ion Torrent Suite Sever v5.12.2 (Thermo Fisher Scientific) software was used for base-calling and coverageAnalysis plugin with default settings was used to align reads to the hg19_AmpliSeq_Transcriptome_v1.1 reference and generate quality information. AmpliSeqRNA plugin with default settings was used for reading quantification. Downstream analyses were performed in R v3.6.1 (https://www.R-project.org/) statistical environment. Coherence of biological replicates at each condition was assessed using PCA. Differential expression analysis between the two considered conditions (miRNA vs. empty and miRNA vs. inhibitor) was performed using the R packages DESeq2 v1.16.2.28 Genes with an adjusted p value (Benjamini and Hochberg correction, false discovery rate) of ≤0.05 and log2FoldChange (log2FC) of ≥|1| were considered significantly DEGs and visualized as volcano plot using the R package EnhancedVolcano v1.6.0 (https://github.com/kevinblighe/EnhancedVolcano). GO:BP enrichment analysis of DEGs and Gene Set Enrichment Analysis (GSEA) on all genes list ranked according to log2FC were computed using the cluster Profiler v 3.3.6 package.52 MultiMiR R package was used to retrieve the list of predict targets of miR-449a, by interrogating 14 databases, including miRecords, miRTarBase, TarBase, DIANA-microT, ElMMo, MicroCosm, miRanda, miRDB, PicTar, PITA, TargetScan, miR2Disease, PharmacomiR and PhenomiR.53 The RNA hybrid tool (http://bibiserv.techfak.uni-bielefeld.de/rnahybrid)54 was used with default parameters to calculate the minimum free energy of hybridization for each IL-6R: miR-449a duplex (mutated and wild-type seed). All statistical analyses were conducted using GRAPHPAD PRISM version 8.0 (GraphPad Software, San Diego, CA). Data were expressed as the mean ± SD. In detail, the two-tailed Student’s t test was used to calculate two-group comparison; one-way ANOVA was carried out to analyze multiple-group comparisons. The correlation between biomarkers was determined using Fisher exact test. Relationships between clinical-pathological parameters were assessed using contingency tables with a Fisher exact test. All statistical analyses were performed using the SPSS software system (version 17.0; SPSS. Inc., Chicago, IL). A p value of ≤0.05 was statistically significant.
Data and code availability
Data supporting the figures generated are available from authors under written demand.
Acknowledgments
This study was conducted in accordance with Good Clinical Practice and with the 1964 Declaration of Helsinki and its later amendments or comparable ethical standards. All analysis performed in studies involving human tissue samples were approved by the Bioethics committee of University of Campania “Luigi Vanvitelli”–Azienda ospedaliera Universitaria “Luigi Vanvitelli”–ORN “Ospedale dei Colli” (Prot.002544/i, 07 September 2021). The present study received financial support by the Italian Ministry of Health (grant number: PNRR-MAD-2022-12375755) and “Bando di Ateneo per il finanziamento di progetti di ricerca fondamentale ed applicate dedicato ai giovani Ricercatori” D.R. n. 509 del 13/06/2022. The research was carried out by researcher Alessia Maria Cossu with a research contract co-financed by the European Union- “PON Ricerca e Innovazione 2014-2020”, pursuant to art. .24, comma3, lett.a) of the law 30 December 2010, n.240 and s.m.i. of D.M. 10 August 2021n. 1062 f. We would like to thank Alessandra Fucci for her helping in plasmid site directed mutagenesis. Each of the authors acknowledges that he or she participated sufficiently in the work to take public responsibility for its content, and each of the authors agreed to be accountable for all aspects of the work in ensuring that questions related to the accuracy or integrity of any part of the work are appropriately investigated and resolved.
Author contributions
A.M.C: conceptualization, cell biology and molecular experiments, writing, supervision, data curation, formal analysis, visualization, methodology, review and editing. F.M: cell biology experiments, western blot experiments, NGS experiments, methodology, analysis and writing. L.P. and P.G: molecular biology experiments, methodology, data curation. T.M.N.: NGS experiments, data analysis, curation, methodology. C.R.: in-vivo experiments, methodology. M.B., M.F., and C.T.: visualization and data curation. F.R., N.A., M.M., and S.A., collected data and clinical samples. F.P., F.L., and R.A.: visualization and patient data curation. A.O., G.M., C.A., and E.A.: review and editing. M. Ceccarelli: coordinated NGS analysis and editing. M. Caraglia: writing, supervision, review and editing. M.S.: conceptualization, data curation, methodology, review and editing. All authors read and approved the final manuscript.
Declaration of interests
The all authors declare that they have no conflicts of interests.
Footnotes
Supplemental information can be found online at https://doi.org/10.1016/j.omtn.2024.102140.
Contributor Information
Alessia Maria Cossu, Email: alessiamaria.cossu@unicampania.it.
Marianna Scrima, Email: marianna.scrima@biogem.it.
Supplemental information
References
- 1.Marziliano A., Teckie S., Diefenbach M.A. Alcohol-related head and neck cancer: Summary of the literature. Head Neck. 2020;42:732–738. doi: 10.1002/hed.26023. [DOI] [PubMed] [Google Scholar]
- 2.Binazzi A., Ferrante P., Marinaccio A. Occupational exposure and sinonasal cancer: a systematic review and meta-analysis. BMC Cancer. 2015;15:49. doi: 10.1186/s12885-015-1042-2. [DOI] [PMC free article] [PubMed] [Google Scholar]
- 3.Mastronikolis N.S., Papadas T.A., Goumas P.D., Triantaphyllidou I.E., Theocharis D.A., Papageorgakopoulou N., Vynios D.H. Head and neck: Laryngeal tumors: an overview. Atlas Genet. Cytogenet. Oncol. Haematol. 2009;13:889. [Google Scholar]
- 4.Lo Nigro C., Denaro N., Merlotti A., Merlano M. Head and neck cancer: improving outcomes with a multidisciplinary approach. Cancer Manag. Res. 2017;9:363–371. doi: 10.2147/CMAR.S115761. [DOI] [PMC free article] [PubMed] [Google Scholar]
- 5.Gupta G.P., Massagué J. Cancer Metastasis: Building a Framework. Cell. 2006;127:679–695. doi: 10.1016/j.cell.2006.11.001. [DOI] [PubMed] [Google Scholar]
- 6.Peng Y., Croce C.M. The role of MicroRNAs in human cancer. Signal Transduct. Target. Ther. 2016;1 doi: 10.1038/sigtrans.2015.4. [DOI] [PMC free article] [PubMed] [Google Scholar]
- 7.Kowalski L.P., Coletta R.D., Salo T., Maschietto M., Chojniak R., Lima J.M., Mlynarek A., Hier M.P., Alaoui-Jamali M.A., Silva S.D. Head and neck cancer: Emerging concepts in biomarker discovery and opportunities for clinical translation. Clin. Transl. Med. 2020;10 doi: 10.1002/ctm2.209. [DOI] [PMC free article] [PubMed] [Google Scholar]
- 8.Cossu A.M., Mosca L., Zappavigna S., Misso G., Bocchetti M., De Micco F., Quagliuolo L., Porcelli M., Caraglia M., Boccellino M. Long Non-coding RNAs as Important Biomarkers in Laryngeal Cancer and Other Head and Neck Tumours. Int. J. Mol. Sci. 2019;20:3444. doi: 10.3390/ijms20143444. [DOI] [PMC free article] [PubMed] [Google Scholar]
- 9.Takeuchi T., Kawasaki H., Luce A., Cossu A.M., Misso G., Scrima M., Bocchetti M., Ricciardiello F., Caraglia M., Zappavigna S. Insight toward the MicroRNA Profiling of Laryngeal Cancers: Biological Role and Clinical Impact. Int. J. Mol. Sci. 2020;21:3693. doi: 10.3390/ijms21103693. [DOI] [PMC free article] [PubMed] [Google Scholar]
- 10.Ramírez-Moya J., Santisteban P. miRNA-Directed Regulation of the Main Signaling Pathways in Thyroid Cancer. Front. Endocrinol. 2019;10:430. doi: 10.3389/fendo.2019.00430. [DOI] [PMC free article] [PubMed] [Google Scholar]
- 11.Correia de Sousa M., Gjorgjieva M., Dolicka D., Sobolewski C., Foti M. Deciphering miRNAs’ Action through miRNA Editing. Int. J. Mol. Sci. 2019;20:6249. doi: 10.3390/ijms20246249. [DOI] [PMC free article] [PubMed] [Google Scholar]
- 12.Zhang L., Liao Y., Tang L. MicroRNA-34 family: a potential tumor suppressor and therapeutic candidate in cancer. J. Exp. Clin. Cancer Res. 2019;38:53. doi: 10.1186/s13046-019-1059-5. [DOI] [PMC free article] [PubMed] [Google Scholar]
- 13.Shi W., Bruce J., Lee M., Yue S., Rowe M., Pintilie M., Kogo R., Bissey P.A., Fyles A., Yip K.W., Liu F.F. MiR-449a promotes breast cancer progression by targeting CRIP2. Oncotarget. 2016;7:18906–18918. doi: 10.18632/oncotarget.7753. [DOI] [PMC free article] [PubMed] [Google Scholar]
- 14.Liu Y., Wang Y., Sun X., Mei C., Wang L., Li Z., Zha X. miR-449a promotes liver cancer cell apoptosis by downregulation of Calpain 6 and POU2F1. Oncotarget. 2016;7:13491–13501. doi: 10.18632/oncotarget.4821. [DOI] [PMC free article] [PubMed] [Google Scholar]
- 15.Bou Kheir T., Futoma-Kazmierczak E., Jacobsen A., Krogh A., Bardram L., Hother C., Grønbæk K., Federspiel B., Lund A.H., Friis-Hansen L. miR-449 inhibits cell proliferation and is down-regulated in gastric cancer. Mol. Cancer. 2011;10:29. doi: 10.1186/1476-4598-10-29. [DOI] [PMC free article] [PubMed] [Google Scholar]
- 16.Wu D., Liu J., Chen J., He H., Ma H., Lv X. miR-449a Suppresses Tumor Growth, Migration, and Invasion in Non-Small Cell Lung Cancer by Targeting a HMGB1-Mediated NF-κB Signaling Pathway. Oncol. Res. 2019;27:227–235. doi: 10.3727/096504018X15213089759999. [DOI] [PMC free article] [PubMed] [Google Scholar]
- 17.Gupta S., Panda P.K., Hashimoto R.F., Samal S.K., Mishra S., Verma S.K., Mishra Y.K., Ahuja R. Dynamical modeling of miR-34a, miR-449a, and miR-16 reveals numerous DDR signaling pathways regulating senescence, autophagy, and apoptosis in HeLa cells. Sci. Rep. 2022;12:4911. doi: 10.1038/s41598-022-08900-y. [DOI] [PMC free article] [PubMed] [Google Scholar]
- 18.Noureddine S., Nie J., Schneider A., Menon V., Fliesen Z., Dhahbi J., Victoria B., Oyer J., Robles-Carrillo L., Nunes A.D.D.C., et al. microRNA-449a reduces growth hormone-stimulated senescent cell burden through PI3K-mTOR signaling. Proc. Natl. Acad. Sci. USA. 2023;120 doi: 10.1073/pnas.2213207120. [DOI] [PMC free article] [PubMed] [Google Scholar]
- 19.Kawasaki H., Takeuchi T., Ricciardiello F., Lombardi A., Biganzoli E., Fornili M., De Bortoli D., Mesolella M., Cossu A.M., Scrima M., et al. Definition of miRNA Signatures of Nodal Metastasis in LCa: miR-449a Targets Notch Genes and Suppresses Cell Migration and Invasion. Mol. Ther. Nucleic Acids. 2020;20:711–724. doi: 10.1016/j.omtn.2020.04.006. [DOI] [PMC free article] [PubMed] [Google Scholar]
- 20.Wu A.Y., Hu Y., Cang W., Li D., Wang W.J., Tian Q., Gu L.Y., Zhang N., Ji F., Qiu L.H. Suppressive effect of microRNA-449a on the NDRG1/PTEN/AKT axis regulates endometrial cancer growth and metastasis. Exp. Cell Res. 2019;382 doi: 10.1016/j.yexcr.2019.06.013. [DOI] [PubMed] [Google Scholar]
- 21.Ishikawa D., Takasu C., Kashihara H., Nishi M., Tokunaga T., Higashijima J., Yoshikawa K., Yasutomo K., Shimada M. The Significance of MicroRNA-449a and Its Potential Target HDAC1 in Patients With Colorectal Cancer. Anticancer Res. 2019;39:2855–2860. doi: 10.21873/anticanres.13414. [DOI] [PubMed] [Google Scholar]
- 22.Yong-Ming H., Ai-Jun J., Xiao-Yue X., Jian-Wei L., Chen Y., Ye C. miR-449a: a potential therapeutic agent for cancer. Anti Cancer Drugs. 2017;28:1067–1078. doi: 10.1097/CAD.0000000000000555. [DOI] [PubMed] [Google Scholar]
- 23.Li B., Wang Z., Yang F., Huang J., Hu X., Deng S., Tian M., Si X. miR-449a-5p suppresses CDK6 expression to inhibit cardiomyocyte proliferation. Mol. Med. Rep. 2021;23:14–21. doi: 10.3892/mmr.2020.11652. [DOI] [PMC free article] [PubMed] [Google Scholar]
- 24.Rose-John S., Jenkins B.J., Garbers C., Moll J.M., Scheller J. Targeting IL-6 trans-signalling: past, present and future prospects. Nat. Rev. Immunol. 2023;23:666–681. doi: 10.1038/s41577-023-00856-y. [DOI] [PMC free article] [PubMed] [Google Scholar]
- 25.Agarwal V., Bell G.W., Nam J.W., Bartel D.P. Predicting effective microRNA target sites in mammalian mRNAs. Elife. 2015;4 doi: 10.7554/eLife.05005. [DOI] [PMC free article] [PubMed] [Google Scholar]
- 26.McGeary S.E., Lin K.S., Shi C.Y., Pham T.M., Bisaria N., Kelley G.M., Bartel D.P. The biochemical basis of microRNA targeting efficacy. Science. 2019;366 doi: 10.1126/science.aav1741. [DOI] [PMC free article] [PubMed] [Google Scholar]
- 27.Rašková M., Lacina L., Kejík Z., Venhauerová A., Skaličková M., Kolář M., Jakubek M., Rosel D., Smetana K., Jr., Brábek J. The Role of IL-6 in Cancer Cell Invasiveness and Metastasis—Overview and Therapeutic Opportunities. Cells. 2022;11:3698. doi: 10.3390/cells11223698. [DOI] [PMC free article] [PubMed] [Google Scholar]
- 28.Love M.I., Huber W., Anders S. Moderated estimation of fold change and dispersion for RNA-seq data with DESeq2. Genome Biol. 2014;15:550. doi: 10.1186/s13059-014-0550-8. [DOI] [PMC free article] [PubMed] [Google Scholar]
- 29.Puram S.V., Tirosh I., Parikh A.S., Patel A.P., Yizhak K., Gillespie S., Rodman C., Luo C.L., Mroz E.A., Emerick K.S., et al. Single-Cell Transcriptomic Analysis of Primary and Metastatic Tumor Ecosystems in Head and Neck Cancer. Cell. 2017;171:1611–1624.e24. doi: 10.1016/j.cell.2017.10.044. [DOI] [PMC free article] [PubMed] [Google Scholar]
- 30.Diepenbruck M., Christofori G. Epithelial–mesenchymal transition (EMT) and metastasis: yes, no, maybe? Curr. Opin. Cell Biol. 2016;43:7–13. doi: 10.1016/j.ceb.2016.06.002. [DOI] [PubMed] [Google Scholar]
- 31.Huang B., Lang X., Li X. The role of IL-6/JAK2/STAT3 signaling pathway in cancers. Front. Oncol. 2022;12 doi: 10.3389/fonc.2022.1023177. [DOI] [PMC free article] [PubMed] [Google Scholar]
- 32.Chen J., Wei Y., Yang W., Huang Q., Chen Y., Zeng K., Chen J. IL-6: The Link Between Inflammation, Immunity and Breast Cancer. Front. Oncol. 2022;12 doi: 10.3389/fonc.2022.903800. [DOI] [PMC free article] [PubMed] [Google Scholar]
- 33.Suarez-Carmona M., Bourcy M., Lesage J., Leroi N., Syne L., Blacher S., Hubert P., Erpicum C., Foidart J.M., Delvenne P., et al. Soluble factors regulated by epithelial-mesenchymal transition mediate tumour angiogenesis and myeloid cell recruitment: EMT-regulated angiogenesis and myeloid cell recruitment. J. Pathol. 2015;236:491–504. doi: 10.1002/path.4546. [DOI] [PubMed] [Google Scholar]
- 34.Lyons J.G., Patel V., Roue N.C., Fok S.Y., Soon L.L., Halliday G.M., Gutkind J.S. Snail Up-regulates Proinflammatory Mediators and Inhibits Differentiation in Oral Keratinocytes. Cancer Res. 2008;68:4525–4530. doi: 10.1158/1078-0432.CCR-07-6735. [DOI] [PMC free article] [PubMed] [Google Scholar]
- 35.Wu D., Cheng J., Sun G., Wu S., Li M., Gao Z., Zhai S., Li P., Su D., Wang X. p70S6K promotes IL-6-induced epithelial-mesenchymal transition and metastasis of head and neck squamous cell carcinoma. Oncotarget. 2016;7:36539–36550. doi: 10.18632/oncotarget.9282. [DOI] [PMC free article] [PubMed] [Google Scholar]
- 36.Colomiere M., Ward A.C., Riley C., Trenerry M.K., Cameron-Smith D., Findlay J., Ackland L., Ahmed N. Cross talk of signals between EGFR and IL-6R through JAK2/STAT3 mediate epithelial–mesenchymal transition in ovarian carcinomas. Br. J. Cancer. 2009;100:134–144. doi: 10.1038/sj.bjc.6604794. [DOI] [PMC free article] [PubMed] [Google Scholar]
- 37.Miao J.-W., Liu L.-J., Huang J. J. Interleukin-6-induced epithelial-mesenchymal transition through signal transducer and activator of transcription 3 in human cervical carcinoma. Int. J. Oncol. 2014;45:165–176. doi: 10.3892/ijo.2014.2422. [DOI] [PubMed] [Google Scholar]
- 38.Kim H.S., Chen Y.C., Nör F., Warner K.A., Andrews A., Wagner V.P., Zhang Z., Zhang Z., Martins M.D., Pearson A.T., et al. Endothelial-derived interleukin-6 induces cancer stem cell motility by generating a chemotactic gradient towards blood vessels. Oncotarget. 2017;8:100339–100352. doi: 10.18632/oncotarget.22225. [DOI] [PMC free article] [PubMed] [Google Scholar]
- 39.Rose-John S. Interleukin-6 signalling in health and disease. F1000Res. 2020;9:1013. doi: 10.12688/f1000research.26058.1. [DOI] [PMC free article] [PubMed] [Google Scholar]
- 40.Chalaris A., Garbers C., Rabe B., Rose-John S., Scheller J. The soluble Interleukin 6 receptor: Generation and role in inflammation and cancer. Eur. J. Cell Biol. 2011;90:484–494. doi: 10.1016/j.ejcb.2010.10.007. [DOI] [PubMed] [Google Scholar]
- 41.Oberg H.-H., Wesch D., Grüssel S., Rose-John S., Kabelitz D. Differential expression of CD126 and CD130 mediates different STAT-3 phosphorylation in CD4+CD25− and CD25high regulatory T cells. Int. Immunol. 2006;18:555–563. doi: 10.1093/intimm/dxh396. [DOI] [PubMed] [Google Scholar]
- 42.Rose-John S., Scheller J., Elson G., Jones S.A. Interleukin-6 biology is coordinated by membrane-bound and soluble receptors: role in inflammation and cancer. J. Leukoc. Biol. 2006;80:227–236. doi: 10.1189/jlb.1105674. [DOI] [PubMed] [Google Scholar]
- 43.Scheller J., Rose-John S. Interleukin-6 and its receptor: from bench to bedside. Med. Microbiol. Immunol. 2006;195:173–183. doi: 10.1007/s00430-006-0019-9. [DOI] [PubMed] [Google Scholar]
- 44.Heaney M.L., Golde D.W. Soluble cytokine receptors. Blood. 1996;87:847–857. [PubMed] [Google Scholar]
- 45.Schreiber S., Aden K., Bernardes J.P., Conrad C., Tran F., Höper H., Volk V., Mishra N., Blase J.I., Nikolaus S., et al. Therapeutic Interleukin-6 Trans-signaling Inhibition by Olamkicept (sgp130Fc) in Patients With Active Inflammatory Bowel Disease. Gastroenterology. 2021;160:2354–2366.e11. doi: 10.1053/j.gastro.2021.02.062. [DOI] [PubMed] [Google Scholar]
- 46.Becker C., Fantini M.C., Schramm C., Lehr H.A., Wirtz S., Nikolaev A., Burg J., Strand S., Kiesslich R., Huber S., et al. TGF-β Suppresses Tumor Progression in Colon Cancer by Inhibition of IL-6 trans-Signaling. Immunity. 2004;21:491–501. doi: 10.1016/j.immuni.2004.07.020. [DOI] [PubMed] [Google Scholar]
- 47.Srivastava S., Samarpita S., Ganesan R., Rasool M. CYT387 Inhibits the Hyperproliferative Potential of Fibroblast-like Synoviocytes via Modulation of IL-6/JAK1/STAT3 Signaling in Rheumatoid Arthritis. Immunol. Invest. 2022;51:1582–1597. doi: 10.1080/08820139.2021.1994589. [DOI] [PubMed] [Google Scholar]
- 48.Fischer M., Goldschmitt J., Peschel C., Brakenhoff J.P., Kallen K.J., Wollmer A., Grötzinger J., Rose-John S. A bioactive designer cytokine for human hematopoietic progenitor cell expansion. Nat. Biotechnol. 1997;15:142–145. doi: 10.1038/nbt0297-142. [DOI] [PubMed] [Google Scholar]
- 49.Jostock T., Müllberg J., Ozbek S., Atreya R., Blinn G., Voltz N., Fischer M., Neurath M.F., Rose-John S. Soluble gp130 is the natural inhibitor of soluble interleukin-6 receptor transsignaling responses: Soluble gp130 inhibits transsignaling responses. Eur. J. Biochem. 2001;268:160–167. doi: 10.1046/j.1432-1327.2001.01867.x. [DOI] [PubMed] [Google Scholar]
- 50.Luo Y., Zheng S.G. Hall of Fame among Pro-inflammatory Cytokines: Interleukin-6 Gene and Its Transcriptional Regulation Mechanisms. Front. Immunol. 2016;7 doi: 10.3389/fimmu.2016.00604. [DOI] [PMC free article] [PubMed] [Google Scholar]
- 51.Zegeye M.M., Lindkvist M., Fälker K., Kumawat A.K., Paramel G., Grenegård M., Sirsjö A., Ljungberg L.U. Activation of the JAK/STAT3 and PI3K/AKT pathways are crucial for IL-6 trans-signaling-mediated pro-inflammatory response in human vascular endothelial cells. Cell Commun. Signal. 2018;16:55. doi: 10.1186/s12964-018-0268-4. [DOI] [PMC free article] [PubMed] [Google Scholar]
- 52.Yu G., Wang L.-G., Han Y., He Q.-Y. clusterProfiler: an R Package for Comparing Biological Themes Among Gene Clusters. OMICS A J. Integr. Biol. 2012;16:284–287. doi: 10.1089/omi.2011.0118. [DOI] [PMC free article] [PubMed] [Google Scholar]
- 53.Ru Y., Kechris K.J., Tabakoff B., Hoffman P., Radcliffe R.A., Bowler R., Mahaffey S., Rossi S., Calin G.A., Bemis L., Theodorescu D. The multiMiR R package and database: integration of microRNA–target interactions along with their disease and drug associations. Nucleic Acids Res. 2014;42:e133. doi: 10.1093/nar/gku631. [DOI] [PMC free article] [PubMed] [Google Scholar]
- 54.Kruger J., Rehmsmeier M. RNAhybrid: microRNA target prediction easy, fast and flexible. Nucleic Acids Res. 2006;34:W451–W454. doi: 10.1093/nar/gkl243. [DOI] [PMC free article] [PubMed] [Google Scholar]
Associated Data
This section collects any data citations, data availability statements, or supplementary materials included in this article.
Supplementary Materials
Data Availability Statement
Data supporting the figures generated are available from authors under written demand.