

Abstract
Background:
The antidiabetic drug metformin has known anticancer effects related to its antioxidant activity; however, its clinical benefit for prostate cancer (PCa) has thus far been inconclusive. Here, we investigate whether the efficacy of metformin in PCa is related to the expression status of NKX3.1, a prostate-specific homeobox gene that functions in mitochondria to protect the prostate from aberrant oxidative stress.
Objective:
To investigate the relationship of NKX3.1 expression and metformin efficacy in PCa.
Design, setting, and participants:
Functional studies were performed in vivo and in vitro in genetically engineered mouse models and human LNCaP cells, and organotypic cultures having normal or reduced/absent levels of NKX3.1. Correlative studies were performed using two independent retrospective tissue microarray cohorts of radical prostatectomies and a retrospective cohort of prostate biopsies from patients on active surveillance.
Intervention:
Metformin was administered before or after the induction of oxidative stress by treatment with paraquat.
Outcome measurements and statistical analysis:
Functional endpoints included analyses of histopathology, tumorigenicity, and mitochondrial function. Correlative endpoints include Kaplan-Meier curves and Cox proportional hazard regression models.
Results and limitations:
Metformin reversed the adverse consequences of NKX3.1 deficiency following oxidative stress in vivo and in vitro, as evident by reduced tumorigenicity and restored mitochondrial function. Patients with low NKX3.1 expression showed a significant clinical benefit from taking metformin.
Conclusions:
Metformin can overcome the adverse consequences of NKX3.1 loss for PCa progression by protecting against oxidative stress and promoting normal mitochondrial function. These functional activities and clinical correlates were observed only with low NKX3.1 expression. Thus, the clinical benefit of metformin in PCa may depend on the status of NKX3.1 expression.
Patient summary:
Prostate cancer patients with low NKX3.1 are likely to benefit most from metformin treatment to delay disease progression in a precision interception paradigm.
Keywords: NKX3.1, Metformin, Prostate cancer, Precision medicine, Mitochondria, Oxidative stress
The role of the antidiabetic drug metformin in prostate cancer has long been ambiguous. Our study reveals that metformin can provide clinical benefit for prostate cancer patients only when NKX3.1 expression is low, where it inhibits oxidative stress–mediated disease progression.
1. Introduction
Prostate cancer (PCa) is a major cause of cancer death in men worldwide [1]. The majority of PCa patients with organ-confined disease are monitored by active surveillance [2]. For those who progress, radical prostatectomy (RP) or radiotherapy is often curative. However, since PCa tumors are multifocal and genomically heterogeneous [3], some patients fail local treatment and further progress to metastatic disease, which is often lethal [4]. Despite recent improvements, there remains an urgent need to identify better predictors of progression [2,5,6].
The prostate-specific homeobox gene NKX3.1 protects the prostatic epithelium from cancer-related stress, while its reduced expression, as prevalent in early-stage PCa, is associated with an increased risk of progression as well as a reduced response to preventative interventions [7–13]. The prostate is highly susceptible to inflammation and oxidative stress, which are associated with acceleration of disease progression [7,8,10,11]. Notably, oxidative stress promotes localization of NKX3.1 to mitochondria, where it protects against aberrant reactive oxygen species (ROS) and promotes normal mitochondrial function; conversely, its loss or reduction is associated with impaired mitochondrial function and adverse disease outcome [7].
Metformin, a biguanide, is the most widely prescribed antidiabetic drug worldwide because of its clinical efficacy and tolerability [14]. It exerts multiple pharmacological effects, including regulation of mitochondrial function and oxidative stress, which have inspired its repurposing in cancer [15–19]. Notably, data from retrospective clinical studies of patients with type 2 diabetes on metformin support its protective effect in several cancers [20,21]. Although individuals with metabolic syndrome, insulin resistance, or type 2 diabetes have an increased risk for advanced PCa [22], the potential anticancer activity of metformin for PCa has thus far been inconclusive. While some studies report that metformin is associated with a reduced incidence [23–25], other studies fail to find an association of metformin with improved outcomes [26–30], indicating that the anticancer benefit of metformin in PCa may be context dependent.
Here, we investigate the relationship between NKX3.1 expression levels and response to metformin in PCa. We find that metformin rescues the adverse consequences of NKX3.1 loss for tumorigenesis, oxidative stress, and mitochondrial function. Correlative analyses of retrospective cohorts of RP and active surveillance biopsies show that only patients with low NKX3.1 expression benefit from taking metformin. Thus, an analysis of NKX3.1 expression levels during active surveillance may help identify patients likely to benefit most from metformin to prevent or delay PCa progression in a precision interception paradigm.
2. Patients and methods
2.1. Preclinical studies
Experiments using animals were performed according to Institutional Animal Care and Use Committee–approved protocols. Nkx3.1–/– mice were described [12]. LNCaP cells were obtained from ATCC [31]. Lists of antibodies, shRNAs, and primers are provided in Supplementary Tables 1 and 2.
2.2. Patient cohorts and analyses
All studies using human patients were conducted in accordance with recognized ethical guidelines and institutional review board–approved protocols. Patient characteristics are described in Table 1.
Table 1 –
Characteristics of patients in PCa cohorts
| Cohort 1 | Metformin (n = 38) | No metformin (n = 35) | p valuea |
|---|---|---|---|
| Radical prostatectomy Gleason score, n (%) | |||
| ≤6 | 20 (52.6) | 16 (45.7) | 0.6810 |
| 7 | 14 (36.8) | 15 (42.9) | 0.9025 |
| ≥8 | 4 (10.5) | 4 (11.4) | >0.9999 |
| PSA levels (ng/ml), median (range) | 6.36 (1.9–22.0) | 6.21 (2.1–21.3) | >0.9999 |
| EAU risk, n (%) | |||
| Low | 14 (36.8) | 15 (42.8) | 0.8853 |
| Intermediate | 18 (47.4) | 12 (34.3) | 0.9034 |
| High | 6 (15.8) | 8 (22.9) | >0.9999 |
| Cohort 2 | Metformin (n = 40) | No metformin (n = 98) | |
| Radical prostatectomy Gleason score, n (%) | |||
| ≤6 | 7 (17.5) | 25 (25.5) | 0.3452 |
| 7 | 18 (45) | 44 (44.9) | >0.9999 |
| ≥8 | 15 (37.5) | 29 (29.6) | 0.7697 |
| PSA levels (ng/ml), median (range) | 8.05 (2.8–28.6) | 7.20 (0.87–33.2) | >0.9999 |
| EAU risk, n (%) | |||
| Low | 7 (17.5) | 23 (23.4) | 0.4560 |
| Intermediate | 15 (37.5) | 45 (45.9) | 0.8503 |
| High | 18 (45) | 30 (30.6) | 0.9254 |
| Active surveillance cohort | Metformin (n = 9) | No metformin (n = 14) | |
| Biopsy Gleason score at diagnosis, n (%) | |||
| ≤ 6 | 5 (55.5) | 8 (57.1) | >0.9999 |
| 7 | 4 (44.4) | 6 (42.9) | >0.9999 |
| ≥8 | 0 (0) | 0 (0) | ND |
| PSA levels at diagnosis (ng/ml), median (range) | 2.67 (0.6–10.2) | 3.96 (0.1–7.6) | 0.3698 |
| EAU risk at diagnosis, n (%) | |||
| Low | 4 (44.4) | 8 (57.1) | 0.7865 |
| Intermediate | 5 (55.6) | 6 (42.9) | 0.9924 |
| High | 0 (0) | 0 (0) | ND |
| Latest biopsy Gleason score, n (%) | |||
| ≤6 | 6 (66.6) | 5 (35.7) | 0.9194 |
| 7 | 3 (33.3) | 9 (64.3) | 0.8943 |
| ≥8 | 0 (0) | 0 (0) | ND |
| Latest PSA levels (ng/ml), median (range) | 5.58 (0.4–10.7) | 5.52 (0.1–10.2) | >0.9999 |
| Latest EAU risk, n (%) | |||
| Low | 6 (66.6) | 5 (35.7) | 0.8965 |
| Intermediate | 3 (33.3) | 9 (64.3) | >0.9999 |
| High | 0 (0) | 0 (0) | ND |
EAU = European Association of Urology; ND = not determined because of insufficient number of cases; PCa = prostate cancer; PSA = prostate-specific antigen.
Statistical comparison between the metformin and no metformin groups based on a Welch t test; p < 0.05 was considered significant.
2.3. Statistical analyses
Pairs of experimental groups were compared for parameters of interest using a two-way analysis of variance, with Bonferroni correction (eg, vehicle- vs paraquat- vs metformin-treated samples/mice), where only two conditions were compared using a two-tailed two-sample Welch t test. Chi-square, and I2 index assessed statistical heterogeneity in biochemical recurrence (BCR) among different PCa patient populations. Multivariate and BCR-free survival analyses were performed using the Cox proportional hazard regression models and Kaplan-Meier curves, respectively. Statistical analyses and data visualization were done using GraphPad Prism software (version 9.5.1; GraphPad Software Inc., San Diego, CA, USA) and R (version 4.0.2; R Foundation for Statistical Computing, Vienna, Austria).
See the Supplementary material for details.
3. Results
3.1. Study design
To investigate the relationship between NKX3.1 expression and function, and metformin efficacy for PCa progression and disease outcome, we performed studies: (1) in vivo in Nkx3.1 wild-type (Nkx3.1+/+) or homozygous mutant (Nkx3.1–/–) mice (Fig. 1A), (2) in vitro and in vivo in LNCaP cells expressing endogenous NKX3.1 (control cells) or following its shRNA-mediated depletion (NKX3.1-depleted cells; Fig. 1B), and (3) in organotypic cultures from primary RPs expressing high or low levels of NKX3.1 (Fig. 1C.1). These functional studies were complemented by correlative analyses of NKX3.1 expression levels relative to metformin efficacy in retrospective cohorts of patients taking or not taking metformin, including two independent tissue microarray (TMA) RP cohorts (Fig. 1C.2) and an active surveillance cohort of prostate biopsies (Fig. 1C.3).
Fig. 1 –
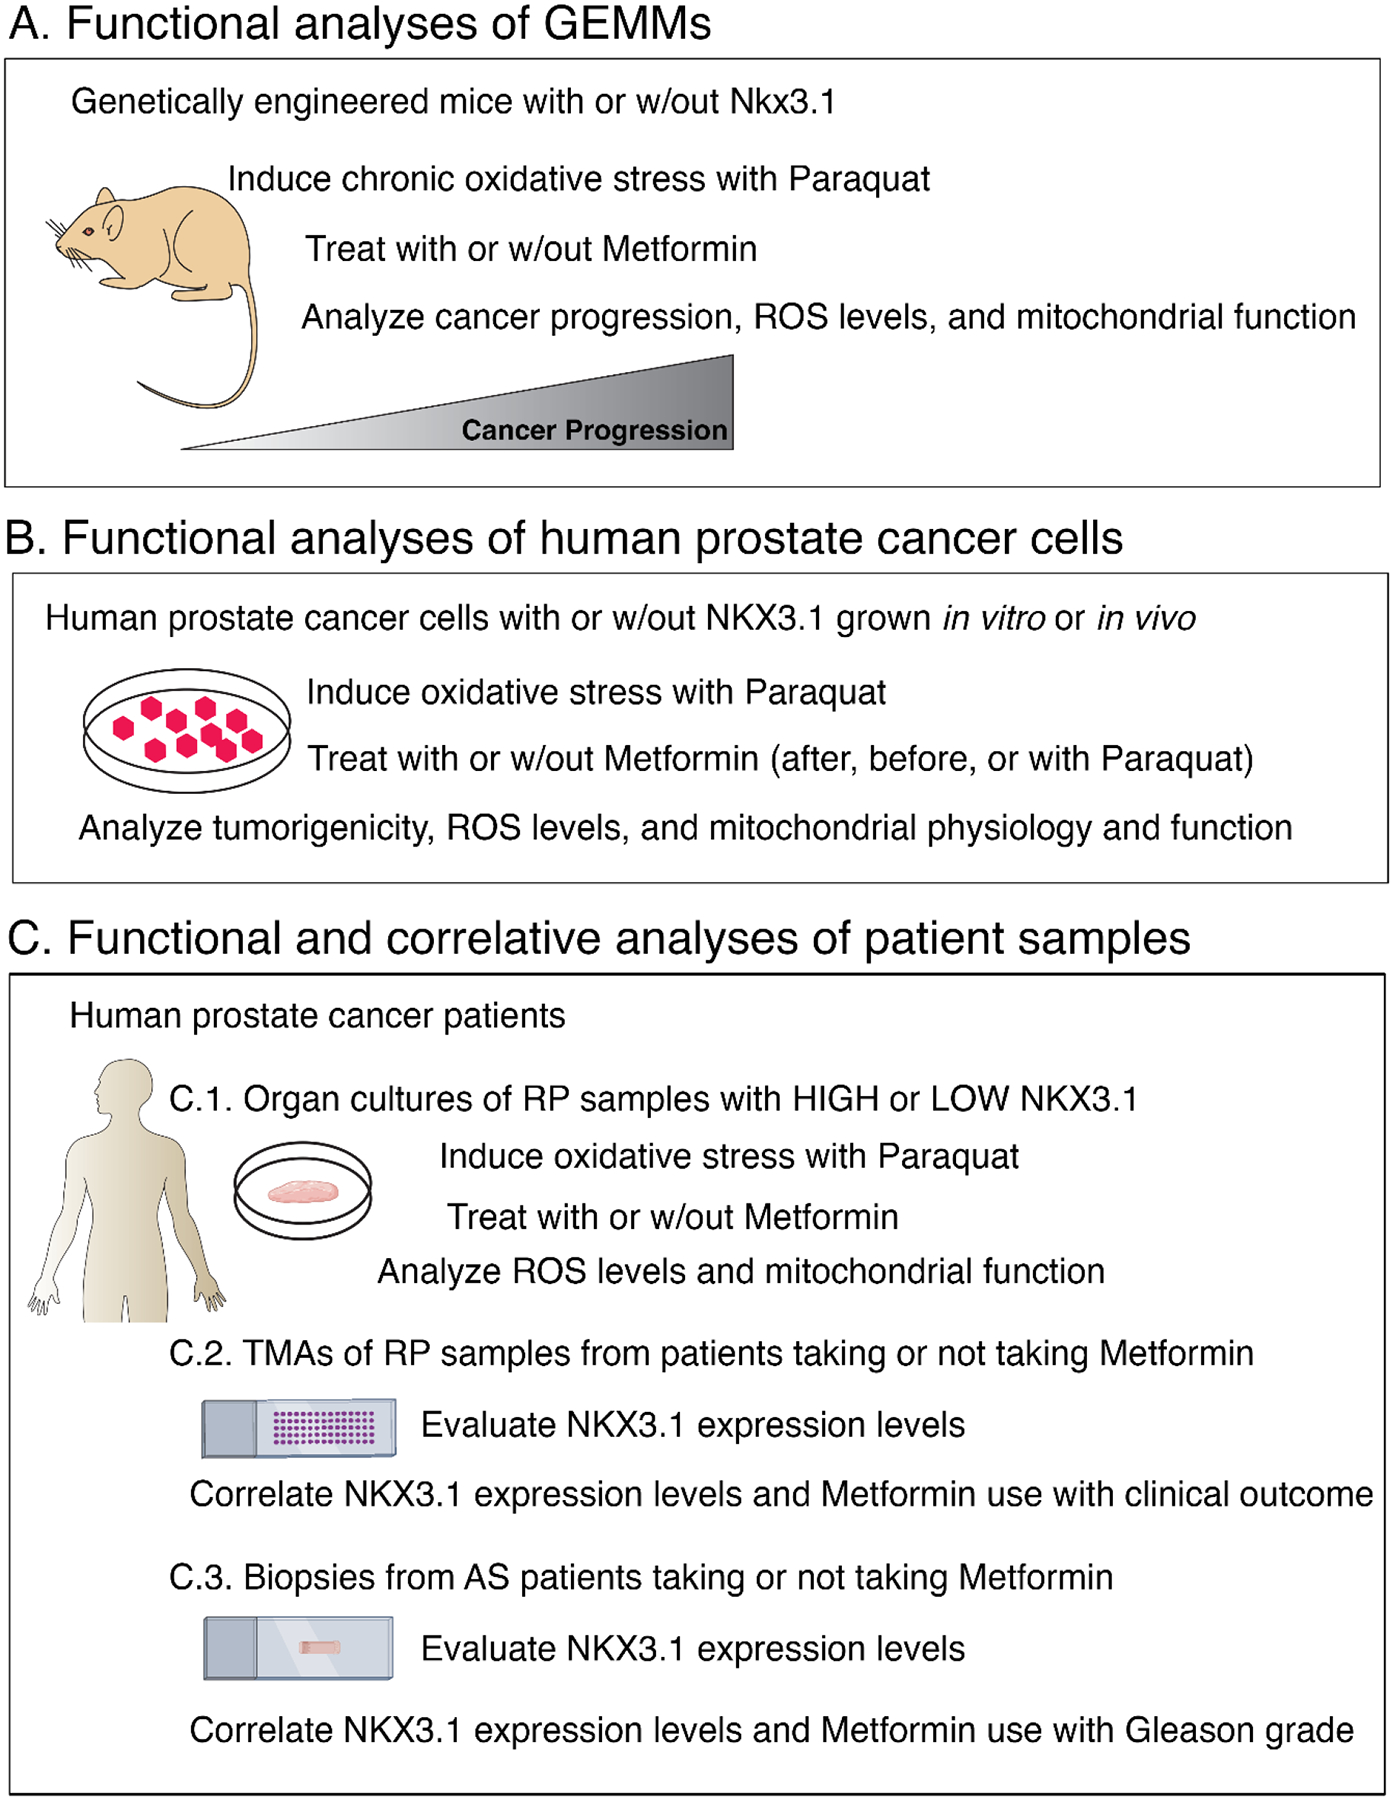
Overview. Experimental strategy showing: (A) functional analyses of Nkx3.1 GEMMs in vivo (schematic for Fig. 2), (B) functional analyses of human LNCaP prostate cancer cells in vitro and in vivo (schematic for Fig. 3 and 4), and (C) functional and correlative analyses of human patient samples including (C.1) organ cultures, (C.2) TMAs, and (C.3) biopsy cohorts (schematic for Fig. 5). See the text for further details.
AS = active surveillance; GEMM = genetically engineered mouse model; ROS = reactive oxygen species; RP = radical prostatectomy; TMA = tissue microarray; w/out = without.
We used paraquat to induce oxidative stress since it can be used in vitro and in vivo, and has been observed to have negligible effects other than in prostate (Supplementary Fig. 1A) [7]. Since dosage levels are known to dictate metformin activity and specificity [14,32], we determined the effective dose for reducing ROS and serum insulin levels without affecting body weight (Supplementary Fig. 1A–D). Subsequent studies were performed using 50 mg/kg/d in vivo and 50 μmol/l (50 μM) in vitro.
3.2. Metformin reverses oxidative stress–induced PCa progression in Nkx3.1 mutant mice
We previously showed that chronic levels of aberrant oxidative stress significantly increased high-grade prostatic intraepithelial neoplasia (HGPIN) in Nkx3.1–/– but not Nkx3.1+/+ mice, with a concomitant increase in ROS and mitochondrial defects [7]. In the current study, cohorts of mice were treated with paraquat for 6 mo to induce chronic oxidative stress [7], followed by treatment with metformin (or vehicle) for an additional 3 mo, and analyzed at 12 mo (Fig. 2A–G, and Supplementary Fig. 1A–C and 2A–D).
Fig. 2 –

Metformin reverses oxidative stress–induced PCa progression in Nkx3.1 mutant mice. (A) Experimental strategy: Nkx3.1 mutant (Nkx3.1–/–), but not wild-type (Nkx3.1+/+) mice develop high-grade prostatic intraepithelial neoplasia (HGPIN) by 12 mo of age after receiving paraquat (10 mg/kg/d in drinking water) for 9 mo. At 6 mo of paraquat treatment, cohorts of Nkx3.1+/+ and Nkx3.1–/– mice were randomly assigned to treatment with metformin (50 mg/kg/d in drinking water) or vehicle (water alone) and sacrificed at 12 mo of age for phenotypic and functional analyses as indicated. (B) Histopathological analyses. Shown are representative images of hematoxylin and eosin (H&E) staining and immunohistochemical (IHC) staining of anterior prostate from mice treated with vehicle alone, metformin, paraquat, or paraquat plus metformin, as indicated (15–20 per group). Scale bars represent 50 μm (low power) or 20 μm (high power). (C) Quantification of the PIN phenotype showing the relative percentage of occurrence of low-grade PIN (PIN1/2) and HGPIN (PIN3/4) in mice treated with vehicle alone (Veh), metformin (Met), paraquat (Par), or paraquat plus metformin (Par + Met). Data show the summary from analysis of 15–20 mice per group and are expressed as the mean percentage ± SD of the control; p values were calculated using chi-square test. (D) Quantification of Ki67 IHC staining from the anterior prostate of Nkx3.1+/+ or Nkx3.1–/– mice treated as indicated (five per group). (E) Quantification of mitochondrial ROS as detected by MitoSox fluorescence from the anterior prostate of Nkx3.1+/+ or Nkx3.1–/– mice treated as indicated (five per group). (F) Quantification of mitochondrial membrane potential as detected by TMRE fluorescence from the anterior prostate of Nkx3.1+/+ or Nkx3.1–/– mice treated as indicated (five per group). (G) Quantification of mitochondrial activity of ETC complexes I–V from isolated mitochondria of anterior prostatic tissues of Nkx3.1+/+ or Nkx3.1–/– mice treated as indicated (five samples per group). Figures 2E–G show data from three independent experiments. Unless otherwise indicated, p values were calculated using two-way ANOVA test. See also Supplementary Figures 1 and 2.
ANOVA = analysis of variance; ETC = electron transport chain; PCa = prostate cancer; ROS = reactive oxygen species; SD = standard deviation; TMRE = tetramethylrhodamine ethyl ester.
As observed previously, chronic oxidative stress, induced by paraquat, accelerated cancer progression of Nkx3.1–/– but not Nkx3.1+/+ mice. In particular, paraquat-treated Nkx3.1–/– mice had significantly increased HGPIN and cellular proliferation (p < 0.001; Fig. 2B–D). They also displayed increased oxidative stress, evident by increased expression of 4-hydroxynonenal (4HNE), a marker of lipid peroxidation (five per group; Fig. 2B) and increased mitochondrial ROS (p < 0.0001; Fig. 2E). The paraquat-treated Nkx3.1–/– mice also had impaired mitochondrial function, evident by a reduction in mitochondrial membrane potential (tetramethylrhodamine ethyl ester [TMRE]), reduced expression of electron transport chain (ETC) genes, reduced activity of all five ETC complexes (I–V) that regulate oxidative phosphorylation (OXPHOS; p < 0.03; Fig 2F and 2G, and Supplementary Fig. 2A), and increased serum insulin (p < 0.001; Supplementary Fig. 1B).
Strikingly, metformin abrogated all these effects in the Nkx3.1–/– mice (15–20 per group; Fig. 2B–G, and Supplementary Fig. 1B and 2A–D). In particular, metformin reduced the incidence of HGPIN and levels of cellular proliferation in paraquat-treated Nkx3.1–/– mice relative to non–paraquat-treated Nkx3.1–/– mice, while having no evident effect on non–paraquat-treated or paraquat-treated Nkx3.1+/+ mice (p < 0.001; Fig. 2B–D). This was also the case for expression levels of 4HNE, levels of mitochondrial ROS, TMRE, expression levels of mitochondrial ETC genes, activity levels of all five ETC complexes, and serum insulin levels (p < 0.004; Fig 2E–G; Supplementary Fig. 1B and 2A–D).
3.3. Metformin rescues mitochondrial function of NKX3.1-depleted human PCa cells
We performed comparable studies using LNCaP cells, an androgen-responsive PCa cell line that expresses endogenous NKX3.1 (Fig. 3A–K and 4A–H, Supplementary Fig. 3A–H and 4A–E, and Supplementary Table 3) [31]. We examined the consequences of metformin following induction of oxidative stress in control or NKX3.1-depleted LNCaP cells grown in culture or as xenograft tumors in vivo (Fig. 3A–C and 3I). As observed previously [7], paraquat treatment of NKX3.1-depleted, but not control, LNCaP cells significantly increased tumorigenicity in vitro, evidenced by increased proliferation, colony formation, and invasion (p < 0.003; Fig. 3B–G, and Supplementary Fig. 3A and 3B). Further, paraquat treatment of xenograft models harboring NKX3.1-depleted, but not control, LNCaP tumors accelerated tumorigenicity in vivo, as evident by increased tumor growth and tumor burden (p < 0.01; Fig. 3H–K, Supplementary Fig. 3E–H, and Supplementary Table 3).
Fig. 3 –
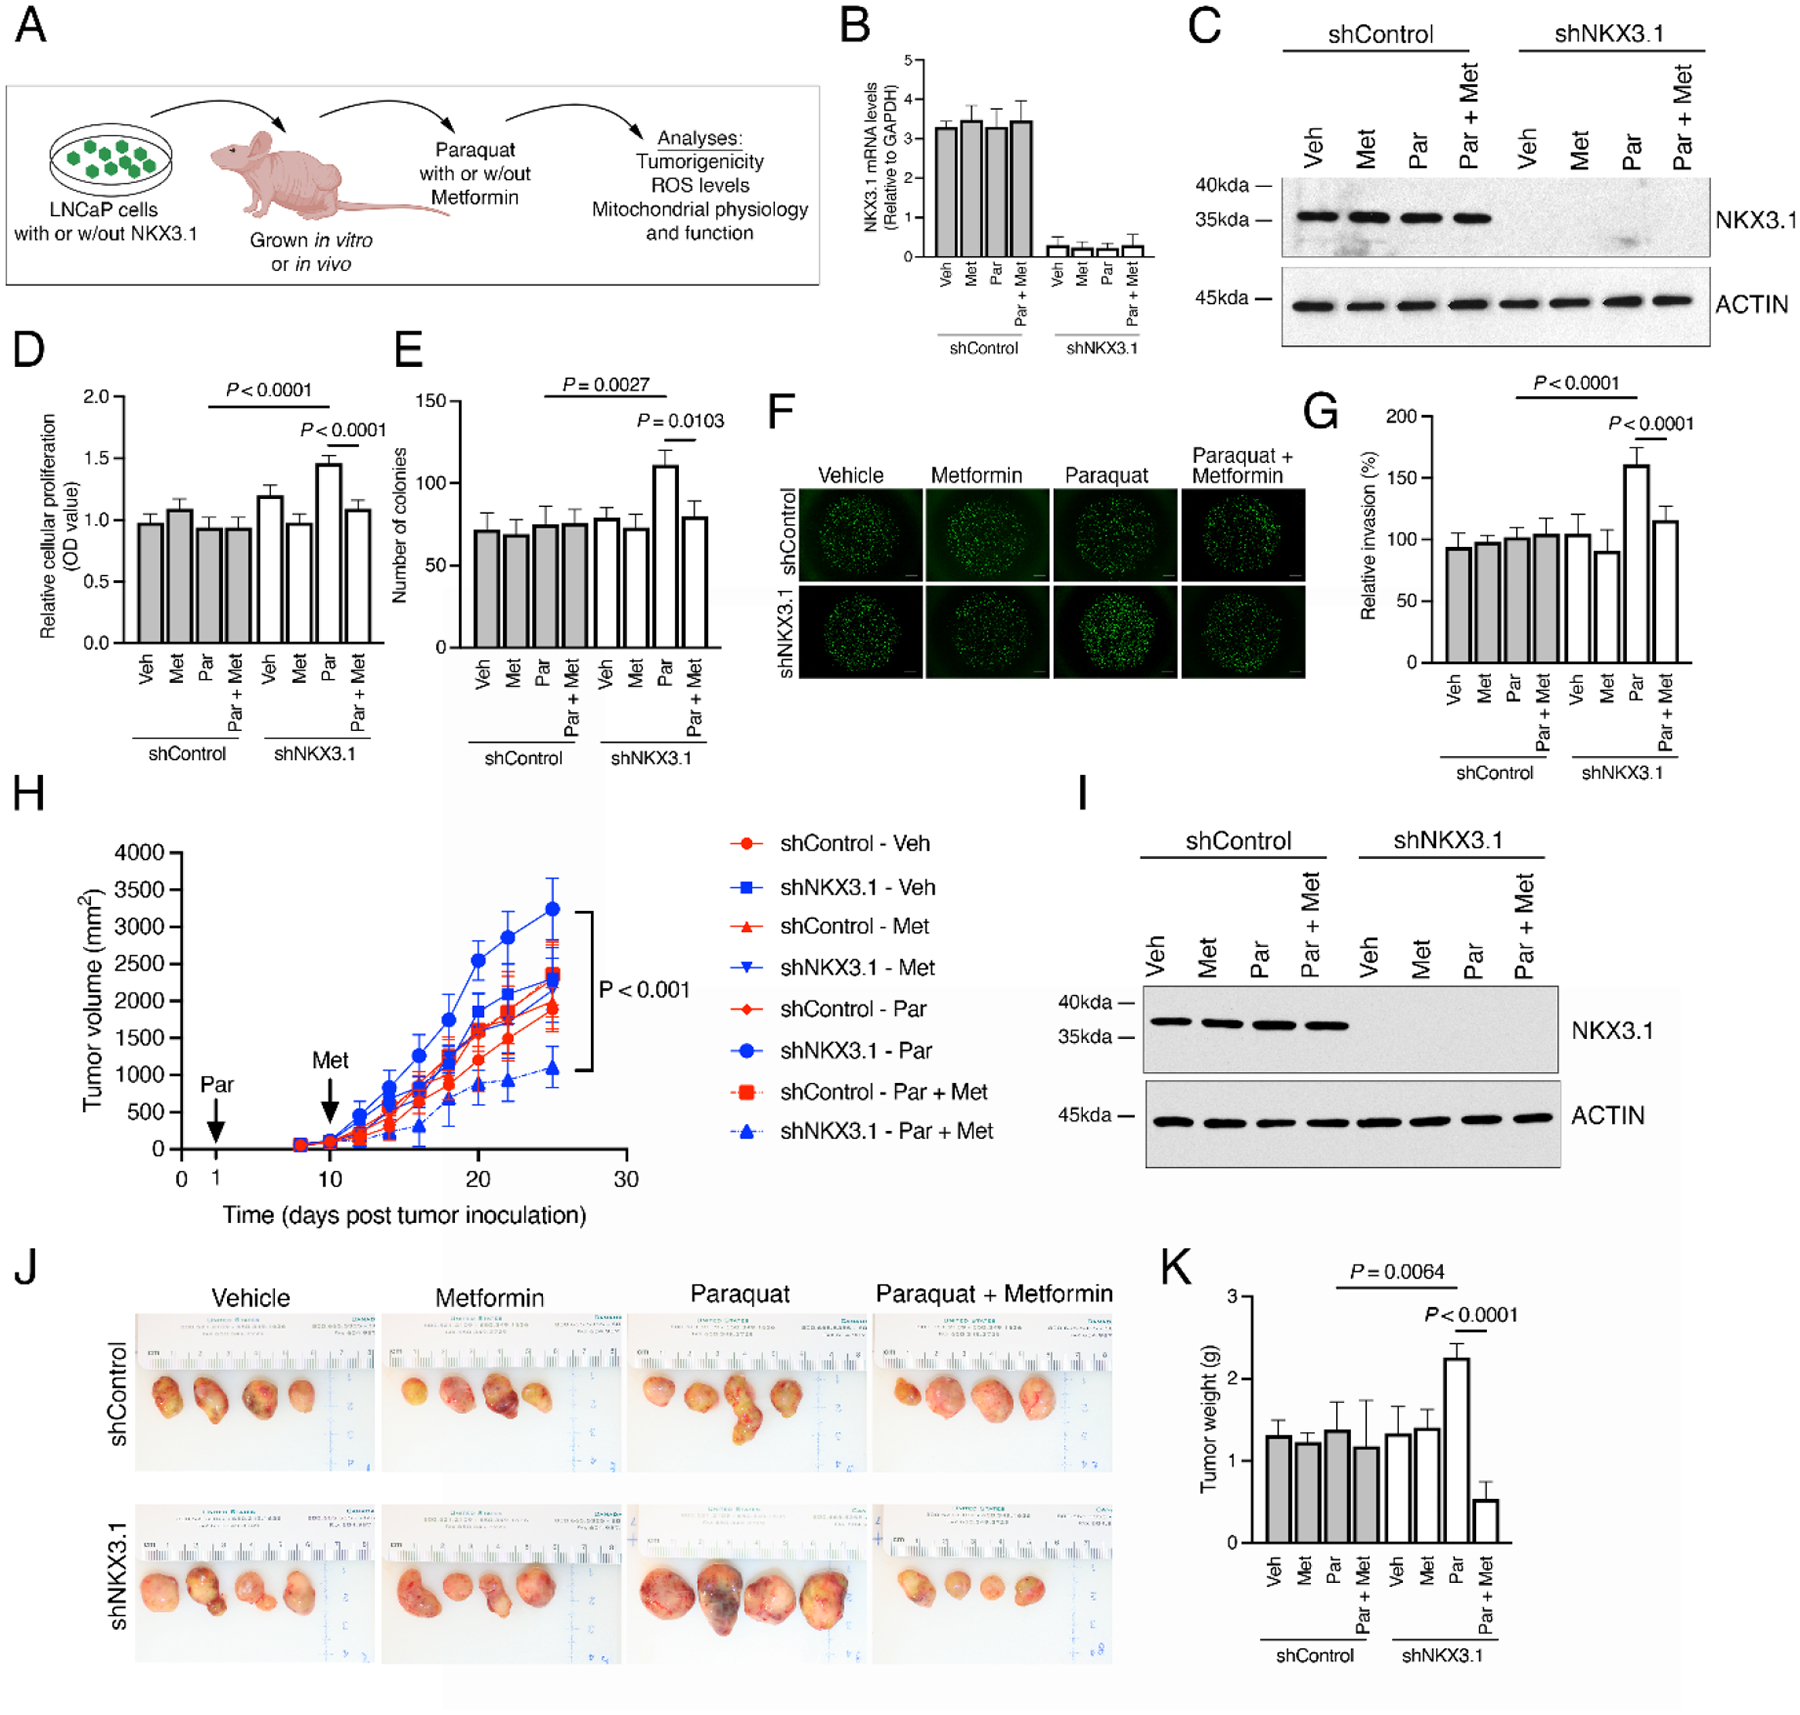
Metformin reduces oxidative stress–induced tumorigenicity in NKX3.1-depleted human PCa cells. (A) Experimental strategy. Studies were performed in human LNCaP cells expressing an shRNA for NKX3.1 (shNKX3.1) or the control (shControl) that were grown in vitro (B–G) or implanted under the flank of a nude mouse host and grown in vivo (H–K). (B–G) In vitro analyses. Cells were treated with vehicle or paraquat (100 μM for 24 h) followed by metformin (50 μM for 24 h) and functional analyses were performed as indicated. (B) Quantitative real-time PCR analysis showing relative expression of NKX3.1 (three per group). (C) Western blot analyses of total protein lysates in LNCaP cells expressing shNKX3.1 or shControl. (D) Quantification of cellular proliferation as detected by MTT absorbance. (E) Quantification of colony number by staining for crystal violet. (F) Representative images from Matrigel invasion assays. Scale bars represent 200 μm. (G) Quantification of Matrigel invasion assays. (H–K) In vivo analyses. (H) Experimental strategy. LNCaP cells expressing an shRNA for NKX3.1 (shNKX3.1) or the control (shControl) were implanted in the flanks of nude mouse hosts. Mice were treated with vehicle (water alone) or paraquat (10 mg/kg/d in drinking water) initiated on day 1, followed by vehicle or metformin (50 mg/kg/d in drinking water) initiated on day 10, and functional analyses were performed as indicated (four per group). (H) Summary of tumor volume changes during the treatment period. (I) Western blot analyses of total protein lysates from the LNCaP tumors. (J) Representative images of LNCaP tumors at the time of sacrifice. (K) Summary of tumor weights. Unless otherwise indicated, shown are representative data from three independent experiments. The p values were calculated using two-way ANOVA test and two-sample unpaired Welch t test. See also Supplementary Figures 1 and 3.
ANOVA = analysis of variance; Met = metformin; Par = paraquat; PCa = prostate cancer; PCR = polymerase chain reaction; ROS = reactive oxygen species; Veh = vehicle; w/out = without.
Fig. 4 –

Metformin restores mitochondrial function following oxidative stress of NKX3.1-depleted human PCa cells. (A) A schematic summarizing the effect of metformin on mitochondrial oxidative stress, respiration (OXPHOS), and glycolysis in NKX3.1-deficient prostate cancer cells. Studies were performed in human LNCaP cells expressing shRNA for NKX3.1 (shNKX3.1) or the control (shControl), treated with paraquat (100 μM for 24 h) followed by metformin (50 μM for 24 h) as in Figure 3. (B) Quantification of mitochondrial ROS as detected by MitoSox fluorescence. (C) Quantification relative mitochondrial mass as detected by MitoTracker Red CMXRos. (D) Quantification of mitochondrial membrane potential as detected by TMRE fluorescence. (E) Quantification of the activity of mitochondrial ETC complexes I–V (five samples per group). (F) Seahorse analyses of mitochondrial respiration as measured by oxygen consumption rate. (G) The rates of ATP-linked, maximal and reserve respiration were quantified by normalization of oxygen consumption rate levels to the total protein optical density (OD) values. (H) Quantification of intracellular pyruvate, acetyl-CoA, and L-lactate metabolic intermediates. Unless otherwise indicated, shown are representative data from three independent experiments. The p values were calculated using two-way ANOVA test and two-sample unpaired Welch t test. See also Supplementary Figures 1 and 4.
ANOVA = analysis of variance; ETC = electron transport chain; Met = metformin; Par = paraquat; PCa = prostate cancer; ROS = reactive oxygen species; TMRE = tetramethylrhodamine ethyl ester; Veh = vehicle.
Treatment of NKX3.1-depleted cells with paraquat resulted in a significant increase in ROS and impairment of mitochondrial function, evidenced by reduction in mitochondrial mass, TMRE, ETC gene expression, and activity of all five ETC complexes (p < 0.003; Fig. 4B–E and Supplementary Fig. 4A–D). Accordingly, paraquat treatment of NKX3.1-depleted cells resulted in decreased mitochondrial respiration and acetyl CoA levels, and increased L-lactate production and glycolytic capacity, while pyruvate was unchanged (p < 0.05; Fig. 4F–H and Supplementary Fig. 4E).
Notably, metformin rescued each of these effects in vitro and in vivo (Fig. 3A–K and 4A–H, and Supplementary Fig. 3A–H and 4A–E). In particular, following treatment with metformin, the levels of cellular proliferation, clonogenicity, and invasion of paraquat-treated NKX3.1-depleted cells were restored to those of non–paraquat-treated cells, while having no effect on non–paraquat-treated or paraquat-treated control cells (p < 0.05; Fig. 3B–G, and Supplementary Fig. 3A and 3B). In addition, metformin significantly reduced tumor growth and tumor burden, as well as serum insulin levels of paraquat-treated mice harboring NKX3.1-depleted LNCaP tumors (p < 0.05; Fig. 3H–K, Supplementary Fig. 3E and 3F, and Supplementary Table 3). When delivered prior to induction of oxidative stress, metformin also protected NKX3.1-depleted cells from paraquat, evident by reduced cellular proliferation and clonogenicity in vitro and tumor growth in vivo (p < 0.01; Supplementary Fig. 3C, 3D, 3G, and 3H).
With respect to mechanism, metformin reversed the adverse consequences of paraquat treatment of NKX3.1-depleted LNCaP cells for ROS, mitochondrial mass, membrane potential, ETC expression, and complex activity (p < 0.002; Fig. 4A–E and Supplementary Fig. 4A–D). Furthermore, metformin restored mitochondrial respiration and acetyl CoA levels, while reducing glycolytic capacity and L-lactate concentration of paraquat-treated NKX3.1-depleted LNCaP cells (p < 0.05; Fig. 4F–H and Supplementary Fig. 4E).
3.4. Compensatory activity of metformin in PCa patients with low NKX3.1
We evaluated metformin activity in human PCa using organotypic cultures of expressing “low” or “high” levels of NKX3.1 based on gene and protein levels (Fig. 5A–F) [7]. Paraquat treatment of cultures with low but not high NKX3.1 expression significantly increased mitochondrial ROS (five per group; p < 0.001; Fig. 5D), accompanied by impaired mitochondrial function, as evident by reduced mitochondrial ATP and increased accumulation of NADH (five per group; p < 0.0001; Fig. 5E and 5F). As in the genetically engineered mouse models and LNCaP models, metformin reversed these effects on mitochondrial ROS, while restoring mitochondrial ATP and NADH/NAD+ ratio to baseline levels (five per group; p < 0.0001; Fig. 5D–F).
Fig. 5 –

Compensatory activity of metformin in PCa patients with low NKX3.1. (A–F) Prostate tissue organotypic assay. (A) Experimental strategy. Primary human prostate tissues were obtained directly from surgery and treated in vitro with paraquat (100 μM for 24 h) followed by metformin (50 μM for 24 h), and functional analyses were performed as indicated. (B) Representative images of H&E and NKX3.1 immunostaining of organotypic cultures treated with vehicle alone, metformin, paraquat, or paraquat plus metformin as indicated. Scale bars represent 50 μ m. (C–F) Analyses of human prostate organotypic cultures having “high” versus “low” levels of NKX3.1 expression. (C) Heat map showing NKX3.1 expression levels determined by RT-qPCR analyses. Data are expressed as relative mRNA levels (relative to 18s rRNA expression) showing the mean ± SD. (D) Quantification of mitochondrial ROS as detected by MitoSox fluorescence (five per group). (E) Quantification of relative ATP levels. (F) Quantification of NADH/NAD+ ratio. Unless otherwise indicated, shown are representative data from three independent experiments. The p values were calculated using two-way ANOVA test and two-sample unpaired Welch t test. (G-L) Analyses of TMA cohorts. (G) Experimental strategy. Two independent PCa TMA cohorts were assembled from RP. Cohort 1 comprises 73 RPs from patients who were taking (n = 38) or not taking (n = 35) metformin. Cohort 2 comprises 138 RPs from patients who were taking (n = 40) or not taking (n = 98) metformin. (H) NKX3.1 protein expression levels were examined by immunohistochemistry (IHC). Representative cases showing examples of high or low NKX3.1 expression. Scale bars represent 100 μm. Kaplan-Meier survival analyses for (I) cohort 1 and (J) cohort 2 showing association of NKX3.1 protein expression levels, metformin intake, and BCR-free estimated survival probability. The p values were estimated using a log-rank test. Cox proportional multivariate analyses for (K) cohort 1 and (L) cohort 2 with pairwise, two- and three-way interaction modeling of NKX3.1 protein expression levels, European Association of Urology (EAU) risk, metformin intake, diabetic status (only cohort 2), and associated with risk of BCR. Hazard ratio (HR) and confidence interval (CI) are indicated; p values were estimated using a Wald test. Chi-square and I2 index analyses for subgroup heterogeneity testing are also indicated; p < 10 considered significant. (M–O) Analyses of an active surveillance cohort. (M) Experimental strategy. The cohort comprised prostate biopsies from 23 patients who had not failed active surveillance for ≥10 yr; nine of the patients were taking metformin and 14 were not. NKX3.1 immunostaining was performed on the initial biopsies (n = 23) and the most recent biopsies (n = 23) for each patient. Samples were analyzed for NKX3.1 expression levels and a change in Gleason Grade. (N) Representative cases showing examples of high or low NKX3.1 expression. Scale bars represent 50 μm. (O) Quantification of PCa upgrading or downgrading. See also Supplementary Figures 5 and 6.
ANOVA = analysis of variance; BCR = biochemical recurrence; H&E = hematoxylin and eosin; Met = metformin; Par = paraquat; PCa = prostate cancer; ROS = reactive oxygen species; RP = radical prostatectomy; RT-qPCR = reverse transcription quantitative polymerase chain reaction; SD = standard deviation; TMA = tissue microarray; Veh = vehicle; w/out = without.
We next examined the relationship of NKX3.1 protein expression levels and metformin intake for the risk of disease progression and clinical outcome (Fig. 5G–O, Table 1, Supplementary Fig. 5A, 5B, and 6A–F, and Supplementary Tables 4 and 5). We analyzed two independent retrospective TMA cohorts of RP specimens from benign and cancerous prostate from low-, intermediate-, or high-risk PCa patients [33]. European Association of Urology (EAU) guidelines classify low-risk patients as those having prostate-specific antigen (PSA) levels <10 ng/ml and Gleason score ≤6, intermediate-risk patients as those with PSA levels between 10 and 20 ng/ml and Gleason score = 7, and high-risk patients as those with PSA levels >20 ng/ml and Gleason score ≥8 [33].
Cohort 1 comprises RPs from 73 patients seen at the Medical University of Innsbruck (Austria); cohort 2 comprises RP specimens from 138 patients seen at the Department of Urology of Columbia University (USA). Approximately half of the patients in cohort 1 had type 2 diabetes and were taking metformin at the time of surgery (n = 38); the remainder had prediabetic status and were not taking metformin (n = 35; Table 1) [34]. For cohort 2, around one-third of the patients were taking metformin (n = 40); the rest were nondiabetic and not taking metformin or other antidiabetic drugs (n = 98; Table 1) [34]. In both cohorts, other parameters, such Gleason score and PSA, did not differ significantly between patients who were taking or not taking metformin (Table 1). Immunohistochemical analyses were used to assess NKX3.1 protein expression levels (Fig. 5G and 5H, and Supplementary Fig. 5A and 5B) [7]. Patients with low or high NKX3.1 expression were distributed among those taking or not taking metformin across Gleason grades and EAU risk groups (Supplementary Fig. 6A, 6B, 6D, and 6E).
A Kaplan-Meier survival analysis to evaluate the association with NKX3.1 expression levels and response to metformin based on BCR, the available clinical endpoint for both cohorts [7,34], revealed a striking association of NKX3.1 expression levels and metformin intake for the risk of disease progression (Fig. 5I and 5J). Notably, there was no/borderline association of BCR with EAU risk alone or with either NKX3.1 expression or metformin intake (Supplementary Fig. 6C and 6F). In both cohorts, patients with low NKX3.1 and taking metformin had significantly improved BCR-free survival compared with those not taking metformin (cohort 1, log-rank p = 0.0052; cohort 2, log-rank p = 9.3 × 10⁻⁶; Fig. 5I and 5J). Notably, patients with high NKX3.1 expression displayed no difference in survival regardless of whether they were taking or not taking metformin (Fig. 5I and 5J).
Chi-square and I2 index modeling revealed potentially substantial heterogeneity in BCR among our patient populations, supporting the inclusion of subgroup effects in the statistical modeling (cohort 1, I2 = 58%; cohort 2, I2 = 54%; Fig. 5K and 5L). We then fit multivariate Cox proportional hazard regression with covariates and their interaction terms to compare the effects of NKX3.1 expression, metformin treatment, and EAU risk across subgroups. Our analyses revealed a significant correlation of patients classified to have a high risk and low NKX3.1 expression with worst BCR-estimated survival outcome (cohort 1, adjusted hazard ratio [HR]: 4.69 [1.38–15.14], p = 0.009; cohort 2, adjusted HR: 4.67 [2.13–9.75], p < 0.0001; Fig. 5K and 5L, and Supplementary Tables 4 and 5) [33]. For cohort 2, which has a larger number of patients, low NKX3.1 expression was a univariate predictor of worst clinical outcome (adjusted HR: 2.36 [1.29–4.26]; p = 0.0057; Fig. 5L and Supplementary Table 5).
Furthermore, patients with low NKX3.1 and taking metformin were significantly correlated with more favorable BCR-estimated survival (cohort 1, adjusted HR: 0.02 [0.0007–0.42], p = 0.012; cohort 2, adjusted HR: 0.07 [0.01–0.33], p = 0.0009; Fig. 5K and 5L, and Supplementary Tables 4 and 5). In addition, high-risk patients in cohort 2 who had low NKX3.1 expression and were taking metformin were significantly correlated with favorable BCR-estimated survival outcome (adjusted HR: 0.39 [0.09–0.99], p = 0.0088; Fig. 5L and Supplementary Table 5). Diabetic status alone was not significantly correlated with disease outcome (Supplementary Table 5).
Lastly, we investigated the relationship of NKX3.1 expression levels and metformin response in patients monitored by active surveillance (Fig. 5M–O). We assembled a small retrospective cohort monitored by active surveillance at Columbia University for up to 10 yr, including nine patients taking metformin and 14 patients not taking metformin or any other antidiabetic drugs (n = 23 patients; Table 1). We examined the initial prostate biopsy and most recent repeat biopsy to assess Gleason grade and NKX3.1 protein expression. An analysis of Gleason grade in initial versus repeat biopsies revealed that of 23 patients, five were upgraded, three were downgraded, and 15 remained unchanged (Fig. 5O). Among patients with low NKX3.1, three of three patients taking metformin were downgraded, whereas three of four patients not taking metformin were upgraded (Fig. 5M and 5O). In contrast, most of the patients with high NKX3.1 (14/16) had no change in Gleason grade regardless of whether they were taking or not taking metformin (Fig. 5M and 5O).
4. Discussion
Despite promising effects in other cancers, until now, the benefit of metformin in PCa has been ambiguous [29,30]. Our current findings suggest that one of the reasons for its seemingly variable effects is that the metformin efficacy in PCa is related to the expression status of NKX3.1. Thus, our current findings suggest that only PCa patients with low NKX3.1 expression are likely to benefit from metformin.
Furthermore, our findings provide mechanistic insights regarding the context dependence of metformin activity in PCa. Reduced NKX3.1 expression promotes mitochondrial dysfunction and the risk of lethality [7]. Therefore, when NKX3.1 is low, metformin may delay PCa progression by reducing oxidative stress and promoting normal mitochondrial functioning, thereby overcoming the effects of NKX3.1 loss. Our findings are consistent with reports showing that metformin acts as a mitochondrial respiration catalyst in a dose- and tissue-dependent manner [19,35–37]. Further, in tumor-promoting conditions, metformin can regulate concentrations of rate-controlling tricarboxylic acid cycle and glycolytic intermediates, thereby restoring mitochondrial metabolic homeostasis [38]. Indeed, metformin doses similar to those used herein improve respiratory activity and normalize mitochondrial function in other disease contexts [16,32,39–41].
Since NKX3.1 undergoes allelic loss in ~80% of patients at early stages of PCa [11,42], men with low NKX3.1 should readily be identifiable by NKX3.1 expression analyses, especially during active surveillance monitoring, to determine whether they will benefit from the administration of metformin in a precision interception paradigm. Although, we cannot exclude the potential confounding impact of diabetic or metabolic syndrome status for outcome in larger clinical settings [28,43,44], our studies provide strong rationale for the application of evaluating NKX3.1 expression status in prospective clinical trials. We propose that NKX3.1 expression status could be assessed as a predictive response indicator for metformin in the ongoing Metformin Active Surveillance Trial (MAST; NCT01864096) and potentially help guide ongoing and future clinical trials.
5. Conclusions
Our data in PCa show that metformin can rescue the adverse consequences of oxidative stress when NKX3.1 is lost/reduced by protecting mitochondrial function. Our findings further suggest that patients with low NKX3.1 are likely to benefit most from metformin treatment, particularly in the setting of active surveillance. Prospective randomized controlled clinical trials are warranted to further evaluate the association of NKX3.1 expression and metformin usage in PCa.
Supplementary Material
Acknowledgments:
We thank Mark Stein and Izak Faiena for many helpful discussions, and Bing He, from the Department of Pathology and Laboratory Medicine, Weill Medical College of Cornell University, New York, NY, USA, for the NKX3.1 immunohistochemistry on the TMA. Figures 1C, 3A, 4A, 5A, 5G, and 5M were created (in part) with BioRender.com using an institutional license sponsored by Columbia University’s VP&S Office for Research.
Funding/Support and role of the sponsor:
Studies in this manuscript were supported by the Herbert Irving Comprehensive Cancer Center (HICCC) Flow Core and Molecular Pathology Core facilities, which are funded in part through National Institute of Health (NIH) Cancer Center Support Grant P30 CA013696. This work was supported by grants from the NIH (R01 CA173481, CA233176, and P01 CA265768; to Cory Abate-Shen) and an NIH/National Cancer Institute SPORE in Prostate Cancer (P50 CA211024; to Massimo Loda). Alexandros Papachristodoulou was supported by a Prostate Cancer Foundation (PCF) Young Investigator award (21YOUN32) and the HICCC 2022 Early Career Development and Postdoctoral Pilot awards. Work in the laboratory of Aditya Dutta is now supported by a UDRF Strategic Initiative Award and the Delaware INBRE program from the State of Delaware and a grant from the National Institute of General Medical Sciences (P20 GM103446) from the NIH. Cory Abate-Shen received American Cancer Society Research professorship and was supported in part by a generous gift from the F.M. Kirby Foundation (T.J. Martell).
Financial disclosures:
Cory Abate-Shen and Aditya Dutta certify that all conflicts of interest, including specific financial interests and relationships and affiliations relevant to the subject matter or materials discussed in the manuscript (eg, employment/affiliation, grants or funding, consultancies, honoraria, stock ownership or options, expert testimony, royalties, or patents filed, received, or pending) are the following: None.
Footnotes
Publisher's Disclaimer: This is a PDF file of an unedited manuscript that has been accepted for publication. As a service to our customers we are providing this early version of the manuscript. The manuscript will undergo copyediting, typesetting, and review of the resulting proof before it is published in its final form. Please note that during the production process errors may be discovered which could affect the content, and all legal disclaimers that apply to the journal pertain.
References
- [1].Siegel RL, Miller KD, Fuchs HE, Jemal A. Cancer statistics, 2022. CA Cancer J Clin 2022;72:7–33. [DOI] [PubMed] [Google Scholar]
- [2].Loeb S, Bruinsma SM, Nicholson J, et al. Active surveillance for prostate cancer: a systematic review of clinicopathologic variables and biomarkers for risk stratification. Eur Urol 2015;67:619–26. [DOI] [PMC free article] [PubMed] [Google Scholar]
- [3].Lovf M, Zhao S, Axcrona U, et al. Multifocal primary prostate cancer exhibits high degree of genomic heterogeneity. Eur Urol 2019;75:498–505. [DOI] [PubMed] [Google Scholar]
- [4].Sartor O, de Bono JS. Metastatic prostate cancer. N Engl J Med 2018;378:645–57. [DOI] [PubMed] [Google Scholar]
- [5].Papachristodoulou A, Abate-Shen C. Precision intervention for prostate cancer: reevaluating who is at risk. Cancer Lett 2022;538:215709. [DOI] [PMC free article] [PubMed] [Google Scholar]
- [6].Pastor-Navarro B, Rubio-Briones J, Borque-Fernando A, Esteban LM, Dominguez-Escrig JL, Lopez-Guerrero JA. Active surveillance in prostate cancer: role of available biomarkers in daily practice. Int J Mol Sci 2021;22:6266. [DOI] [PMC free article] [PubMed] [Google Scholar]
- [7].Papachristodoulou A, Rodriguez-Calero A, Panja S, et al. NKX3.1 Localization to mitochondria suppresses prostate cancer initiation. Cancer Discov 2021;11:2316–33. [DOI] [PMC free article] [PubMed] [Google Scholar]
- [8].Le Magnen C, Virk RK, Dutta A, et al. Cooperation of loss of NKX3.1 and inflammation in prostate cancer initiation. Dis Model Mech 2018;11:dmm035139. [DOI] [PMC free article] [PubMed] [Google Scholar]
- [9].Dutta A, Panja S, Virk RK, et al. Co-clinical analysis of a genetically engineered mouse model and human prostate cancer reveals significance of NKX3.1 expression for response to 5alpha-reductase inhibition. Eur Urol 2017;72:499–506. [DOI] [PMC free article] [PubMed] [Google Scholar]
- [10].Sfanos KS, Yegnasubramanian S, Nelson WG, De Marzo AM. The inflammatory microenvironment and microbiome in prostate cancer development. Nat Rev Urol 2018;15:11–24. [DOI] [PubMed] [Google Scholar]
- [11].Bowen C, Bubendorf L, Voeller HJ, et al. Loss of NKX3.1 expression in human prostate cancers correlates with tumor progression. Cancer Res 2000;60:6111–5. [PubMed] [Google Scholar]
- [12].Bhatia-Gaur R, Donjacour AA, Sciavolino PJ, et al. Roles for Nkx3.1 in prostate development and cancer. Genes Dev 1999;13:966–77. [DOI] [PMC free article] [PubMed] [Google Scholar]
- [13].Shen MM, Abate-Shen C. Roles of the Nkx3.1 homeobox gene in prostate organogenesis and carcinogenesis. Dev Dyn 2003;228:767–78. [DOI] [PubMed] [Google Scholar]
- [14].He L, Wondisford FE. Metformin action: concentrations matter. Cell Metab 2015;21:159–62. [DOI] [PubMed] [Google Scholar]
- [15].Algire C, Moiseeva O, Deschenes-Simard X, et al. Metformin reduces endogenous reactive oxygen species and associated DNA damage. Cancer Prev Res (Phila) 2012;5:536–43. [DOI] [PubMed] [Google Scholar]
- [16].Wang Y, An H, Liu T, et al. Metformin improves mitochondrial respiratory activity through activation of AMPK. Cell Rep 2019;29:1511–23 e5. [DOI] [PMC free article] [PubMed] [Google Scholar]
- [17].Wheaton WW, Weinberg SE, Hamanaka RB, et al. Metformin inhibits mitochondrial complex I of cancer cells to reduce tumorigenesis. Elife 2014;3:e02242. [DOI] [PMC free article] [PubMed] [Google Scholar]
- [18].Andrzejewski S, Gravel SP, Pollak M, St-Pierre J. Metformin directly acts on mitochondria to alter cellular bioenergetics. Cancer Metab 2014;2:12. [DOI] [PMC free article] [PubMed] [Google Scholar]
- [19].Lee J, Yesilkanal AE, Wynne JP, et al. Effective breast cancer combination therapy targeting BACH1 and mitochondrial metabolism. Nature 2019;568:254–8. [DOI] [PMC free article] [PubMed] [Google Scholar]
- [20].Evans JM, Donnelly LA, Emslie-Smith AM, Alessi DR, Morris AD. Metformin and reduced risk of cancer in diabetic patients. BMJ 2005;330:1304–5. [DOI] [PMC free article] [PubMed] [Google Scholar]
- [21].Franciosi M, Lucisano G, Lapice E, Strippoli GF, Pellegrini F, Nicolucci A. Metformin therapy and risk of cancer in patients with type 2 diabetes: systematic review. PLoS One 2013;8:e71583. [DOI] [PMC free article] [PubMed] [Google Scholar]
- [22].Lifshitz K, Ber Y, Margel D. Role of metabolic syndrome in prostate cancer development. Eur Urol Focus 2021;7:508–12. [DOI] [PubMed] [Google Scholar]
- [23].Bansal D, Bhansali A, Kapil G, Undela K, Tiwari P. Type 2 diabetes and risk of prostate cancer: a meta-analysis of observational studies. Prostate Cancer Prostatic Dis 2013;16:151–8, S1. [DOI] [PubMed] [Google Scholar]
- [24].Patel T, Hruby G, Badani K, Abate-Shen C, McKiernan JM. Clinical outcomes after radical prostatectomy in diabetic patients treated with metformin. Urology 2010;76:1240–4. [DOI] [PubMed] [Google Scholar]
- [25].Rieken M, Kluth LA, Xylinas E, et al. Association of diabetes mellitus and metformin use with biochemical recurrence in patients treated with radical prostatectomy for prostate cancer. World J Urol 2014;32:999–1005. [DOI] [PubMed] [Google Scholar]
- [26].Wright JL, Stanford JL. Metformin use and prostate cancer in Caucasian men: results from a population-based case-control study. Cancer Causes Control 2009;20:1617–22. [DOI] [PMC free article] [PubMed] [Google Scholar]
- [27].Fall K, Garmo H, Gudbjornsdottir S, Stattin P, Zethelius B. Diabetes mellitus and prostate cancer risk; a nationwide case-control study within PCBaSe Sweden. Cancer Epidemiol Biomarkers Prev 2013;22:1102–9. [DOI] [PubMed] [Google Scholar]
- [28].Preston MA, Riis AH, Ehrenstein V, et al. Metformin use and prostate cancer risk. Eur Urol. 2014;66:1012–20. [DOI] [PubMed] [Google Scholar]
- [29].Feng T, Sun X, Howard LE, et al. Metformin use and risk of prostate cancer: results from the REDUCE study. Cancer Prev Res (Phila) 2015;8:1055–60. [DOI] [PMC free article] [PubMed] [Google Scholar]
- [30].Merrick GS, Bennett A, Couture T, Butler WM, Galbreath RW, Adamovich E. Metformin does not predict for prostate cancer diagnosis, grade, or volume of disease after transperineal template-guided mapping biopsy. Am J Clin Oncol 2017;40:353–7. [DOI] [PubMed] [Google Scholar]
- [31].Horoszewicz JS, Leong SS, Kawinski E, et al. LNCaP model of human prostatic carcinoma. Cancer Res 1983;43:1809–18. [PubMed] [Google Scholar]
- [32].Chandel NS, Avizonis D, Reczek CR, et al. Are metformin doses used in murine cancer models clinically relevant? Cell Metab 2016;23:569–70. [DOI] [PubMed] [Google Scholar]
- [33].Van den Broeck T, van den Bergh RCN, Briers E, et al. Biochemical recurrence in prostate cancer: the European Association of Urology Prostate Cancer Guidelines Panel recommendations. Eur Urol Focus 2020;6:231–4. [DOI] [PubMed] [Google Scholar]
- [34].Pircher A, Zieher M, Eigentler A, et al. Antidiabetic drugs influence molecular mechanisms in prostate cancer. Cancer Biol Ther 2018;19:1153–61. [DOI] [PMC free article] [PubMed] [Google Scholar]
- [35].Zadra G, Photopoulos C, Tyekucheva S, et al. A novel direct activator of AMPK inhibits prostate cancer growth by blocking lipogenesis. EMBO Mol Med 2014;6:519–38. [DOI] [PMC free article] [PubMed] [Google Scholar]
- [36].Larsen S, Rabol R, Hansen CN, Madsbad S, Helge JW, Dela F. Metformin-treated patients with type 2 diabetes have normal mitochondrial complex I respiration. Diabetologia 2012;55:443–9. [DOI] [PubMed] [Google Scholar]
- [37].Victor VM, Rovira-Llopis S, Banuls C, et al. Effects of metformin on mitochondrial function of leukocytes from polycystic ovary syndrome patients with insulin resistance. Eur J Endocrinol 2015;173:683–91. [DOI] [PubMed] [Google Scholar]
- [38].Martinez-Reyes I, Chandel NS. Mitochondrial TCA cycle metabolites control physiology and disease. Nat Commun 2020;11:102. [DOI] [PMC free article] [PubMed] [Google Scholar]
- [39].Li A, Zhang S, Li J, Liu K, Huang F, Liu B. Metformin and resveratrol inhibit Drp1-mediated mitochondrial fission and prevent ER stress-associated NLRP3 inflammasome activation in the adipose tissue of diabetic mice. Mol Cell Endocrinol 2016;434:36–47. [DOI] [PubMed] [Google Scholar]
- [40].Bharath LP, Agrawal M, McCambridge G, et al. Metformin enhances autophagy and normalizes mitochondrial function to alleviate aging-associated inflammation. Cell Metab 2020;32:44–55 e6. [DOI] [PMC free article] [PubMed] [Google Scholar]
- [41].Izzo A, Nitti M, Mollo N, et al. Metformin restores the mitochondrial network and reverses mitochondrial dysfunction in Down syndrome cells. Hum Mol Genet 2017;26:1056–69. [DOI] [PubMed] [Google Scholar]
- [42].Cancer Genome Atlas Research Network. The molecular taxonomy of primary prostate cancer. Cell 2015;163:1011–25. [DOI] [PMC free article] [PubMed] [Google Scholar]
- [43].Colicchia M, Morlacco A, Rangel LJ, Carlson RE, Dal Moro F, Karnes RJ. Role of metabolic syndrome on perioperative and oncological outcomes at radical prostatectomy in a low-risk prostate cancer cohort potentially eligible for active surveillance. Eur Urol Focus 2019;5:425–32. [DOI] [PubMed] [Google Scholar]
- [44].De Nunzio C, Brassetti A, Simone G, et al. Metabolic syndrome increases the risk of upgrading and upstaging in patients with prostate cancer on biopsy: a radical prostatectomy multicenter cohort study. Prostate Cancer Prostatic Dis 2018;21:438–45. [DOI] [PubMed] [Google Scholar]
Associated Data
This section collects any data citations, data availability statements, or supplementary materials included in this article.