Abstract
Background
Albuminuria, an important marker of decreased kidney function in chronic kidney disease (CKD), is not routinely used for CKD detection or proteinuria appearance. Its relationships with biochemical parameters and blood pressure in dogs are poorly understood.
Objectives
This study aimed to evaluate the relationship of albuminuria with various CKD markers, its correlation with the urinary protein to creatinine ratio (UPC), and hypertension in dogs with early stages of CKD. It also sought to determine the usability of the urinary albumin to creatinine ratio (UAC) for CKD screening.
Methods
The study reviewed records of 102 dogs, categorising them into four groups based on disease status. UAC and UPC ratio, biochemistry and haematology variables, age, and systolic blood pressure were determined.
Results
The Pearson's correlation coefficient between log‐transformed values of UPC and UAC was r = 0.902 (95% CI: 0.87 to 0.93). Median UAC ratio values were 2.1 mg/g for the Healthy control group (n = 17), 54.2 mg/g for early stages CKD (n = 42), 5.8 mg/g for Acute sick control (n = 30), and 104 mg/g for Chronic sick control (n = 13). Thresholding UAC ratio as an indicator for impaired kidney function with the threshold of 10 mg/g (established based on the receiver operating characteristic curve) had a sensitivity 81.8%, specificity of 89.4%, positive predictive value (PPV) 90%, and negative predictive value (NPV) 80.1%. The correlation of UAC with biochemistry and haematology variables was statistically significant; for SDMA (μg/L), it was r = 0.566 and for other variables, it was weak to moderate. UAC was markedly elevated in cases of severe hypertension.
Conclusions
UAC ratio was significantly different among dogs with impaired and not impaired kidney function. The correlation strength for the UAC and UPC ratios was high. UAC ratio may be a promising marker for proteinuria analysis in dogs with CKD or other kidney function alterations.
Keywords: albuminuria, canine, chronic kidney disease, hypertension, proteinuria, renal biomarkers
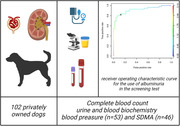
A total of 102 records were reviewed to establish the relationship between albuminuria and various markers of kidney function in canine chronic kidney disease. The urinary albumin to creatinine ratio significantly differed between dogs with impaired and nonimpaired kidney function. We propose a threshold for screening impaired kidney function.
1. INTRODUCTION
Chronic kidney disease (CKD) is considered a frequent pathology in routine small animal practice (Hall et al., 2018), mainly originating from damage to the glomerulus, the place of the kidney filtration barrier (Cianciolo et al., 2016; Nabity et al., 2012). The disease affected every canine age group, with a higher prevalence in older individuals (Kokkinos et al., 2022; O'Neill et al., 2013). Various causes were identified for this progressive disease, including different infections (e.g., leptospirosis (Di Azevedo et al., 2022), babesiosis (Karasová et al., 2022), leishmaniosis (Giapitzoglou et al., 2020)), glomerular diseases (Hokamp et al., 2016), ischaemic events (Brown et al., 2019; Polyak & Grosche, 2008), nephrotoxicity (De Santis et al., 2022), neoplasia (Crivellenti et al., 2016), urinary obstruction (Polzin & Cowgill, 2016) and genetic factors (Lingaas et al., 2023). Determining the correct etiology of CKD can be challenging (O'Neill et al., 2013; Perini‐Perera et al., 2021; Rudinsky et al., 2018). Dunaevich et al. (2020) explored this area in 2020; based on their research the etiology could not be determined reliably in up to 75% of CKD cases investigated. Therefore, CKD is more often described as an acquired condition than hereditary, and the etiology remains idiopathic (O'Neill et al., 2013; Rudinsky et al., 2018). The progression rate of CKD varies highly in individuals, either in a gradual fashion or as a result of acute kidney injury episodes (Dunaevich et al., 2020; Perini‐Perera et al., 2021). During the diagnosis of CKD in dogs, a number of markers are known to be associated with the progression and outcome of the disease, including proteinuria, hypertension, anaemia, creatinine and symmetric dimethylarginine (SDMA) blood levels (Perini‐Perera et al., 2021; Rudinsky et al., 2018). However, the usability of these diagnostic markers is limited, and CKD is often diagnosed at late stages when the renal functions have already been irreversibly damaged (Finco & Duncan, 1976; Hall et al., 2016; Miyakawa et al., 2021; Sargent et al., 2021). Renal function is precisely established using the glomerular filtration rate (GFR) method. Rarely used plasma clearance of exogenous variables is considered the gold standard of GFR measurement (McKenna et al., 2020), whereas identifying serum creatinine (sCREAT) and SDMA levels are the main parameters used for GFR estimation for CKD detection and staging (Coyne et al., 2020; International Renal Interest Society (IRIS) staging system) because of their simple determination. Additional approach to the kidney functional investigation is the urinary albumin excretion measurement, serving as a marker of generalised vascular dysfunction (Butt et al., 2020).
Albuminuria is the most prominent sign of kidney glomeruli disease in humans and rodents (Comper et al., 2022). It is considered a negative prognostic factor since its presence and magnitude are associated with increased mortality. In dogs, albuminuria has been detected in many different diseases, such as hereditary familial glomerulopathies (Vaden, 2011), endocrinopathies (diabetes mellitus, hyperadrenocorticism) (García San José et al., 2020; Herring et al., 2014), infections (Kuleš et al., 2021) and systemic inflammatory response syndrome (Schaefer et al., 2011). In canines suffering from CKD, increased levels of albuminuria were described compared to healthy (Bacic et al., 2010; Smets et al., 2010) and normotensive dogs (Bacic et al., 2010). Albuminuria and hypertension were recognised to accompany the progression of CKD in humans (Butt et al., 2020). In canines, albuminuria is quantified using the urinary albumin to creatinine ratio (UAC) and negatively correlates with patient survival rates in critically ill dogs (Vaden et al., 2010).
According to the International Renal Interest Society (IRIS), it is recommended to test the urine for specific gravity, sediment activity, and urine protein to creatinine ratio (UPC) in cases of CKD. Proteinuria is a risk factor for CKD, and UPC is used for severity assessment. However, using UPC as a diagnostic marker is controversial because urine proteome is characterised by a more complex protein pattern indicating mixed proteinuria (Ferlizza et al., 2020), and the UPC ratio indicates only the severity of proteinuria without glomerular or tubular loss specification (Chacar et al., 2017; Ferlizza et al., 2020; Raila et al., 2014).
This retrospective study aimed to define the relationship of albuminuria to surrogate GFR markers (sCREAT, SDMA), compare albuminuria to proteinuria, and determine its relation to hypertension and IRIS stages 1 and 2 in CKD early cases.
2. MATERIALS AND METHODS
2.1. Study population
Records from privately owned dogs presented to the University Small Animal Clinic from May 2018 to December 2022 were reviewed. The overall number of canines included in this study was 102 and the dogs were further divided in 4 groups (G1–G4) based on their disease status. Disease status comprises histories, physical examinations, complete blood count (CBC), serum biochemistry profiles and urinalysis. An additional study inclusion criterion was normal urine sediment activity in the sample. First included 17 healthy dogs (no assessed abnormalities), second group included 42 dogs diagnosed with CKD IRIS stage 1 and 2, third group included 30 acute sick dogs without kidney function alteration, and fourth group included 13 chronically ill dogs (Cushing's syndrome n = 8, diabetes mellitus n = 3, hypothyroidism n = 1). Additionally, based on the owner's consent, blood pressure was measured (n = 53), and SDMA was added to the serum biochemistry profile (n = 46). Of these, 37 dogs underwent both blood pressure measurement and SDMA assessment. Figure 1 summarises the study design.
FIGURE 1.
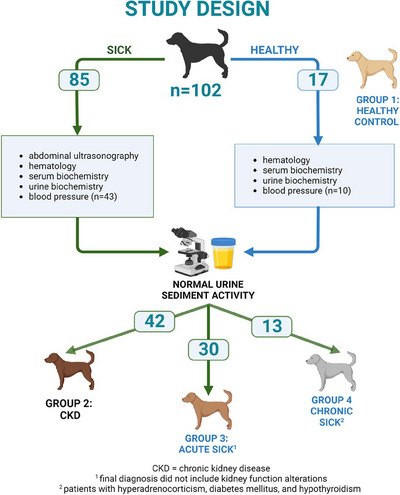
Flowchart of the research study.
2.2. Diagnostic criteria
The patient's age was corrected for weight according to the commonly used age/weight charts for pets (Metzger, 2023) and noted (see Figure S1). The UAC ratio was compared between the young, adult, senior and geriatric dogs.
Diagnosis of CKD was made based on clinical signs, alterations in the biochemistry profile (SDMA >14 μg/dL; sCREAT >133 μmol/L; blood urea nitrogen (BUN) >10.3 mmol/L), and abnormal kidney ultrasound findings (nodular lesions, hyper/hypoechoic kidney parenchyma, abnormalities). IRIS stage was established following board recommendation.
Evaluation of albuminuria was made based on the urinalysis, determining the levels of albumin and creatinine and calculating the urine albumin to creatinine ratio (UAC) using the following formula:
| (1) |
The albuminuria severity subgroups were based on the UAC ratio magnitude; values < 30 are considered physiological, microalbuminuria is classified as 30–300, and macroalbuminuria is defined as > 300 (Bacic et al., 2010).
Similarly, the urine protein to creatinine ratio (UPC) was calculated using the following formula:
| (2) |
The subgroups based on UPC were classified based on the severity; the nonproteinuric subgroup is defined by values < 0.2, the borderline subgroup is classified as 0.2–0.5, and values > 0.5 are considered proteinuric (IRIS).
Diagnosis of hypertension was made based on the measurement of systolic blood pressure (SBP) using an oscillometric device (Cardell Touch, Midmark, NY, USA) following the guidelines of the American College of Veterinary Internal Medicine (ACVIM). Systemic hypertension was classified as ≥ 160 mm Hg, and the SBP of the normotensive group was defined as ≤ 159 mm Hg (Acierno et al., 2018).
Diagnosis of hyperadrenocorticism (n = 7), diabetes mellitus (n = 4), and hypothyroidism (n = 1) was based on recommendations (Gilor & Graves, 2011; Panciera, 2013; Reusch et al., 1993).
The acutely ill patients (G3; n = 30) included dogs presented to the ambulance with common clinical signs of anorexia (n = 8), lethargy (n = 12), diarrhoea (n = 8), vomiting (n = 9), and neurologic (n = 2), dental (n = 2), ophthalmic (n = 1), skin (n = 5) and orthopaedics (n = 3) problems. Their final diagnosis did not include kidney function alterations, and the problem was solved without progressing to a chronic state.
2.3. Procedures
A thorough physical examination was performed, and jugular vein blood was collected. Complete blood count was established using Sysmex XT‐2000iV haematology analyser (Sysmex Corporation, Kobe, Japan) or commercially available reference laboratory services (IDEXX Laboratories, Inc.). Similarly, a serum biochemistry profile was established (Abbott Architect c4000 clinical chemistry analyser, Abbott Laboratories, IL, USA, or IDEXX GmbH). Abdominal ultrasonography was performed by a trained examiner using a multifrequency (4–9 MHz) microconvex or multifrequency (4–12 MHz and 4–18 MHz) linear transducer (RS85 Prestige, Samsung Healthcare, Korea) in order to support the diagnosis. The reference range for BUN, sCREAT, SDMA, inorganic phosphate (P), potassium (K), magnesium (Mg), total protein (TP), albumin (Alb) and packed cell volume (PCV) are noted in Table S1.
Cystocentesis was performed on examination day. In some cases where owners rejected cystocentesis, free‐catch urine was collected. Urine‐specific gravity (USG) was determined using a manual refractometer (A. KRÜSS Optronic, GmbH, Hamburg, Germany). The dipstick test (HeptaPhan, Erba Lachema, s.r.o., Brno, Czech Republic) and dipslide urine culture (Uricult, Orion Diagnostica, Espoo, Finland) were also performed. The microscopic examination of native urine sediment was evaluated as described by Hřibová et al. (2019). For the purpose of the research, the activity of the sediment was defined as the detection of haematuria (>5 red blood cells per high power field), pyuria (>5 white blood cells per high power field) or bacteriuria. Urinary biochemistry was measured using the automated clinical chemistry assays urine/CSF protein, microalbumin and creatinine (ARCHITECT c4000 clinical chemistry analyser, Abbott Laboratories, IL, USA).
2.4. Statistical analyses
The UAC and UPC values present a heavily right‐tailed distribution and span several orders of magnitude (see Figure S2); the values were transformed by a base 10 logarithm before most analyses. The correlation between UAC and UPC was investigated using the Pearson's correlation coefficient for the log‐transformed values.
The nonparametric Wilcoxon rank‐sum test was used to investigate the difference between study groups. Note that as the test is based on ranks and not on the actual values and the logarithm is a monotonous transformation, the result of the Wilcoxon rank‐sum test is the same whether applied to the original or log‐transformed data. Confidence intervals were constructed by bootstrapping. (If a 95% confidence interval for mean/median/correlation coefficient does not include the value 0, the mean/median/coefficient is statistically significantly different from 0 at the alpha level of 5%.)
The false‐positive alpha level of 5 % was used to assess statistical significance. For tests of between‐group differences, the p‐values were corrected for multiple testing using the Holm method is separate families for each tested variable (Sections 3.4 and 3.5) (Holm, 1979).
The statistical analysis was performed using R version 4.2.2 (packages: readxl 1.4.2, dplyr 1.1.0, tidyr_1.3.0, Hmisc 4.8‐0, confintr 0.2.0, ggplot2 3.4.1).
The ROC curve (receiver operating characteristic curve) for UAC as an indicator of kidney function was constructed, and the identified threshold (UAC = 10 mg/g) was used to determine screening test adequacy in the 102 dogs from the 1 to 4 groups. The sensitivity, specificity, and positive and negative predictive values were determined while as positives we took patients with diagnosed CKD and dogs from the G4 and as negatives the healthy dogs and patients in the G3.
3. RESULTS
3.1. Study population
One hundred two dogs were enrolled in this study between 2018 and 2022, all living in the Czech Republic. Both pure breeds and mixed‐breed dogs were included. There were 44 different breeds, with 21 mixed‐breed dogs distributed among four analysed groups. The Healthy group included 17 dogs, with 5 being mixed breeds and 12 purebreds. The most common purebreds were Belgian Shepherds (3 dogs), Hungarian Vizslas (2 dogs) and seven other breeds each represented by one dog. The CKD group comprised 42 dogs, including 4 mixed breeds and 38 purebreds. The Yorkshire Terrier was the most common (7 dogs), followed by Chihuahuas (4 dogs), Golden Retrievers (3 dogs), Dachshunds (2 dogs), West Highland White Terriers (2 dogs), and 20 other breeds each represented by one dog. The third group, Acute Sick, included 30 dogs, 6 of which were mixed breeds, and 24 were various breeds. The most frequent breeds were Rottweilers (3 dogs) and Hungarian Vizslas (2 dogs), with 18 other breeds each represented by one dog. The fourth group, Chronic sick, consisted of 13 dogs, including 6 mixed breeds and 7 different purebreds. The age range of analysed dogs was 1–17 years, further divided into young (n = 27), adult (n = 37), senior (n = 37) and geriatric (n = 18) groups. The records of all 102 dogs were examined for UAC. The characteristics are summarised in Table 1.
TABLE 1.
Study population characteristics.
| Parameter | All | G1: Healthy control | G2: CKD | G3: Acute sick control | G4: Chronic sick control |
|---|---|---|---|---|---|
| Number of subjects | 102 | 17 | 42 | 30 | 13 |
| Females | 52 (51%) | 11 (65%) | 19 (45%) | 13 (43%) | 9 (69%) |
| Spayed (neutered) | 18 (7) | 3 (1) | 5 (5) | 7 (1) | 3 (0) |
| Age (median, range) (years) | 7 (1 to 17) | 2 (1 to 9) | 9 (1 to 17) | 4 (1 to 12) | 10 (3 to 14) |
| Weight (median, range) (kg) | 15.9 (1.3 to 101) | 20.8 (1.3 to 34) | 9.5 (1.5 to 42) | 25.5 (3.1 to 101) | 8.4 (2.5 to 51) |
| Number of breed (mixed breed) | 44 (21) | 9 (5) | 25 (4) | 20 (6) | 7 (6) |
3.2. Evaluation of UAC in the study population
The relationship between UAC and UPC was evaluated. Furthermore, we determined the predictive power of UAC in the screening tests.
3.2.1. UAC versus UPC
The Pearson's correlation coefficient between log‐transformed values of r = 0.91 (95% CI: 0.87 to 0.93) indicates a strong statistically significant association (Figure 2).
FIGURE 2.
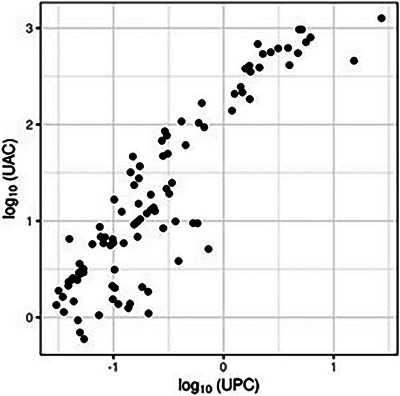
The correlation plot shows log(UPC) and log(UAC) dependence. Each point represents a single patient (n = 102).
Further, we describe the dataset according to established UPC and UAC levels where pathological proteinuria (UPC > 0.5) and albuminuria (UAC > 30) were defined. In 87.3% of cases (89/102), the indication of values as pathological agrees with UAC and UPC. In particular, 64 agreed with normal, and 25 agreed with the pathological cases. In 2.9% of cases (3/102), the indication of values as pathological was only determined by UPC, and in 9.8% of cases (10/102), only by UAC.
3.2.2. Determination of UAC adequacy for uses in the screening test
We determined UAC's predictive power in the kidney function screening tests. We constructed a ROC curve (receiver operating characteristic curve) shown in Figure 3. The threshold of UAC = 10 mg/g for indication of impaired kidney function was selected based on the curve. Table 2 summarises the efficacy of assessment of altered kidney function based on UAC values from analysed dogs (n = 102).
FIGURE 3.
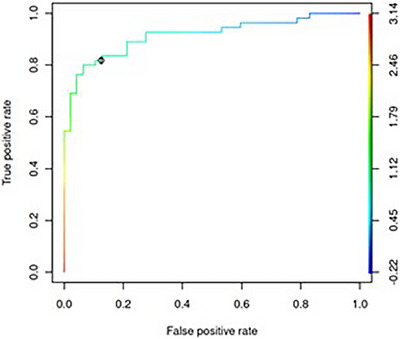
The ROC curve for the urinary albumin to creatinine ratio (UAC) as an indicator of impaired kidney function. The colour scale represents the base 10 logarithm of UAC as a threshold used to reduce kidney function. The area under the curve (AUC) is 0.92. The teal colour for value log10(UAC) = 1 represents the chosen threshold of UAC = 10 mg/g and is indicated in the plot. For this threshold, the false‐positive rate is 11% (therefore, specificity is 89%) and the true‐positive rate (sensitivity) is 82%.
TABLE 2.
The deriving sensitivity, specificity, and predictive value of the assessment of impaired kidney function based on UAC values (using established threshold) from analysed dogs.
| Value | Impaired kidney function | Normal kidney function | |
|---|---|---|---|
| UAC ≥ 10 | TP = 45 | FP = 5 |
PPV = TP/(TP+FP) 90.0% |
| UAC < 10 | FN = 10 | TN = 42 |
NPV = TN/(TN+FN) 80.1% |
|
Sen = TP/(TP+FN) 81.8% |
Spec = TN/(TN+FP) 89.4% |
Abbreviations: FN, false negative; FP, false positive; NPV, negative predictive value; PPV, positive predictive value; Sen, sensitivity; Spec, specificity; TN, true negative; TP, true positive; UAC, urinary albumin to creatinine ratio.
3.3. UAC association to haematology and serum biochemistry findings
The relationship between UAC levels and various haematology and biochemistry markers was analysed (Figure 4; and distributions of these variables are shown in Figure S6). As expected, the results of UAC significantly negatively correlated with the erythrocyte count. Similarly, creatinine, BUN, SDMA, and phosphorus statistically significantly correlated with UAC levels. Systolic blood pressure was also shown to correlate significantly with UAC. The numerical values are presented in Table 3.
FIGURE 4.
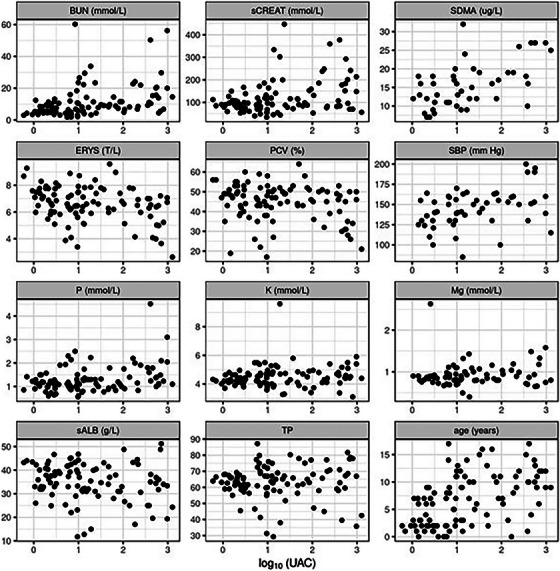
Correlation plots indicate the relation between log(UAC) and the investigated variables. Each point represents a single patient. BUN, blood urea nitrogen; ERYS, red blood cells; K, potassium; Mg, magnesium; P, phosphorus; PCV, packed cell volume; sALB, serum albumin; SBP, systolic blood pressure (n = 53); sCREAT, serum creatinine; SDMA, symmetric dimethylarginine (n = 46); TP, total protein.
TABLE 3.
Pearson's correlation coefficients between log(UAC) and various variables and corresponding 95% confidence intervals (CI).
| Variable | r | 95% CI lower bond | 95% CI upper bond |
|---|---|---|---|
| log10 (UPC) | 0.902 | 0.856 | 0.931 |
| sCREAT (mmol/L) | 0.331 | 0.161 | 0.486 |
| SDMA (μg/L) | 0.566 | 0.295 | 0.744 |
| BUN (mmol/L) | 0.369 | 0.158 | 0.518 |
| ERYS (T/L) | −0.332 | −0.514 | −0.142 |
| PCV (%) | −0.226 | −0.429 | −0.02 |
| sALB (g/L) | −0.173 | −0.36 | 0.038 |
| TP | 0.023 | −0.201 | 0.215 |
| SBP (mm Hg) | 0.388 | 0.095 | 0.603 |
| Age (years) | 0.495 | 0.338 | 0.615 |
| P (mmol/L) | 0.336 | 0.159 | 0.479 |
| K (mmol/L) | 0.116 | −0.048 | 0.297 |
| Mg (mmol/L) | 0.081 | −0.187 | 0.375 |
Note: The sign of the coefficient indicates the direction of the relationship (direct for positive and inverse for negative coefficient), and the magnitude of the coefficient indicates the strength of the relationship. Confidence intervals not including 0 indicate a statistically significant correlation.
Abbreviations: BUN, blood urea nitrogen; CI, confidence interval; ERYS, red blood cells; K, potassium; Mg, magnesium; P, phosphorus; PCV, packed cell volume; SBP, systolic blood pressure (n = 53); sCREAT: serum creatinine; SDMA: symmetric dimethylarginine (n = 46).
3.4. UAC in study groups
The levels of UAC and UPC in different study groups were examined and are presented graphically in Figure 5. Table 4 contains medians of UAC with their respective confidence intervals for all groups. The numerical values for UPC, log(UAC) and log(UPC) are presented in Table S2a–d, and all the confidence intervals are visualised in Figure S3.
FIGURE 5.
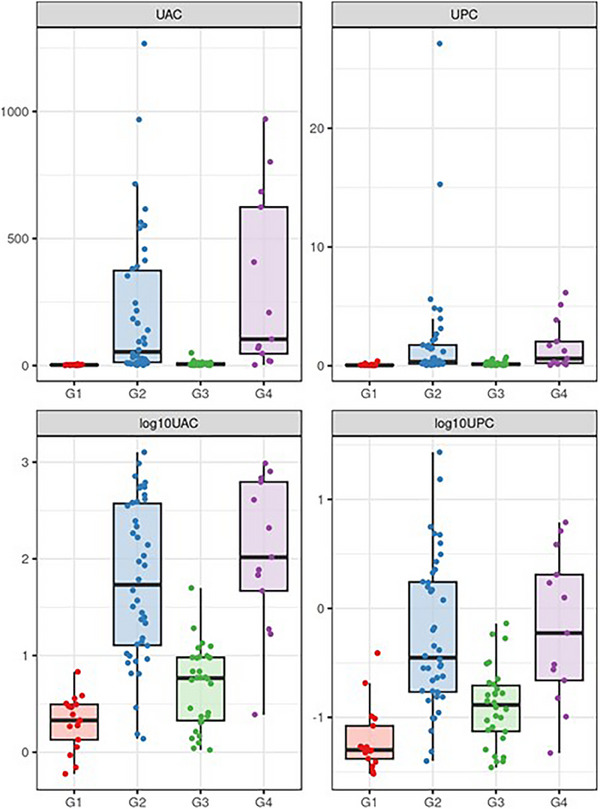
Distribution of UAC, UPC, log(UAC) and log(UPC) values in study groups. All values are shown as dots. The horizontal lines indicate medians; the boxes' bottom and top edges indicate the first and the third quartiles, respectively. G1, Healthy control; G2, CKD; G3, Acute sick control; G4, Chronic sick control.
TABLE 4.
Estimates and 95% confidence intervals for group medians of UAC.
| Study group | n | Median | 95% CI for median |
|---|---|---|---|
| G1: Healthy control | 17 | 2.1 | 1.4 to 3.1 |
| G2: CKD | 42 | 54.2 | 21.6 to 175.0 |
| G3: Acute sick control | 30 | 5.8 | 2.5 to 8.2 |
| G4: Chronic sick control | 13 | 104.0 | 40.6 to 624.0 |
Note: In contrast to box plots in Figure 5, the confidence intervals capture the uncertainty about the mean/median estimate and do not capture the distribution of the values in the population. Nonoverlapping confidence intervals indicate a statistically significant difference between groups. In some cases, there can be statistically significant differences even when the confidence intervals overlap slightly.
Abbreviation: CI, confidence interval.
Considering UAC, there is a statistically significant difference between groups CKD and Healthy controls (p < 0.001), CKD and Acute sick control (p < 0.001). Healthy Control significantly differed from the Acute sick control (p = 0.012). Similarly, both groups Healthy control and the Acute sick control significantly differed from the Chronic sick control group (p < 0.001 and p < 0.001, respectively). Groups CKD and Chronic sick control show no statistically significant difference (p = 0.204). These results of between‐group hypothesis tests are presented in a structured form in Table S3A and B).
The group medians and values differ except for the medians G2 and G4. Similarly, such values overlap markedly among G2 and G4. Therefore, the UAC values alone cannot classify subjects into groups. The only exception is between the groups with impaired (G2, G4) and not impaired kidney function (G1, G3), where the separation is almost complete, as seen in the log‐transformed form in Figure 5.
3.5. UAC versus age
The different age groups were compared based on their UAC levels (Figure 6). There is a clear trend of higher UAC values in older subjects. In particular, there are statistically significant differences between young and senior (p < 0.001), young and geriatric (p < 0.001), adult and senior (p = 0.028). Insignificant, there is a comparison between adult and geriatric (p = 0.057) dogs. Any differences there were not seen between senior and geriatric (p = 1.00) and young and adult (p = 0.172) dogs. Confidence intervals for means and medians of log(UAC) in age groups are shown graphically in Figure S4 and Table S4. Note that the lower values of UAC in younger individuals may be partly explained by the distribution of age among study groups, as seen in Figure S5.
FIGURE 6.
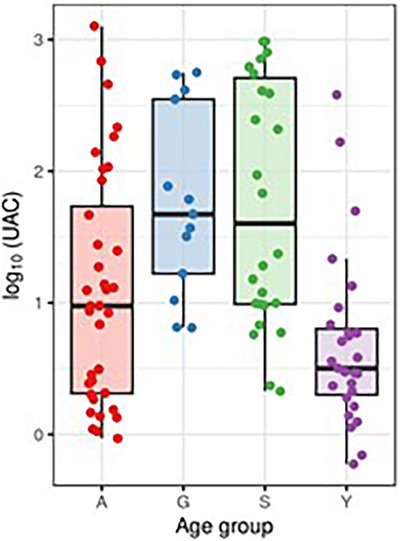
Distribution of log(UAC) values in different age groups. All values are shown as dots; the horizontal lines indicate medians, and the boxes' bottom and top edges indicate the first and third quartiles, respectively.
3.6. The relationship between UAC and hypertension
The correlation between log‐UAC and systolic blood pressure was calculated (r = 0.39, 95% CI: 0.11 to 0.60) to determine the relationship between UAC levels and hypertension among CKD. The values corresponding to hypertension are visually labelled in Figures 7 and 8.
FIGURE 7.
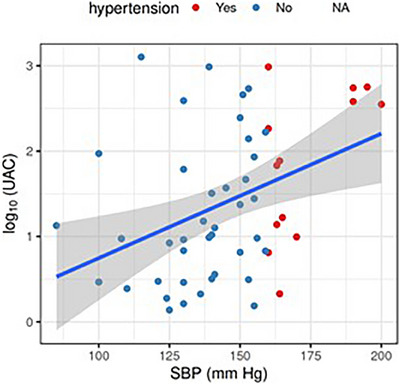
The correlation plot shows the dependence of SBP and log(UAC). The data points are shown in blue (no hypertension) or red (hypertension), regression line is shown in blue, with the shaded area representing the corresponding confidence interval. In particular, the regression line has an intercept estimated as −0.7 (95% CI −2.1 to 0.7) and a slope as 0.015 (95% CI 0.005 to 0.024). This can be understood as a ten‐fold increase in UAC per every 67 mm Hg increase in SBP.
FIGURE 8.
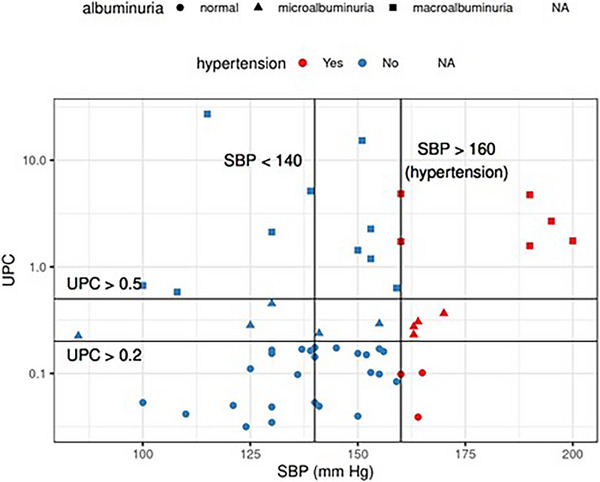
The dataset separated by both systolic blood pressure and severity of albuminuria (different symbols mark subjects). In a group with normal levels of albuminuria, 3 out of 28 subjects suffered from hypertension. In the microalbuminuria group, 4 out of 9 subjects suffered from hypertension. In the macroalbuminuria group, hypertension was diagnosed in 6 out of 16 subjects.
4. DISCUSSION
Our study comprehensively describes the relationship between the level of albuminuria and various markers of kidney function in dogs. While albuminuria is commonly used as a diagnostic marker to determine kidney function in human medicine (Wouters et al., 2015), it is not widely used in dogs. The results of our study indicate that albuminuria could be considered a potential marker for better characterisation of canine kidney function.
A published study recently defined the reference interval for dogs for UAC as 0–19 mg/g with an upper limit 90% CI of 13–28 mg/g and a maximum of 48 mg/g (Falus et al., 2022). The reference intervals commonly used in human medicine (Honetschlagerová et al., 2021) and used for previous canine studies (Bacic et al., 2010; Pasławska et al., 2020; Whittemore et al., 2006) are broader: 0–30 mg/g. For the calculation of the UAC and hypertension relationship in our study, we used the previous classification because of a simple comparison with previously published results.
Furthermore, albuminuria has been used for classifying CKD in humans (Fukuda et al., 2020; Nadasdy et al., 1999). In addition, Rudinsky et al. (2018) described that the UAC ratio was higher in dogs with CKD than in apparently healthy ones. Moreover, Miyakawa et al. (2021) reported that albuminuria was associated with a faster progression of nonazotemic proteinuric CKD. A minimum number of studies published have used UAC in the screening tests in dogs so far (Lyon et al., 2010; Miyakawa et al., 2021). Therefore, we first tried to describe the sensitivity, specificity and predictive values of albuminuria in screening tests for kidney function in relationship with CKD early stages. In previous studies, albuminuria was followed by inflammatory (Kuleš et al., 2021), metabolic (García San José et al., 2020) and renal diseases (Bacic et al., 2010). In our chromic sick group, albuminuria was higher than in the controls. Albuminuria is not specific for CKD but probably reveals kidney function decrease. This study encompasses dogs with various health conditions. The UAC ratio in dogs with altered kidney function (CKD and Chronic sick groups) was significantly different from that in dogs with normal kidney function (Healthy and Acute sick groups) at the time of diagnosis. However, UAC was not different among individual dogs from IRIS stages 1 and 2. UAC appears to be related to kidney function but lacks the reliability and precision to differentiate stages of CKD.
We established a UAC threshold of 10 mg/g using an ROC curve. Our research suggests that levels of UAC higher than 10 based on our analyses are indications for kidney biochemistry analyses, including the determination of SDMA. The GFR value is defined as the volume of ultra‐filtrate created in the glomeruli and correlates to the total amount of renal mass (Sargent et al., 2021). In clinical practice, serum SDMA combined with urine‐specific gravity is the most common marker of renal function. SDMA, an endogenous marker produced by all cells, is an indirect estimate of glomerular filtration, and its serum concentrations inversely correlate to GFR (Hall et al., 2016; Kielstein et al., 2006; Nabity et al., 2012). Our results, obtained from a group of 46 dogs (10 of which were healthy), show a significant correlation between albuminuria and SDMA. In contrast, creatinine was not elevated in all dogs with reduced kidney function and UAC levels over the threshold. Thus, UAC likely represents a more sensitive marker for reduced kidney function than routinely used serum creatinine. Reduced kidney function is a component not only of CKD but also can occur due to other chronic diseases (Cushing's (Smets et al., 2010), diabetes mellitus (Herring et al., 2014), hypothyroidism (van Hoek & Daminet, 2009)). A complete biochemical panel examination provides the necessary information for identifying the cause of reduced kidney function and finding the correct diagnosis.
Regarding the correlation of UAC levels with different ages, the data showed a noticeable trend of UAC rising with older dogs. The previous studies both confirm and disprove this observation (Falus et al., 2022; Smets et al., 2010). The incidence of CKD rises with age, which is also shown in our study population, as the median age for the CKD group is higher compared to apparently healthy subjects or subjects without kidney function alteration. The reason for age association could be in the constitution of the study population. Older dogs tend to have health alterations more often; therefore, albuminuria seems more influenced by kidney function decrease than age.
The relationship between albuminuria and blood pressure was already described by Bacic et al. (2010), who stated that hypertensive individuals show a higher UAC ratio than normotensive individuals and that UAC is as useful marker as UPC for determining proteinuria. Our study confirms these conclusions with results based on a larger and more diverse study population, where a wider set of routine kidney variables was determined in all patients. Furthermore, the original study only included dogs with diagnosed CKD, whereas, in our study, groups with different clinical diagnoses are also included.
We compared UAC and UPC in two scenarios. First, we correlated the ratios among individual dogs. The correlation analysis revealed a very strong relationship between UAC and UPC in dogs with normal sediment, which was only slightly different. In the second case, we compared the classification of patients into ‘normal’, ‘border’ and ‘proteinuria’ groups against their classification into ‘normal’, ‘microalbuminuria’ and ‘macroalbuminuria’ groups, taking into account the detected level of systolic blood pressure. The classification of a patient according to UPC corresponded with their classification according to UAC.
This study has multiple limitations. First, serum biochemistry variables were measured in two laboratories with varying reference ranges. Second, the number of subjects in both the Chronic sick group and the Healthy control group was relatively low. Furthermore, the age structure of the Healthy group significantly differed from the rest of the groups. The analysis was conducted retrospectively, and although there were 27 young and 26 senior dogs in the entire sample, most of the young dogs were healthy while most of the senior dogs, and all geriatric dogs, were ill. Finally, the classification into IRIS staging subgroups was less accurate due to missing SDMA test results in some patients. In 14 cases, a dog was classified into an IRIS stage without SDMA values.
In conclusion, the study results show that the measurement of albuminuria in CKD patients might be a promising marker of proteinuria analysis in dogs. Among the analysed dogs, UAC strongly correlated with SDMA levels, as well as with the RBC haematology parameter. Through ROC analysis, we proposed a value of 10 mg/g as indicative of the need for a complete biochemical examination to assess the cause of kidney function alterations. In cases of severe hypertension, UAC levels were consistently elevated.
AUTHOR CONTRIBUTIONS
Conceptualisation: K.P. Methodology: K.P. and V.G. Software: J.M. Formal analysis: J.M. Investigation: K.P., V.G., M.V., P.P. and K.R. Resources: M.C. Data curation: K.P. Writing—original draft preparation: K.P. Writing—review and editing: K.P. and V.G. Visualisation: K.P. and J.M. Project administration: K.P and Z.F. Funding acquisition: M.C. All authors have read and agreed to the published version of the manuscript.
CONFLICT OF INTEREST STATEMENT
The authors declare no conflict of interest.
PEER REVIEW
The peer review history for this article is available at https://www.webofscience.com/api/gateway/wos/peer-review/10.1002/vms3.1403.
INFORMED CONSENT STATEMENT
The data published were collected with the owner's consent.
ETHICS STATEMENT
Authors declare no Institutional Review Board Statement or other approval was needed.
Supporting information
Supporting Information
ACKNOWLEDGEMENTS
This work was supported by the Internal Creative Agency of the University of Veterinary Sciences Brno project number 2022ITA16, and J.M. is supported by MH CZ – DRO (‘Institute for Clinical and Experimental Medicine – IKEM, IN 00023001’)
Paukner, K. , Filipejova, Z. , Mareš, J. , Vávra, M. , Rehakova, K. , Proks, P. , Gabriel, V. , & Crha, M. (2024). A comprehensive analysis of albuminuria in canine chronic kidney disease. Veterinary Medicine and Science, 10, e1403. 10.1002/vms3.1403
DATA AVAILABILITY STATEMENT
Data available on request.
REFERENCES
- International Renal Interest Society (IRIS) staging system. (accessed on April 10, 2023). Available online: http://www.iris‐kidney.com/
- Acierno, M. J. , Brown, S. , Coleman, A. E. , Jepson, R. E. , Papich, M. , Stepien, R. L. , & Syme, H. M. (2018). ACVIM consensus statement: Guidelines for the identification, evaluation, and management of systemic hypertension in dogs and cats. Journal of Veterinary Internal Medicine, 32, 1803–1822. 10.1111/jvim.15331 [DOI] [PMC free article] [PubMed] [Google Scholar]
- Bacic, A. , Kogika, M. M. , Barbaro, K. C. , Iuamoto, C. S. , Simões, D. M. , & Santoro, M. L. (2010). Evaluation of albuminuria and its relationship with blood pressure in dogs with chronic kidney disease. Veterinary Clinical Pathology, 39, 203–209. 10.1111/j.1939-165X.2009.00207.x [DOI] [PubMed] [Google Scholar]
- Brown, C. A. , Rissi, D. R. , Dickerson, V. M. , Davis, A. M. , Brown, S. A. , & Schmiedt, C. W. (2019). Chronic renal changes after a single ischemic event in an experimental model of feline chronic kidney disease. Veterinary Pathology, 56, 536–543. [DOI] [PubMed] [Google Scholar]
- Butt, L. , Unnersjö‐Jess, D. , Höhne, M. , Edwards, A. , Binz‐Lotter, J. , Reilly, D. , Hahnfeldt, R. , Ziegler, V. , Fremter, K. , Rinschen, M. M. , Ebert, L. K. , Castrop, H. , Hackl, M. J. , Walz, G. , Brinkkoetter, P. T. , Liebau, M. C. , Tory, K. , Hoyer, P. F. , Beck, B. B. , …, Brismar, H. (2020). A molecular mechanism explaining albuminuria in kidney disease. Nature Metabolism, 2, 461–474. 10.1038/s42255-020-0204-y [DOI] [PubMed] [Google Scholar]
- Chacar, F. , Kogika, M. , Sanches, T. R. , Caragelasco, D. , Martorelli, C. , Rodrigues, C. , Capcha, J. M. C. , Chew, D. , & Andrade, L. (2017). Urinary Tamm‐Horsfall protein, albumin, vitamin D‐binding protein, and retinol‐binding protein as early biomarkers of chronic kidney disease in dogs. Physiological Reports, 5, e13262. 10.14814/phy2.13262 [DOI] [PMC free article] [PubMed] [Google Scholar]
- Cianciolo, R. E. , Mohr, F. C. , Aresu, L. , Brown, C. A. , James, C. , Jansen, J. H. , Spangler, W. L. , van der Lugt, J. J. , Kass, P. H. , Brovida, C. , Cowgill, L. D. , Heiene, R. , Polzin, D. J. , Syme, H. , Vaden, S. L. , van Dongen, A. M. , & Lees, G. E. (2016). World small animal veterinary association renal pathology initiative: Classification of glomerular diseases in dogs. Veterinary Pathology, 53, 113–135. 10.1177/0300985815579996 [DOI] [PubMed] [Google Scholar]
- Comper, W. D. , Vuchkova, J. , & McCarthy, K. J. (2022). New insights into proteinuria/albuminuria. Frontiers in Physiology, 13, 991756. 10.3389/fphys.2022.991756 [DOI] [PMC free article] [PubMed] [Google Scholar]
- Coyne, M. , Szlosek, D. , Clements, C. , McCrann, D., 3rd , & Olavessen, L. (2020). Association between breed and renal biomarkers of glomerular filtration rate in dogs. The Veterinary Record, 187, e82. 10.1136/vr.105733 [DOI] [PMC free article] [PubMed] [Google Scholar]
- Crivellenti, L. Z. , Silva, G. E. , Borin‐Crivellenti, S. , Cianciolo, R. , Adin, C. A. , Dantas, M. , Dos Anjos, D. S. , Tinucci‐Costa, M. , & Santana, A. E. (2016). Prevalence of glomerulopathies in canine mammary carcinoma. PLoS ONE, 11, e0164479. 10.1371/journal.pone.0164479 [DOI] [PMC free article] [PubMed] [Google Scholar]
- De Santis, F. , Boari, A. , Dondi, F. , & Crisi, P. E. (2022). Drug‐dosing adjustment in dogs and cats with chronic kidney disease. Animals, 12, 262. [DOI] [PMC free article] [PubMed] [Google Scholar]
- Di Azevedo, M. I. N. , Santanna, R. , Carvalho‐Costa, F. A. , & Lilenbaum, W. (2022). The same strain leading to different clinical outcomes: The enigma behind the canine leptospirosis. Microbial Pathogenesis, 165, 105500. 10.1016/j.micpath.2022.105500 [DOI] [PubMed] [Google Scholar]
- Dunaevich, A. , Chen, H. , Musseri, D. , Kuzi, S. , Mazaki‐Tovi, M. , Aroch, I. , & Segev, G. (2020). Acute on chronic kidney disease in dogs: Etiology, clinical and clinicopathologic findings, prognostic markers, and survival. Journal of Veterinary Internal Medicine, 34, 2507–2515. 10.1111/jvim.15931 [DOI] [PMC free article] [PubMed] [Google Scholar]
- Falus, F. A. , Vizi, Z. , Szabó, K. É. , Müller, L. , Reiczigel, J. , Balogh, N. , & Manczur, F. (2022). Establishment of a reference interval for urinary albumin‐to‐creatinine ratio in dogs. Veterinary Clinical Pathology, 51(4), 585–590. 10.1111/vcp.13149 [DOI] [PMC free article] [PubMed] [Google Scholar]
- Ferlizza, E. , Isani, G. , Dondi, F. , Andreani, G. , Vasylyeva, K. , Bellei, E. , Almeida, A. M. , & Matzapetakis, M. (2020). Urinary proteome and metabolome in dogs (Canis lupus familiaris): The effect of chronic kidney disease. Journal of Proteomics, 222, 103795. 10.1016/j.jprot.2020.103795 [DOI] [PubMed] [Google Scholar]
- Finco, D. R. , & Duncan, J. R. (1976). Evaluation of blood urea nitrogen and serum creatinine concentrations as indicators of renal dysfunction: A study of 111 cases and a review of related literature. Journal of the American Veterinary Medical Association, 168, 593–601. [PubMed] [Google Scholar]
- Fukuda, A. , Minakawa, A. , Kikuchi, M. , Sato, Y. , Nagatomo, M. , Nakamura, S. , Mizoguchi, T. , Fukunaga, N. , Shibata, H. , Naik, A. S. , Wiggins, R. C. , & Fujimoto, S. (2020). Urinary podocyte mRNAs precede microalbuminuria as a progression risk marker in human type 2 diabetic nephropathy. Scientific Reports, 10, 18209. 10.1038/s41598-020-75320-1 [DOI] [PMC free article] [PubMed] [Google Scholar]
- García San José, P. , Arenas Bermejo, C. , Clares Moral, I. , Cuesta Alvaro, P. , & Pérez Alenza, M. D. (2020). Prevalence and risk factors associated with systemic hypertension in dogs with spontaneous hyperadrenocorticism. Journal of Veterinary Internal Medicine, 34, 1768–1778. 10.1111/jvim.15841 [DOI] [PMC free article] [PubMed] [Google Scholar]
- Giapitzoglou, S. , Saridomichelakis, M. N. , Leontides, L. S. , Kasabalis, D. , Chatzis, M. , Apostolidis, K. , Theodorou, K. , Roumpeas, E. , & Mylonakis, M. E. (2020). Evaluation of serum symmetric dimethylarginine as a biomarker of kidney disease in canine leishmaniosis due to Leishmania infantum . Veterinary Parasitology, 277, 109015. 10.1016/j.vetpar.2019.109015 [DOI] [PubMed] [Google Scholar]
- Gilor, C. , & Graves, T. K. (2011). Interpretation of laboratory tests for canine Cushing's syndrome. Topics in Companion Animal Medicine, 26, 98–108. 10.1053/j.tcam.2011.03.001 [DOI] [PubMed] [Google Scholar]
- Hall, J. A. , Fritsch, D. A. , Yerramilli, M. , Obare, E. , Yerramilli, M. , & Jewell, D. E. (2018). A longitudinal study on the acceptance and effects of a therapeutic renal food in pet dogs with IRIS‐Stage 1 chronic kidney disease. Journal of Animal Physiology and Animal Nutrition, 102, 297–307. 10.1111/jpn.12692 [DOI] [PubMed] [Google Scholar]
- Hall, J. A. , Yerramilli, M. , Obare, E. , Yerramilli, M. , Almes, K. , & Jewell, D. E. (2016). Serum concentrations of symmetric dimethylarginine and creatinine in dogs with naturally occurring chronic kidney disease. Journal of Veterinary Internal Medicine, 30, 794–802. 10.1111/jvim.13942 [DOI] [PMC free article] [PubMed] [Google Scholar]
- Herring, I. P. , Panciera, D. L. , & Werre, S. R. (2014). Longitudinal prevalence of hypertension, proteinuria, and retinopathy in dogs with spontaneous diabetes mellitus. Journal of Veterinary Internal Medicine, 28, 488–495. 10.1111/jvim.12286 [DOI] [PMC free article] [PubMed] [Google Scholar]
- Hokamp, J. A. , Cianciolo, R. E. , Boggess, M. , Lees, G. E. , Benali, S. L. , Kovarsky, M. , & Nabity, M. B. (2016). Correlation of urine and serum biomarkers with renal damage and survival in dogs with naturally occurring proteinuric chronic kidney disease. Journal of Veterinary Internal Medicine, 30, 591–601. 10.1111/jvim.13832 [DOI] [PMC free article] [PubMed] [Google Scholar]
- Holm, S. (1979). A simple sequentially rejective multiple test procedure. Scandinavian Journal of Statistics, 6, 65–70. [Google Scholar]
- Honetschlagerová, Z. , Škaroupková, P. , Kikerlová, S. , Husková, Z. , Maxová, H. , Melenovský, V. , Kompanowska‐Jezierska, E. , Sadowski, J. , Gawrys, O. , Kujal, P. , Červenka, L. , & Čertíková Chábová, V. (2021). Effects of renal sympathetic denervation on the course of congestive heart failure combined with chronic kidney disease: Insight from studies with fawn‐hooded hypertensive rats with volume overload induced using aorto‐caval fistula. Clinical and Experimental Hypertension, 43, 522–535. 10.1080/10641963.2021.1907398 [DOI] [PubMed] [Google Scholar]
- Hřibová, B. , Ceplecha, V. , Rehakova, K. , Proks, P. , Gabriel, V. , Kohoutová, L. , & Crha, M. (2019). Causes of lower urinary tract disease in Czech cat population. Acta Veterinaria Brno, 88, 433–441. 10.2754/avb201988040433 [DOI] [Google Scholar]
- Karasová, M. , Tóthová, C. , Grelová, S. , & Fialkovičová, M. (2022). The etiology, incidence, pathogenesis, diagnostics, and treatment of canine babesiosis caused by Babesia gibsoni infection. Animals, 12, 739. [DOI] [PMC free article] [PubMed] [Google Scholar]
- Kielstein, J. T. , Salpeter, S. R. , Bode‐Boeger, S. M. , Cooke, J. P. , & Fliser, D. (2006). Symmetric dimethylarginine (SDMA) as endogenous marker of renal function – A meta‐analysis. Nephrology, Dialysis, Transplantation, 21, 2446–2451. 10.1093/ndt/gfl292 [DOI] [PubMed] [Google Scholar]
- Kokkinos, Y. , Morrison, J. , Bradley, R. , Panagiotakos, T. , Ogeer, J. , Chew, D. , O'Flynn, C. , De Meyer, G. , Watson, P. , & Tagkopoulos, I. (2022). An early prediction model for canine chronic kidney disease based on routine clinical laboratory tests. Scientific Reports, 12, 14489. 10.1038/s41598-022-18793-6 [DOI] [PMC free article] [PubMed] [Google Scholar]
- Kuleš, J. , Rubić, I. , Beer Ljubić, B. , Bilić, P. , Barić Rafaj, R. , Brkljačić, M. , Burchmore, R. , Eckersall, D. , & Mrljak, V. (2021). Combined untargeted and targeted metabolomics approaches reveal urinary changes of amino acids and energy metabolism in canine babesiosis with different levels of kidney function. Frontiers in Microbiology, 12, 715701. 10.3389/fmicb.2021.715701 [DOI] [PMC free article] [PubMed] [Google Scholar]
- Lingaas, F. , Tengvall, K. , Jansen, J. H. , Pelander, L. , Hurst, M. H. , Meuwissen, T. , Karlsson, Å. , Meadows, J. R. S. , Sundström, E. , Thoresen, S. I. , Arnet, E. F. , Guttersrud, O. A. , Kierczak, M. , Hytönen, M. K. , Lohi, H. , Hedhammar, Å. , Lindblad‐Toh, K. , & Wang, C. (2023). Bayesian mixed model analysis uncovered 21 risk loci for chronic kidney disease in boxer dogs. PLoS Genetics, 19, e1010599. 10.1371/journal.pgen.1010599 [DOI] [PMC free article] [PubMed] [Google Scholar]
- Lyon, S. D. , Sanderson, M. W. , Vaden, S. L. , Lappin, M. R. , Jensen, W. A. , & Grauer, G. F. (2010). Comparison of urine dipstick, sulfosalicylic acid, urine protein‐to‐creatinine ratio, and species‐specific ELISA methods for detection of albumin in urine samples of cats and dogs. Journal of the American Veterinary Medical Association, 236, 874–879. 10.2460/javma.236.8.874 [DOI] [PubMed] [Google Scholar]
- McKenna, M. , Pelligand, L. , Elliott, J. , Walker, D. , & Jepson, R. (2020). Clinical utility of estimation of glomerular filtration rate in dogs. Journal of Veterinary Internal Medicine, 34, 195–205. 10.1111/jvim.15561 [DOI] [PMC free article] [PubMed] [Google Scholar]
- Metzger, F. L . (2023). Pet Age Chart Poster by IDEXX Laboratories, Inc. (accessed on 05.03.2023). Available online: https://www.idexx.com/media/filer_public/2b/ec/2bec3064‐dc04‐46a3‐a499‐7c52ea1ded13/pet‐age‐chart‐poster‐ca‐en.pdf
- Miyakawa, H. , Ogawa, M. , Sakatani, A. , Akabane, R. , Miyagawa, Y. , & Takemura, N. (2021). Evaluation of the progression of non‐azotemic proteinuric chronic kidney disease in dogs. Research in Veterinary Science, 138, 11–18. 10.1016/j.rvsc.2021.05.018 [DOI] [PubMed] [Google Scholar]
- Nabity, M. B. , Lees, G. E. , Cianciolo, R. , Boggess, M. M. , Steiner, J. M. , & Suchodolski, J. S. (2012). Urinary biomarkers of renal disease in dogs with X‐linked hereditary nephropathy. Journal of Veterinary Internal Medicine, 26, 282–293. 10.1111/j.1939-1676.2012.00891.x [DOI] [PubMed] [Google Scholar]
- Nadasdy, T. , Abdi, R. , Pitha, J. , & Slakey, D. , Racusen, L. (1999). Diffuse glomerular basement membrane lamellation in renal allografts from pediatric donors to adult recipients. The American Journal of Surgical Pathology, 23, 437–442. [DOI] [PubMed] [Google Scholar]
- O'Neill, D. G. , Elliott, J. , Church, D. B. , McGreevy, P. D. , Thomson, P. C. , & Brodbelt, D. C. (2013). Chronic kidney disease in dogs in UK veterinary practices: Prevalence, risk factors, and survival. Journal of Veterinary Internal Medicine, 27, 814–821. 10.1111/jvim.12090 [DOI] [PubMed] [Google Scholar]
- Panciera, D. (2013). Hypothyroidism in dogs. In Rand, J. (Ed.), Clinical endocrinology of companion animals (pp. 263–272). Wiley. [Google Scholar]
- Pasławska, U. , Szczepankiewicz, B. , Bednarska, A. , & Pasławski, R. (2020). Impact of high temperature on post‐exercise albuminuria in dogs. Animals, 10, 1988. [DOI] [PMC free article] [PubMed] [Google Scholar]
- Perini‐Perera, S. , Del‐Ángel‐Caraza, J. , Pérez‐Sánchez, A. P. , Quijano‐Hernández, I. A. , & Recillas‐Morales, S. (2021). Evaluation of chronic kidney disease progression in dogs with therapeutic management of risk factors. Frontiers in Veterinary Science, 8, 621084. 10.3389/fvets.2021.621084 [DOI] [PMC free article] [PubMed] [Google Scholar]
- Polyak, M. M. R. , & Grosche, A. (2008). Comparison of vasosol and University of Wisconsin Solutions on early kidney function after 24 hours of cold ischemia in a canine autotransplantation model. Journal of Surgical Research, 150, 255–260. 10.1016/j.jss.2007.11.727 [DOI] [PubMed] [Google Scholar]
- Polzin, D. J. , & Cowgill, L. D. (2016). Chronic kidney disease, an issue of veterinary clinics of North America: Small animal practice (Vol. 46). Elsevier Health Sciences. [Google Scholar]
- Raila, J. , Schweigert, F. J. , & Kohn, B. (2014). Relationship between urinary Tamm‐Horsfall protein excretion and renal function in dogs with naturally occurring renal disease. Veterinary Clinical Pathology, 43, 261–265. 10.1111/vcp.12143 [DOI] [PubMed] [Google Scholar]
- Reusch, C. E. , Liehs, M. R. , Hoyer, M. , & Vochezer, R. (1993). Fructosamine. Journal of Veterinary Internal Medicine, 7, 177–182. 10.1111/j.1939-1676.1993.tb03183.x [DOI] [PubMed] [Google Scholar]
- Rudinsky, A. J. , Harjes, L. M. , Byron, J. , Chew, D. J. , Toribio, R. E. , Langston, C. , & Parker, V. J. (2018). Factors associated with survival in dogs with chronic kidney disease. Journal of Veterinary Internal Medicine, 32, 1977–1982. 10.1111/jvim.15322 [DOI] [PMC free article] [PubMed] [Google Scholar]
- Sargent, H. J. , Elliott, J. , & Jepson, R. E. (2021). The new age of renal biomarkers: Does SDMA solve all of our problems? Journal of Small Animal Practice, 62, 71–81. 10.1111/jsap.13236 [DOI] [PubMed] [Google Scholar]
- Schaefer, H. , Kohn, B. , Schweigert, F. J. , & Raila, J. (2011). Quantitative and qualitative urine protein excretion in dogs with severe inflammatory response syndrome. Journal of Veterinary Internal Medicine, 25, 1292–1297. 10.1111/j.1939-1676.2011.00829.x [DOI] [PubMed] [Google Scholar]
- Smets, P. , Meyer, E. , Maddens, B. , & Daminet, S. (2010). Cushing's syndrome, glucocorticoids and the kidney. General and Comparative Endocrinology, 169, 1–10. 10.1016/j.ygcen.2010.07.004 [DOI] [PubMed] [Google Scholar]
- Smets, P. M. Y. , Meyer, E. , Maddens, B. E. J. , Duchateau, L. , & Daminet, S. (2010). Urinary markers in healthy young and aged dogs and dogs with chronic kidney disease. Journal of Veterinary Internal Medicine, 24, 65–72. 10.1111/j.1939-1676.2009.0426.x [DOI] [PubMed] [Google Scholar]
- Vaden, S. L. (2011). Glomerular disease. Topics in Companion Animal Medicine, 26, 128–134. 10.1053/j.tcam.2011.04.003 [DOI] [PubMed] [Google Scholar]
- Vaden, S. L. , Turman, C. A. , Harris, T. L. , & Marks, S. L. (2010). The prevalence of albuminuria in dogs and cats in an ICU or recovering from anesthesia. Journal of Veterinary Emergency and Critical Care, 20, 479–487. 10.1111/j.1476-4431.2010.00584.x [DOI] [PubMed] [Google Scholar]
- van Hoek, I. , & Daminet, S. (2009). Interactions between thyroid and kidney function in pathological conditions of these organ systems: A review. General and Comparative Endocrinology, 160, 205–215. 10.1016/j.ygcen.2008.12.008 [DOI] [PubMed] [Google Scholar]
- Whittemore, J. C. , Gill, V. L. , Jensen, W. A. , Radecki, S. V. , & Lappin, M. R. (2006). Evaluation of the association between microalbuminuria and the urine albumin‐creatinine ratio and systemic disease in dogs. Journal of the American Veterinary Medical Association, 229, 958–963. 10.2460/javma.229.6.958 [DOI] [PubMed] [Google Scholar]
- Wouters, O. J. , O'Donoghue, D. J. , Ritchie, J. , Kanavos, P. G. , & Narva, A. S. (2015). Early chronic kidney disease: Diagnosis, management and models of care. Nature Reviews Nephrology, 11, 491–502. 10.1038/nrneph.2015.85 [DOI] [PMC free article] [PubMed] [Google Scholar]
Associated Data
This section collects any data citations, data availability statements, or supplementary materials included in this article.
Supplementary Materials
Supporting Information
Data Availability Statement
Data available on request.


