

Key Points
Question
Can the accuracy of prognosis estimation be improved using a pathomics signature to identify patients who can benefit from adjuvant chemotherapy for stage III colon cancer?
Findings
In this prognostic study including 785 patients with stage III colon cancer, a high pathomics signature was associated with a poor prognosis. Further analysis revealed that patients with a low pathomics signature were likely to benefit from adjuvant chemotherapy.
Meaning
These findings suggest that the pathomics signature has the potential to guide individualized treatment regarding adjuvant chemotherapy in stage III colon cancer.
This prognostic study describes the development and validation of a pathomics signature to estimate prognosis and benefit from chemotherapy among patients with stage III colon cancer using hematoxylin-eosin–stained slides.
Abstract
Importance
The current TNM staging system may not provide adequate information for prognostic purposes and to assess the potential benefits of chemotherapy for patients with stage III colon cancer.
Objective
To develop and validate a pathomics signature to estimate prognosis and benefit from chemotherapy using hematoxylin-eosin (H-E)–stained slides.
Design, Setting, and Participants
This retrospective prognostic study used data from consecutive patients with histologically confirmed stage III colon cancer at 2 medical centers between January 2012 and December 2015. A total of 114 pathomics features were extracted from digital H-E–stained images from Nanfang Hospital of Southern Medical University, Guangzhou, China, and a pathomics signature was constructed using a least absolute shrinkage and selection operator Cox regression model in the training cohort. The associations of the pathomics signature with disease-free survival (DFS) and overall survival (OS) were evaluated. Patients at the Sixth Affiliated Hospital, Sun Yat-sen University, Guangzhou, China, formed the validation cohort. Data analysis was conducted from September 2022 to March 2023.
Main Outcomes and Measures
The prognostic accuracy of the pathomics signature as well as its association with chemotherapy response were evaluated.
Results
This study included 785 patients (mean [SD] age, 62.7 [11.1] years; 437 [55.7%] male). A pathomics signature was constructed based on 4 features. Multivariable analysis revealed that the pathomics signature was an independent factor associated with DFS (hazard ratio [HR], 2.46 [95% CI, 2.89-4.13]; P < .001) and OS (HR, 2.78 [95% CI, 2.34-3.31]; P < .001) in the training cohort. Incorporating the pathomics signature into pathomics nomograms resulted in better performance for the estimation of prognosis than the traditional model in a concordance index comparison in the training cohort (DFS: HR, 0.88 [95% CI, 0.86-0.89] vs HR, 0.73 [95% CI, 0.71-0.75]; P < .001; OS: HR, 0.85 [95% CI, 0.84-0.86] vs HR, 0.74 [95% CI, 0.72-0.76]; P < .001) and validation cohort (DFS: HR, 0.83 [95% CI, 0.82-0.85] vs HR, 0.70 [95% CI, 0.67-0.72]; P < .001; OS: HR, 0.80 [95% CI, 0.78-0.82] vs HR, 0.69 [0.67-0.72]; P < .001). Further analysis revealed that patients with a low pathomics signature were more likely to benefit from chemotherapy (eg, combined cohort: DFS: HR, 0.44 [95% CI, 0.28-0.69]; P = .001; OS: HR, 0.43 [95% CI, 0.29-0.64]; P < .001).
Conclusions and Relevance
These findings suggest that a pathomics signature could help identify patients most likely to benefit from chemotherapy in stage III colon cancer.
Introduction
Colorectal cancer (CRC) remains one of the leading causes of cancer-related death.1,2 Staging according to the tumor-node-metastasis (TNM) system has been widely used in clinical decision-making and prognostic assessment of CRC.3 The National Comprehensive Cancer Network guidelines recommend adjuvant chemotherapy for patients with lymph node metastasis (stage III) after curative resection.4 However, significant heterogeneity in clinical outcomes has been reported in patients with stage III colon cancer who receive similar treatments: the survival probability ranges from 15% to 75%.5,6,7 These findings suggest that the current TNM staging system fails to provide sufficient prognostic and adjuvant chemotherapy benefit information. Thus, new strategies are necessary for enhanced prognosis estimation, facilitating individualized therapy and improved outcomes for patients with stage III colon cancer.
The T stage is determined by hematoxylin-eosin (H-E)–stained slides of surgical specimens. However, this approach overlooks the histological and morphological features of tumor cells with its matrix. With the development of digital pathological equipment and decreasing storage costs, the application of digital pathology has generated considerable enthusiasm as a useful tool to assist pathologists in reporting the pathological results of tumor tissue.8,9 Importantly, digital H-E images combined with machine learning methods could objectively and automatically extract quantitative pathological information, so-called pathomics.10,11 Previous studies have indicated that pathomics combined with artificial intelligence algorithms can be used to estimate the prognosis of hepatocellular cancer, renal cell cancer, and colorectal cancer lung metastasis.12,13,14 These results suggest the significant potential of pathomics in providing personalized approaches to prognosis estimation and decision-making. Therefore, we hypothesized that pathomics features could provide information on prognosis and benefit from adjuvant chemotherapy.
In this study, we adopted a fully quantitative pathomics signature based on pathomics features extracted from digital H-E images and least absolute shrinkage and selection operator (LASSO) Cox regression to estimate disease-free survival (DFS) and overall survival (OS) and investigated whether the pathomics signature could classify patients with stage III colon cancer who may benefit from adjuvant chemotherapy.
Methods
Study Design
For this prognostic study, ethics approval was obtained from the institutional review boards of Nanfang Hospital of Southern Medical University and the Sixth Affiliated Hospital, Sun Yat-sen University. Patient informed consent was waived by the institutional review boards for this retrospective study because the study involves no more than minimal risk to participants and the waiver or alteration would not adversely affect the rights and welfare of the participants. This study followed the Transparent Reporting of a Multivariable Prediction Model for Individual Prognosis or Diagnosis (TRIPOD) reporting guideline.
The study design is presented in eFigure 1 in Supplement 1. The inclusion criteria were patients with a diagnosis of stage III primary colon cancer who underwent radical surgical resection, completed postoperative follow-up, and had clinicopathological characteristics data. Patients with any history of receiving chemotherapy or immunotherapy and multiple primary cancers were excluded. As a result, a total of 439 consecutive patients were included in the training cohort between January 2012 and December 2015 at Nanfang Hospital of Southern Medical University, Guangzhou, China. An independent validation cohort included 346 consecutive patients from January 2013 to December 2015 from the Sixth Affiliated Hospital, Sun Yat-sen University, Guangzhou, China, with the same inclusion and exclusion criteria. No patients had positive surgical margins, and the median (range) of lymph nodes retrieved was 31 (12-113) nodes. Baseline clinical data, including age, sex, differentiation status, carcinoembryonic antigen level, tumor location, tumor size, venous emboli and/or lymphatic invasion and/or perineural invasion (VELIPI), obstruction or perforation, depth of invasion (T stage), lymph node metastasis (N stage), receipt of adjuvant chemotherapy, and survival status regarding recurrence or death, were collected.
The standard chemotherapy after surgery is a combination of chemotherapies (fluorouracil, oxaliplatin, and leucovorin or capecitabine and oxaliplatin) given over a period of 6 months.4 Among patients who were unable to complete the full course of chemotherapy, those who received at least 3 months of chemotherapy were included in the chemotherapy group.
Digital Pathological Image Acquisition and Region of Interest Selection
First, 2 attending gastrointestinal pathologists who were blinded to the prognostic information used a microscope to initially review all H-E–stained slides of each patient. They reassessed the TNM stage based on the 8th edition American Joint Committee on Cancer (AJCC) staging criteria and selected the most represented depth of invasion in each slide for subsequent analysis. Then, formalin-fixed paraffin-embedded samples corresponding to representative slides were sectioned at a thickness of 5 μm and subjected to H-E staining. Quality control was performed by the director of the pathology department. Reproduction and reexamination were needed if H-E-stained slides have fragmentation, overlap, absence, or contamination. Subsequently, the digital pathological images of all H-E-stained slides were scanned by an Aperio ScanScope Scanner system (Leica Biosystems) with a 200× magnification. These images were stored in .svs format and managed with Aperio ImageScope software version 12.3.3 (Leica Biosystems). The tumor area of each digital pathological image was decided by the director of the pathology department. To improve efficiency, 1 pathologist randomly selected 10 nonoverlapping representative tiles containing the most tumor cells per representative slide with a field of view of 1000 × 1000 μm, which were then confirmed by another pathologist. Finally, the 10 selected representative tiles were saved as .tif files and color-normalized by the Macenko method for further analysis.15
Pathomics Feature Extraction
The pathomics features were extracted from the files using CellProfiler version 4.1.3, which is a free and open-source platform for the quantitative analysis of biological images.16 A total of 114 pathomics features were obtained (eTable 1 in Supplement 1). Details of the pathomics features can be found in the eMethods in Supplement 1.
Pathomics Signature Construction
The LASSO Cox regression model uses an L1 penalty to shrink the coefficients of each feature, and this model is a widely accepted method for survival analysis of high-dimensional data.17,18 In this study, we used LASSO Cox regression to select the most prognostic features and construct a calculation formula of the pathomics signature in the training cohort. Details of the LASSO Cox regression are provided in the eMethods in Supplement 1.
Prognostic Value of the Pathomics Signature
The cutoff value for the pathomics signature was selected using X-tile software version 3.6.1 (Yale School of Medicine) in the training cohort,19 and patients were divided into high and low pathomics signature groups for prognosis analyses. Then, the same cutoff value was applied to the validation cohort. The differences in the DFS and OS of the high and low pathomics signature groups were evaluated using the Kaplan-Meier method and compared by log-rank tests.20
Construction and Validation of the Pathomics Nomograms
In the training cohort, the pathomics signature and clinicopathological characteristics were included in univariate Cox regression analysis to analyze OS and DFS, and variables with P < .10 were selected in multivariable Cox regression analysis. Backward stepwise selection was applied to identify independent prognostic factors using the likelihood ratio test with Akaike information criterion as the stopping rule.21 Then, 2 pathomics nomograms were constructed based on independent factors for estimating DFS and OS.22,23
The discrimination of the pathomics nomograms was quantified using the area under the receiver operating characteristic curve (AUROC)20 and Harrell concordance index.24 The calibration curve was applied to compare the estimated survival probabilities with the actual probabilities.14 Decision curve analysis (DCA) was used to assess the clinical application value.25 Then, the pathomics nomograms were tested in the validation cohort to observe the discrimination, calibration, and clinical application value. Details of the nomogram and DCA are provided in the eMethods in Supplement 1.
Incremental Value of the Pathomics Signature for Survival Outcome Estimation
The incremental value of the pathomics signature to the TNM staging system and traditional models was assessed with respect to discrimination, calibration, clinical application value, net reclassification improvement, integrated discrimination improvement, and prediction error curve.26,27 Net reclassification improvement and integrated discrimination improvement are sensitive indicators to determine whether the new model has improved estimation ability compared with the old model (eMethods in Supplement 1).
Statistical Analysis
Continuous variables were analyzed using the t test, and categorical variables were analyzed using the χ2 test. The Kaplan-Meier method and log-rank test were used to evaluate DFS and OS. Univariate and multivariable analyses were performed using the Cox proportional hazards model, and hazard ratios (HRs) with 95% CIs were calculated. All statistical analyses were performed with SPSS version 22.0 software (IBM) and R version 4.0.3 (R Project for Statistical Computing). All P values were 2-sided, and statistical significance was defined as P < .05. Data analysis was conducted from September 2022 to March 2023.
Results
Clinicopathological Characteristics
Of 785 patients included in the study, 437 (55.7%) were male, and the mean (SD) age was 62.7 (11.1) years. The median (IQR) follow-up duration was 68 (48-78) months in the training cohort and 66 (50-79) months in the validation cohort. The survival outcomes were balanced between cohorts (eFigure 2 in Supplement 1). There were similar clinicopathological characteristics between cohorts, which justified their use as training and validation cohorts (Table 1).
Table 1. Characteristics of the Patients in the Training and Validation Cohorts.
| Variables | Patients, No. (%) | P value | |
|---|---|---|---|
| Training cohort (n = 439) | Validation cohort (n = 346) | ||
| Age, y | |||
| Mean (SD) | 62.5 (10.7) | 62.9 (11.6) | .53 |
| <65 | 225 (51.3) | 172 (49.7) | .67 |
| ≥65 | 214 (48.7) | 174 (50.3) | |
| Sex | |||
| Male | 242 (55.1) | 195 (46.4) | .73 |
| Female | 197 (44.9) | 151 (43.6) | |
| Differentiation status | |||
| Well | 88 (20.0) | 71 (20.5) | .91 |
| Moderate | 275 (62.6) | 219 (63.3) | |
| Poor and undifferentiated | 76 (17.3) | 56 (16.2) | |
| CEA levela | |||
| Within reference range | 281 (64.0) | 230 (66.5) | .47 |
| Elevated | 158 (36.0) | 116 (33.5) | |
| Tumor location | |||
| Left side | 276 (62.9) | 201 (58.1) | .17 |
| Right side | 163 (37.1) | 145 (41.9) | |
| Tumor size, cm | |||
| <4 | 167 (38.0) | 125 (36.1) | .58 |
| ≥4 | 272 (62.0) | 221 (63.9) | |
| VELIPI | |||
| No | 275 (62.6) | 228 (65.9) | .35 |
| Yes | 164 (37.4) | 118 (34.1) | |
| Obstruction or perforation | |||
| No | 307 (69.9) | 224 (70.5) | .78 |
| Yes | 132 (30.1) | 102 (29.5) | |
| Depth of invasion | |||
| pT1-2 | 26 (5.9) | 13 (3.8) | .20 |
| pT3 | 252 (57.4) | 186 (53.8) | |
| pT4a | 126 (28.7) | 109 (31.5) | |
| pT4b | 35 (8.0) | 38 (11.0) | |
| Lymph node metastasis | |||
| pN1 | 290 (66.1) | 224 (64.7) | .41 |
| pN2a | 98 (22.3) | 89 (25.7) | |
| pN2b | 51 (1.6) | 33 (9.5) | |
| TNM stage | |||
| IIIa | 25 (5.7) | 12 (3.5) | .20 |
| IIIb | 304 (69.2) | 234 (67.6) | |
| IIIc | 110 (25.1) | 100 (28.9) | |
| Adjuvant chemotherapy | |||
| Yes | 246 (56.0) | 201 (58.1) | .56 |
| No | 193 (44.0) | 145 (41.9) | |
Abbreviations: CEA, carcinoembryonic antigen; TNM, tumor-node-metastasis; VELIPI, venous emboli and/or lymphatic invasion and/or perineural invasion.
For CEA, elevated indicates 5 ng/mL (to convert to micrograms per liter, multiply by 1.0) or greater; reference range, less than 5 ng/mL.
Pathomics Signature Construction
The construction framework of the pathomics signature is illustrated in Figure 1. The pathomics signature as an integrated risk factor was constructed based on 4 pathomics features with an optimal λ value (eFigure 3 in Supplement 1). The calculation formula of the pathomics signature is as follows:
Figure 1. Construction Framework of the Pathomics Signature.
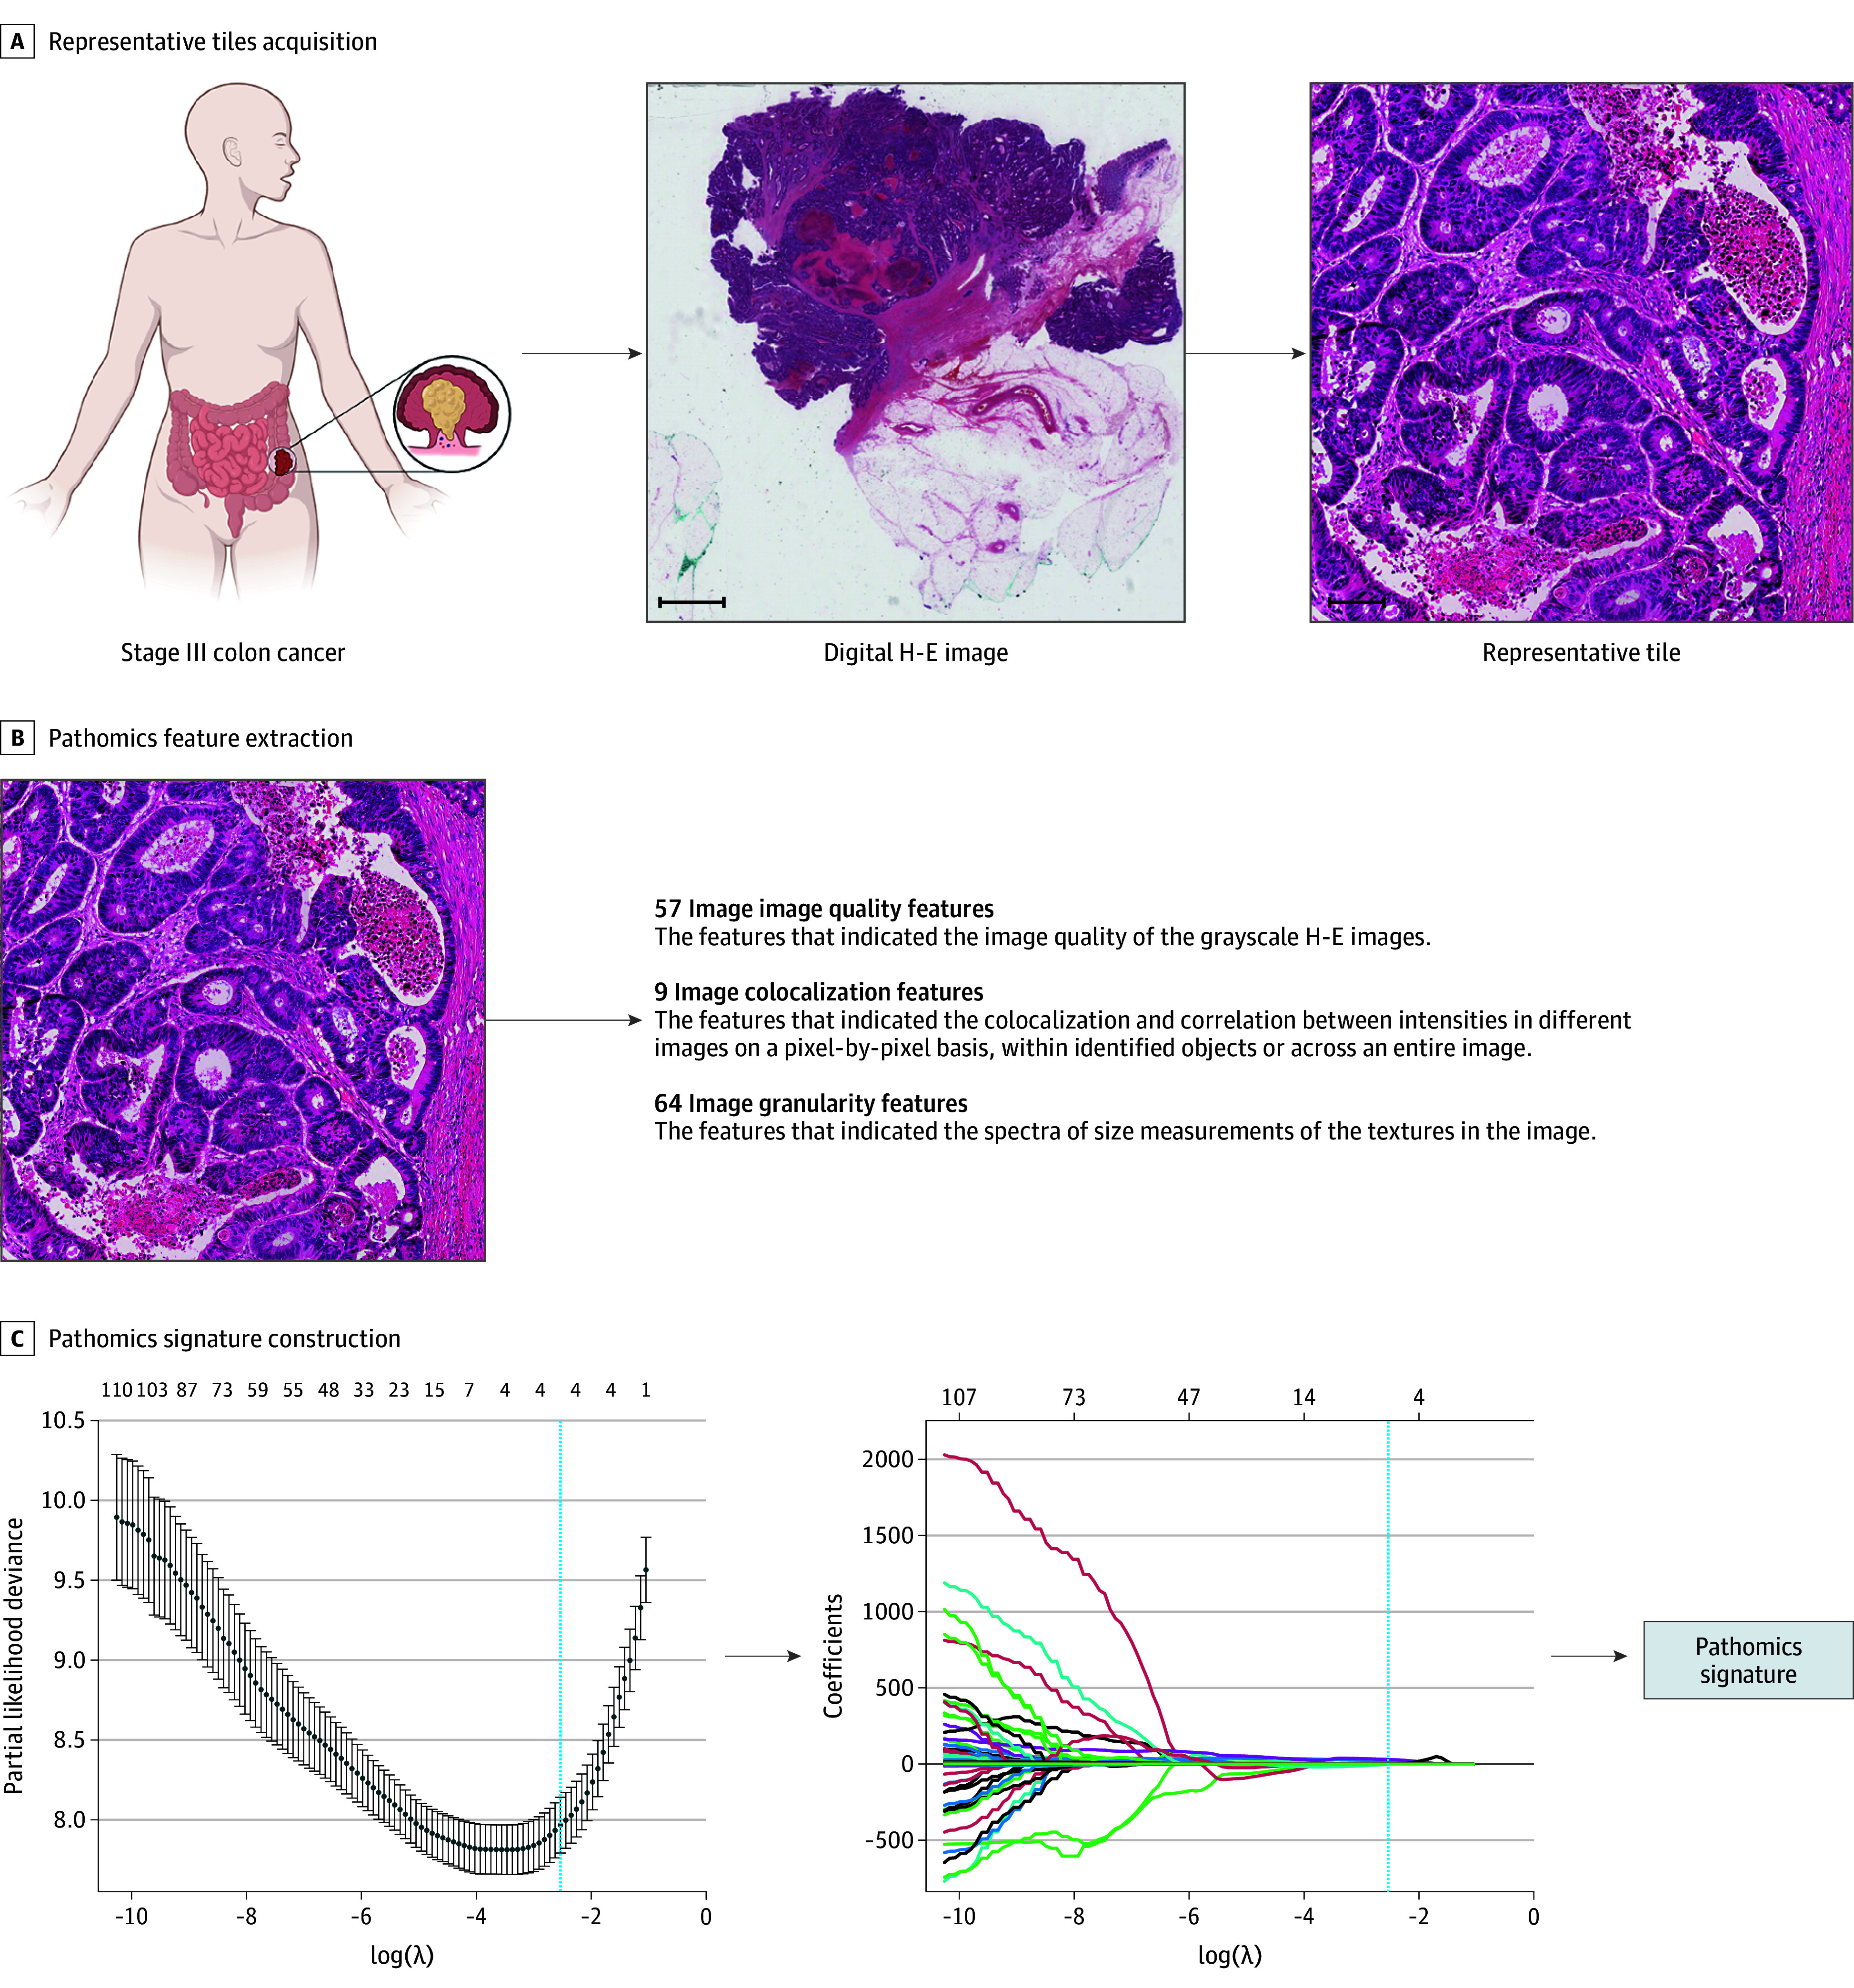
A, 10 Regions of interest with a field of view of 1000 × 1000 μm per sample containing the greatest number of tumor cells were randomly selected for analysis from the digital hematoxylin-eosin (H-E) image. Scale bars: 2000 μm and 100 μm. B, A total of 114 pathomics features were extracted from the representative H-E tiles. C, The pathomics signature was developed by a least absolute shrinkage and selection operator Cox regression model in the training cohort.
| Pathomics signature = −70.05212 + 0.14245 × Integrated_Intensity_Haematoxylin − 9.98769 × Lowerquartile_intensity_H&E + 16.27774 × Manders_coefficient_Eosin − 0.45727 × Granularity_Haematoxylin_6. |
The cutoff value obtained by the X-tile plot was 2.336. Subsequently, patients were categorized into a low pathomics signature group and a high pathomics signature group (eFigure 4 in Supplement 1). The associations between the pathomics signature and clinicopathological characteristics are listed in eTable 2 in Supplement 1.
Prognostic Value of the Pathomics Signature
In the training cohort, the 5-year DFS was 22.5% (95% CI, 16.3%-31.0%) and the 5-year OS was 35.7% (95% CI, 28.3%-45.0%) for patients with high pathomics signature patients. For patients with low pathomics signature in the training cohort, 5-year DFS was 88.1% (95% CI, 84.3%-91.8%) (P vs high pathomics signature group < .001) and the 5-year OS was 89.4% (95% CI, 86.0%-92.9%) (P vs high pathomics signature group < .001) (Figure 2A). We then performed the same analyses in the validation cohort. The 5-year DFS was 31.2% (95% CI, 24.0%-40.6%) and the 5-year OS was 44.4% (95% CI, 36.4%-54.0%) for the high pathomics signature group; for the low pathomics signature group, the 5-year DFS was 88.3% (95% CI, 84.2%-92.6%) (P vs high pathomics signature group < .001) and the 5-year OS was 88.7% (95% CI, 84.7%-93.0%) (P vs high pathomics signature group < .001) (Figure 2B).
Figure 2. Kaplan-Meier Analyses According to the Pathomics Signature in the Training and Validation Cohorts.

DFS indicates disease-free survival; OS, overall survival.
Significant differences were found between the high pathomics signature and low pathomics signature in DFS and OS at stages IIIa to IIIb and IIIc in the training and validation cohorts (eFigure 5 eFigure 6 in Supplement 1). When stratified by clinicopathological characteristics, the pathomics signature remained a significant prognostic indicator in these subgroups (eFigures 7-10 in Supplement 1). The pathomics signature also showed satisfactory performance for 2-, 3-, and 5-year DFS and OS estimation in the training and validation cohorts (eFigure 11 in Supplement 1). The confusion matrices and radar charts revealed acceptable performance of the pathomics signature to estimate 5-year DFS and OS status in both cohorts (eFigure 12 and eTable 3 in Supplement 1).
Construction and Validation of the Pathomics Nomograms
Univariate and multivariable Cox regression analyses identified the pathomics signature, VELIPI, depth of invasion, and lymph node metastasis as factors independently associated with DFS and OS (Table 2). Among these factors, the pathomics signature exhibited the highest discrimination ability compared with the other factors (eFigure 13 in Supplement 1), and the alluvial diagrams intuitively demonstrated the associations between the 4 factors and recurrence (eFigure 14 in Supplement 1). Then, 2 pathomics nomograms that integrated the 4 independent factors were constructed to estimate the probability of 2-, 3-, and 5-year DFS and OS in patients with stage III colon cancer (eFigure 15 in Supplement 1).
Table 2. Univariate and Multivariable Cox Regression Analysis for Disease-Free Survival and Overall Survival.
| Variables | Disease-free survival | Overall survival | ||||||
|---|---|---|---|---|---|---|---|---|
| Univariate analysis | Multivariable analysis | Univariate analysis | Multivariable analysis | |||||
| HR (95% CI) | P value | HR (95% CI) | P value | HR (95% CI) | P value | HR (95% CI) | P value | |
| Age | 1.00 (0.98-1.01) | .65 | NA | NA | 1.00 (0.98-1.01) | .84 | NA | NA |
| Sex | ||||||||
| Male | 1 [Reference] | NA | NA | NA | 1 [Reference] | NA | NA | NA |
| Female | 1.00 (0.98-1.01) | .65 | NA | NA | 1.04 (0.75-1.44) | .80 | NA | NA |
| Differentiation status | .12 | .06 | ||||||
| Well | 1 [Reference] | NA | NA | NA | 1 [Reference] | NA | NA | NA |
| Moderate | 1.37 (0.86-2.18) | .19 | NA | NA | 1.13 (0.74-1.75) | .57 | NA | NA |
| Poor and undifferentiated | 1.77 (1.03-3.06) | .04 | NA | NA | 1.71 (1.04-2.83) | .04 | NA | NA |
| CEA levela | ||||||||
| Normal | 1 [Reference] | NA | NA | NA | 1 [Reference] | NA | NA | NA |
| Elevated | 1.34 (0.96-1.87) | .09 | NA | NA | 1.36 (0.98-1.88) | .07 | NA | NA |
| Tumor location | ||||||||
| Left-side | 1 [Reference] | NA | NA | NA | 1 [Reference] | NA | NA | NA |
| Right-side | 1.24 (0.88-1.73) | .22 | NA | NA | 1.38 (1-1.9) | .05 | NA | NA |
| Tumor size, cm | ||||||||
| < 4 | 1 [Reference] | NA | NA | NA | 1 [Reference] | NA | NA | NA |
| ≥ 4 | 1.27 (0.89-1.80) | .18 | NA | NA | 1.20 (0.86-1.68) | .30 | NA | NA |
| VELIPI | ||||||||
| No | 1 [Reference] | NA | 1 [Reference] | NA | 1 [Reference] | NA | 1 [Reference] | NA |
| Yes | 1.69 (1.21-2.35) | .002 | 1.62 (1.16-2.26) | .005 | 1.68 (1.22-2.32) | .002 | 1.60 (1.16-2.22) | .005 |
| Obstruction or perforation | ||||||||
| No | 1 [Reference] | NA | NA | NA | 1 [Reference] | NA | NA | NA |
| Yes | 1.35 (0.96-1.91) | .09 | NA | NA | 1.33 (0.95-1.86) | .10 | NA | NA |
| Depth of invasionb | ||||||||
| pT1-2 | 1 [Reference] | NA | 1 [Reference] | NA | 1 [Reference] | NA | 1 [Reference] | NA |
| pT3 | 3.31 (0.81-13.56) | .10 | 1.25 (0.3-5.22) | .76 | 2.65 (0.83-8.45) | .10 | 1.45 (0.45-4.72) | .53 |
| pT4a | 7.61 (1.86-31.16) | .005 | 2.37 (0.56-9.96) | .24 | 6.10 (1.91-19.51) | .002 | 2.85 (0.87-9.36) | .08 |
| pT4b | 12.36 (2.9-52.57) | .001 | 4.4 (1.01-19.13) | .05 | 9.50 (2.82-32.02) | <.001 | 4.80 (1.39-16.59) | .01 |
| Lymph node metastasisb | ||||||||
| pN1 | 1 [Reference] | NA | 1 [Reference] | NA | 1 [Reference] | NA | 1 [Reference] | NA |
| pN2a | 2.89 (1.96-4.26) | <.001 | 1.87 (1.26-2.78) | .002 | 2.77 (1.9-4.03) | <.001 | 1.92 (1.31-2.83) | .001 |
| pN2b | 5.43 (3.59-8.21) | <.001 | 2.41 (1.58-3.68) | <.001 | 4.62 (3.07-6.95) | <.001 | 2.37 (1.55-3.62) | <.001 |
| Pathomics signature | 3.77 (3.19-4.47) | <.001 | 2.46 (2.89-4.13) | <.001 | 3.07 (2.61-3.61) | <.001 | 2.78 (2.34-3.31) | <.001 |
Abbreviations: CEA, carcinoembryonic antigen; HR, hazard ratio; NA, not applicable; VELIPI, venous emboli, lymphatic invasion, and/or perineural invasion.
For CEA, elevated indicates 5 ng/mL or greater (to convert to micrograms per liter, multiply by 1); reference range, less than 5 ng/mL.
For overall analyses, all P < .001.
The pathomics nomograms demonstrated satisfactory performance for prognosis estimation, with a concordance index of 0.876 (95% CI, 0.863-0.889) for DFS and 0.850 (95% CI, 0.836-0.864) for OS in the training cohort. In the validation cohort, the pathomics nomograms yielded a concordance index of 0.833 (95% CI, 0.816-0.851) for DFS and 0.802 (95% CI, 0.781-0.823) for OS. The calibration curves revealed good agreement between the nomogram-estimated survival outcomes and the actual survival outcomes at 2-, 3-, and 5-year prognosis in both cohorts (eFigure 16 in Supplement 1).
Incremental Value of the Pathomics Signature for Survival Outcome Estimation
Two traditional models based on VELIPI, depth of invasion, and lymph node metastasis were developed for estimating DFS and OS (eTable 4 and eFigure 17 in Supplement 1). In the training cohort, the concordance index was 0.733 (95% CI, 0.713-0.753) for DFS and 0.736 (95% CI, 0.716-0.756) for OS, and the TNM stage yielded a concordance index of 0.660 (95% CI, 0.640-0.679) for DFS and 0.658 (95% CI, 0.638-0.679) for OS. The pathomics nomograms exhibited a significantly higher concordance index than the traditional models or the TNM stage, and these results could also be found in the validation cohort (eFigure 18 and eTable 5 in the Supplement). Furthermore, the AUROCs of the 3 models also confirmed the superior discrimination ability of the pathomics nomograms for estimating DFS and OS in the training and validation cohorts (eFigure 19 in Supplement 1). Additionally, pathomics nomograms were the most accurate models and could add more net benefit compared with the traditional models and the TNM stage (eFigure 20 and eFigure 21 in Supplement 1). Moreover, the pathomics nomograms indicated a significant net reclassification improvement and integrated discrimination improvement for prognosis estimation compared with the traditional models (eFigure 22, eTable 6, and eTable 7 in Supplement 1), demonstrating a higher classification accuracy of the pathomics nomograms than the traditional models for survival outcomes.
Pathomics Signature and Benefits of Adjuvant Chemotherapy
Adjuvant chemotherapy significantly prolonged the survival of patients with stage III colon cancer in both cohorts (eFigure 23 in Supplement 1). The patients who did or did not receive adjuvant chemotherapy had similar clinicopathological characteristics (eTable 8 in Supplement 1). The pathomics signature was significantly associated with DFS and OS for patients who did or did not receive chemotherapy in the training cohort, the validation cohort, and the combined cohort (eFigure 24 in Supplement 1).
We observed that patients with a low pathomics signature who received adjuvant chemotherapy had improved prognosis (training cohort: DFS: HR, 0.41 [95% CI, 0.22-0.79]; P = .007; OS: HR, 0.47 [95% CI, 0.28-0.79]; P = .004; validation cohort: DFS: HR, 0.41 [95% CI, 0.22-0.77]; P = .006; OS, HR, 0.38 [95% CI, 0.20-0.72]; P = .003; combined cohort: DFS: HR, 0.44 [95% CI, 0.28-0.69]; P < .001; OS, HR, 0.43 [95% CI, 0.29-0.64]; P < .001) (eTable 9 in Supplement 1). However, patients with a high pathomics signature did not have a significantly improved prognosis after receiving adjuvant chemotherapy (eTable 9 in Supplement 1). The corresponding Kaplan-Meier survival curves of the training, validation, and combined cohorts are shown in eFigure 25 and eFigure 26 in Supplement 1 and Figure 3. These results suggested that patients with stage III colon cancer with a low pathomics signature, rather than patients with a high pathomics signature, could benefit from chemotherapy.
Figure 3. Association Between the Pathomics Signature and Survival Benefit From Chemotherapy in the Combined Cohort.

In the combined cohort, patients with a low pathomics signature who received adjuvant chemotherapy had improved prognosis (A), whereas no significant difference was observed in patients with a high pathomics signature whether they were given adjuvant chemotherapy or not (B). P values were calculated by the log-rank test. HR indicates hazard ratio.
Discussion
In this prognostic study, we constructed a pathomics signature based on 4 features in digital H-E–stained images and LASSO Cox regression. We confirmed the prognostic value of the pathomics signature and found that the pathomics signature could identify patients who might benefit from adjuvant chemotherapy.
Currently, pathological images contain histological and morphological features of tumor cells with their matrices, and these important pathological features influence the growth pattern of tumors and contributes to the prognosis of patients.28 However, it can be difficult for clinicians to distinguish and extract this information. In recent years, the rapid development of digital pathology,29,30 which can be combined with machine learning methods for image analysis, has enabled clinicians to extract this hidden pathological information.10,11,12,14 Therefore, in this study, we used CellProfiler to extract high-dimensional pathomics features from digital H-E images for subsequent prognostic model construction.
Pathomics is a new tool that can comprehensively extract features and has the potential to improve the estimation of tumor outcomes. Artificial intelligence–based pathomics signatures could act as new prognostic biomarkers for hepatocellular cancer and renal cell cancer.12,13 In addition, pathomics could seamlessly integrate into other omics to improve the model performance, such as evaluation of colorectal cancer lung metastasis outcomes and treatment response of rectal cancer after neoadjuvant chemoradiotherapy.10,14 Pathomics features were associated with microsatellite instability in colorectal cancer, suggesting the associations between the pathomics and molecular mechanisms.31 To our knowledge, this is the first study to evaluate the association of pathomics signature with prognosis as well as chemotherapy benefits in stage III colon cancer.
Adjuvant chemotherapy is usually recommended for all patients with stage III colon cancer, as it can reduce recurrence by 10% to 20% and prolong survival.32,33,34 However, approximately 30% of patients experience recurrence, even with the same chemotherapy regimens, usually leading to death within 2 to 3 years.5 These results suggest that not all patients benefit from adjuvant chemotherapy and that a considerable number of patients are unnecessarily exposed to toxic effects. We found that patients with a high pathomics signature did not benefit from adjuvant chemotherapy, while patients with a low pathomics signature did benefit from adjuvant chemotherapy. Therefore, the pathomics signature could serve as a potential tool to distinguish patients who are more likely to benefit from adjuvant chemotherapy to improve personalized therapy. We speculated that chemotherapeutic agents are more easily able to exert antitumor functions in patients with a low pathomics signature because of low tumor intensity, but further study is needed to investigate this hypothesis. Studies have reported that pathological features of H-E–stained slides were associated with microsatellite instability or stability, KRAS alteration, or other molecular subtypes.31,35,36 Hence, an integrated analysis of pathomics features and other omics technologies (eg, genomics, transcriptomics, proteomics) may be a feasible approach to unraveling the underlying mechanisms of the pathomics signature with adjuvant chemotherapy benefits.36,37
For patients who do not benefit from chemotherapy, it is necessary to consider other potential treatment strategies, such as triple-drug combination chemotherapy, targeted therapy, and immunotherapy. Enrolling in new clinical trials is also an option that could provide opportunities to explore up-to-date therapies and offer access to the latest treatment options. Intensive postoperative surveillance is essential to detect any signs of recurrence or metastasis early, including new tumor lesions, enlarged lymph nodes, or anomalies in distant organs, to initiate appropriate treatment measures.38,39
Limitations
This study has some limitations. First, this was a retrospective study, and selection bias could not be avoided. Second, whether patients received adjuvant chemotherapy after surgery was decided by patients and clinicians rather than by randomized comparison. Third, all specimens were obtained from patients in China, and the distribution of clinicopathological characteristics might be different in other countries. Fourth, the underlying mechanisms of the pathomics signature with adjuvant chemotherapy benefits are not yet clear. Therefore, the robustness of the pathomics signatures requires further validation in a prospective, international, and multicenter clinical trial.
Conclusions
The findings of this cohort study suggest that pathomics signatures can enhance the prognostic value of the TNM staging system and identify patients with stage III colon cancer who might benefit from adjuvant chemotherapy. In addition, the pathomics nomograms developed in this study have the potential to guide individualized treatment strategies and follow-up schedules.
eMethods.
eFigure 1. Study Design
eFigure 2. Kaplan-Meier Survival Analysis of the Training and Validation Cohorts
eFigure 3. Pathomics Feature Selection Using the LASSO-Cox Regression Model
eFigure 4. X-tile Plots of the Pathomics Signature With the Cutoff Value in the Training Cohort and Validation Cohort
eFigure 5. Kaplan–Meier Survival Analysis of DFS and OS According to the Pathomics Signature in Subgroups of TNM Stage in the Training Cohort
eFigure 6. Kaplan–Meier Survival Analysis of DFS and OS According to the Pathomics Signature in Subgroups of TNM Stage in the Validation Cohort
eFigure 7. Kaplan–Meier Survival Analyses of Disease-Free Survival in the Training Cohort According to the Pathomics Signature Stratified by Clinicopathological Characteristics
eFigure 8. Kaplan–Meier Survival Analyses of Overall Survival in the Training Cohort According to the Pathomics Signature Stratified by Clinicopathological Characteristics
eFigure 9. Kaplan–Meier Survival Analyses of Disease-Free Survival in the Validation Cohort According to the Pathomics Signature Stratified by Clinicopathological Characteristics
eFigure 10. Kaplan–Meier Survival Analyses of Overall Survival in the Validation Cohort According to the Pathomics Signature Stratified by Clinicopathological Characteristics
eFigure 11. Pathomics Signature Measured by Time-Dependent ROC Curves in the Training and Validation Cohorts
eFigure 12. Confusion Matrix and Radar Charts of the 5-Year DFS and OS Status by Pathomics Signature
eFigure 13. Time-Dependent ROC Curves of the Pathomics Signature and Clinicopathological Predictors in the Training and Validation Cohorts
eFigure 14. Alluvial Diagrams Show the Association of Predictors With DFS Stratus
eFigure 15. Developed Pathomics Nomograms for the Prediction of DFS and OS
eFigure 16. Calibration Curves of the Pathomics Nomograms
eFigure 17. Developed Traditional Models for the Prediction of DFS and OS
eFigure 18. Concordance Indexes of Different Models for DFS and OS
eFigure 19. Time-Dependent ROC Curves of Different Models for DFS and OS
eFigure 20. Decision Curve Analysis of Different Models for DFS and OS
eFigure 21. Prediction Error Curves of Different Models for DFS and OS
eFigure 22. Plots of Net Reclassification Improvement in the Training and Validation Cohorts
eFigure 23. Kaplan–Meier Analyses of DFS and OS According to Adjuvant Chemotherapy
eFigure 24. Kaplan-Meier Analysis of DFS and OS in Patients With or Without Adjuvant Chemotherapy According to the Pathomics Signature
eFigure 25. Association Between the Pathomics Signature and Survival Benefit From Chemotherapy in the Training Cohort
eFigure 26. Association Between the Pathomics Signature and Survival Benefit from Chemotherapy in the Validation Cohort
eTable 1. Extracted 114 Pathomics Features
eTable 2. Characteristics of the Patients According to the Pathomics Signature in the Training and Validation Cohorts
eTable 3. Predictive Power of 5-Year DFS and OS Status According to the Pathomics Signature
eTable 4. Univariate and Multivariable Cox Regression Analysis of Clinicopathological Characteristics for Disease-Free Survival and Overall Survival
eTable 5. Concordance Index Comparison of the Pathomics Nomogram and Other Prediction Models
eTable 6. Net Reclassification Improvement by Comparing the Pathomics Nomograms With the Traditional Models
eTable 7. Integrated Discrimination Improvement by Comparing the Pathomics Nomograms With the Traditional Models
eTable 8. Clinical Characteristics of Patients According to Chemotherapy in the Two Cohorts
eTable 9. Adjuvant Chemotherapy Interaction With the Pathomics Signature for Survival in Stage III Colon Cancer Patients in the Training and Validation Cohorts
eReferences.
Data Sharing Statement
References
- 1.Siegel RL, Wagle NS, Cercek A, Smith RA, Jemal A. Colorectal cancer statistics, 2023. CA Cancer J Clin. 2023;73(3):233-254. doi: 10.3322/caac.21772 [DOI] [PubMed] [Google Scholar]
- 2.Sung H, Ferlay J, Siegel RL, et al. Global Cancer Statistics 2020: GLOBOCAN estimates of incidence and mortality worldwide for 36 cancers in 185 countries. CA Cancer J Clin. 2021;71(3):209-249. doi: 10.3322/caac.21660 [DOI] [PubMed] [Google Scholar]
- 3.Weiser MR. AJCC 8th Edition: Colorectal Cancer. Ann Surg Oncol. 2018;25(6):1454-1455. doi: 10.1245/s10434-018-6462-1 [DOI] [PubMed] [Google Scholar]
- 4.National Comprehensive Cancer Network . NCCN Clinical Practice Guidelines in Oncology-Colon Cancer. Version 3. National Comprehensive Cancer Network; 2022. [Google Scholar]
- 5.Auclin E, Zaanan A, Vernerey D, et al. Subgroups and prognostication in stage III colon cancer: future perspectives for adjuvant therapy. Ann Oncol. 2017;28(5):958-968. doi: 10.1093/annonc/mdx030 [DOI] [PubMed] [Google Scholar]
- 6.Sobrero AF, Puccini A, Shi Q, et al. A new prognostic and predictive tool for shared decision making in stage III colon cancer. Eur J Cancer. 2020;138:182-188. doi: 10.1016/j.ejca.2020.07.031 [DOI] [PubMed] [Google Scholar]
- 7.Upadhyay S, Dahal S, Bhatt VR, Khanal N, Silberstein PT. Chemotherapy use in stage III colon cancer: a National Cancer Database analysis. Ther Adv Med Oncol. 2015;7(5):244-251. doi: 10.1177/1758834015587867 [DOI] [PMC free article] [PubMed] [Google Scholar]
- 8.Mehta S, Lu X, Wu W, et al. End-to-end diagnosis of breast biopsy images with transformers. Med Image Anal. 2022;79:102466. doi: 10.1016/j.media.2022.102466 [DOI] [PMC free article] [PubMed] [Google Scholar]
- 9.Rashid R, Chen YA, Hoffer J, et al. Narrative online guides for the interpretation of digital-pathology images and tissue-atlas data. Nat Biomed Eng. 2022;6(5):515-526. doi: 10.1038/s41551-021-00789-8 [DOI] [PMC free article] [PubMed] [Google Scholar]
- 10.Feng L, Liu Z, Li C, et al. Development and validation of a radiopathomics model to predict pathological complete response to neoadjuvant chemoradiotherapy in locally advanced rectal cancer: a multicentre observational study. Lancet Digit Health. 2022;4(1):e8-e17. doi: 10.1016/S2589-7500(21)00215-6 [DOI] [PubMed] [Google Scholar]
- 11.Hölscher DL, Bouteldja N, Joodaki M, et al. Next-generation morphometry for pathomics-data mining in histopathology. Nat Commun. 2023;14(1):470. doi: 10.1038/s41467-023-36173-0 [DOI] [PMC free article] [PubMed] [Google Scholar]
- 12.Chen S, Jiang L, Gao F, et al. Machine learning-based pathomics signature could act as a novel prognostic marker for patients with clear cell renal cell carcinoma. Br J Cancer. 2022;126(5):771-777. doi: 10.1038/s41416-021-01640-2 [DOI] [PMC free article] [PubMed] [Google Scholar]
- 13.Qu WF, Tian MX, Lu HW, et al. Development of a deep pathomics score for predicting hepatocellular carcinoma recurrence after liver transplantation. Hepatol Int. 2023;17(4):927-941. doi: 10.1007/s12072-023-10511-2 [DOI] [PMC free article] [PubMed] [Google Scholar]
- 14.Wang R, Dai W, Gong J, et al. Development of a novel combined nomogram model integrating deep learning-pathomics, radiomics and immunoscore to predict postoperative outcome of colorectal cancer lung metastasis patients. J Hematol Oncol. 2022;15(1):11. doi: 10.1186/s13045-022-01225-3 [DOI] [PMC free article] [PubMed] [Google Scholar]
- 15.Macenko M, Niethammer M, Marron JS, Borland D, Thomas NE. A method for normalizing histology slides for quantitative analysis. Paper presented at the Institute of Electrical and Electronics Engineers International Symposium on Biomedical Imaging: From Nano to Macro. June 28 to July 1, 2009; Boston, MA. doi: 10.1109/ISBI.2009.5193250 [DOI] [Google Scholar]
- 16.McQuin C, Goodman A, Chernyshev V, et al. CellProfiler 3.0: next-generation image processing for biology. PLoS Biol. 2018;16(7):e2005970. doi: 10.1371/journal.pbio.2005970 [DOI] [PMC free article] [PubMed] [Google Scholar]
- 17.Tibshirani R. The LASSO method for variable selection in the Cox model. Stat Med. 1997;16(4):385-395. doi: [DOI] [PubMed] [Google Scholar]
- 18.Jiang Y, Zhang Q, Hu Y, et al. ImmunoScore Signature: a prognostic and predictive tool in gastric cancer. Ann Surg. 2018;267(3):504-513. doi: 10.1097/SLA.0000000000002116 [DOI] [PubMed] [Google Scholar]
- 19.Camp RL, Dolled-Filhart M, Rimm DL. X-tile: a new bio-informatics tool for biomarker assessment and outcome-based cut-point optimization. Clin Cancer Res. 2004;10(21):7252-7259. doi: 10.1158/1078-0432.CCR-04-0713 [DOI] [PubMed] [Google Scholar]
- 20.Kamarudin AN, Cox T, Kolamunnage-Dona R. Time-dependent ROC curve analysis in medical research: current methods and applications. BMC Med Res Methodol. 2017;17(1):53. doi: 10.1186/s12874-017-0332-6 [DOI] [PMC free article] [PubMed] [Google Scholar]
- 21.Haslbeck JMB, van Bork R. Estimating the number of factors in exploratory factor analysis via out-of-sample prediction errors. Psychol Methods. Published online November 3, 2022. doi: 10.1037/met0000528 [DOI] [PubMed] [Google Scholar]
- 22.Iasonos A, Schrag D, Raj GV, Panageas KS. How to build and interpret a nomogram for cancer prognosis. J Clin Oncol. 2008;26(8):1364-1370. doi: 10.1200/JCO.2007.12.9791 [DOI] [PubMed] [Google Scholar]
- 23.Balachandran VP, Gonen M, Smith JJ, DeMatteo RP. Nomograms in oncology: more than meets the eye. Lancet Oncol. 2015;16(4):e173-e180. doi: 10.1016/S1470-2045(14)71116-7 [DOI] [PMC free article] [PubMed] [Google Scholar]
- 24.Harrell FE Jr, Califf RM, Pryor DB, Lee KL, Rosati RA. Evaluating the yield of medical tests. JAMA. 1982;247(18):2543-2546. doi: 10.1001/jama.1982.03320430047030 [DOI] [PubMed] [Google Scholar]
- 25.Vickers AJ, Elkin EB. Decision curve analysis: a novel method for evaluating prediction models. Med Decis Making. 2006;26(6):565-574. doi: 10.1177/0272989X06295361 [DOI] [PMC free article] [PubMed] [Google Scholar]
- 26.Cui Y, Zhang J, Li Z, et al. A CT-based deep learning radiomics nomogram for predicting the response to neoadjuvant chemotherapy in patients with locally advanced gastric cancer: a multicenter cohort study. EClinicalMedicine. 2022;46:101348. doi: 10.1016/j.eclinm.2022.101348 [DOI] [PMC free article] [PubMed] [Google Scholar]
- 27.Koh HK, Fook-Chong SMC, Lee HY. Improvement of mortality prognostication in patients with epidermal necrolysis: the role of novel inflammatory markers and proposed revision of SCORTEN (Re-SCORTEN). JAMA Dermatol. 2022;158(2):160-166. doi: 10.1001/jamadermatol.2021.5119 [DOI] [PMC free article] [PubMed] [Google Scholar]
- 28.Sacchetti A, Teeuwssen M, Verhagen M, et al. Phenotypic plasticity underlies local invasion and distant metastasis in colon cancer. Elife. 2021;10:e61461. doi: 10.7554/eLife.61461 [DOI] [PMC free article] [PubMed] [Google Scholar]
- 29.Lin E, Fuda F, Luu HS, et al. Digital pathology and artificial intelligence as the next chapter in diagnostic hematopathology. Semin Diagn Pathol. 2023;40(2):88-94. doi: 10.1053/j.semdp.2023.02.001 [DOI] [PubMed] [Google Scholar]
- 30.Pantanowitz L, Sharma A, Carter AB, Kurc T, Sussman A, Saltz J. Twenty years of digital pathology: an overview of the road travelled, what is on the horizon, and the emergence of vendor-neutral archives. J Pathol Inform. 2018;9:40. doi: 10.4103/jpi.jpi_69_18 [DOI] [PMC free article] [PubMed] [Google Scholar]
- 31.Cao R, Yang F, Ma SC, et al. Development and interpretation of a pathomics-based model for the prediction of microsatellite instability in Colorectal Cancer. Theranostics. 2020;10(24):11080-11091. doi: 10.7150/thno.49864 [DOI] [PMC free article] [PubMed] [Google Scholar]
- 32.André T, Boni C, Mounedji-Boudiaf L, et al. ; Multicenter International Study of Oxaliplatin/5-Fluorouracil/Leucovorin in the Adjuvant Treatment of Colon Cancer (MOSAIC) Investigators . Oxaliplatin, fluorouracil, and leucovorin as adjuvant treatment for colon cancer. N Engl J Med. 2004;350(23):2343-2351. doi: 10.1056/NEJMoa032709 [DOI] [PubMed] [Google Scholar]
- 33.Twelves C, Wong A, Nowacki MP, et al. Capecitabine as adjuvant treatment for stage III colon cancer. N Engl J Med. 2005;352(26):2696-2704. doi: 10.1056/NEJMoa043116 [DOI] [PubMed] [Google Scholar]
- 34.Yothers G, O’Connell MJ, Allegra CJ, et al. Oxaliplatin as adjuvant therapy for colon cancer: updated results of NSABP C-07 trial, including survival and subset analyses. J Clin Oncol. 2011;29(28):3768-3774. doi: 10.1200/JCO.2011.36.4539 [DOI] [PMC free article] [PubMed] [Google Scholar]
- 35.Niehues JM, Quirke P, West NP, et al. Generalizable biomarker prediction from cancer pathology slides with self-supervised deep learning: a retrospective multi-centric study. Cell Rep Med. 2023;4(4):100980. doi: 10.1016/j.xcrm.2023.100980 [DOI] [PMC free article] [PubMed] [Google Scholar]
- 36.Huang X, Chen Z, Xiang X, et al. Comprehensive multi-omics analysis of the m7G in pan-cancer from the perspective of predictive, preventive, and personalized medicine. EPMA J. 2022;13(4):671-697. doi: 10.1007/s13167-022-00305-1 [DOI] [PMC free article] [PubMed] [Google Scholar]
- 37.Bülow RD, Hölscher DL, Costa IG, Boor P. Extending the landscape of omics technologies by pathomics. NPJ Syst Biol Appl. 2023;9(1):38. doi: 10.1038/s41540-023-00301-9 [DOI] [PMC free article] [PubMed] [Google Scholar]
- 38.Meyerhardt JA, Mangu PB, Flynn PJ, et al. ; American Society of Clinical Oncology . Follow-up care, surveillance protocol, and secondary prevention measures for survivors of colorectal cancer: American Society of Clinical Oncology clinical practice guideline endorsement. J Clin Oncol. 2013;31(35):4465-4470. doi: 10.1200/JCO.2013.50.7442 [DOI] [PubMed] [Google Scholar]
- 39.Pita-Fernández S, Alhayek-Aí M, González-Martín C, López-Calviño B, Seoane-Pillado T, Pértega-Díaz S. Intensive follow-up strategies improve outcomes in nonmetastatic colorectal cancer patients after curative surgery: a systematic review and meta-analysis. Ann Oncol. 2015;26(4):644-656. doi: 10.1093/annonc/mdu543 [DOI] [PubMed] [Google Scholar]
Associated Data
This section collects any data citations, data availability statements, or supplementary materials included in this article.
Supplementary Materials
eMethods.
eFigure 1. Study Design
eFigure 2. Kaplan-Meier Survival Analysis of the Training and Validation Cohorts
eFigure 3. Pathomics Feature Selection Using the LASSO-Cox Regression Model
eFigure 4. X-tile Plots of the Pathomics Signature With the Cutoff Value in the Training Cohort and Validation Cohort
eFigure 5. Kaplan–Meier Survival Analysis of DFS and OS According to the Pathomics Signature in Subgroups of TNM Stage in the Training Cohort
eFigure 6. Kaplan–Meier Survival Analysis of DFS and OS According to the Pathomics Signature in Subgroups of TNM Stage in the Validation Cohort
eFigure 7. Kaplan–Meier Survival Analyses of Disease-Free Survival in the Training Cohort According to the Pathomics Signature Stratified by Clinicopathological Characteristics
eFigure 8. Kaplan–Meier Survival Analyses of Overall Survival in the Training Cohort According to the Pathomics Signature Stratified by Clinicopathological Characteristics
eFigure 9. Kaplan–Meier Survival Analyses of Disease-Free Survival in the Validation Cohort According to the Pathomics Signature Stratified by Clinicopathological Characteristics
eFigure 10. Kaplan–Meier Survival Analyses of Overall Survival in the Validation Cohort According to the Pathomics Signature Stratified by Clinicopathological Characteristics
eFigure 11. Pathomics Signature Measured by Time-Dependent ROC Curves in the Training and Validation Cohorts
eFigure 12. Confusion Matrix and Radar Charts of the 5-Year DFS and OS Status by Pathomics Signature
eFigure 13. Time-Dependent ROC Curves of the Pathomics Signature and Clinicopathological Predictors in the Training and Validation Cohorts
eFigure 14. Alluvial Diagrams Show the Association of Predictors With DFS Stratus
eFigure 15. Developed Pathomics Nomograms for the Prediction of DFS and OS
eFigure 16. Calibration Curves of the Pathomics Nomograms
eFigure 17. Developed Traditional Models for the Prediction of DFS and OS
eFigure 18. Concordance Indexes of Different Models for DFS and OS
eFigure 19. Time-Dependent ROC Curves of Different Models for DFS and OS
eFigure 20. Decision Curve Analysis of Different Models for DFS and OS
eFigure 21. Prediction Error Curves of Different Models for DFS and OS
eFigure 22. Plots of Net Reclassification Improvement in the Training and Validation Cohorts
eFigure 23. Kaplan–Meier Analyses of DFS and OS According to Adjuvant Chemotherapy
eFigure 24. Kaplan-Meier Analysis of DFS and OS in Patients With or Without Adjuvant Chemotherapy According to the Pathomics Signature
eFigure 25. Association Between the Pathomics Signature and Survival Benefit From Chemotherapy in the Training Cohort
eFigure 26. Association Between the Pathomics Signature and Survival Benefit from Chemotherapy in the Validation Cohort
eTable 1. Extracted 114 Pathomics Features
eTable 2. Characteristics of the Patients According to the Pathomics Signature in the Training and Validation Cohorts
eTable 3. Predictive Power of 5-Year DFS and OS Status According to the Pathomics Signature
eTable 4. Univariate and Multivariable Cox Regression Analysis of Clinicopathological Characteristics for Disease-Free Survival and Overall Survival
eTable 5. Concordance Index Comparison of the Pathomics Nomogram and Other Prediction Models
eTable 6. Net Reclassification Improvement by Comparing the Pathomics Nomograms With the Traditional Models
eTable 7. Integrated Discrimination Improvement by Comparing the Pathomics Nomograms With the Traditional Models
eTable 8. Clinical Characteristics of Patients According to Chemotherapy in the Two Cohorts
eTable 9. Adjuvant Chemotherapy Interaction With the Pathomics Signature for Survival in Stage III Colon Cancer Patients in the Training and Validation Cohorts
eReferences.
Data Sharing Statement