

SUMMARY
Colorectal cancer (CRC) is driven by genomic alterations in concert with dietary influences, with the gut microbiome implicated as an effector in disease development and progression. While meta-analyses have provided mechanistic insight into patients with CRC, study heterogeneity has limited causal associations. Using multi-omics studies on genetically controlled cohorts of mice, we identify diet as the major driver of microbial and metabolomic differences, with reductions in α diversity and widespread changes in cecal metabolites seen in high-fat diet (HFD)-fed mice. In addition, non-classic amino acid conjugation of the bile acid cholic acid (AA-CA) increased with HFD. We show that AA-CAs impact intestinal stem cell growth and demonstrate that Ileibacterium valens and Ruminococcus gnavus are able to synthesize these AA-CAs. This multi-omics dataset implicates diet-induced shifts in the microbiome and the metabolome in disease progression and has potential utility in future diagnostic and therapeutic developments.
In brief
Fu et al. identify high-fat diet as a dominant determinant of the cecal microbiome and metabolome in a mouse model of colorectal cancer and implicate microbially conjugated bile acids as potential drivers of disease progression.
Graphical Abstract

INTRODUCTION
Colorectal cancer (CRC) is the 4th leading cause of cancer-related deaths worldwide.1 Combined with an expected increase in the incidence in the coming decades, new diagnostic and therapeutic approaches for combating this disease are needed. Diet and lifestyle choices have been identified as risk factors for CRC, with 50%–60% of US cases attributed to modifiable risk factors.2 However, the convergence of environmental and genetic factors in the development and progression of CRC is not fully understood.
The intestinal microbiome has been suggested to mediate environmental risk factors in CRC. While specific microbes have been associated with different tumor stages, conflicting reports have led to a meta-analysis approach to map gut microbiome signatures associated with CRC.3–8 Such meta-analysis approaches have identified diagnostic microbial signatures; however, causal associations of microorganisms with carcinogenesis have proven difficult.8 This is attributable in part to variations in human genetics and environmental conditions. Indeed, study heterogeneity was found to have a larger impact on the composition of the gut microbiome than CRC.8
Diets high in animal fat alter the microbiome, as well as lead to increases in bile acids (BAs). BAs are a diverse collection of amphipathic cholesterol derivatives that promote the intestinal absorption of lipids and fat-soluble vitamins. Synthesized in the liver, primary BAs are conjugated to glycine and taurine prior to storage in the gall bladder and subsequent secretion into the duodenum. Specific transporters in the ileum actively recycle the majority of BAs to the liver. Residual BAs transiting to the colon are modified by the microbiome, including deconjugation, dehydroxylation, and dehydration to generate secondary BAs. In addition to their detergent effects, BAs function as endogenous ligands for the G protein-coupled BA receptor (TGR5) and several nuclear receptors including the farnesoid X receptor (FXR). FXR is considered the master regulator of BA homeostasis, controlling the transcription of key genes regulating the synthesis and transport of BAs. Of note, BA modifications differentially affect their transport, receptor efficacy, and cytotoxicity.
Clinical studies have reported reduced microbial diversity, along with a shift from dietary carbohydrate utilization to amino acid degradation in patients with CRC.8 In addition, increased fecal levels of the secondary BAs lithocholic acid (LCA) and deoxycholic acid (DCA) relative to healthy controls have been shown.9 While both preclinical and patient-based studies support a role for gut dysbiosis in CRC susceptibility/progression, the interactions between the microbiome and the host are incompletely understood. The ability to control genetic and environmental confounders in preclinical studies offers the potential for causal relationships to be identified, despite species differences in the composition of the microbiome and BA pools. Mice with a mutant allele of the APC gene (APCmin/+) develop multiple intestinal neoplasia predominantly within the ileum; however, these lesions seldom progress past the adenoma stage.10 We previously showed that challenging APCmin/+ mice with a high-fat diet (HFD) was sufficient to drive the progression from adenoma to adenocarcinoma.11 Using this APCmin/+ mouse model of CRC, we show here that the effects of an HFD on the cecum microbiome are more pronounced than those from the genetic mutation, significantly reducing microbial α diversity and perturbing the metabolome. The presence of microbially conjugated BA with the capacity to drive intestinal cell proliferation in HFD-fed mice identifies potential drivers of disease progression.
RESULTS
To understand the effects of genetics and diet on CRC progression, we compared wild-type (WT) and APCmin/+ mice maintained on a normal diet (ND) or on an HFD. Changes in the gut microbiome were detected using 16S and shotgun metagenomics of cecum samples stratified by both genotype (WT compared with APCmin/+) and diet (ND compared with HFD), resulting in 4 groups.5,8,12,13 The bacterial diversity and composition in these 4 groups were characterized by both α and β diversity (Figures 1A, B, and S1A).14 Faith’s phylogenetic α diversity of cecum microbiomes was lower in HFD-fed compared with ND-fed WT mice (Figure 1A).15 Somewhat surprisingly, microbial richness was largely unaffected in the genetic model susceptible to CRC (APCmin/+ compared with WT mice on ND) (Figure 1A). As seen with WT mice, HFD reduced α diversity in APCmin/+ mice, albeit to a lesser extent (Figure 1A). Similarly, we observed more profound β-diversity differences related to diet (ND vs. HFD) in both WT and APCmin/+ mice than between genotypes (Figures 1B and S1A). We then explored the association of specific microbial taxa with mouse genotype and/or diet through differential abundance ranking (see STAR Methods; Figure S1B).14 Of note, species of the genus Prevotellaceae were more associated with the APCmin/+ genotype, while species of the family Lachnospiraceae were more associated with the WT genotype. On the diet side, species of the family Erysipelotrichaceae were more associated with HFD, while species of the family ClostridiaceaeI were more associated with ND. We plot the phylogenetic trees annotated by genotype and diet differentials (Figures 1C and 1D) and the associated rank plots (Figures 1E and 1F). Taking the log ratios of the aforementioned taxa,14 we observe statistically significant differences comparing samples both between genotypes and between diets (Figure 1G).
Figure 1. Genetics and diet reshape the gut microbiome.
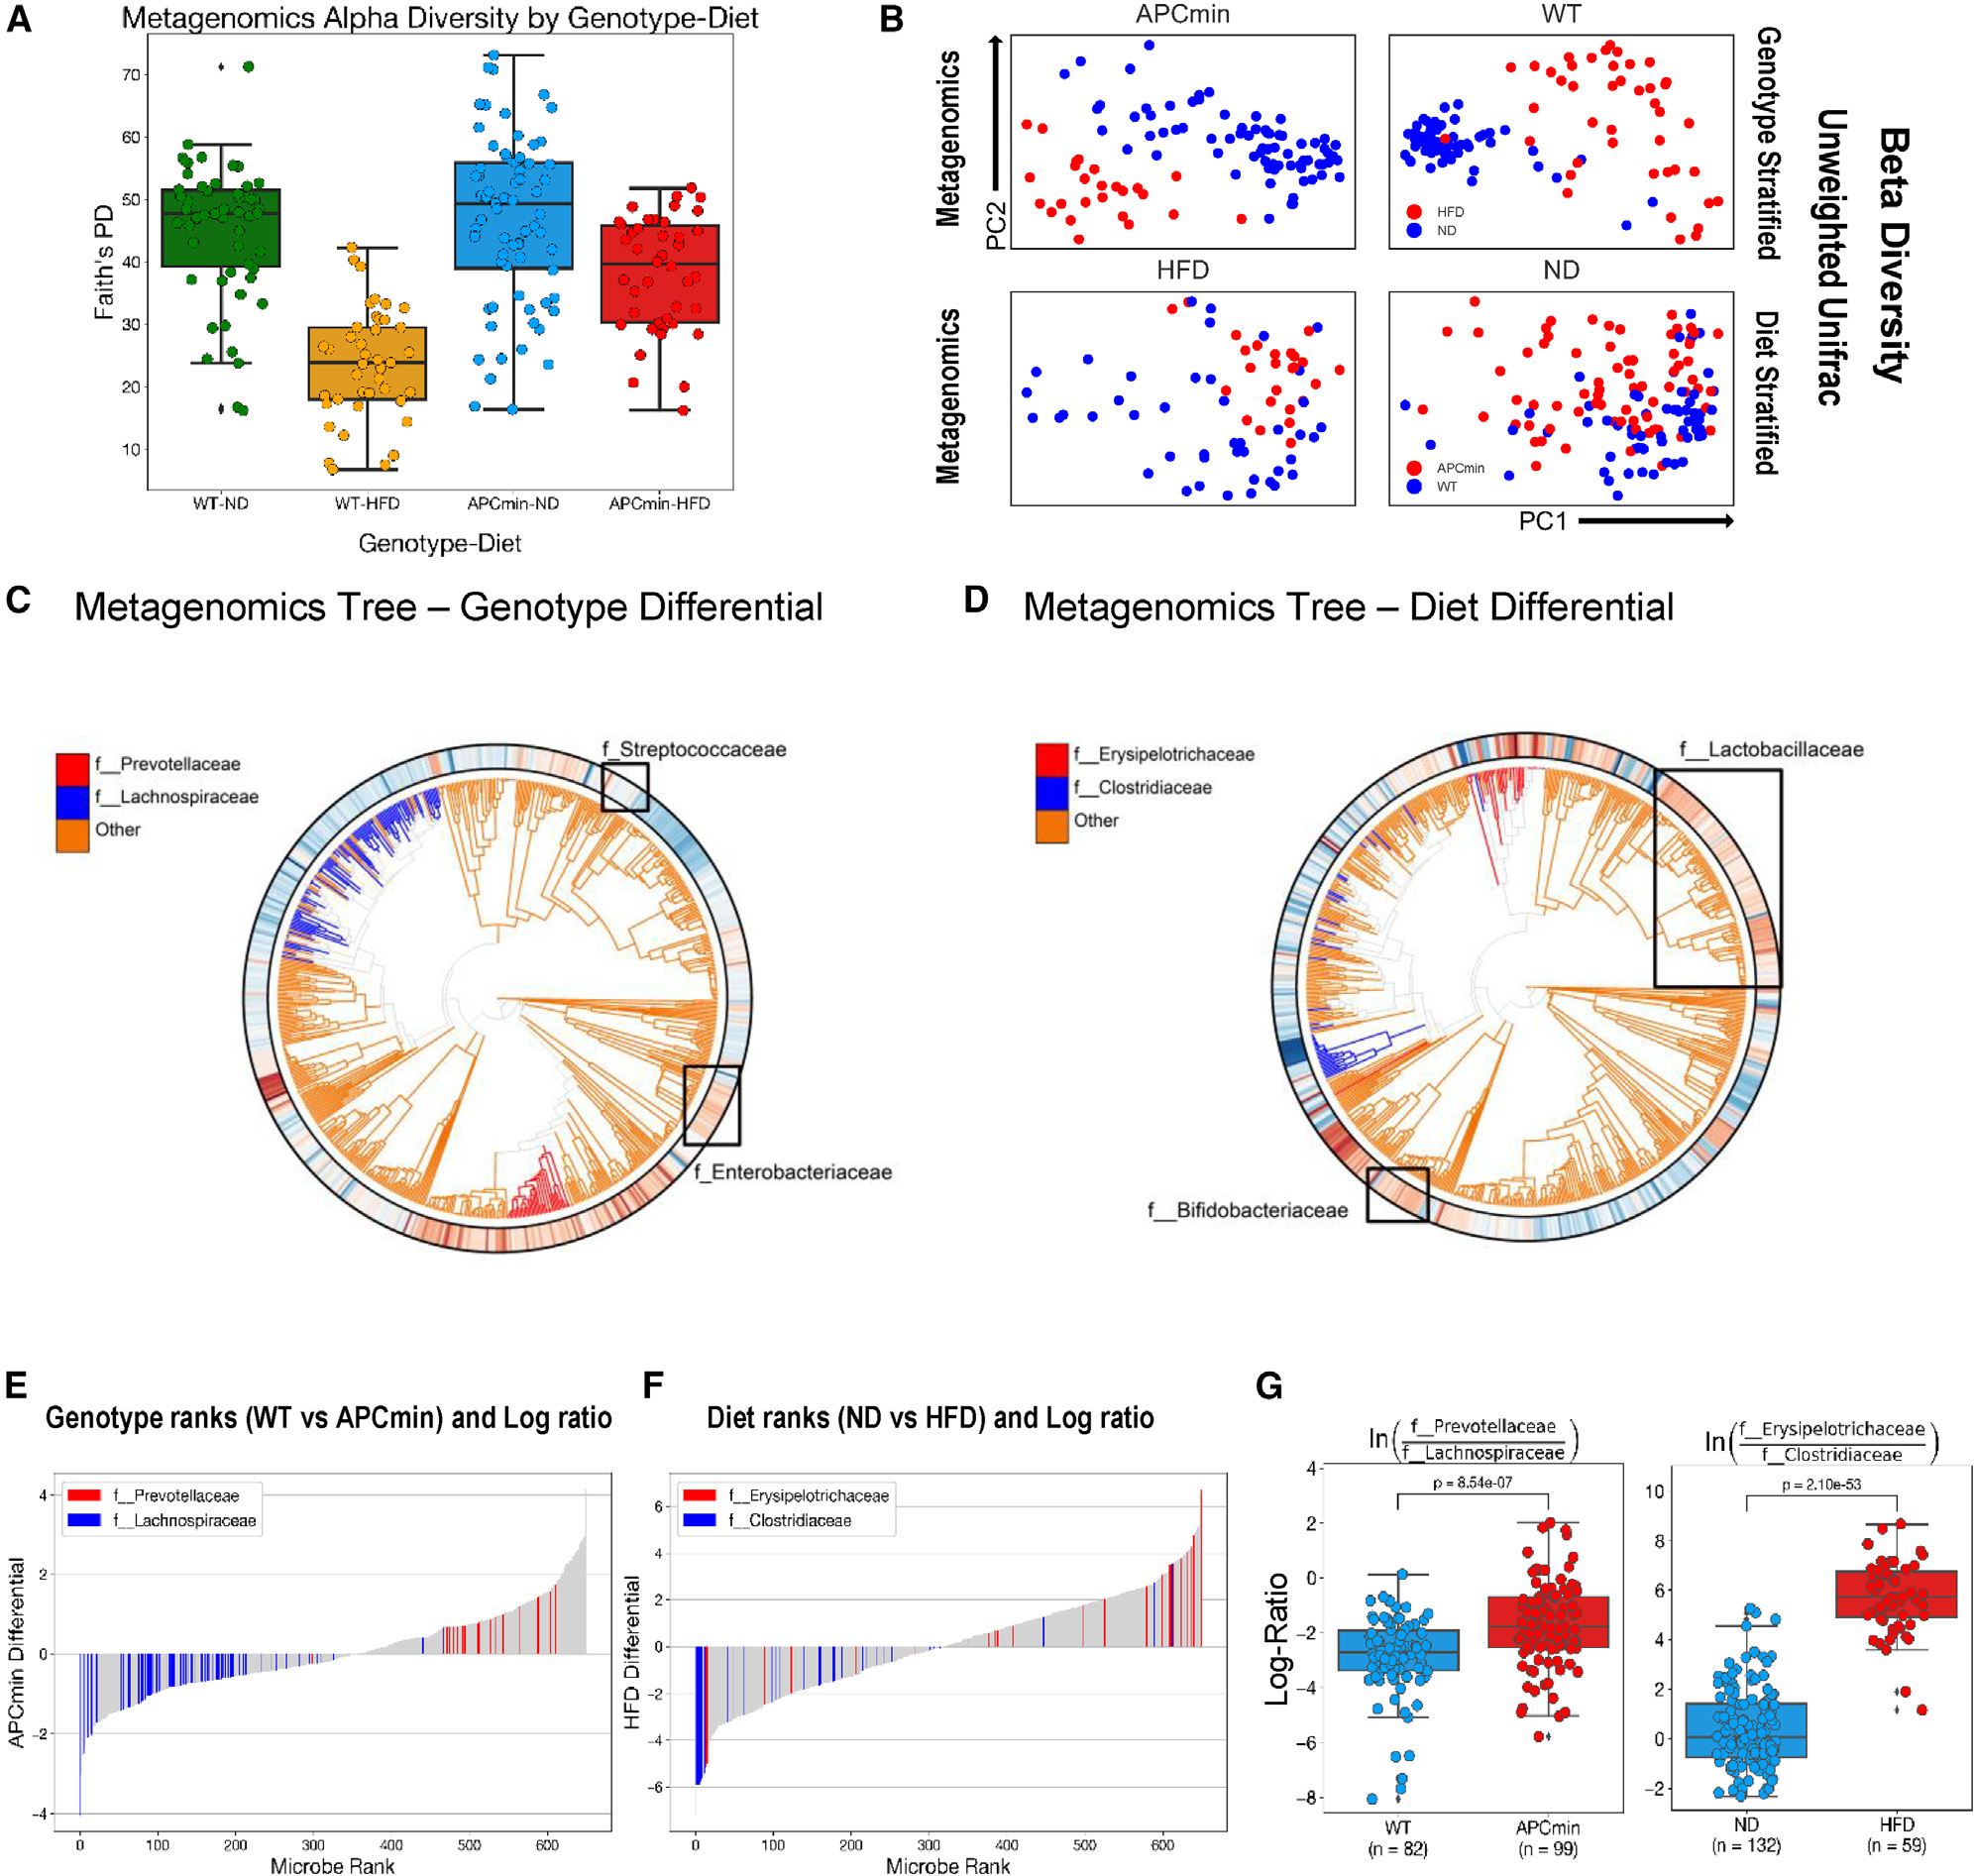
(A) α diversity of wild-type (WT) and APCmin/+ mice maintained on normal chow diet (ND) and high-fat diet (HFD). Within-sample diversity is measured by Faith’s phylogenetic diversity. Metrics from shotgun metagenomics sequencing data of cecum samples are presented by genotype-diet combination. Whiskers represent 1.5x interquartile range of data.
(B) Unweighted Unifrac measures of b diversity in mice from (A). Metrics from shotgun metagenomic sequencing data are stratified by genotype and diet factors and visualized using principal-coordinate analysis (PCoA).
(C and D) Ultrametric phylogenetic tree generated from shotgun metagenomics data of cecum samples in mice from (A). Microbial features colored by Songbird genotype (C) and diet (D) differentials. Red indicates positive association, while blue indicates negative association (both relative to all other features).
(E and F) The differential rank plot of selected microbial features separating samples by genotype (E) and diet (F). Features in red correspond to those in the numerator, while those in blue correspond to features in the denominator. Features that are colored gray are not factored into the log ratio calculations.
(G) Log ratios of selected microbial families separating samples across genotype (left) and diet (right). Family selection was performed by using Qurro to inspect differentially abundant microbial groups according to Songbird differentials. p values calculated from two-sided t test.
Complementing the metagenomic analyses, paired metabolomic profiling was performed to gain additional insight into the functional consequences of the genetic and dietary changes.16 Unbiased liquid chromatography-mass spectrometry (LC-MS) profiling of cecum and serum samples from both WT and APCmin/+ mice on NDs and HFDs was performed (Figure S2A). Principal-component analysis (PCA) of the cecum samples revealed metabolomic differences associated with diet (Figure 2A). To confirm this association, partial least square-discriminant analysis (PLS-DA) of cecum and serum samples showed metabolomic differences among the four sample groups,with a permutation test (100replicates, p<0.01) suggesting that the model fit is better than a chance permutation of the labels (Figures 2B, S2B, and S2C). Diet was the dominant determinant of the cecum metabolome, in agreement with the microbiome analyses, whereas less pronounced diet-induced differences were evident in the serum samples (Figure 2B). Over 110 metabolites were determined to be significantly dysregulated when comparing HFD- and ND-fed mice (p ≤ 0.05, fold change ≥ 1.5). Pathway enrichment analysis of the dysregulated metabolites identified 9 metabolic pathways (Figure S3A), with the aminoacyl-tRNA biosynthesis pathway most affected. Ranking metabolites by differentials revealed relatively minor genetic effects on the cecal metabolome (largely less than 2-fold changes), with similar numbers of metabolites increased and decreased in APCmin/+ compared with WT mice (Figure 2C). In contrast, the magnitude of the changes was greater with diet, with HFD markedly reducing the levels of approximately 30% (decreased up to 6-fold) and increasing the concentrations of 70% of the differentially regulated metabolites (increased up to 3-fold) (Figure 2D). Metabolites reduced in APCmin/+ compared with WT mice included several lysophosphatidylcholine (LPC) species (Figure S3B), in agreement with reduced LPCs reported in patients with CRC,17 while the observed reduction in C16 acyl-carnitine (ACAR 16:0) contrasts with reported increases seen in patient-derived serum.18,19 Correlation-based metabolic network analysis, where each node represents one metabolite and the edge between two nodes represents the correlation coefficient between two metabolites (red and blue lines representing positive and negative correlations, respectively), reveals the global effects of HFD on the dysregulated metabolites (Figure S3C). Exploiting the finding that structurally related molecules produce similar MS fragmentation patterns, spectral similarity scores were calculated using MS-DIAL with the embedded Bonanza spectral clustering algorithm. Subsequent network analyses facilitated the visualization of chemical similarities across the entire metabolome, wherein each node represents an ion with an associated fragmentation pattern and the links among the no des indicate spectral similarities (visualized in Cytoscape; Figure S4).20,21,22–24
Figure 2. Genetics and diet affect serum and fecal metabolomes.

(A) Principal-component analysis (PCA) of cecum metabolites from WT and APCmin/+ mice maintained on ND and HFD.
(B) Partial least square-discriminant analysis (PLS-DA) score plots of cecum (left) and serum metabolites (right) from mice in (A), with a model p <0.01.
(C and D) Songbird differential rank plots of the association of metabolites with genotype (left) and diet (right). Differentials were calculated with multinomial regression and validated by comparison to a null model.
See also Figures S2–S4.
Dietary changes are reflected in fecal BAs
Previously, we found that HFD-induced increases in secondary BAs including DCA and tauro-β-muricholic acid (TβMCA) were sufficient to drive an adenoma to adenocarcinoma progression in the APCmin/+ CRC mouse model.11 To further understand the impact of dietary and genetic factors on microbially derived secondary BAs, we measured fecal BAs in WT and APCmin/+ mice on a ND or on an HFD. Consistent with previous findings, HFD and the APC mutation independently and cooperatively increased fecal BA content (Figure 3A). In addition, HFD increased the proportion of secondary BAs in both WT and APCmin/+ mice (Figure 3B). Given that total bacterial load and α diversity decreased with HFD, the proportional increases in secondary BAs implicate compositional changes in the microbiome, rather than in the absolute bacterial load, in mediating these changes (Figure 1A).
Figure 3. Genetics and diet affect fecal bile acids.

WT and APCmin/+ mice were maintained on ND or HFD from 4 weeks of age.
(A and B) Total fecal bile acids of 12 weeks old mice after 8 weeks of ND or HFD (A) and proportions of primary and secondary bile acids in feces (B). Each data point represents samples pooled from 5 mice (one cage) (n = 15 per arm).
(C and D) Progressive changes in bacterially mediated conversion of tauro-cholic acid (T-CA) to CA and deoxycholic acid (DCA) in serum (C) and feces (D) from APCmin/+ mice. Serum samples were collected from mice at the indicated time (n = 3 per time point). Fecal data points represent samples pooled from 5 mice (n = 5 per time point).
(E) Temporal changes in intestinal tumor burden (n = 3) and fecal DCA levels in APCmin/+ mice on ND (n = 3–5).
(F) Temporal changes in bacterial load and DCA in feces from APCmin/+ mice on ND (pooled sample, n = 3–5).
(G) Temporal changes of fecal DCA levels in WT (left panel) and APCmin/+ mice (right panel) maintained on ND and HFD during tumor progression (16–24 weeks) (each data point represents samples pooled from 5 mice (one cage), n = 5).
(H) Fecal bile acid levels in WT and APCmin/+ mice on ND and HFD treated with the FXR agonist FexD (50 mg/kg/day) or vehicle for 8 weeks (n = 6 per arm). Data represent the mean ± SEM. For two-group comparation, Student’s unpaired t test was used. For more than two-group comparation, one-way ANOVA was used. *, #p < 0.05; **, ##p < 0.01; ***, ###p < 0.005.
See also Figure S5.
To complement these metabolomic studies, the progressive changes in total and specific fecal BA species were determined by enzymatic assay and targeted MS, respectively, in APCmin/+ mice (Figures S5A and S5B). While minor fluctuations were evident in the serum levels of ωMCA, the fecal levels were found to increase with age (Figures S5C and S5E). A similar pattern was seen in serum and fecal DCA (Figures 3C and 3D), while a transient decrease in βMCA levels was seen coinciding with tumor initiation (~7 weeks; Figure S5F). This lack of correlation between fecal and serum levels of ωMCA and DCA is presumed to be a consequence of differential BA uptake in the colon.25,26 However, at increased tumor load (~13 weeks of age), reductions in DCA and ωMCA levels were observed without major changes in fecal bacterial load (Figures 3E, 3F, and S5E), implicating compositional changes in the gut microbiome in the generation of secondary BAs. In contrast, βMCA levels increased during the later stages of tumor progression, potentially driven by tumor-specific changes in the microbiome (Figure S5F).
We next sort to determine the specific BA species contributing to the HFD-induced increases in fecal BAs in both WT and APCmin/+ mice (Figure 3A). Notably, fecal DCA and ωMCA levels increased 60- to 100- and 150- to 300-fold, respectively, in mice maintained for 16 weeks on HFD (Figure 3G, and S5G). APCmin/+ mice were more susceptible to the dietary challenge, with increases in fecal DCA and ωMCA levels 3- to 5- and 6- to 7-fold greater than those in WT mice, respectively (Figure 3G, and S5G). In contrast, the diet-induced changes in serum cholic acid (CA) levels were relatively minor; however, concentrations were an order of magnitude higher in HFD-fed APCmin/+ mice (Figure S5H).
As the master regulator of BA homeostasis, activation of FXR can reduce serum BA levels in HFD-fed WT and APCmin/+ mice.11 To explore the impact of FXR on the fecal BA pool, ND- and HFD-fed mice were treated with the intestinally biased FXR agonist FexD (50 mg/kg/day for 8 weeks; Figures S6A and S6C). Intestinal FXR activation reduced total fecal BAs in both WT and APCmin/+ mice on ND (Figure 3H). In contrast, a differential effect was evident in HFD-fed mice, with FexD treatment increasing and decreasing total fecal BA levels in WT and APCmin/+ mice, respectively (Figure 3H). Profiling the fecal BA composition of ND-fed mice revealed model-specific FexD-mediated reductions that were largely lost in the HFD cohorts, illustrating the complexity of factors affecting BA homeostasis (Figures S6B and S6D).27–29
Novel conjugated BAs associated with HFD
Recently, we identified 3 novel amino acid-conjugated CA species and showed that these microbially generated BAs were enriched in patients with inflammatory bowel disease.30 Building on this study, we interrogated the cecal metabolome datasets for evidence of non-classic amino acid-conjugated BAs. In agreement with our earlier study, phenylalanine (Phe)-, leucine (Leu)-, and tyrosine (Tyr)-conjugated CAs were detected. In addition, serine (Ser)-, alanine (Ala)-, tryptophan (Trp)-, and glutamine (Glu)-conjugated CAs were also identified (Figure 4A). The core CA mass spectral fragmental pattern was evident in these non-classic conjugated CA derivatives (amino acid-conjugated CAs [AA-CAs]), with additional patterns consistent with the presence of the identified amino acids conjugated through an amide bond at the normal glycine/taurine conjugation site (Figure 4A). Moreover, the proposed structures were validated using synthesized standards with retention time and tandem MS (MS/MS) fragmentation patterns matching on several instrument platforms, including targeted MS. While the levels of AA-CAs varied between individual mice, HFD increased the levels of Gly-CA and Phe-CA in both WT and APCmin/+ mice and the concentrations of Leu-CA and Ser-CA in WT mice (Figure S6E; HFD-induced changes in representative WT mice are quantified in Table 1). Consistent with earlier observations,30 these AA-CAs were detected in cecum but not in serum samples, supporting the notion that they are synthesized by the gut microbiome.30
Figure 4. Non-classic amino acid-conjugated bile acids in cecum sample.
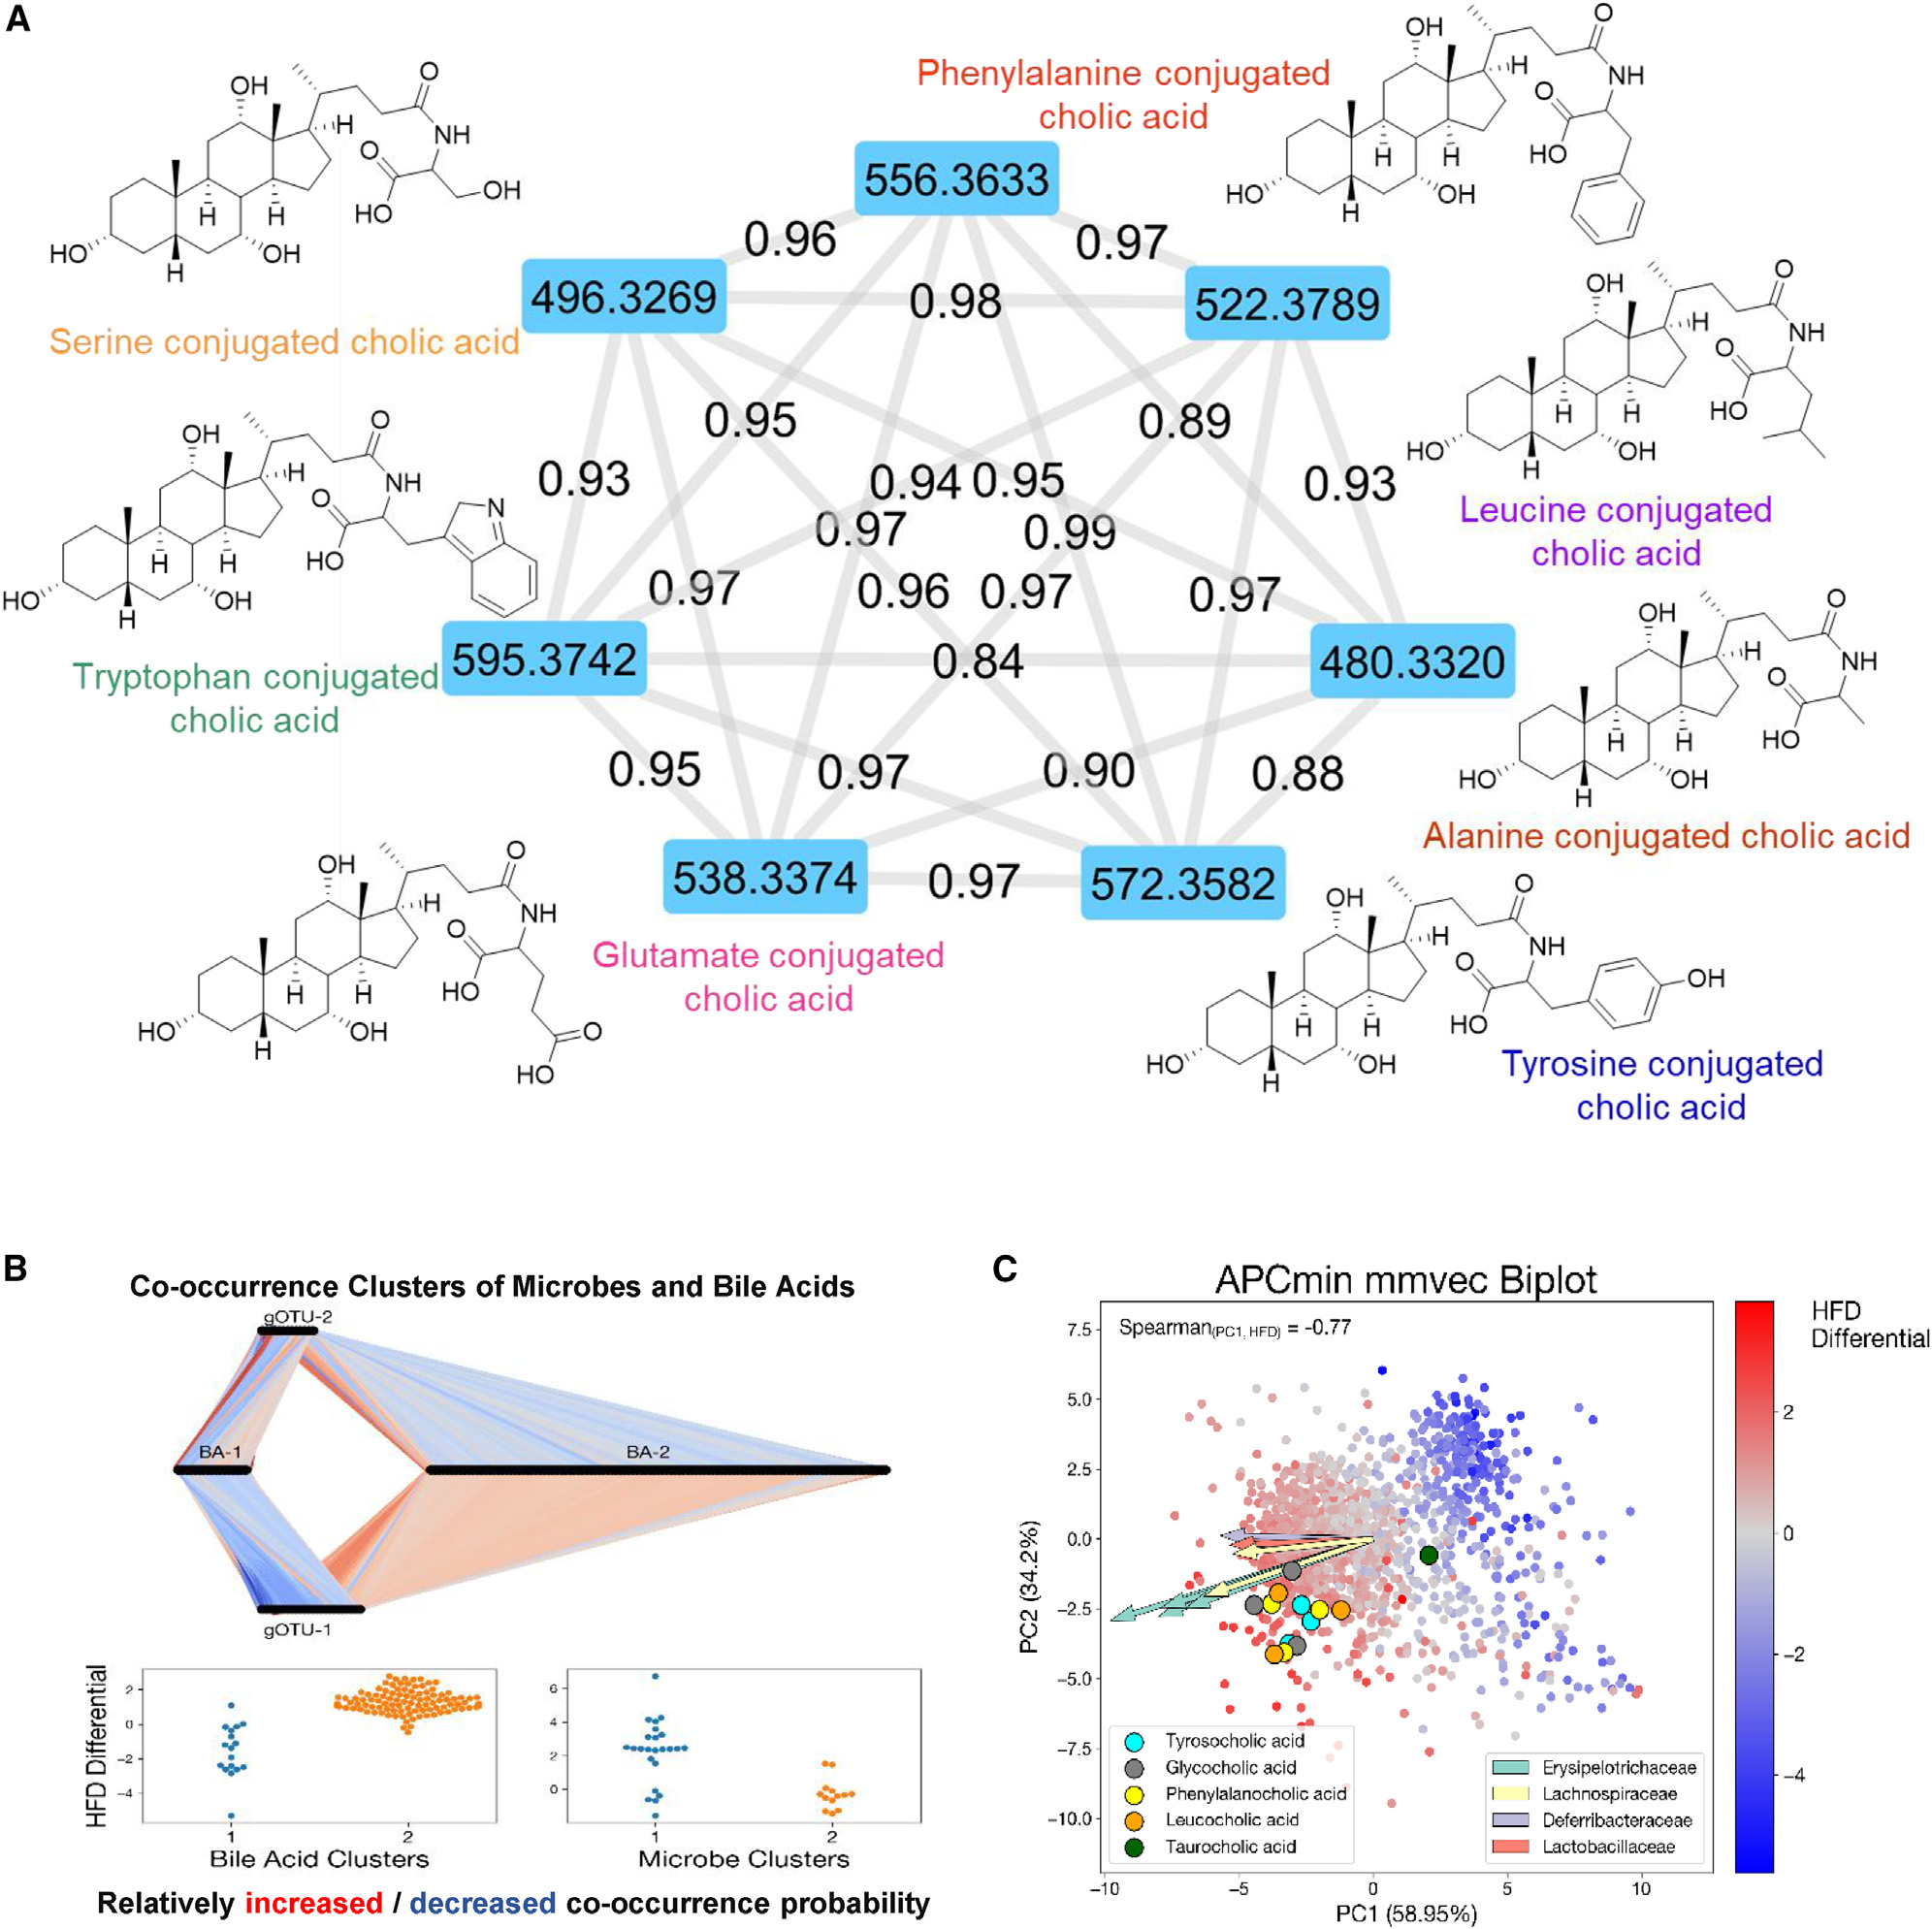
(A) MS/MS spectra network analysis of the detected 7 novel bile acids. Chemical structure and molecular weight are presented.
(B) MMvec microbe-metabolite co-occurrences study of tumor progression in APCmin/+ mice on ND (adenoma) and HFD (adenocarcinoma). Conditional probabilities exhibit a biclustering pattern between bile acids and gOTUS corresponding to ND and HFD. Connections between microbes and metabolites correspond to increased or decreased co-occurrence probability relative to all other microbes. Association was assigned by comparing cluster features to both metagenomic and metabolomic Songbird differentials.
(C) Biplot of MMvec results from APCmin/+ mice. Points represent metabolites, and arrows represent most informative microbial features. Color of points corresponds to the Songbird-calculated association of each metabolite with the HFD compared with the ND. Novel bile acids are highlighted with different colors. Spearman correlation between PC1 of the MMvec ordination and the HFD differential was 0.77.
See also Figure S6.
Non-classic conjugated BAs are microbially generated
To explore causal associations between microbial content and the metabolome, the co-occurrence probabilities between microbial taxa and metabolites in APCmin/+ cecum samples were estimated.28 The conditional probability of observing a metabolite, given that a microbe was observed, was estimated using the neural network MMvecs (microbe-metabolite vectors),28 which predict metabolite abundances from microbe sequences. Using operational taxonomic units (OTUs) to cluster microbes based on sequence similarities, associations between BAs and microbial species were determined by normalized conditional probabilities. These analyses revealed the effect of diet on the co-occurrence of clusters of microbes and specific BAs in APCmin/+ mice (Figure 4B).28 Moreover, the MMvec showed clear stratification of the metabolomics data according to diet effects in APCmin/+ mice (Figure 4C). We then performed differential abundance on the identified metabolites to parallel the metagenomic analysis in determining which metabolic features were associated with diet and genotype. Considering that these AA-BAs also use amino acids as resources, we used the MMvec results to identify candidate producers by Spearman correlation analysis of the first MMvec PC with HFD log fold changes in APCmin/+ mice (Figure 4C). A strong correlation was observed, indicating that PC1 seems to be strongly driven by diet (Figure S6F).14 Detailed correlations between candidate producers and different BA categories are presented as a cluster map (Figure S6G). Several bacterial species are highly correlated with AA-CA production.28,30 In particular, Tyr-, Phe-, and Leu-conjugated CAs are highly associated with Erysipelotrichaceae, Lachnospiraceae, and Lactobacillaceae (Figure 4C).5,30,31
Novel conjugated BAs are biologically functional
We next explored how these alternative amino acid conjugations affect CA-driven physiology. Initially, signaling through FXR and TGR5 (encoded by G protein-coupled BA receptor 1 [GPBAR1], a membrane-bound BA receptor) was evaluated using luciferase reporters containing FXR or TGR5 downstream cAMP response elements transfected into kidney HEK293 cells overexpressing human or mouse FXR or TGR5 genes.32,33 In these reporter assays, Phe, Tyr, Trp, and Glu conjugation increased CA signaling via human, and to a lesser extent via mouse, FXR compared with taurine and glycine, while Leu-, Ser-, and Ala-conjugated CAs functioned as weak FXR agonists or even antagonists (Figures 5A and S7A). In terms of TGR5, Leu, Phe, and Tyr conjugation increased and Glu, Trp, Ala and Ser conjugation decreased CA activation of mouse TGR5 relative to the taurine conjugate, while all alternate conjugations reduced or eliminated activation of human TGR5 (Figures 5B and S7B). To associate AA-CA signaling with functional outcomes, the abilities to promote intestinal cell proliferation were compared.11,33 Taurine conjugation reduced the ability of CAs to promote growth of intestinal organoids derived from WT mice but had less of an effect on-APCmin/+-derived intestinal organoids (Figures S7C and S7E). Ala conjugation similarly attenuated CA-driven proliferation, while Ser-, Leu-, and Glu-conjugated CAs largely eliminated the proliferative effects (Figures 5C and S7D). Somewhat unexpectedly, Ser-CA, a BA previously found to associate with lymphocytic choriomeningitis virus (LCMV) infection in mice and with human Crohn’s disease,21 increased the expression of intestinal stem cell marker genes in WT organoids (Figure 5D). In contrast, CA conjugated with the aromatic amino acids (Trp, Tyr, Phe) inhibited organoid proliferation, consistent with reduced expression of stem cell marker genes in WT organoids (Figures 5C, 5D, and S7D–S7F). Interestingly, these AA-CAs showed varying activation of FXR and TGR5 target genes, alluding to the complexity of BA functionality (Figures 5D and S7G).
Figure 5. Biological activity of non-classic conjugated Bas.

(A) Dose-dependent activation of exogenous mouse FXR by amino acid-conjugated CA species. Luciferase activity in HEK293 cells expressing a luciferase reporter gene functionally linked to an FXR-responsive element (FXRE-Luc). n = 8 per concentration.
(B) Dose-dependent activation of exogenous mouse TGR5 by amino acid-conjugated CA species. Luciferase activity in HEK293 cells expressing a luciferase reporter gene functionally linked to a cAMP-responsive element that is downstream of TGR5. n = 8 per concentration.
(C) Dose-dependent proliferation of intestinal organoids from WT mice treated with CA (left), Ala-CA (center), and Trp-CA (right), measured by luminescent cell viability assay. n = 6 per concentration.
(D) Relative expression of FXR and TGR5 target genes and intestinal stem cell marker genes in intestinal organoids from WT mice treated with amino acid-conjugated cholic acid species (10 μM for 24 h, n = 3 per treatment).
(E) Cellular transport of amino acid-conjugated cholic acid species, as determined by the efflux ratio in Caco2 cells. Atenolol and propranolol serve as negative and positive controls, respectively. Digoxin serves as a positive control for P-glycoprotein-mediated efflux (n = 2). Data represent the mean ± SEM. *p < 0.05; **p < 0.01; ***p < 0.005. Student’s unpaired t test.
See also Figure S7.
Wnt signaling is an important driver of intestinal stem cell growth, with nuclear β-catenin activity largely mediated by the downstream TCF/LEF (T cell factor/lymphoid enhancer-binding factor) pathway. Surprisingly, each of the AA-CAs promoted Wnt signaling, albeit at supraphysiological concentrations, as measured by TCF/LEF activity in the colon cancer cell line HT29 (Figures S7H and S7I).
While 90% of classic BAs are recycled to the liver, we previously reported that Phe-CA, Tyr-CA, and Ala-CA were not detected in mouse or human portal or peripheral blood.30 To predict the potential for these AA-CAs to be recycled, Caco2 permeability assays were performed with atenolol and propranolol as low- and high-permeability controls and with digoxin as a substrate for transporter-mediated uptake. With the exception of Glu-CA, the alternate AA-CAs displayed high efflux ratios (>2). However, the markedly reduced permeabilities compared to Gly-CA suggest that these alternately conjugated BAs are transported at much lower levels or not at all into the bloodstream (Figures 5E and S7J).
To support the notion that these AA-BAs are microbially derived, total cecal bacteria were cultured in the presence of increasing concentrations of exogenous CA. Each of the AACAs was detected in anaerobic cultures, with increased levels seen in cecal bacterial collected from HFD mice (Figure 6A). Aerobic cultures were similarly able to generate the AA-CAs, albeit at lower levels (Figure S8A). In addition, anaerobic cultures were able to utilize tauro-CA as a substrate, consistent with the presence of bile salt hydrolases (BSHs) in these cecum cultures (Figure S8B). However, the majority of cultures did not efficiently conjugate CDCA or DCA (Figures S8C and S8D). To validate the predicted associations of AA-CAs with specific bacterial species (Figure 4C), individual cultures of Ruminococcus gnavus, Clostridium scindens, Ileibacterium valens, Lactobacillus reuteri, and Lactobacillus acidophilus were incubated with increasing concentrations of CA. Interestingly, preferences for conjugating the different amino acids were seen with individual bacteria (Figures 6B, 6C, and S8E).31,34,35 Moreover, activation of FXR increased bacterial loads of Ileibacterium valens and Ruminococcus gnavus in HFD-fed APCmin/+ mice (Figure 6D). These data highlight the complexity of the microbiome-metabolome interaction, as well as implicate specific strains such as Ileibacterium valens in CRC.5,36,37
Figure 6. Bacterial synthesis of non-classic conjugated Bas.

(A) Dose-dependent generation of conjugated CA species in anaerobic cultures of cecal bacteria from WT and APCmin/+ mice on ND and HFD. Cultures were supplemented with increasing concentrations of CA for 48 h prior to mass spectral analysis.
(B) Dose-dependent generation of conjugated cholic acid species in anaerobic cultures of Ruminococcus gnavus (left panel), Clostridium scindens (middle panel), and Ileibacterium valens (right panel). Cultures were supplemented with increasing concentrations of CA for 48 h prior to mass spectral analysis.
(C) Dose-dependent generation of conjugated CA species in anaerobic cultures of Ileibacterium valens. Cultures were supplemented with increasing concentrations of T-CA for 48 h prior to mass spectral analysis.
(D) Changes in Ileibacterium valens, Ruminococcus gnavus, and Clostridium scindens levels in ND- and HFD-fed APCmin/+ mice treated with FexD or vehicle for 8 weeks, determined by qPCR. Data represent the mean ± SEM. For two-group comparation, Student’s unpaired t test was used. For more than two-group comparation, one-way ANOVA was used. *, #p < 0.05; **, ##p < 0.01; ***, ###p < 0.005.
See also Figure S8.
DISCUSSION
This study demonstrates the combinatorial effects of genetic and dietary risk factors on the gut microbiome and metabolome. Our results show that both genetic and dietary risk factors contribute to the alterations in the serum and cecum metabolome profiles. Interestingly, the effects of diet are more pronounced in cecum than in serum. Distinct from the effects on serum metabolites, we find that diet is the major determinant of cecum metabolites and gut microbiome species.
As early dietary sensors and genetic effectors, BAs have emerged as pleiotropic signaling molecules mediating intestinal tumorigenesis and inflammation.26,38 Recent technological advances have led to the characterization of more than 170 BAs,21,39,40 of which more than 60 have been directly observed in human fecal samples.30 Here, we characterize 7 non-classic amino acid-conjugated BAs enriched in HFD-fed mice, consistent with previous association studies.21,28,30,39 These microbially modified CA derivatives appear restricted to the gut, distinguishing them from host-conjugated BAs. We show that non-classic amino acid conjugation selectively modulates CA signaling via FXR and TGR5, as well as its ability to promote Wnt signaling and intestinal stem cell proliferation, key steps in CRC initiation and progression.11,33 Microbial diversity analysis across both genotype and diet demonstrates strong microbial association with tumorigenesis in both α and β diversity. We characterize specific microbial taxa associated with both genetic and dietary effects. Furthermore, the strong taxonomic and phylogenetic association of identified microbial features points to conserved evolutionary signals strongly coupled to diet response and, to a lesser extent, genotype. Our multi-omics analyses also show that diet is the strongest driver of microbe-metabolite interactions, especially so in the identified BAs. Notably, MMvec is an unsupervised neural network, indicating a high degree of confidence in our results, as the multi-omics results concord with our supervised differential abundance analysis of microbes and metabolites. Moreover, we identify potential gut microbes capable of conjugating CAs including Ileibacterium valens. Ileibacterium valens has been recently implicated in microbial-induced obesity and intestinal inflammation through its production of interleukin-17 (IL-17) cytokines and antimicrobial peptides.37 Our findings show an enrichment of Ileibacterium valens strains in adenocarcinoma mouse models, suggesting that this species may promote tumorigenesis.5
In general, the modulation of gut microbiota and BA profiles holds promise as a novel therapeutic approach for the treatment of gastrointestinal cancers and represents the next frontier for gastrointestinal cancer research.
Limitations of the study
Human CRCs are heterogeneous, with the convergence of genetic and environmental factors over a prolonged period thought to affect both the underlying genetic mutations and tumor locations.41 In contrast, the dependency on a single mutation and the rapidity of tumor development are considered limitations of the APCmin/+ model. In addition, the known differences in the compositions of the intestinal microbiome and the BA pool between mice and humans limit the direct translation of our studies. Furthermore, our HFD studies fail to recapitulate the varied diets of people.
STAR★METHODS
RESOURCE AVAILABILITY
Lead contact
Further information and requests for resources and reagents should be directed to and will be fulfilled by the lead contact, Drs. Ronald Evans (evans@salk.edu).
Materials availability
This study did not generate any new unique plasmids, mouse lines or reagents.
Data and code availability
Microbiome 16S rRNA gene amplicon and shotgun sequencing data reported in this paper have been deposited at Qiita study ID 10955 (https://qiita.ucsd.edu/study/description/10955) and are publicly available. Serum and cecum metabolite profiling data reported in this paper have been deposited at MetaboLights (www.ebi.ac.uk/metabolights/MTBLS5765) and are publicly available. Accession numbers are listed in the key resources table.
This paper does not report original code.
Any additional information required to reanalyze the data reported in this paper is available from the lead contact upon request.
KEY RESOURCES TABLE.
| REAGENT or RESOURCE | SOURCE | IDENTIFIER |
|---|---|---|
|
| ||
| Bacterial and virus strains | ||
|
| ||
| Ruminococcus gnavus strain VPI C7-9 | ATCC | Cat #29149 |
| Clostridium scindens strain VPI 13733 | ATCC | Cat #35704 |
| Ileibacterium valens strain NYU-BL-A3 | ATCC | Cat #TSD-63 |
| Lactobacillus acidophilus strain VPI 11091 | ATCC | Cat # 9224 |
| Lactobacillus reuteri strain IDCC3701 | ATCC | Cat # BAA-2837 |
|
| ||
| Chemicals, peptides, and recombinant proteins | ||
|
| ||
| Tauro-chenodeoxycholic acid (T-CDCA) | Caymen Chemical | Item# 20275 |
| Glyco-chenodeoxycholic acid (G-CDCA) | Caymen Chemical | Item# 16942 |
| Chenodeoxycholic acid (CDCA) | Steraloids | Cat# C0940-000 |
| Tauro-β-muricholic acid (T-βMCA) | Steraloids | Cat# C1899-000 |
| β-muricholic acid (βMCA) | Steraloids | Cat#C1895-000 |
| α-muricholic acid (αMCA) | Steraloids | Cat#C1890-000 |
| Tauro-cholic acid (T-CA) | Caymen Chemical | Item# 16215 |
| Glyco-cholic acid (G-CA) | Caymen Chemical | Item# 20276 |
| Cholic acid (CA) | Caymen Chemical | Item# 20253 |
| Tauro-deoxycholic acid (T-DCA) | Caymen Chemical | Item# 15935 |
| Glyco-deoxycholic acid (G-DCA) | Caymen Chemical | Item# 20274 |
| Deoxycholic acid (DCA) | Steraloids | Cat# C1070-015 |
| Lithocholic acid (LCA) | Steraloids | Cat# C1420-000 |
| Tauro-lithocholic acid (T-LCA) | Caymen Chemical | Item# 17275 |
| Glyco-lithocholic acid (G-LCA) | Caymen Chemical | Item# 21723 |
| ω-muricholic acid (ωMCA) | Steraloids | Cat#C1888-000 |
| γ -muricholic acid (γ-MCA) | Steraloids | Cat# C1850-000 |
| Tauro-hyodeoxycholic Acid (T-HDCA) | Caymen Chemical | Item# 21956 |
| Glyco-hyodeoxycholic Acid (G-HDCA) | Caymen Chemical | Item# 22643 |
| Hyodeoxycholic Acid (HDCA) | Steraloids | Cat# C0885-000 |
| Tauro-Ursodeoxycholic Acid (T-UDCA) | Caymen Chemical | Item# 20277 |
| Glyco-ursodeoxycholic Acid (G-UDCA) | Caymen Chemical | Item# 21698 |
| Ursodeoxycholic Acid (UDCA) | Caymen Chemical | Item# 15121 |
| Cholic-2,2,4,4-d4 acid | C/D/N Isotopes | D-2452 |
| Chenodeoxycholic-2,2,4,4-d4 acid | C/D/N Isotopes | D-2772 |
| Lithocholic-2,2,4,4-d4 acid | C/D/N Isotopes | D-3742 |
| Fexaramine D | WUXI | Custom order |
| Serine conjugated cholic acid (Ser-CA) | WUXI | Custom order |
| Alanine conjugated cholic acid (Ala-CA) | WUXI | Custom order |
| Phenyalanine conjugated cholic acid (Phe-CA) | WUXI | Custom order |
| Tyrosine conjugated cholic acid (Tyr-CA) | WUXI | Custom order |
| Leucine conjugated cholic acid (Leu-CA) | WUXI | Custom order |
| Glutamate conjugated cholic acid (Glu-CA) | WUXI | Custom order |
| Tryptophan conjugated cholic acid (Trp-CA) | WUXI | Custom order |
| INT-777 | Caymen Chemical | Item# 17678 |
| pre-reduced anaerobic transport media (ATM) | Anaerobe System Inc | Cat #AS-911 |
| Anaerobic Enrichment Broth (MTGE BROTH) | Anaerobe System Inc | Cat # AS-778 |
| Yeast Casitone Fatty Acids Agar with Carbohydrates without blood (YCFAC) plates | Anaerobe System Inc | Cat # AS-675 |
| Yeast Casitone Fatty Acids Agar with Carbohydrates with blood (YCFAC-B) plates | Anaerobe System Inc | Cat # AS-677 |
| Brucella Blood Agar | Anaerobe System Inc | Cat # AS-141 |
| ATCC 260 Tryptic Soy Broth | Fisher scientific | BD 211825 |
| ATCC 260 Tryptic Soy Agar | Fisher scientific | BD 236950 |
| ATCC 416 MRS broth medium | Fisher scientific | BD 288130 |
| Water | Fisher scientific | W64 |
| Acetonitrile | Fisher scientific | A9554 |
| Methanol | Fisher scientific | A4564 |
| Formic acid | Fisher scientific | A117-50 |
|
| ||
| Critical commercial assays | ||
|
| ||
| Total bile acid assay kit | Diazyme laboratories | Cat #DZ042A-K |
| CellTiter-Glo Luminescent Cell Viability Assay Kit | Promega Corporation | Cat #G7572 |
| CellTiter-Glo Luminescent 3D Cell Viability Assay Kit | Promega Corporation | Cat #G9683 |
| Dual-Luciferase reporter kit | Promega Corporation | Cat #PRE1910 |
| Cignal TCF/LEF Reporter (luc) Kit | Qiagen | Cat#CCS-018L |
| RNeasy Mini Kit | Qiagen | Cat #74106 |
| RNeasy Micro Kit | Qiagen | Cat #74004 |
| Bio-Rad iScript Reverse Transcription supermix | Bio-rad | Cat #1708841 |
| Advanced Universal SyBr Green Supermix | Bio-rad | Cat #725271 |
| Matrigel, growth factor reduced | Corning | Cat #354230 |
| Gentle cell dissociation buffer | Stem Cell Inc | Cat #7174 |
| Intesticult organoid growth medium | Stem Cell Inc | Cat #6005 |
| PBS (Mg2+/Ca2+) solution | Corning | Cat # 21-031-CM |
| FBS | Gemini Bio-products | Cat #900-208 |
| Antibiotic-Antimycotic solution | Gibco | Cat #15240062 |
| Penicillin-Streptomycin | Gibco | Cat #15070063 |
|
| ||
| Deposited data | ||
|
| ||
| Microbiome 16S rRNA gene amplicon and shotgun sequencing data | Illumina HiSeq4000 platform | Qiita study ID 10955 |
| Serum and Cecum Metabolites profiling data | Bruker Impact II™ UHR-QqTOF (Ultra-High Resolution Qq-Time-Of-Flight) mass spectrometer coupled with the Agilent 1290 Infinity™ II LC system | MetaboLights (www.ebi.ac.uk/metabolights/MTBLS5765) |
|
| ||
| Experimental models: Cell lines | ||
|
| ||
| HT29 | ATCC | Cat# HTB-38, RRID:CVCL_0320 |
| CACO2 | ATCC | Cat# HTB-37, RRID:CVCL_0025 |
| HEK293 | ATCC | Cat# PTA-4488, RRID:CVCL_0045 |
|
| ||
| Experimental models: Organisms/strains | ||
|
| ||
| Mouse: C57BL/6J | The Jackson Laboratory | Cat# JAX:000664, RRID:IMSR_JAX:000664 |
| Mouse: C57BL/6J-ApcMin/J | The Jackson Laboratory | Cat# JAX:002020, RRID:IMSR_JAX:002020 |
|
| ||
| Oligonucleotides | ||
|
| ||
| Primers for RT-qPCR, see Table S2. | IDT | Designed using Primer 3 software |
|
| ||
| Software and algorithms | ||
|
| ||
| STAR | Dobin et al.32; https://github.com/alexdobin/STAR | |
| RSEM | https://deweylab.github.io/RSEM/ | N/A |
| rsem-generate-data-matrix and rsem-run-ebseq commands | https://deweylab.github.io/RSEM/rsem-run-ebseq.html | N/A |
| GSEA | https://www.gsea-msigdb.org/gsea/index.jsp | N/A |
| Emperor | https://biocore.github.io/emperor/ | N/A |
| SurvExpress | https://ngdc.cncb.ac.cn/databasecommons/database/id/1097 | N/A |
| Homer | http://homer.ucsd.edu/homer/ | N/A |
| CASAVA-1.8.2 | https://www.illumina.com/ | Illumina |
| Fiji | https://fiji.sc/ | |
| FreeStyle | Thermo Fisher Scientific | |
EXPERIMENTAL MODEL AND STUDY PARTICIPANT DETAILS
Animals
WT C57BL/6J (Cat # 000664) and APCmin/+ (Cat # 002020) were purchased from Jackson Laboratory. All animal experiments were performed in the specific pathogen-free facilities at the Salk Institute following the Institutional Animal Care and Use Committee’s guidelines. WT and APCmin/+ mice were maintained on a normal chow diet (ND) or placed on a high-fat diet (HFD, Harlan Teklad, 60% of calories from fat) from 4 weeks of age. For early intervention experiments, Fexaramine D (FexD, 50 mg/kg in corn oil) or vehicle was orally gavaged daily from 8 weeks of age for APCmin/+ mice on ND, or 6 weeks for APCmin/+ mice on HFD.11 As all studies were performed in male mice, the research findings may not be generalizable to female mice.
Human cancer cell lines
The human cancer cell lines Caco2, HT29, and HEK293 cells were acquired from ATCC and cultured according to the supplier’s instructions. Briefly, the cells were maintained under standard cell culture conditions (37°C, 5% CO2) in DMEM containing 10% (v/v) heat-inactivated fetal bovine serum, and 100x Penicillin-Streptomycin (10,000 U/mL) (Gibco).
METHOD DETAILS
Isolation and generation of intestinal organoid
Intestines were washed in ice-cold PBS (Mg2+/Ca2+ (Corning, cat # 21-031-CM), containing 2% BSA (Gemini Bio-products, cat #900–208) and 2% antibiotic-antimycotic (Gibco, cat #15240–062). Crypts and villi were exposed by dicing the intestines into small pieces (1–2 cm long), followed by extensive washes to remove contaminants. Then, a gentle cell dissociation reagent (Stem cell technologies, cat #7174) was used according to the manufacturer’s instructions. Briefly, intestinal pieces were incubated on a gently rotating platform for 15 min. After that, the gentle cell dissociation reagent was removed and the intestines were washed 3 times with a PBS wash buffer with vigorous pipetting. The first and second fractions that usually contain loose pieces of mesenchyme and villi were not used. Fractions three and four containing the intestinal crypts were collected and pooled. Isolated crypts were filtered through a 70mm nylon cell strainer (Falcon, cat #352350). Crypts were counted, then embedded in Matrigel (Corning, growth factor reduced, cat #354230), and cultured in Intesticult organoid growth medium (Stem cell technologies, cat #6005). For mouse colon organoids, additional Wnt3a (300 ng/μL, R&D, cat #5036-WN-010) was added. Intestinal organoids used in this study were generated from WT and APCmin/+ mice at 37°C, 5% CO2.
Bacteria culture and synthesis of amino acid conjugated bile acids
Total cecal bacteria were collected from WT and APCmin/+ mice on ND and HFD. Briefly, 3–5 mice in each group were sacrificed and the cecum pouch was opened in an anaerobic chamber. The cecum contents of the same group were pooled and washed with pre-reduced anaerobic transport media (ATM) (#AS-911, Anaerobe System Inc). The pooled bacteria pellets were divided and 1/5 were cultured on one plate of Yeast Casitone Fatty Acids Agar with Carbohydrates either without or with blood (YCFAC or YCFAC-B) plates (#AS-675, #AS-677, Anaerobe System Inc) in an anaerobic chamber or with oxygen. After 48–72 h culturing at 37°C, whole bacteria were harvested and pooled from 5 plates using ATM media and combined to represent one group of mice. 100 μL of combined cecal suspension was transferred to YCFAC broth with a gradient (from 1 ng/ml to 5 mg/ml) Cholic acid (CA) as a substrate. After culturing at 37°C for 48–72h, metabolites were extracted from the supernatant and amino acid conjugated bile acids (AA-BAs) detected by LC-MS/MS analysis (see description of sample preparation below).
Bacterial pellets from Ruminococcus gnavus strain VPI C7–9 (#29149) and Clostridium scindens strain VPI 13733 (#35704), were purchased from ATCC and rehydrated in 0.5mL ATCC 260 broth medium Tryptic Soy Broth (BD 211825) 30g, Sheep Blood 50mL, DI water 950mL) under anaerobic conditions. 100mL of resuspended culture was then plated on ATCC 260 Medium (Tryptic Soy Agar(BD 236950) 40g with 5% Sheep Blood (defibrinated) 50 mL, DI Water 950 mL). The remaining rehydrated bacterial culture was transferred to 5mL ATCC 260 broth medium. Lactobacillus acidophilus strain VPI 11091 (#9224) and Lactobacillus reuteri strain IDCC3701 (#BAA-2837), were purchased from ATCC and rehydrated in 0.5mL ATCC 416 MRS broth medium. 100μL of bacteria culture was then plated on ATCC 416 MRS agar. Ileibacterium valens strain NYU-BL-A3 (#TSD-63) was purchased from ATCC and rehydrated in 0.5mL MTGE broth medium (anaerobe Systems).100μL of bacteria culture was then plated on Brucella agar supplemented with 5% Sheep blood, Vitamin K, and Hemin (anaerobe Systems). All cultures were incubated in an anaerobic atmosphere containing a gas mix of 5% hydrogen and 95% nitrogen at 37°C for 24–48 h. Bacteria cultures were treated with cholic acid (final concentrations from 1 ng/ml to 5 mg/ml) in each specific culturing medium and cultured in total anaerobic conditions. After culturing for 48hrs, supernatants were collected for untargeted metabolomics. To extract metabolites, supernatants (200 μL) were first mixed with 600 μL LC-MS grade ice-cold methanol. The solution was placed in a −20°C freezer for 2 h to denature and precipitate the proteins. Centrifugation (14000 rpm, 4°C, 15 min) removed the precipitated proteins and the supernatant was carefully transferred to a new vial. The solvent was evaporated in a Speedvac at 4°C. The dried sample was reconstituted in 200 μL solvent (ACN:H2O = 1:3, v/v). The reconstituted sample was centrifuged (14000 rpm, 4°C, 15 min) again to remove any insoluble particles. The final solution was transferred into the LC glass insert for untargeted LC-MS/MS analysis in data-dependent acquisition mode on a Bruker Impact II Ultra-High Resolution Qq-Time-Of-Flight Mass Spectrometer (UHR-QqTOF-MS) coupled with an Agilent 1290 Infinity II Ultra-High-Performance Liquid Chromatography (UHPLC) system.
Fecal and serum bile acid analyses; total and compositional
Bile acids were measured in mouse serum, cecum, and fecal samples by Total bile acid assay kit (Diazyme laboratories, cat #DZ042A-K). Serum samples were diluted 1:5 with a blank buffer and quantified using supplied controls. For fecal samples, total bile acids were extracted from 500mg feces. Compositional analyses of the bile acids pool was achieved using targeted Liquid chromatography-mass spectrometry (LC-MS). Authentic bile acid standards were purchased from Sigma, except glycolithocholic acid (GLCA), murideoxycholic acid (MDCA), HDCA, α-HCA, β-MCA, α-MCA ω-MCA, and Tauro-β-muricholic acid (T-βMCA) which were purchased from Steraloids (Newport, RI), taurocholic acid (TCA) from Calbiochem (San Diego, CA), and the deuterated bile acid standards cholic-2,2,4,4- d4 acid, chenodeoxycholic-2,2,4,4-d4 acid, and lithocholic-2,2,4,4-d4 acid from C/D/N Isotopes (Quebec, Canada). Mouse serum (20μL) was protein precipitated with 80μL of ice-cold acetonitrile containing 3.28ng of deuterated cholic acid (2, 2, 4, 4-d4 cholic acid) as an internal standard, vortexed 1min and centrifuged at 10,000 rpm for 10 min at 4°C. The supernatant was evaporated under vacuum at room temperature and reconstituted in assay mobile phase and transferred to a 96-well plate for analysis. Individual BA levels were measured using a Nextera UPLC (SHIMADZU, Kyoto, Japan) system in combination with a Q-TRAP 5500 Mass Spectrometer (AB SCIEX, Toronto, Canada) and Analyst Software 1.6.2.42 Chromatographic separations were performed with an ACQUITY (WATERS, Milford, MA) UPLC BEH C18 column (1.7microns, 2.1 × 100mm). The temperatures of the column and autosampler were 65°C and 12°C, respectively. The sample injection was 1μL. The mobile phase consisted of 10% acetonitrile and 10% methanol in water containing 0.1% formic acid (Mobile Phase A) and 10% methanol in acetonitrile 0.1% Formic Acid (Mobile Phase B) delivered as a gradient: 0–5min Mobile Phase B held at 22%; 5–12min Mobile Phase B increased linearly to 60%, 12–15min Mobile Phase B increased linearly to 80% and 15–19min Mobile Phase B constant at 80% at a flow rate of 0.5 mL/min. The mass spectrometer was operated in negative electrospray mode working in the multiple reaction mode (MRM). Operating parameters were Curtain gas 30psi; Ion spray voltage 4500 V; Temperature 550°C; Ion Source Gas 1 60psi; Ion Source Gas 2 65psi. Transition MRMs, declustering potential, entrance potentials, and collision cell exit potentials were optimized using the Analyst software. Dwell times were 25msec. Relevant to data in Figures 3, S5, S6B and S6D.
Cell viability assay and cell luciferase assay
The human cancer cell lines Caco2, HT29 and HEK293 cells were acquired from ATCC and cultured according to the supplier’s instructions. FexD and novel AA-BAs (see synthesis methods below) were dissolved in DMSO for in vitro experiments. CellTiter-Glo Luminescent Cell Viability Assay Kit (Promega, Cat #G7572) was used to assay cell viability after drug treatment. For luciferase assays, cell lines transfected with FXRE-Luc plasmids (FXR response element) and human or mouse FXR expression plasmids were treated with indicated compounds prior to measuring luciferase activities via Dual-Luciferase Reporter kits (Promega cat #PRE1910). Activation of TGR5 signaling was measured by Cignal cAMP response element Reporter (Luc) Kit (Qiagen, CCS- 001L). Wnt signaling reporter assay by Cignal TCF/LEF Reporter (Luc) Kit (Qiagen, CCS- 018L) was used.
Organoid studies
Organoids were treated with drugs either on day 2 or day 3 after plating to capture the early growth phase. CellTiter-Glo Luminescent 3D Cell Viability Assay Kit (Promega, Cat #G9683) was used to check cell viability after drug treatment. Organoids were directly lysed using TRIzol reagent (Ambion, cat #15596026), followed by a brief sonication (PowerLyzertm 24 MO Bio Laboratories Inc). RNeasy Mini Kit (Qiagen, cat #74106) was used for RNA extraction.
Gene expression analysis
Total RNA was extracted in TRIzol. cDNA was synthesized from 1μg of DNase-treated total RNA using Bio-Rad iScript Reverse Transcription supermix (#1708841) and mRNA levels were quantified by quantitative PCR with Advanced Universal SyBr Green Supermix (Bio-Rad, cat #725271). All samples were run in technical triplicates and relative mRNA levels were calculated by using the standard curve methodology and normalized to 36B4. All primers are listed in Table 1.
Cecum and serum sample preparation for untargeted LC-MS/MS
The cecum contents were stored in −80°C prior to processing. Approximately 15 mg of cecum sample were transferred to a 2.0 mL Thermo Scientific Screw Cap Micro Tube. For cecum sample, glass beads were added into each tube followed by 1 mL of water. The cecum samples were homogenized with the Mini-Beadbeater-24 (Biospec Products, Bartlesville, OK, USA) at 3800 strokes/minute for 10 s and then cooled down on ice for 1 min. The bead beating and cooling cycle was repeated 3 times. Five 100 μL aliquots of the homogenate were then transferred into new Eppendorf tubes for standard addition. Both serum and cecum samples were then centrifuged (14000 rpm, 15 min, 4°C), and the supernatant was dried down using a SpeedVac at 25°C. The samples were reconstituted in 50 μL of ACN and H2O (1:1, v/v) for LC-MS/MS analysis. For the serum samples, 100 μL of mouse serum was first mixed with 400 μL ice-cold methanol. The mixture was vortexed for 2 s and stored at −20°C overnight for complete protein precipitation. The clear supernatant, which contains metabolites, was separated from the precipitated protein by centrifugation at 14,000 rpm for 15min and dried using speed vac. Finally, the dried metabolite solution was reconstituted in 100 μL 1:1 ACN: H2O for LC-MS analysis. Relevant to data in Figures 2 and 4, S2, S3, S4, and S6E
Metabolomics data was processed in MS-DIAL43 using default peak picking, alignment parameter settings. Due to the low abundance of amino acid conjugated bile acids in untargeted metabolomics results, their MS signals were further manually checked for better quantitative precision and accuracy.44 Uni-variate, multi-variate statistical analyses and pathway enrichment analysis were performed in MetaboAnalyst (https://www.metaboanalyst.ca).45
Metabolomics data was further processed using feature-based molecular networking followed by Qemistree 22,46. Alpha and beta diversity calculations were performed in the same way as the microbiome analysis. Songbird analysis was performed on metabolites the same way as in the microbiome analysis.46 The following parameters were used for the Songbird model: epochs = 750, batch size = 5, differential prior = 1, learning rate = 0.0005 with the same formula as the metagenomics model. This model was compared to a “null” model with no covariates to ensure the regression model was not overfit. We used the Classyfire “subclass” taxonomic level to determine which metabolites were bile acids and amino acids (plus derivatives). Novel BA assignments were confirmed by comparing the assigned names with the known reference names. We followed up this confirmation by ensuring that the metabolites we characterized as novel BA had the same m/z value as our reference values.
Absolute quantification of amino acid conjugated cholic acids (AA-CAs)
Absolute quantification of amino acid conjugated cholic acids was performed using standard addition method on a Thermo TSQ Quantis coupled to a Vanquish UHPLC system (Thermo Fisher Scientific, Waltham, MA, USA) in LC-MRM mode. Amino acid conjugated bile acid (alanine, glutamic acid, leucine, phenylalanine, serine, tyrosine, and tryptophan) and cholic acid standards were pooled to generate five spiking solutions at 0 μM, 0.5 μM, 1.0 μM, 2.5 μM, and 5 μM. To the aliquots, 10 μL of spiking solution and 1000 μL of ice-cold MeOH were added. The solutions were vortexed and incubated overnight at −20°C.
Metabolites were separated on a Waters reversed phase UPLC Acquity BEH C18 Column (1.7 μm, 1.0 μm × 100 μm, 130 Å) (Milford, MA, USA). Mobile phases A and B were water and acetonitrile, respectively, with 0.1% formic acid added. The gradient was set as follows: 0 min, 5% B; 8 min, 25% B; 14 min, 70% B; 20 min, 95% B; 23 min, 95% B; 23.01 min, 5% B; 30 min, 5% B. Column temperature was set to 25°C, and the flow rate was 0.150 mL min−1. The injection volume was 5 μL. The MRM data was collected in positive ion mode, and the settings were as follows: position ion spray voltage, 3500 V; sheath gas, 35; aux gas, 7; ion transfer tube temperature, 300°C, and vaporizer temperature, 275°C. The precursor ions, product ions, collision energies, and retention times can be found in Table A. Absolute concentration of AA-CAs are listed in Table 2.
Table A.
MRM parameters for the targeted analysis of amino acid conjugated bile acids (AA-CA).
| AA-CA | Q1 (m/z) | Q3 (m/z) | Ce (V) | RT (min) |
|---|---|---|---|---|
|
| ||||
| alanine | 480.33 | 426.3 | 17 | 12 |
| cholic acid | 817.58 | 355.27 | 35 | 12.6 |
| glutamic acid | 538.33 | 484.31 | 19 | 11.6 |
| leucine | 522.38 | 468.35 | 17 | 13 |
| phenylalanine | 556.36 | 502.33 | 17 | 13.1 |
| serine | 496.33 | 442.3 | 19 | 11.5 |
| tryptophan | 595.37 | 541.34 | 20 | 13 |
| tyrosine | 572.36 | 518.33 | 17 | 12.1 |
Analyte concentrations were obtained using the standard addition method. Calculations were performed in R (ver. 4.1.3). The limit of detection was estimated using a sample that had only four amino acid conjugated bile acids detected with very low intensities (approximately 103) in the solution spiked with the 0 mM standard pool. The limit of detection (LOD) was calculated as three times the standard error of the fitted regression curve divided by the slope for each target compound.
Synthesis and LC-MS analysis of amino acid conjugated cholic acids (AA-CAs) in microbial culture
Amino acid conjugated cholic acid standard were prepared as described in Gomez-Mendoza (2014). Specifically, cholic acid (1.0 eq) was activated with 1-ethyl-3-(3-dimethylaminopropyl)carbodiimide (EDC, 2.0 eq) in dichloromethane (DCM, 30 V) prior to the dropwise addition of a solution of amino acid methyl ester (1.5 eq, HCl salt), DIEA (5.0 eq) and 4-pyrrolidin-1-yl pyridine (0.5 eq) in DCM (20 V) at 0°C. After stirring at 25°C for 12 h, silica gel thin-layer chromatography (TLC, petroleum ether: ethyl acetate; 1: 1) established that the reaction had reached completion. The reaction mixture was adjusted to pH 3 with HCl (1 M) at 25°C, diluted with H2O (20 V), then extracted twice with DCM (10 V). The combined organic layers were dried over Na2SO4, filtered, and vacuum concentrated to yield the crude conjugated methyl esters. These crude products (1.0 eq) were hydrolyzed with lithium hydroxide in aqueous methanol (LiOH (5.0 eq), MeOH (20 V), H2O (4V) degassed and purged 3 times with N2 then stirred at 25°C for 3 h under N2). TLC (petroleum ether: ethyl acetate; 1: 1) indicated the starting material was completely consumed. The reaction was neutralized with HCl (1 M), filtered, and vacuum concentrated prior to preparative HPLC (column: Waters Xbridge 150 * 255 mm; mobile phases: A, H2O (10mM HCl), B, MeOH; gradient: 20%–50% B over 10 min) and lyophilization to yield AA-BAs. Standard solutions were prepared (see Table below). 1.9 mg T1, 1.1 mg T2, 1.5 mg T3, 1.2 mg T4, 1.5 mg T5, 1.2 mg T6, and 1.3 mg T7 were each dissolved in 1 mL solvent (ACN:H2O = 1:1, v/v), and then diluted 10 times in the same solvent. The prepared solutions were transported into glass vials for LC-MS analysis.
| Abb. | Name |
|---|---|
| T1 | Tryptophan conjugated cholic acid |
| T2 | Serine conjugated cholic acid |
| T3 | Glutamate conjugated cholic acid |
| T4 | Alanine conjugated cholic acid |
| T5 | Phenylalanine conjugated cholic acid |
| T6 | Tyrosine conjugated cholic acid |
| T7 | Leucine conjugated cholic acid |
Targeted LC-MS analysis of serum and fecal bile acids
The LC-MS analysis was performed on Bruker Impact II UHR-QqTOF (Ultra-High Resolution Qq-Time-Of-Flight) mass spectrometer coupled with the Agilent 1290 Infinity II LC system. 2 μL of the seven standard solutions and 10 μL of culture media solutions were injected in sequence onto a Waters ACQUITY UPLC BEH C18 Column (130Å, 1.7 μm, 1.0 mm ×3 100 mm). 2 μL NaFA was injected for internal mass calibration. The mobile phase A was H2O (0.1% Formic acid); mobile phase B was ACN (0.1% Formic acid). The chromatographic gradient was run at a flow rate of 0.150 mL/min as follows: 0–8 min: linear gradient from 95% to 75% A; 8–14 min: linear gradient from 75% to 30% A; 14–20 min: linear gradient from 30% to 5% A; 20–23 min: hold at 5% A; 23–23.01 min: linear gradient from 5% to 95% A; 23.01–30 min: hold at 95% A. The mass spectrometer was operated in Auto MS/MS and positive mode. The ionization source capillary voltage was set to 4.5 kV. The nebulizer gas pressure was set to 1.6 bar. The dry gas temperature was set to 220°C. The collision energy for MS/MS was set to 7 eV. The data acquisition was performed in a range of 50–1200 m/z at a frequency of 8 Hz. Raw LC-MS data are publicly available on MetaboLights (www.ebi.ac.uk/metabolights/MTBLS5765).
Data Interpretation of targeted bile acid analysis
Bruker Data Analysis was used to calibrate the raw MS spectra and extract retention time, m/z, and intensity of the seven standard metabolites from their chromatograms. The extracted information was subsequently used as a reference to analyze the culture of media samples. We used the Bruker software TargetAnalysis to identify and relatively quantify the seven metabolites in all the culture media samples.47 The retention time, m/z, formula, and name of the seven metabolites were registered in the searching database of the software. The key searching parameter was set as follows: retention tolerance was 0.2–0.8 min; mass accuracy tolerance was 5–10 mDa; mSigma tolerance was 50–200. The chromatogram of each culture media sample was calibrated by internally injected NaFA (250 mM) before targeting the seven metabolites based upon retention time, m/z, and formula. The peak height and area of the corresponding identified metabolite were displayed on the result panel. In addition, the MS/MS spectra from the raw chromatogram were also manually validated for reassured identification.
Microbiome analysis
DNA extraction from mouse feces and shotgun sequencing were performed by the Center for Microbiome Innovation (CMI) at University of California, San Diego (UCSD). DNA sequencing libraries were prepared using Nextera Library Prep Kits (Illumina). Shotgun DNA sequencing was performed on the Illumina HiSeq4000 platform.
QIIME 2 was used to calculate diversity metrics for both 16S rRNA gene amplicon (16S) and metagenomics data. Faith’s phylogenetic diversity was calculated for each diet-genotype combination and compared with t-tests. For 16S data, the deblurred SEPP insertion tree was used with Greengenes 13_8 reference phylogeny. Shotgun metagenomic sequencing data were aligned to the Web of Life database of 10,575 reference bacterial and archaeal genomes using the SHOGUN v1.0.7 pipeline15 in the Bowtie2 alignment mode.13 Non-unique alignments (i.e., where one read was simultaneously aligned to multiple reference genomes) were excluded. The frequencies of reads assigned to individual reference genomes were calculated. A feature table with columns as reference genomes (OGUs)48 and rows as samples was constructed for downstream analysis. Unweighted UniFrac was used for both data types to compute beta diversity within and among groups.
Songbird was used to compute feature differential ranks for both diet and genotype.14,28 Differential ranks and log-ratios were visualized and calculated using Qurro.49 Statistical comparisons of sample log-ratios were performed using t-tests. The following parameters were used for the Songbird model: epochs = 5000, batch size = 30, differential prior = 0.5, learning rate = 0.0005. The following formula was used:
The regression model was compared to a “null” model with no covariates to ensure there was no overfitting. The phylogenetic tree of metagenomics features was created using Empress (https://journals.asm.org/doi/10.1128/mSystems.01216-20) Feature differentials were clipped to be centered around 0 and passed into Empress as feature metadata files.
Microbiome-metabolome association analysis
Co-occurrence probabilities between microbes and metabolites were calculated using mmvec. The following MMvec parameters were used: input prior = 1.0, output prior = 0.5, batch size = 30028. The input metagenomics feature table was subset to include only APCmin/+ mice samples. For the clustering analysis, the conditional ranks table was first subset to include only bile acids. This table was then Z-scored across all microbes and filtered to exclude any microbes that were highly co-occurrent (>2.5 SD) with fewer than 1% of bile acids. The network package in Python was used to create a bipartite graph of the resulting features into HFD/ND-associated bile acids and gOTUs.
PCR amplification of 16s rRNA
The presence of specific bacteria 16S rRNA genes in sample materials was first determined using a nested-PCR approach. Briefly, a community’s 16S rRNA genes were amplified using universal bacterial primers (Table 1) and 20 to 30 ng of community DNA as template. Following amplification, 2 μL of PCR product was analyzed by agarose gel electrophoresis to verify that 16S rRNA genes were amplified from the community DNA. Then, 2 μL of 1:2 and 1:50 dilutions of the 16S rRNA gene amplicons were used as templates in a second round of PCR with species-specific bacteria 16S rRNA gene-specific primer pair.
QUANTIFICATION AND STATISTICAL ANALYSIS
Statistics were performed using Prism GraphPad. Normal distribution within sample groups was first determined using the D’Agostino & Pearson normality test. Subsequently, the unpaired parametric t test (normal distribution) or A non-parametric Mann Whitney U-test (nonnormal distribution) was utilized when comparing two groups. When comparing three or more groups with one independent variable, parametric one-way ANOVA (normal distribution) or non-parametric Kruskal-Wallis test (nonnormal distribution) statistical analysis was utilized. two-way ANOVA was used when comparing more than 2 groups and/or more than two independent variables, such as time and treatment. Data represent the mean ± SEM. *, #p < 0.05; **, # #p < 0.01; ***, # # #p < 0.005. ns, non-significant. p < 0.05 was considered statistically significant. Details of the statistical tests and methodology for quantification are provided in the figure legends.
Supplementary Material
Table B.
Limits of Detection (LOD)
| AA_BAs | LOD (μM) |
|---|---|
|
| |
| cholic acid | 0.213 |
| phenylalanocholic acid | 0.016 |
| tyrosocholic acid | 0.011 |
| leucocholic acid | 0.031 |
| tryptophan conjugated CA | 0.020 |
| serine conjugated CA | 0.013 |
| alanine conjugated CA | 0.015 |
| glutamate conjugated CA | 0.016 |
Highlights.
Microbiome and metabolome changes during colorectal cancer (CRC) progression
High-fat diet is a dominant determinant of cecal microbiome in CRC-susceptible APCmin/+ mice
Microbially conjugated bile acids increase with high-fat diet
ACKNOWLEDGMENTS
We thank L. Ong and C. Brondos for administrative assistance. This work was funded by grants from the National Cancer Institute (CA014195), the National Institutes of Health (CA265762-01), the collaborative microbial metabolite center to P.C.D. (1U24DK133658-54701), DP1 AT010885/AT/NCCIH NIH HHS/United States to R.K., and UCSD Postdoc Microbiome Center Seed Pilot Grant to T.F. T.F. is supported by a Hewitt Medical Foundation Fellowship, a Salk Alumni Fellowship, and the Crohn’s & Colitis Foundation (CCFA) Visiting IBD Research Fellowship. R.M.E. and M.D. are supported, in part, by the Lustgarten Foundation (Distinguished Scholar Award to R.M.E. and 122215393-02). Research reported in this publication was supported by the NOMIS Foundation, an SWCRF Investigator Award, the David C. Copley Foundation, the Wasily Family Foundation, and the Don and Lorraine Freeberg Foundation (all to R.M.E.). R.M.E. holds the March of Dimes Chair in Molecular and Developmental Biology at the Salk. Work in the M.R. lab was funded by NIH grants AI126277, AI145325, AI154644, and AI114625, by the Chiba University-University of California-San Diego (UCSD) Center for Mucosal Immunology, Allergy, and Vaccines, and by the UCSD Department of Pediatrics. M.R. also holds an Investigator in the Pathogenesis of Infectious Disease Award from the Burroughs Wellcome Fund. Research reported in the publication was supported by the National Heart, Lung, and Blood Institute (NHLBI) of the National Institutes of Health under award number P01HL147835 (to R.M.E.) and by the National Institute of Diabetes and Digestive and Kidney Diseases of the National Institutes of Health under award number R01DK057978 (to R.M.E.). The content is solely the responsibility of the authors and does not necessarily represent the official views of the National Institutes of Health.
Footnotes
DECLARATION OF INTERESTS
The authors declare no competing interests.
SUPPLEMENTAL INFORMATION
Supplemental information can be found online at https://doi.org/10.1016/j.celrep.2023.112997.
REFERENCES
- 1.Ferlay J, Colombet M, Soerjomataram I, Mathers C, Parkin DM, Piñeros M, Znaor A, and Bray F (2019). Estimating the global cancer incidence and mortality in 2018: GLOBOCAN sources and methods. Int. J. Cancer 144, 1941–1953. 10.1002/ijc.31937. [DOI] [PubMed] [Google Scholar]
- 2.Islami F, Goding Sauer A, Miller KD, Siegel RL, Fedewa SA, Jacobs EJ, McCullough ML, Patel AV, Ma J, Soerjomataram I, et al. (2018). Proportion and number of cancer cases and deaths attributable to potentially modifiable risk factors in the United States. CA A Cancer J. Clin. 68, 31–54. 10.3322/caac.21440. [DOI] [PubMed] [Google Scholar]
- 3.Feng Q, Liang S, Jia H, Stadlmayr A, Tang L, Lan Z, Zhang D, Xia H, Xu X, Jie Z, et al. (2015). Gut microbiome development along the colorectal adenoma-carcinoma sequence. Nat. Commun. 6, 6528. 10.1038/ncomms7528. [DOI] [PubMed] [Google Scholar]
- 4.Nakatsu G, Li X, Zhou H, Sheng J, Wong SH, Wu WKK, Ng SC, Tsoi H, Dong Y, Zhang N, et al. (2015). Gut mucosal microbiome across stages of colorectal carcinogenesis. Nat. Commun. 6, 8727. 10.1038/ncomms9727. [DOI] [PMC free article] [PubMed] [Google Scholar]
- 5.Yachida S, Mizutani S, Shiroma H, Shiba S, Nakajima T, Sakamoto T, Watanabe H, Masuda K, Nishimoto Y, Kubo M, et al. (2019). Metagenomic and metabolomic analyses reveal distinct stage-specific phenotypes of the gut microbiota in colorectal cancer. Nat. Med. 25, 968–976. 10.1038/s41591-019-0458-7. [DOI] [PubMed] [Google Scholar]
- 6.Song M, and Chan AT (2019). Environmental Factors, Gut Microbiota, and Colorectal Cancer Prevention. Clin. Gastroenterol. Hepatol. 17, 275–289. 10.1016/j.cgh.2018.07.012. [DOI] [PMC free article] [PubMed] [Google Scholar]
- 7.Scott AJ, Alexander JL, Merrifield CA, Cunningham D, Jobin C, Brown R, Alverdy J, O’Keefe SJ, Gaskins HR, Teare J, et al. (2019). International Cancer Microbiome Consortium consensus statement on the role of the human microbiome in carcinogenesis. Gut 68, 1624–1632. 10.1136/gutjnl-2019-318556. [DOI] [PMC free article] [PubMed] [Google Scholar]
- 8.Wirbel J, Pyl PT, Kartal E, Zych K, Kashani A, Milanese A, Fleck JS, Voigt AY, Palleja A, Ponnudurai R, et al. (2019). Meta-analysis of fecal metagenomes reveals global microbial signatures that are specific for colorectal cancer. Nat. Med. 25, 679–689. 10.1038/s41591-019-0406-6. [DOI] [PMC free article] [PubMed] [Google Scholar]
- 9.Gill CIR, and Rowland IR (2002). Diet and cancer: assessing the risk. Br. J. Nutr. 88 (Suppl 1), S73–S87. 10.1079/BJN2002632. [DOI] [PubMed] [Google Scholar]
- 10.Powell SM, Zilz N, Beazer-Barclay Y, Bryan TM, Hamilton SR, Thibodeau SN, Vogelstein B, and Kinzler KW (1992). APC mutations occur early during colorectal tumorigenesis. Nature 359, 235–237. 10.1038/359235a0. [DOI] [PubMed] [Google Scholar]
- 11.Fu T, Coulter S, Yoshihara E, Oh TG, Fang S, Cayabyab F, Zhu Q, Zhang T, Leblanc M, Liu S, et al. (2019). FXR Regulates Intestinal Cancer Stem Cell Proliferation. Cell 176, 1098–1112.e18. 10.1016/j.cell.2019.01.036. [DOI] [PMC free article] [PubMed] [Google Scholar]
- 12.Thomas AM, Manghi P, Asnicar F, Pasolli E, Armanini F, Zolfo M, Beghini F, Manara S, Karcher N, Pozzi C, et al. (2019). Metagenomic analysis of colorectal cancer datasets identifies cross-cohort microbial diagnostic signatures and a link with choline degradation. Nat. Med. 25, 667–678. 10.1038/s41591-019-0405-7. [DOI] [PMC free article] [PubMed] [Google Scholar]
- 13.Hillmann B, Al-Ghalith GA, Shields-Cutler RR, Zhu Q, Knight R, and Knights D (2020). SHOGUN: a modular, accurate and scalable framework for microbiome quantification. Bioinformatics 36, 4088–4090. 10.1093/bioinformatics/btaa277. [DOI] [PMC free article] [PubMed] [Google Scholar]
- 14.Morton JT, Marotz C, Washburne A, Silverman J, Zaramela LS, Edlund A, Zengler K, and Knight R (2019). Establishing microbial composition measurement standards with reference frames. Nat. Commun. 10, 2719. 10.1038/s41467-019-10656-5. [DOI] [PMC free article] [PubMed] [Google Scholar]
- 15.Zhu Q, Mai U, Pfeiffer W, Janssen S, Asnicar F, Sanders JG, Belda-Ferre P, Al-Ghalith GA, Kopylova E, McDonald D, et al. (2019). Phylogenomics of 10,575 genomes reveals evolutionary proximity between domains Bacteria and Archaea. Nat. Commun. 10, 5477. 10.1038/s41467-019-13443-4. [DOI] [PMC free article] [PubMed] [Google Scholar]
- 16.Koppel N, and Balskus EP (2016). Exploring and Understanding the Biochemical Diversity of the Human Microbiota. Cell Chem. Biol. 23, 18–30. 10.1016/j.chembiol.2015.12.008. [DOI] [PubMed] [Google Scholar]
- 17.Zhao Z, Xiao Y, Elson P, Tan H, Plummer SJ, Berk M, Aung PP, Lavery IC, Achkar JP, Li L, et al. (2007). Plasma lysophosphatidylcholine levels: potential biomarkers for colorectal cancer. J. Clin. Oncol. 25, 2696–2701. 10.1200/JCO.2006.08.5571. [DOI] [PubMed] [Google Scholar]
- 18.Jing Y, Wu X, Gao P, Fang Z, Wu J, Wang Q, Li C, Zhu Z, and Cao Y (2017). Rapid differentiating colorectal cancer and colorectal polyp using dried blood spot mass spectrometry metabolomic approach. IUBMB Life 69, 347–354. 10.1002/iub.1617. [DOI] [PubMed] [Google Scholar]
- 19.Farshidfar F, Kopciuk KA, Hilsden R, McGregor SE, Mazurak VC, Buie WD, MacLean A, Vogel HJ, and Bathe OF (2018). A quantitative multimodal metabolomic assay for colorectal cancer. BMC Cancer 18, 26. 10.1186/s12885-017-3923-z. [DOI] [PMC free article] [PubMed] [Google Scholar]
- 20.Watrous J, Roach P, Alexandrov T, Heath BS, Yang JY, Kersten RD, van der Voort M, Pogliano K, Gross H, Raaijmakers JM, et al. (2012). Mass spectral molecular networking of living microbial colonies. Proc. Natl. Acad. Sci. USA 109, E1743–E1752. 10.1073/pnas.1203689109. [DOI] [PMC free article] [PubMed] [Google Scholar]
- 21.Wang M, Carver JJ, Phelan VV, Sanchez LM, Garg N, Peng Y, Nguyen DD, Watrous J, Kapono CA, Luzzatto-Knaan T, et al. (2016). Sharing and community curation of mass spectrometry data with Global Natural Products Social Molecular Networking. Nat. Biotechnol. 34, 828–837. 10.1038/nbt.3597. [DOI] [PMC free article] [PubMed] [Google Scholar]
- 22.Nothias LF, Petras D, Schmid R, Dührkop K, Rainer J, Sarvepalli A, Protsyuk I, Ernst M, Tsugawa H, Fleischauer M, et al. (2020). Feature-based molecular networking in the GNPS analysis environment. Nat. Methods 17, 905–908. 10.1038/s41592-020-0933-6. [DOI] [PMC free article] [PubMed] [Google Scholar]
- 23.Forsberg EM, Huan T, Rinehart D, Benton HP, Warth B, Hilmers B, and Siuzdak G (2018). Data processing, multi-omic pathway mapping, and metabolite activity analysis using XCMS Online. Nat. Protoc. 13, 633–651. 10.1038/nprot.2017.151. [DOI] [PMC free article] [PubMed] [Google Scholar]
- 24.Huan T, Forsberg EM, Rinehart D, Johnson CH, Ivanisevic J, Benton HP, Fang M, Aisporna A, Hilmers B, Poole FL, et al. (2017). Systems biology guided by XCMS Online metabolomics. Nat. Methods 14, 461–462. 10.1038/nmeth.4260. [DOI] [PMC free article] [PubMed] [Google Scholar]
- 25.Degirolamo C, Modica S, Palasciano G, and Moschetta A (2011). Bile acids and colon cancer: Solving the puzzle with nuclear receptors. Trends Mol. Med. 17, 564–572. 10.1016/j.molmed.2011.05.010. [DOI] [PubMed] [Google Scholar]
- 26.Wahlström A, Sayin SI, Marschall HU, and Bäckhed F (2016). Intestinal Crosstalk between Bile Acids and Microbiota and Its Impact on Host Metabolism. Cell Metabol. 24, 41–50. 10.1016/j.cmet.2016.05.005. [DOI] [PubMed] [Google Scholar]
- 27.McCarville JL, Chen GY, Cuevas VD, Troha K, and Ayres JS (2020). Microbiota Metabolites in Health and Disease. Annu. Rev. Immunol. 38, 147–170. 10.1146/annurev-immunol-071219-125715. [DOI] [PubMed] [Google Scholar]
- 28.Morton JT, Aksenov AA, Nothias LF, Foulds JR, Quinn RA, Badri MH, Swenson TL, Van Goethem MW, Northen TR, Vazquez-Baeza Y, et al. (2019). Learning representations of microbe-metabolite interactions. Nat. Methods 16, 1306–1314. 10.1038/s41592-019-0616-3. [DOI] [PMC free article] [PubMed] [Google Scholar]
- 29.Friedman ES, Li Y, Shen TCD, Jiang J, Chau L, Adorini L, Babakhani F, Edwards J, Shapiro D, Zhao C, et al. (2018). FXR-Dependent Modulation of the Human Small Intestinal Microbiome by the Bile Acid Derivative Obeticholic Acid. Gastroenterology 155, 1741–1752.e5. 10.1053/j.gastro.2018.08.022. [DOI] [PMC free article] [PubMed] [Google Scholar]
- 30.Quinn RA, Melnik AV, Vrbanac A, Fu T, Patras KA, Christy MP, Bodai Z, Belda-Ferre P, Tripathi A, Chung LK, et al. (2020). Global chemical effects of the microbiome include new bile-acid conjugations. Nature 579, 123–129. 10.1038/s41586-020-2047-9. [DOI] [PMC free article] [PubMed] [Google Scholar]
- 31.Henke MT, Kenny DJ, Cassilly CD, Vlamakis H, Xavier RJ, and Clardy J (2019). Ruminococcus gnavus, a member of the human gut microbiome associated with Crohn’s disease, produces an inflammatory polysaccharide. Proc. Natl. Acad. Sci. USA 116, 12672–12677. 10.1073/pnas.1904099116. [DOI] [PMC free article] [PubMed] [Google Scholar]
- 32.Dobin A, Davis CA, Schlesinger F, Drenkow J, Zaleski C, Jha S, Batut P, Chaisson M, and Gingeras TR (2013). STAR: ultrafast universal RNA-seq aligner. Bioinformatics 29, 15–21. 10.1093/bioinformatics/bts635. [DOI] [PMC free article] [PubMed] [Google Scholar]
- 33.Sorrentino G, Perino A, Yildiz E, El Alam G, Bou Sleiman M, Gioiello A, Pellicciari R, and Schoonjans K (2020). Bile Acids Signal via TGR5 to Activate Intestinal Stem Cells and Epithelial Regeneration. Gastroenterology 159, 956–968.e8. 10.1053/j.gastro.2020.05.067. [DOI] [PubMed] [Google Scholar]
- 34.Wong SH, and Yu J (2019). Gut microbiota in colorectal cancer: mechanisms of action and clinical applications. Nat. Rev. Gastroenterol. Hepatol. 16, 690–704. 10.1038/s41575-019-0209-8. [DOI] [PubMed] [Google Scholar]
- 35.Buffie CG, Bucci V, Stein RR, McKenney PT, Ling L, Gobourne A, No D, Liu H, Kinnebrew M, Viale A, et al. (2015). Precision microbiome reconstitution restores bile acid mediated resistance to Clostridium difficile. Nature 517, 205–208. 10.1038/nature13828. [DOI] [PMC free article] [PubMed] [Google Scholar]
- 36.Kadosh E, Snir-Alkalay I, Venkatachalam A, May S, Lasry A, Elyada E, Zinger A, Shaham M, Vaalani G, Mernberger M, et al. (2020). The gut microbiome switches mutant p53 from tumour-suppressive to oncogenic. Nature 586, 133–138. 10.1038/s41586-020-2541-0. [DOI] [PMC free article] [PubMed] [Google Scholar]
- 37.Cox LM, Sohn J, Tyrrell KL, Citron DM, Lawson PA, Patel NB, Iizumi T, Perez-Perez GI, Goldstein EJC, and Blaser MJ (2017). Description of two novel members of the family Erysipelotrichaceae: Ileibacterium valens gen. nov., sp. nov. and Dubosiella newyorkensis, gen. nov., sp. nov., from the murine intestine, and emendation to the description of Faecalibaculum rodentium. Int. J. Syst. Evol. Microbiol. 67, 1247–1254. 10.1099/ijsem.0.001793. [DOI] [PMC free article] [PubMed] [Google Scholar]
- 38.Fiorucci S, and Distrutti E (2015). Bile Acid-Activated Receptors, Intestinal Microbiota, and the Treatment of Metabolic Disorders. Trends Mol. Med. 21, 702–714. 10.1016/j.molmed.2015.09.001. [DOI] [PubMed] [Google Scholar]
- 39.Hoffmann MA, Nothias LF, Ludwig M, Fleischauer M, Gentry EC, Witting M, Dorrestein PC, Dührkop K, and Bocker S (2022). High-confidence structural annotation of metabolites absent from spectral libraries. Nat. Biotechnol. 40, 411–421. 10.1038/s41587-021-01045-9. [DOI] [PMC free article] [PubMed] [Google Scholar]
- 40.Petras D, Caraballo-Rodríguez AM, Jarmusch AK, Molina-Santiago C, Gauglitz JM, Gentry EC, Belda-Ferre P, Romero D, Tsunoda SM, Dorrestein PC, and Wang M (2021). Chemical Proportionality within Molecular Networks. Anal. Chem. 93, 12833–12839. 10.1021/acs.analchem.1c01520. [DOI] [PubMed] [Google Scholar]
- 41.Blank A, Roberts DE 2nd, Roberts DE, Dawson H, Zlobec I, and Lugli A. (2018). Tumor Heterogeneity in Primary Colorectal Cancer and Corresponding Metastases. Does the Apple Fall Far From the Tree? Front Med. 31, 234. 10.3389/fmed.2018.00234. [DOI] [PMC free article] [PubMed] [Google Scholar]
- 42.Kakiyama G, Muto A, Takei H, Nittono H, Murai T, Kurosawa T, Hofmann AF, Pandak WM, and Bajaj JS (2014). A simple and accurate HPLC method for fecal bile acid profile in healthy and cirrhotic subjects: validation by GC-MS and LC-MS. J. Lipid Res. 55, 978–990. 10.1194/jlr.D047506. [DOI] [PMC free article] [PubMed] [Google Scholar]
- 43.Tsugawa H, Cajka T, Kind T, Ma Y, Higgins B, Ikeda K, Kanazawa M, VanderGheynst J, Fiehn O, and Arita M (2015). MS-DIAL: data-independent MS/MS deconvolution for comprehensive metabolome analysis. Nat. Methods 12, 523–526. 10.1038/nmeth.3393. [DOI] [PMC free article] [PubMed] [Google Scholar]
- 44.Yu H, Chen Y, and Huan T (2021). Computational Variation: An Under-investigated Quantitative Variability Caused by Automated Data Processing in Untargeted Metabolomics. Anal. Chem. 93, 8719–8728. 10.1021/acs.analchem.0c03381. [DOI] [PubMed] [Google Scholar]
- 45.Chong J, Soufan O, Li C, Caraus I, Li S, Bourque G, Wishart DS, and Xia J (2018). MetaboAnalyst 4.0: towards more transparent and integrative metabolomics analysis. Nucleic Acids Res. 46, W486–W494. 10.1093/nar/gky310. [DOI] [PMC free article] [PubMed] [Google Scholar]
- 46.Tripathi A, Vázquez-Baeza Y, Gauglitz JM, Wang M, Dührkop K, Nothias-Esposito M, Acharya DD, Ernst M, van der Hooft JJJ, Zhu Q, et al. (2020). Chemically informed analyses of metabolomics mass spectrometry data with Qemistree. Nat. Chem. Biol. 17, 146–151. 10.1038/s41589-020-00677-3. [DOI] [PMC free article] [PubMed] [Google Scholar]
- 47.Guo J, and Huan T (2020). Comparison of Full-Scan, Data-Dependent, and Data-Independent Acquisition Modes in Liquid Chromatography-Mass Spectrometry Based Untargeted Metabolomics. Anal. Chem. 92, 8072–8080. 10.1021/acs.analchem.9b05135. [DOI] [PubMed] [Google Scholar]
- 48.Zhu Q, Huang S, Gonzalez A, McGrath I, McDonald D, Haiminen N, Armstrong G, Vázquez-Baeza Y, Yu J, Kuczynski J, et al. (2022). Phylogeny-Aware Analysis of Metagenome Community Ecology Based on Matched Reference Genomes while Bypassing Taxonomy. mSystems 7, e0016722. 10.1128/msystems.00167-22. [DOI] [PMC free article] [PubMed] [Google Scholar]
- 49.Wu M, McNulty NP, Rodionov DA, Khoroshkin MS, Griffin NW, Cheng J, Latreille P, Kerstetter RA, Terrapon N, Henrissat B, et al. (2015). Genetic determinants of in vivo fitness and diet responsiveness in multiple human gut Bacteroides. Science 350, aac5992. 10.1126/science.aac5992. [DOI] [PMC free article] [PubMed] [Google Scholar]
Associated Data
This section collects any data citations, data availability statements, or supplementary materials included in this article.
Supplementary Materials
Data Availability Statement
Microbiome 16S rRNA gene amplicon and shotgun sequencing data reported in this paper have been deposited at Qiita study ID 10955 (https://qiita.ucsd.edu/study/description/10955) and are publicly available. Serum and cecum metabolite profiling data reported in this paper have been deposited at MetaboLights (www.ebi.ac.uk/metabolights/MTBLS5765) and are publicly available. Accession numbers are listed in the key resources table.
This paper does not report original code.
Any additional information required to reanalyze the data reported in this paper is available from the lead contact upon request.
KEY RESOURCES TABLE.
| REAGENT or RESOURCE | SOURCE | IDENTIFIER |
|---|---|---|
|
| ||
| Bacterial and virus strains | ||
|
| ||
| Ruminococcus gnavus strain VPI C7-9 | ATCC | Cat #29149 |
| Clostridium scindens strain VPI 13733 | ATCC | Cat #35704 |
| Ileibacterium valens strain NYU-BL-A3 | ATCC | Cat #TSD-63 |
| Lactobacillus acidophilus strain VPI 11091 | ATCC | Cat # 9224 |
| Lactobacillus reuteri strain IDCC3701 | ATCC | Cat # BAA-2837 |
|
| ||
| Chemicals, peptides, and recombinant proteins | ||
|
| ||
| Tauro-chenodeoxycholic acid (T-CDCA) | Caymen Chemical | Item# 20275 |
| Glyco-chenodeoxycholic acid (G-CDCA) | Caymen Chemical | Item# 16942 |
| Chenodeoxycholic acid (CDCA) | Steraloids | Cat# C0940-000 |
| Tauro-β-muricholic acid (T-βMCA) | Steraloids | Cat# C1899-000 |
| β-muricholic acid (βMCA) | Steraloids | Cat#C1895-000 |
| α-muricholic acid (αMCA) | Steraloids | Cat#C1890-000 |
| Tauro-cholic acid (T-CA) | Caymen Chemical | Item# 16215 |
| Glyco-cholic acid (G-CA) | Caymen Chemical | Item# 20276 |
| Cholic acid (CA) | Caymen Chemical | Item# 20253 |
| Tauro-deoxycholic acid (T-DCA) | Caymen Chemical | Item# 15935 |
| Glyco-deoxycholic acid (G-DCA) | Caymen Chemical | Item# 20274 |
| Deoxycholic acid (DCA) | Steraloids | Cat# C1070-015 |
| Lithocholic acid (LCA) | Steraloids | Cat# C1420-000 |
| Tauro-lithocholic acid (T-LCA) | Caymen Chemical | Item# 17275 |
| Glyco-lithocholic acid (G-LCA) | Caymen Chemical | Item# 21723 |
| ω-muricholic acid (ωMCA) | Steraloids | Cat#C1888-000 |
| γ -muricholic acid (γ-MCA) | Steraloids | Cat# C1850-000 |
| Tauro-hyodeoxycholic Acid (T-HDCA) | Caymen Chemical | Item# 21956 |
| Glyco-hyodeoxycholic Acid (G-HDCA) | Caymen Chemical | Item# 22643 |
| Hyodeoxycholic Acid (HDCA) | Steraloids | Cat# C0885-000 |
| Tauro-Ursodeoxycholic Acid (T-UDCA) | Caymen Chemical | Item# 20277 |
| Glyco-ursodeoxycholic Acid (G-UDCA) | Caymen Chemical | Item# 21698 |
| Ursodeoxycholic Acid (UDCA) | Caymen Chemical | Item# 15121 |
| Cholic-2,2,4,4-d4 acid | C/D/N Isotopes | D-2452 |
| Chenodeoxycholic-2,2,4,4-d4 acid | C/D/N Isotopes | D-2772 |
| Lithocholic-2,2,4,4-d4 acid | C/D/N Isotopes | D-3742 |
| Fexaramine D | WUXI | Custom order |
| Serine conjugated cholic acid (Ser-CA) | WUXI | Custom order |
| Alanine conjugated cholic acid (Ala-CA) | WUXI | Custom order |
| Phenyalanine conjugated cholic acid (Phe-CA) | WUXI | Custom order |
| Tyrosine conjugated cholic acid (Tyr-CA) | WUXI | Custom order |
| Leucine conjugated cholic acid (Leu-CA) | WUXI | Custom order |
| Glutamate conjugated cholic acid (Glu-CA) | WUXI | Custom order |
| Tryptophan conjugated cholic acid (Trp-CA) | WUXI | Custom order |
| INT-777 | Caymen Chemical | Item# 17678 |
| pre-reduced anaerobic transport media (ATM) | Anaerobe System Inc | Cat #AS-911 |
| Anaerobic Enrichment Broth (MTGE BROTH) | Anaerobe System Inc | Cat # AS-778 |
| Yeast Casitone Fatty Acids Agar with Carbohydrates without blood (YCFAC) plates | Anaerobe System Inc | Cat # AS-675 |
| Yeast Casitone Fatty Acids Agar with Carbohydrates with blood (YCFAC-B) plates | Anaerobe System Inc | Cat # AS-677 |
| Brucella Blood Agar | Anaerobe System Inc | Cat # AS-141 |
| ATCC 260 Tryptic Soy Broth | Fisher scientific | BD 211825 |
| ATCC 260 Tryptic Soy Agar | Fisher scientific | BD 236950 |
| ATCC 416 MRS broth medium | Fisher scientific | BD 288130 |
| Water | Fisher scientific | W64 |
| Acetonitrile | Fisher scientific | A9554 |
| Methanol | Fisher scientific | A4564 |
| Formic acid | Fisher scientific | A117-50 |
|
| ||
| Critical commercial assays | ||
|
| ||
| Total bile acid assay kit | Diazyme laboratories | Cat #DZ042A-K |
| CellTiter-Glo Luminescent Cell Viability Assay Kit | Promega Corporation | Cat #G7572 |
| CellTiter-Glo Luminescent 3D Cell Viability Assay Kit | Promega Corporation | Cat #G9683 |
| Dual-Luciferase reporter kit | Promega Corporation | Cat #PRE1910 |
| Cignal TCF/LEF Reporter (luc) Kit | Qiagen | Cat#CCS-018L |
| RNeasy Mini Kit | Qiagen | Cat #74106 |
| RNeasy Micro Kit | Qiagen | Cat #74004 |
| Bio-Rad iScript Reverse Transcription supermix | Bio-rad | Cat #1708841 |
| Advanced Universal SyBr Green Supermix | Bio-rad | Cat #725271 |
| Matrigel, growth factor reduced | Corning | Cat #354230 |
| Gentle cell dissociation buffer | Stem Cell Inc | Cat #7174 |
| Intesticult organoid growth medium | Stem Cell Inc | Cat #6005 |
| PBS (Mg2+/Ca2+) solution | Corning | Cat # 21-031-CM |
| FBS | Gemini Bio-products | Cat #900-208 |
| Antibiotic-Antimycotic solution | Gibco | Cat #15240062 |
| Penicillin-Streptomycin | Gibco | Cat #15070063 |
|
| ||
| Deposited data | ||
|
| ||
| Microbiome 16S rRNA gene amplicon and shotgun sequencing data | Illumina HiSeq4000 platform | Qiita study ID 10955 |
| Serum and Cecum Metabolites profiling data | Bruker Impact II™ UHR-QqTOF (Ultra-High Resolution Qq-Time-Of-Flight) mass spectrometer coupled with the Agilent 1290 Infinity™ II LC system | MetaboLights (www.ebi.ac.uk/metabolights/MTBLS5765) |
|
| ||
| Experimental models: Cell lines | ||
|
| ||
| HT29 | ATCC | Cat# HTB-38, RRID:CVCL_0320 |
| CACO2 | ATCC | Cat# HTB-37, RRID:CVCL_0025 |
| HEK293 | ATCC | Cat# PTA-4488, RRID:CVCL_0045 |
|
| ||
| Experimental models: Organisms/strains | ||
|
| ||
| Mouse: C57BL/6J | The Jackson Laboratory | Cat# JAX:000664, RRID:IMSR_JAX:000664 |
| Mouse: C57BL/6J-ApcMin/J | The Jackson Laboratory | Cat# JAX:002020, RRID:IMSR_JAX:002020 |
|
| ||
| Oligonucleotides | ||
|
| ||
| Primers for RT-qPCR, see Table S2. | IDT | Designed using Primer 3 software |
|
| ||
| Software and algorithms | ||
|
| ||
| STAR | Dobin et al.32; https://github.com/alexdobin/STAR | |
| RSEM | https://deweylab.github.io/RSEM/ | N/A |
| rsem-generate-data-matrix and rsem-run-ebseq commands | https://deweylab.github.io/RSEM/rsem-run-ebseq.html | N/A |
| GSEA | https://www.gsea-msigdb.org/gsea/index.jsp | N/A |
| Emperor | https://biocore.github.io/emperor/ | N/A |
| SurvExpress | https://ngdc.cncb.ac.cn/databasecommons/database/id/1097 | N/A |
| Homer | http://homer.ucsd.edu/homer/ | N/A |
| CASAVA-1.8.2 | https://www.illumina.com/ | Illumina |
| Fiji | https://fiji.sc/ | |
| FreeStyle | Thermo Fisher Scientific | |