

Abstract
Giant unilamellar vesicles (GUVs) are a widely used model system to interrogate lipid phase behavior, study biomembrane mechanics, reconstitute membrane proteins, and provide a chassis for synthetic cells. It is generally assumed that the composition of individual GUVs is the same as the nominal stock composition; however, there may be significant compositional variability between individual GUVs. Although this compositional heterogeneity likely impacts phase behavior, the function and incorporation of membrane proteins, and the encapsulation of biochemical reactions, it has yet to be directly quantified. To assess heterogeneity, we use secondary ion mass spectrometry (SIMS) to probe the composition of individual GUVs using non-perturbing isotopic labels. Both 13C- and 2H-labeled lipids are incorporated into a ternary mixture, which is then used to produce GUVs via gentle hydration or electroformation. Simultaneous detection of seven different ion species via SIMS allows for the concentration of 13C- and 2H-labeled lipids in single GUVs to be quantified using calibration curves, which correlate ion intensity to composition. Additionally, the relative concentration of 13C- and 2H-labeled lipids is assessed for each GUV via the ion ratio 2H−/13C−, which is highly sensitive to compositional differences between individual GUVs and circumvents the need for calibration by using standards. Both quantification methods suggest that gentle hydration produces GUVs with greater compositional variability than those formed by electroformation. However, both gentle hydration and electroformation display standard deviations in composition (n = 30 GUVs) on the order of 1–4 mol %, consistent with variability seen in previous indirect measurements.
Graphical Abstract

INTRODUCTION
Giant unilamellar vesicles (GUVs) are a commonly used model system to probe lipid phase behavior,1–4 membrane–protein interactions,5–10 and to encapsulate cellular machinery.11–14 GUVs are attractive model systems not only due to their large size (typically 10–20 μm in diameter), which allows for convenient imaging via optical microscopy15–21 but also due to their ease of production.
GUVs are commonly produced by either gentle hydration or electroformation. Although both methods start with a lipid mixture dried as a film, for gentle hydration the film is dried onto glass, while for electroformation the film is dried onto either platinum electrodes or indium tin oxide slides.22 Films used for gentle hydration are heated above the melting point of the lipid mixture in the presence of either heated aqueous or heated sucrose solution.23–25 The temperature is maintained above the melting point of the lipid mixture for the duration of GUV formation. Films used for electroformation are also rehydrated, typically at low ionic strength, before alternating current is applied to the film, which assists in the formation of GUVs.26–28 This process is similarly conducted at temperatures above the melting point of the lipid mixture.
Despite their widespread use, there is some evidence pointing to potential issues with GUVs as model systems. In particular, prior work has shown that electroformed GUVs composed of a ternary mixture exhibit significant variation in areas occupied by an Ld partitioning fluorescent dye.3 Other work has shown that individual GUVs produced from the same lipid film show significant variations in their phase behavior.29,30 Although work has been done to compare GUV formation methods in terms of their resulting unilamellarity, capacitance, shear viscosity, and a number of defects visible by fluorescence microscopy,31,32 compositional variability has yet to be directly examined. Quantifying this variability is critical, as lipid composition is the primary variable in all GUV-based measurements. Prior indirect measurements have found compositional standard deviations between 1 and 4 mol %.3,33,34 Here, we directly quantify the compositional variability between individual GUVs using stable isotope labeling and secondary ion mass spectrometry (SIMS). Stable isotope labeling is not only non-perturbative (although perdeuterated lipids exhibit lower transition temperatures)35,36 but also allows for the concentration of labeled lipids to be directly quantified.
SIMS can be used to measure isotopic ratios present in a sample with high precision.37,38 The Cameca NanoSIMS 50L functions by collisional sputtering of a freeze-dried bilayer containing isotopically labeled lipids with primary cesium ions (Cs+). This process ejects secondary ions, which are then separated by a mass analyzer, allowing up to seven species to be detected simultaneously. The high sensitivity and mass precision (being able to resolve species such as 12C1H− and 13C− which have similar masses)38,39 of the NanoSIMS 50L allows for compositional information on individual bilayers to be obtained.38,40 For the experiments reported here, GUVs formed via either gentle hydration or electroformation were exposed to NanoSIMS substrates (10 nm SiO2-coated Si) where they rupture to form supported bilayer patches whose area is proportional to the surface area of the parent GUV.41,42 This process is depicted in Figure 1. In parallel, continuous supported bilayers (SLBs) were formed by conventional small vesicle fusion. SIMS can then be used to examine the compositional variability of the resulting SLBs formed by different methods. The resulting compositional variability is assessed either via external calibration curves, which determine absolute concentrations of isotopically labeled lipids in an SLB, or by examining the relative concentrations of two isotopically labeled lipids. This second method avoids relying on the accuracy of external standards and is not subject to the potential contamination of the NanoSIMS substrate. Both methods demonstrate that patches formed from individual GUVs show composition variation with standard deviations on the order of 1–4 mol % and that GUVs prepared via electroformation are less variable (standard deviations around 1–2 mol %) than GUVs formed via gentle hydration (standard deviations around 2–4 mol %). These measurements are consistent with prior indirect estimates of GUV composition.3,33,34 Additionally, quantification of the average concentration of cholesterol in GUVs formed via gentle hydration and electroformation suggests that GUVs formed by electroformation have significantly less (around 5 mol %) cholesterol on average than GUVs formed via gentle hydration.
Figure 1.

Experimental design. Micron-sized GUVs formed by gentle hydration or electroformation are deposited over patterned Si/SiO2 substrates. GUVs spontaneously rupture to form individual GUV-derived planar supported bilayer patches that are subsequently freeze-dried and analyzed via NanoSIMS. (A) Epifluorescence images of POPC GUVs containing 0.1% TR-DHPE. (B) GUVs are deposited over an oxidized silicon substrate with a chrome grid and are allowed to rupture. The patterning provides a visual guide for locating patches during NanoSIMS imaging. (C) Epifluorescence images of POPC GUV patches containing 0.1% TR-DHPE. Note that if small vesicles are present within the GUV these are lost or possibly deposited elsewhere upon bilayer patch formation.
MATERIALS AND METHODS
All natural abundance lipids, cholesterol, and 2H31-POPC (1-palmitoyl-2-oleoyl-sn-glycero-3-phosphocholine) were purchased from Avanti Polar Lipids. 2H7-cholesterol was purchased from Cayman Chemical. Texas Red 1,2-dihexadecanoyl-sn-glycero-3-phosphoethanolamine (TR-DHPE) was purchased from Thermo Fisher Scientific. Four inch <100> p-type silicon wafers (9.5 nm SiO2) were purchased from Silicon Quest International and were diced to 5 × 5 mm to fit in the NanoSIMS sample holder. NanoSIMS substrates were patterned with a chrome grid (5 nm height, 5 μm width) with 25, 50, or 100 μm2 dimensions via photolithography to facilitate correlative imaging by fluorescence microscopy. All solvents were purchased from Fisher. 13C18-POPC, 13C18-DSPC (1,2-distearoyl-sn-glycero-3-phosphocholine), and 15N-POPC were synthesized as previously described.38,43 13C27-cholesterol was isolated as previously described.44 Structures for the labeled lipids used in this study can be seen in Figure 2.
Figure 2.

Isotopically labeled lipids used in this study. Color-coded circles represent the locations of isotopic labels.
Master Stock Solutions.
Master stock solutions were prepared with the lipid mixture of interest dissolved in chloroform in sufficient quantities such that multiple batches of GUVs could be produced from the same vial. Master stocks were made by first adding several hundred microliters of chloroform to a 2 mL glass vial. Lipids were then added to the vial by withdrawing the appropriate volume from a pure lipid stock solution in chloroform and then injecting the volume beneath the chloroform into the master stock vial. This ensured that each lipid remained fully dissolved within the master stock. All master stocks also contained 0.1 mol % TR-DHPE so GUV patches could be examined via fluorescence microscopy once ruptured on patterned substrates. Critically, any comparison between different methods of GUV formation was done by using lipid films produced from one of these master stocks. Also note that all lipid films were dried down at room temperature (23 ± 1 °C). Other work has suggested that films dried down at higher temperatures may yield more homogeneous GUVs33. This effect has not been explored further in the current work.
Gentle Hydration.
Films were dried in 2 mL glass vials from Fisher. First, 200 μL of chloroform was added to a glass vial. 50 nmol of lipid in chloroform was taken from a master stock and added beneath the 200 μL of chloroform in the vial such that the lipid mixture remained dissolved. The glass vial was then vortexed, bath sonicated, and vortexed again for 30 s each. The film was then dried under a stream of argon. The vial was then placed in a desiccator overnight to remove any residual solvent. Films were then rehydrated in 0.5 mL of submicrometer-filtered 500 mM sucrose and heated to 65 ± 0.5 °C, above the melting temperature of DSPC (54.4 °C), for 15 h.
Note that while the heating temperature is above the melting point of the mixture, lower compositional variability may be attained by heating the mixture a further 10 °C above the melting point to approximately 75 °C, as has been noted by prior work.33,45
Electroformation.
The electroformation chamber and platinum electrodes were thoroughly cleaned before the lipid films were dried on the electrodes. The chamber was first bath sonicated at 56 °C in a mixture of 7× detergent, ethanol, and deionized water in a 1:3:3 ratio. The setup was then rinsed in deionized water for 20 min before being further bath sonicated in deionized water and rinsed again with deionized water for another 20 min. The chamber was then sonicated in ethanol at room temperature. After the chamber was removed from the ethanol, the setup was dried immediately and kept in a desiccator until use. Films were formed by directly spreading 66 nmol of lipid taken from a master stock onto the platinum electrodes. After lipids were spread on the electrodes, the chamber was kept in a desiccator overnight to remove residual chloroform. The chamber was then sealed with clean glass slides and vacuum grease. Once sealed, the chamber was filled with 1.5 mL of submicrometer-filtered and degassed 500 mM sucrose before being heated to 65 ± 0.5 °C. GUVs were electroformed at 10 Hz, 3 V (peak to peak) for 2 h and then at 1 Hz, 3 V for another 30 min.
Vesicle Extrusion.
Glass test tubes were filled with 200 μL of chloroform. 28 nmol of lipid from a master stock was then injected beneath chloroform in the test tube. Lipid films were then dried under argon onto the test tube sides before being desiccated overnight. Films were then resuspended in 1× phosphate-buffered saline (137 mM NaCl, 2.7 mM KCl, 8 mM NaPO4, pH 7.2, submicrometer-filtered) and vortexed for 1 min. The buffer with the resuspended lipids was then passed through a membrane with 100 nm pore size 61 times while being heated to 65 °C to form SUVs (small unilamellar vesicles).
NanoSIMS Sample Preparation.
GUVs were ruptured onto silicon substrates to form SLB patches after being allowed to briefly cool for 30 ± 5 min to room temperature (23 ± 1 °C). Silicon substrates were plasma cleaned for 10 min after which they were submerged in phosphate buffer (240 mM NaCl, 10 mM NaH2PO4 at pH 7.4). Then GUVs were deposited over the submerged substrates and allowed to incubate until approximately 10–15% of the surface was covered in SLB patches. GUV deposition was observed with a Nikon Eclipse 80i epifluorescence microscope equipped with an Andor Clara camera. The substrate and bilayers were then extensively washed with Milli-Q water. Although GUVs, particularly those formed via gentle hydration, can be multivesicular, upon GUV rupture to form an SLB patch, the internal vesicles are liberated and rinsed away. Cleaned substrates were flash frozen in liquid nitrogen and then subjected to low pressure for at least 12 h to sublimate any vitreous ice.
To form continuous bilayers on NanoSIMS substrates, 100 nm vesicles were incubated over plasma-cleaned substrates for 1 min before being washed extensively with Milli-Q water. Continuous bilayers on substrates were found to be more susceptible to dewetting during flash freezing so substrates with continuous bilayers were removed from Milli-Q water with the bilayer facing upside-down. This ensured that a drop of water remained in contact with the bilayer at all times before the substrate was flash frozen in liquid nitrogen. Once frozen, substrates were subjected to low pressure using the same method as for GUV patch samples. Lipid monolayers were formed using a KSV NIMA KN 2002 (Biolin Scientific, Stockholm, Sweden) Langmuir trough (273 cm2) at room temperature (23 ± 1 °C). Whatman filter paper was used as a Wilhelmy plate to monitor surface pressure. Lipid mixtures dissolved in chloroform were spread on water (>18 MΩ from Milli-Q system) within the clean trough using a glass syringe. The chloroform was left to evaporate for 10 min and the barriers were compressed at 10 mm/min until the surface pressure reached 32 mN/m. Plasma-cleaned NanoSIMS substrates were glued to a glass slide and pulled through the air–water interface at a rate of 1 mm/min, while the surface pressure was maintained at 32 mN/m. Lipid monolayers were not subjected to freeze-drying, as unlike SLBs, lipid monolayers are stable in air. Both lipid monolayers and freeze-dried lipid bilayers were stored in a desiccator when not being analyzed via NanoSIMS.
NanoSIMS Analysis.
Analysis was performed on a Cameca NanoSIMS 50L instrument at Stanford University. Correlative fluorescence imaging helped facilitate the selection of bilayer patches so that debris on the substrate surface were avoided. Bilayer patches were imaged with a 2pA 133Cs+ primary beam. Ten 25 × 25 μm scans (256 × 256 pixels, 1 ms dwell time) were collected, which is enough to remove all of the deposited material on the surface. Secondary ion detectors were set to 2H−, 12C−, 13C−, 12C2H−, 12C22H−, 13C2H−, and 13C22H− for samples containing 2H- or 13C-labeled lipids or cholesterol. If 15N-labeled POPC was contained within SLB patches, secondary ion detectors were set to 2H−, 12C−, 13C−, 12C2H−, 12C14N−, 13C15N−, and 13C22H−. Standard samples (the calibration curves described below) were regularly analyzed to ensure that isotope ratios were reproducible from session to session.
Data Analysis.
Images were analyzed using ImageJ (National Institutes of Health, USA) with the OpenMIMS plugin (National Resource for Mass Spectrometry, Harvard University USA). Planes were summed, and regions of interest were manually selected in order to exclude any debris on the sample. Total counts within each region of interest were determined via the “Tomography” tab. These counts were then used to determine the ratios of interest (typically 2H−/13C−, 13C−/(13C− + 12C−), and 2H−/(13C− + 12C−)). Calculating these ratios allows for the size of the analyzed patches to be taken into account and allows for further quantification via external calibration standards.
Calibration Standards.
Concentration calibration standards were made from lipid mixtures dissolved in chloroform containing a known mol % of labeled lipid. Calibration standards used to quantify labeled lipid concentrations in ternary SLBs contained 20 mol % cholesterol, as this is present in the ternary mixture. Calibration curves without cholesterol were also prepared so that labeled lipid concentrations in mixtures without cholesterol could quantified. The prepared lipid mixtures dissolved in chloroform were spread on plasma-cleaned NanoSIMS substrates. The chloroform was then allowed to evaporate to form a lipid film. Concentration calibration standards were kept in a desiccator until use.
RESULTS AND DISCUSSION
Comparing GUV Preparation Methods via Double Labeling.
First, we assessed the variability in relative concentrations of labeled lipids for different GUV preparation methods. Although direct concentration quantification via external calibration curves can give estimates of the concentration of a labeled species, this method is subject to inaccuracies. These experiments can be skewed by surface contamination and are heavily reliant on the accuracy of the calibration standards. In order to avoid these issues, and inspired by prior work,46 initial experiments examined the relative change in ion counts from patch to patch resulting from two lipids with different isotopic labels. This was done with a POPC:DSPC:CHOL 40:40:20 mixture. This mixture was chosen as GUV patches with this composition do not display macroscopic phase separation between lipid components1,4,16 within the 50 nm lateral resolution of the NanoSIMS primary ion beam (Figure S1; there is nanoscale separation present in these SLB patches which can be detected by ion recombination43). This mixture is also well-studied in GUVs and GUV patches.4,43,47
In order to determine which pair of labeled lipids is most sensitive to relative changes in concentration, two ternary samples, one with the composition 13C18-DSPC:POPC:2H31-POPC:CHOL 20:20:20:20:20 and the other with the composition DSPC:13C18-POPC:2H31-POPC:CHOL 40:20:20:20 were prepared. Additionally, a sample with the composition 2H31-POPC:13C18-POPC:POPC 20:20:60 was also prepared (samples with this composition are denoted as pure POPC). 13C−/(13C− + 12C−) and 2H−/(13C− + 12C−) ratios were then measured for 30 GUV patches formed via gentle hydration for all three samples.
Figure 3 shows the correlation between the 2H−/(13C− + 12C−) and 13C−/(13C− + 12C−) ratios for each labeling scheme. The 2H−/(13C−+12C−) ratio tracks the amount of 2H-labeled lipid in the bilayer, while the 13C−/(13C− + 12C−) ratio tracks the amount of 13C-labeled lipid in the bilayer. Figure 3 demonstrates that the correlation between the ratios is a function of both the location of the isotopic label and the overall composition of the bilayer. The ternary mixture containing both 2H31-POPC and 13C18-POPC displays a positive correlation between the lipid concentrations. Conversely, the ternary mixture containing 2H31-POPC and 13C18-DSPC displays a clear negative correlation between the concentrations of the two components. These trends can be attributed to preferential interactions between 13C18-POPC and 2H31-POPC and unfavorable interactions between 13C18-DSPC and 2H31-POPC within ternary bilayers.
Figure 3.

Concentration correlations of different labeling schemes. Correlations between the 2H−/(13C− + 12C−) and 13C−/(13C− + 12C−) ratios for each lipid mixture. The 2H−/(13C− + 12C−) ratio tracks the amount of 2H-labeled lipid in the bilayer, while the 13C−/(13C− + 12C−) ratio tracks the amount of 13C-labeled lipid in the bilayer. (A) Correlation between 2H31-POPC and 13C18-DSPC ratios in the ternary mixture DSPC:13C18-DSPC:POPC:2H31-POPC:CHOL 20:20:20:20:20. (B) Correlation between 2H31-POPC and 13C18-POPC ratios in the ternary mixture DSPC:13C18-POPC:2H31-POPC:CHOL 40:20:20:20. (C) Absence of correlation between 2H31-POPC and 13C18-POPC ratios in a pure POPC mixture with composition 13C18-POPC:2H31-POPC:POPC 20:20:60.
As shown in Figure 3C, pure POPC SLBs containing 2H31-POPC and 13C18-POPC did not show any clear correlation in concentration between the differently labeled lipids. 2H31-POPC, 13C18-POPC, and natural abundance POPC within the pure POPC mixture only differ from each other in terms of isotopic labeling. As a result, when the concentration of one labeled component is higher in a GUV, the extent to which it replaces either the other labeled or unlabeled component is essentially random.
Based on the results from Figure 3, a ternary mixture containing 13C18-DSPC and 2H31-POPC is expected to be the most sensitive to relative concentration changes between the two labeled lipids, as the concentrations of these two components are anticorrelated. Therefore, this mixture was used to study the compositional variability of GUVs formed by electroformation or gentle hydration.
GUVs with this composition were generated from the same master stock by either gentle hydration or electroformation. The same master stock was also used to generate 100 nm SUVs which were then ruptured onto NanoSIMS substrates to form continuous bilayers within the corrals of the patterned NanoSIMS substrate. Since these continuous bilayers are formed from hundreds of SUVs, the relative concentrations of 13C18-DSPC and 2H31-POPC should be more consistent than in SLB patches formed from the rupture of a single GUV. The measured 2H−/13C− ratio for 30 individual bilayer patches or 30 corrals containing continuous bilayers is shown in Figure 4. Based on the measured ratios, gentle hydration has the highest standard deviation, ±1.6, in relative concentration. The standard deviation for GUVs formed via electroformation is significantly (determined via F-test) lower at ±1.1. The normality of each distribution assessed by F-test as is further discussed in Section 2 of the Supporting Information. Continuous bilayers formed from SUVs have the lowest standard deviation in relative concentration, at ±0.7. Replicate samples produced from films dried from the same master stock also suggest that electroformation is less compositionally variable (lower measured standard deviations) than gentle hydration (Figure S4).
Figure 4.
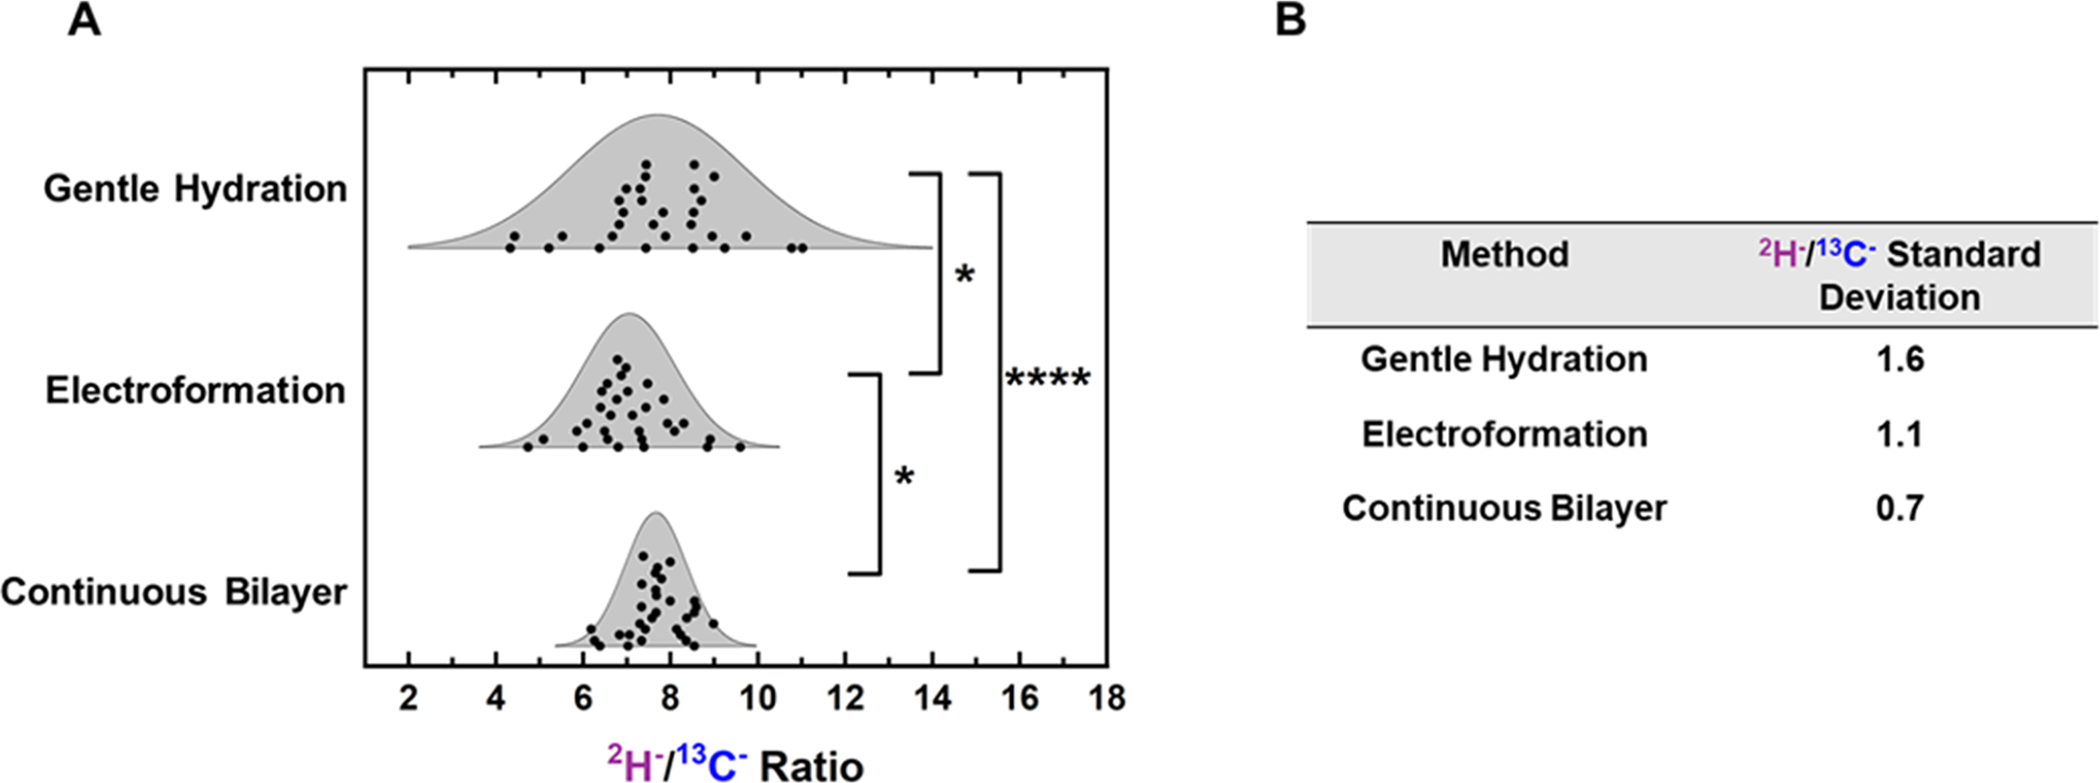
Measured 2H−/13C− ratios for different methods. GUV patches formed by gentle hydration and electroformation were compared to continuous bilayers formed from SUVs via their 2H−/13C− ratios. All samples were produced from a master stock with nominal composition DSPC:13C18-DSPC:POPC:2H31-POPC:CHOL 20:20:20:20:20. (A) Displays the 2H−/13C− ratio distributions for each preparation method. Significance was determined via an F-test. For this and subsequent plots, each point represents a measurement made on a single GUV patch or corral containing an SLB. Thirty bilayers were examined for each sample. For this and all subsequent plots, * p ≤ 0.05, ** p ≤ 0.01, *** p ≤ 0.001, and **** p ≤ 0.0001. The displayed curves are normal distributions calculated by using the standard deviation and average from the GUV patch measurements. Note that these have been overlaid to guide the reader and that the area under the curve has not been normalized. A dot plot representation of the distributions can be seen in Figure S21. (B) Calculated standard deviations of the 2H−/13C− ratio for each preparation method.
The raw data for all of the distributions in the main text and the Supporting Information can be seen in Section 16 of the Supporting Information. Additionally, each distribution presented is replotted as a dot plot in Section 17 of the Supporting Information to provide a second way to visualize the data.
Absolute Concentration Variability.
Although measuring the 2H−/13C− ratio is useful for comparing the variability in different methods while avoiding concerns regarding surface contamination and calibration accuracy (further discussed in Section 4 of the Supporting Information), quantification of absolute concentration is useful for determining how much the mol % of a particular lipid varies from GUV to GUV. Therefore, external calibration curves, such as those shown in Figure 5A, were used to relate quantitative ion ratios to labeled lipid concentrations. This allowed the concentration of each labeled species within one GUV patch to be determined. This analysis was performed for the GUV samples discussed in Figure 4.
Figure 5.
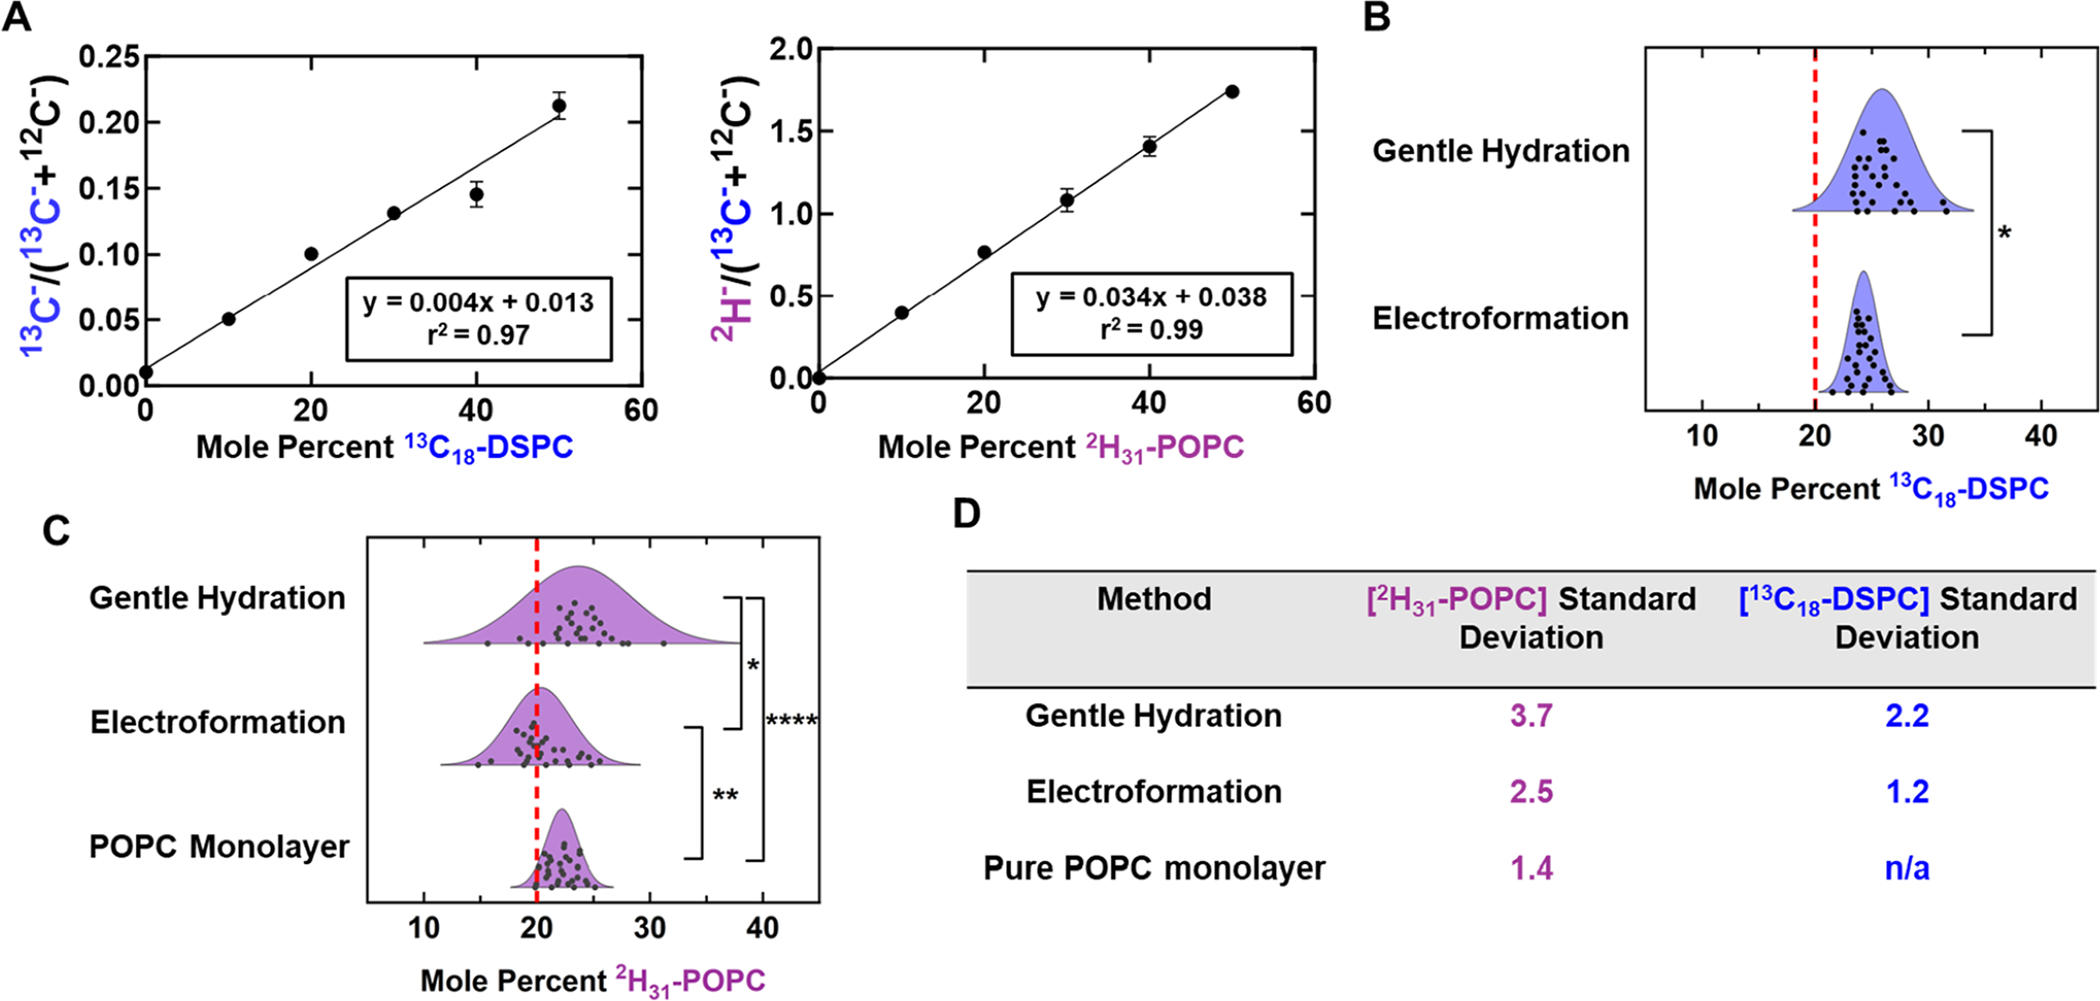
Concentration quantification of GUV patches and monolayers. (A) Representative calibration curves for 13C18-DSPC and 2H31-POPC. (B) Calculated 13C18-DSPC concentration distributions for GUV patches formed by gentle hydration and electroformation. All GUVs were formed using a ternary mixture with nominal composition DSPC:13C18-DSPC:POPC:2H31-POPC:CHOL 20:20:20:20:20. The gentle hydration 13C18-DSPC concentration distribution is significantly different relative to the corresponding electroformation distribution, as determined by F-test. Red dashed lines indicate the nominal concentration of labeled lipids. (C) Displays the calculated 2H31-POPC concentration distributions for GUV patches formed by gentle hydration and electroformation. These concentration distributions are compared to 2H31-POPC concentrations measured in a monolayer composed of POPC with 20 mol % of 2H31-POPC. Dot plot representations of these distributions can be seen in Figure S22. (D) Calculated standard deviations for each concentration distribution.
As shown in Figure 5B,C, GUV patches produced via electroformation showed consistently lower standard deviations in both 13C18-DSPC and 2H31-POPC concentrations than those formed via gentle hydration as demonstrated by the calculated standard deviations and supported by a corresponding F-test. To determine the lower bound on variability (i.e., how much of the variation in concentration measurements is due to instrument noise and surface contamination), a monolayer with overall composition 2H31-POPC:13C18-POPC:POPC 20:20:60 (pure POPC composition) was formed on a NanoSIMS substrate and compared to both GUV samples. Since a monolayer should be compositionally homogeneous across the substrate surface, this measurement can be used to approximate how much of the variability (the measured standard deviation) is due to the experimental method. As seen in Figure 5C, measurements on pure POPC monolayers resulted in a lower standard deviation in 2H31-POPC concentrations than that measured in GUVs formed via electroformation or gentle hydration (±1.4 mol % for monolayers, ±2.5 mol % for electroformed GUVs, and ±3.7 mol % for GUVs formed by gentle hydration). However, these monolayers cannot be compared via the 2H−/13C− ratio as was done in Figure 4 because the correlation between 2H31-POPC and 13C18-POPC concentrations in pure POPC is dramatically different from the correlation between 2H31-POPC and 13C18-DSPC in ternary mixtures (Figure 3). Additionally, ternary monolayers formed from the ternary master stock containing 2H31-POPC and 13C18-DSPC display macroscale separation (Figure S6) and are therefore not comparable to the GUV samples, as is further discussed in Section 5 of the Supporting Information. Therefore, monolayers can be compared to GUV samples only via absolute concentrations. Additional analysis suggests that the size of the region selected for quantification within the 25 × 25 μm analysis region does not significantly impact the distributions shown in Figures 4 and 5 (further discussed in Section 6 of the Supporting Information). Therefore, the intrinsic signal-to-noise ratio of a single patch is unlikely to substantially impact the GUV variability observed for different formation methods. It should be noted that the absolute values measured for isotope-labeled lipid concentrations demonstrate deviation from the nominal concentrations in the master stock solution. In some cases, the labeled lipid concentration deviates by 5–6 mol % from the expected concentration. This is likely the result of multiple factors including substrate surface contamination by 12C, the accuracy of the external calibration curves, and error involved in preparing labeled lipid stock solutions (which are then used to make master stocks).
Sources of Variability.
In order to further explore sources of the observed GUV variability, GUVs with pure POPC composition (2H31-POPC:13C18-POPC:POPC 20:20:60) were formed by either gentle hydration or electroformation. Thirty GUV patches with this composition were analyzed for each method, and their absolute concentrations were determined via external calibration curves. In Figure 6, the calculated 2H31-POPC concentrations in pure POPC samples are compared to the 2H31-POPC concentrations in the previously discussed ternary mixture. Ternary GUV patches formed either by electroformation or gentle hydration have higher measured standard deviations in 2H31-POPC concentrations relative to pure POPC patches formed by the same method (Figure 6C). This lower variability for the pure POPC GUVs can also be seen for the 13C18-labeled lipids (Figure S9). These results suggest that more complex lipid compositions lead to considerably more compositional variability. It also suggests that the observed compositional variability is not solely due to residual contamination of either the platinum electrodes used for electroformation or the glass vials used for gentle hydration. If these surfaces had significant contamination, pure POPC patches would have compositional variability comparable to that of ternary patches. Comparison of 2H31-POPC concentration variability between pure POPC patches formed via either electroformation or gentle hydration did not show a significant difference in compositional variability (Figure S10). This suggests that the higher standard deviations observed in GUV patches formed via gentle hydration (Figures 4 and 5) are not due to higher residual contamination on glass vials relative to the platinum electrodes but rather result from the complexity of the ternary mixture and the method of GUV formation. Additionally, the average 2H−, 12C−, and 13C− counts were compared between regions of interest with and without a bilayer to gauge the level of contamination on the substrate surface (Figure S11). Regions of interest containing bilayer showed considerably higher signal on all detectors than regions of interest in an exposed substrate. Further analysis was also performed to correct the observed variabilities in ternary GUV patches for noise due to sample preparation and analysis (discussed in Section 10 of the Supporting Information).
Figure 6.
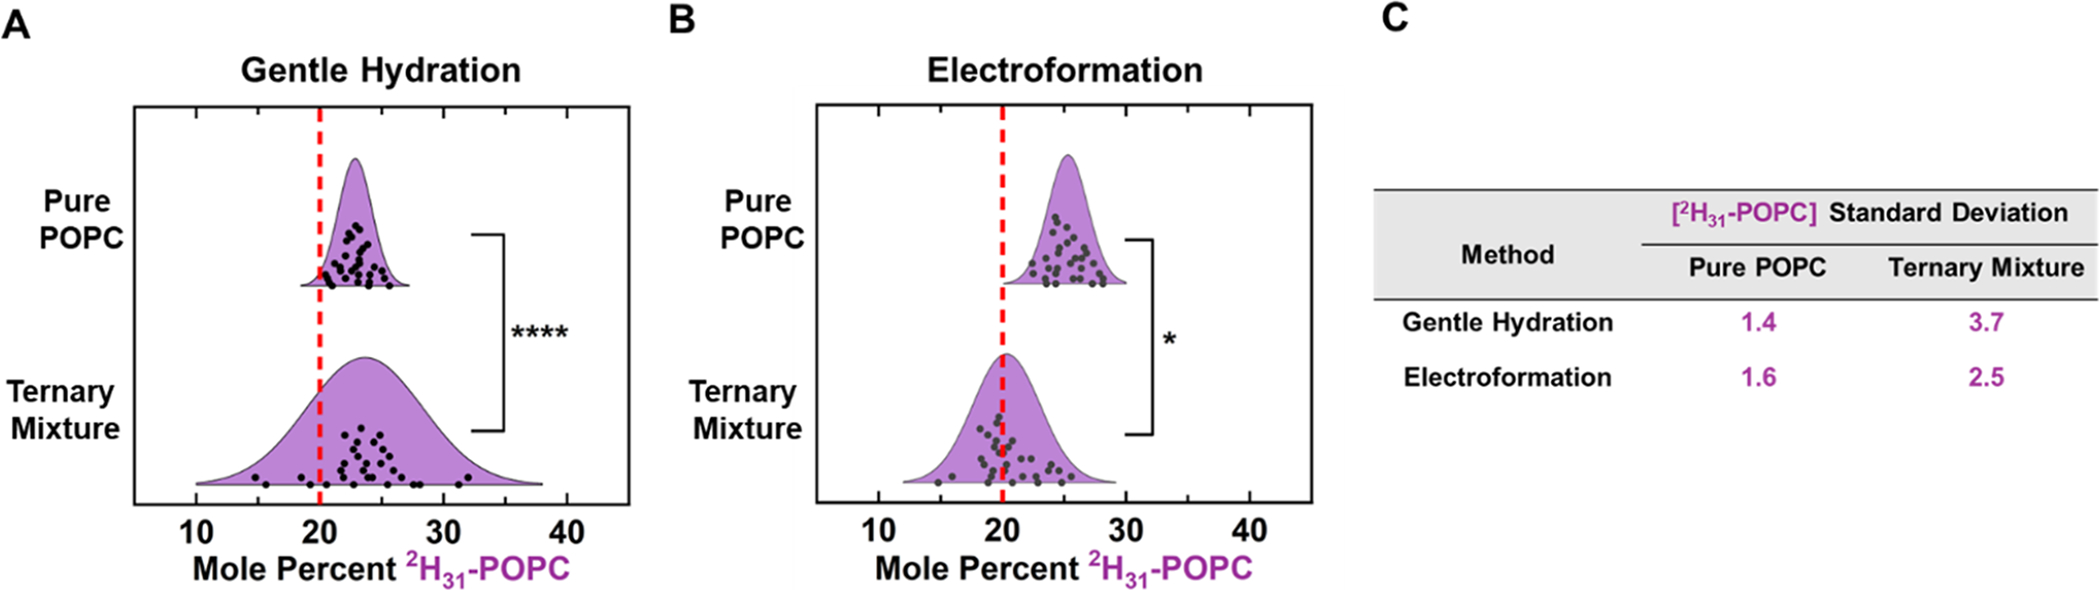
Pure and ternary mixture concentration variability. 2H31-POPC concentrations of individual GUV patches composed with pure POPC (13C18-POPC:2H31-POPC:POPC 20:20:60) or ternary (13C18-DSPC:POPC:2H31-POPC:CHOL 20:20:20:20:20) compositions were compared. Both pure POPC and ternary GUVs were formed by either electroformation (A) or gentle hydration (B). For both methods, the patches composed of pure POPC display significantly less 2H31-POPC concentration variability than that of ternary patches formed using the same method. Dot plot representations of these distributions can be seen in Figure S23. (C) Displays the calculated standard deviations for each sample.
To further examine potential sources of variability, lipid films from the master stock containing 13C18-DSPC and 2H31-POPC were dried directly on NanoSIMS substrates and imaged. No significant separation within the 50 nm lateral resolution of the NanoSIMS was observed between 13C18-DSPC and 2H31-POPC within the film (Figure S13). However, atomic recombination experiments demonstrated that there is nanoscale separation between POPC and DSPC within the film (Figure S14). These preferential interactions within the film may contribute to lipid sorting while GUVs are being formed.
Additional experiments also suggest that the size of the GUV patch analyzed is not correlated with either 13C18-DSPC or 2H31-POPC concentrations (Section 12 of the Supporting Information). Furthermore, additional data suggest that two different GUVs typically do not rupture to form one patch (Section 13 of the Supporting Information). This suggests that most patches are the product of a single GUV and that minimal compositional averaging between GUVs occurs.
The measured standard deviations as well as the corrected standard deviations (Section 10 of the Supporting Information) agree relatively well with indirect measurements of GUV-to-GUV compositional variation. Prior work using fluorescence microscopy to quantify the area fraction occupied by optically resolvable domains approximated a ±2.1 mol % standard deviation in electroformed DOPC/eSM/CHOL GUVs. Similarly, estimates from GUV transition temperatures measure a standard deviation of approximately ±245 or ±4 mol % for electroformed GUVs. These results are in relatively good agreement with the direct measurements presented here, where we measure standard deviations around 1–2 mol % for electroformed GUVs and 2–4 mol % for GUVs formed via gentle hydration. However, it should be noted that we used DSPC for this study, which is a higher melting point lipid and may lend itself to slightly greater variability due to the high temperatures (Tm = 54.4 °C) needed to keep this lipid fluid.
Quantifying Cholesterol Concentrations.
Cholesterol concentration was also examined in the GUV patches. Unlike phospholipids, Cholesterol localized significantly to the edges of GUV patches formed by either electroformation or gentle hydration as seen in Figures 7A and S18. This observation is consistent with work from other groups, who have noted that Lo domains can localize to the edge of GUV patches42,48 although other work has suggested that Ld domains can also partition to patch edges,49 suggesting that this effect may depend on the composition examined. However, for the composition examined here, we observe cholesterol (presumably in Lo domains) partitioning to the edges of bilayer patches. This partitioning makes quantification of cholesterol variability in GUVs significantly more challenging as the relative ratio of edge to center within the analyzed region needs to be considered as well as how the overall concentration of cholesterol in a patch may affect its partitioning between the edge and center. As a result, the variability in cholesterol concentration from GUV to GUV was not assessed. Instead, the average cholesterol concentration was determined for different GUV formation methods. Ternary GUV patches were formed via gentle hydration and electroformation using a master stock with nominal composition DSPC:POPC:2H31-POPC:13C27-CHOL 40:20:20:20. The average concentration was then calculated by either including or excluding the cholesterol-rich edges. Regardless of the analysis method used, the average concentration of cholesterol was lower in electroformed GUV patches, as can be seen in Figure 7C. The average 2H31-POPC concentration was the same between the two methods regardless of the analysis method (Figure S19). Average cholesterol concentration was also examined in GUV patches where all three components are isotopically labeled (Figure S18). These experiments also demonstrate lower average cholesterol concentrations in the electroformed GUVs.
Figure 7.

Cholesterol concentration differences between electroformation and gentle hydration. GUVs were formed via electroformation or gentle hydration from a master stock with nominal composition DSPC:POPC:2H31-POPC:13C27-CHOL 40:20:20:20. (A) NanoSIMS image of a GUV patch formed via electroformation, which shows significant localization of 13C27-CHOL to the edge of the GUV patch. (B) 13C27-CHOL calibration curve. (C) Comparison of 13C27-CHOL concentration in GUV patches formed via gentle hydration or electroformation. Error bars represent 95% confidence intervals. Comparisons were conducted either excluding the edge of the bilayer patch or including the edge of the bilayer patch. Regardless of the analysis method, electroformed GUVs contained less cholesterol on average. Replicate sample quantification along with internal controls (2H31-POPC concentration quantification) can be found in Figures S19 and S20 of the Supporting Information.
Although there appears to be cholesterol partitioning to the edge of bilayer patches, the increase in cholesterol concentration when the edge is included in the analysis relative to when it is excluded appears to be moderate. There is only a statistically significant difference between the analysis methods (p = 0.03), for GUVs formed via gentle hydration (Figure 7C). Replicate samples (Figure S20) do not reproduce this difference between the analysis methods. These replicates are of critical importance, as they suggest that the changes in cholesterol concentration are likely not an artifact resulting from the challenges associated with measuring absolute concentrations, as discussed at the end of the previous section.
The source of the difference in cholesterol concentrations between GUVs formed by electroformation and those formed by gentle hydration may be the result of the alternating current applied during electroformation. While the phospholipids present in the ternary mixture are zwitterionic and potentially more affected by the alternating current applied during electroformation, cholesterol is neutral and therefore may be less responsive to the applied current. This would result in a lower incorporation into electroformed GUVs. However, the experiments performed here cannot provide a definitive explanation or mechanism for the difference in cholesterol concentrations between the two methods. Additionally, it should be noted that prior measurements suggest that hydrated films50,51 have comparable cholesterol solubility limits to electroformed films.52 These results imply that both methods lead to equivalent cholesterol concentrations and disagree with the results presented here.
CONCLUSIONS
GUVs are a widely used model system for probing lipid–protein and lipid–lipid53,54 interactions. Despite the widespread use of GUVs, little work has been done to probe GUV-to-GUV compositional variation. This is likely due to the lack of methods to accurately assess the concentration of a given lipid within a single GUV. The Cameca NanoSIMS 50L allows for high-precision determination of the concentration of individual lipid species via non-perturbative stable isotope labeling.
Here, we demonstrate that variability on the order of 1–4 mol % is present in GUVs composed of a ternary DSPC:POPC:CHOL mixture. It is shown that GUVs formed via electroformation have considerably less compositional variability than those formed via gentle hydration (GUVs formed by electroformation have concentration standard deviations of 1–2 mol % compared to the 2–4 mol % of GUVs formed via gentle hydration). This is true regardless of whether the relative change in concentration between two labeled species is calculated or if the variability in the absolute concentration is determined via external calibration curves. Although the mechanism behind the lower variability seen in electroformed GUVs is unclear, it is clear that ternary mixtures are far more variable than pure mixtures and that preferential interactions between certain lipids are present in the films used to form ternary GUVs.
Although the variability in cholesterol concentration is not examined here, the average concentration of labeled cholesterol was compared between different methods. This demonstrated that electroformed GUVs have a lower average cholesterol concentration. Additionally, it is worth noting that other potential disadvantages have been reported with electroformation that are not discussed here.55 Therefore, while electroformation may yield more compositionally uniform GUVs, there are downsides to the method that must be considered.
Supplementary Material
ACKNOWLEDGMENTS
This work was supported by grants from the NSF (MCB-1915727) and NIH (R35GM118044) to S.G.B. The Cameca NanoSIMS 50L at the Stanford Nano Shared Facilities (SNSF) was supported by the National Science Foundation (ECCS-2026822). We thank Christie Jilly-Rehak and Matthew Mills at the Stanford Nanocharacterization Laboratory for instrument support on the NanoSIMS 50L.
Footnotes
The authors declare no competing financial interest.
Complete contact information is available at: https://pubs.acs.org/10.1021/jacs.3c09039
ASSOCIATED CONTENT
Supporting Information
The Supporting Information is available free of charge at https://pubs.acs.org/doi/10.1021/jacs.3c09039.
Choice of lipid mixture; normality verification for F-tests; replicate electroformation and gentle hydration samples; verification of absolute calibration accuracy; ternary monolayers; effect of analysis area on concentration distributions; 13C-labeled lipid comparisons in pure and ternary mixtures; comparison of pure POPC mixtures with different methods; detector counts on bilayer and exposed substrates; correcting ternary GUV compositional variability; nanoscale heterogeneity in lipid films; relation between GUV patch size and 13C18-DSPC and 2H31-POPC concentrations; assessing the extent of GUV mixing during patch formation; tracking cholesterol concentration in triply labeled bilayers; assessing average 2H31-POPC concentration in 13C27-CHOL containing patches; tabulated raw GUV composition data; dot plot representations of GUV composition distributions (PDF)
Contributor Information
Dashiel S. Grusky, Department of Chemistry, Stanford University, Stanford, California 94305-5012, United States
Ahanjit Bhattacharya, Department of Chemistry, Stanford University, Stanford, California 94305-5012, United States.
Steven G. Boxer, Department of Chemistry, Stanford University, Stanford, California 94305-5012, United States
REFERENCES
- (1).Heberle FA; Wu J; Goh SL; Petruzielo RS; Feigenson GW Comparison of Three Ternary Lipid Bilayer Mixtures: FRET and ESR Reveal Nanodomains. Biophys. J. 2010, 99 (10), 3309–3318. [DOI] [PMC free article] [PubMed] [Google Scholar]
- (2).Veatch SL; Keller SL Miscibility Phase Diagrams of Giant Vesicles Containing Sphingomyelin. Phys. Rev. Lett. 2005, 94 (14), No. 148101. [DOI] [PubMed] [Google Scholar]
- (3).Bezlyepkina N; Gracià RS; Shchelokovskyy P; Lipowsky R; Dimova R Phase Diagram and Tie-Line Determination for the Ternary Mixture DOPC/eSM/Cholesterol. Biophys. J. 2013, 104 (7), 1456–1464. [DOI] [PMC free article] [PubMed] [Google Scholar]
- (4).Konyakhina TM; Wu J; Mastroianni JD; Heberle FA; Feigenson GW Phase Diagram of a 4-Component Lipid Mixture: DSPC/DOPC/POPC/Chol. Biochim. Biophys. Acta BBA - Biomembr 2013, 1828 (9), 2204–2214. [DOI] [PMC free article] [PubMed] [Google Scholar]
- (5).Jo̷rgensen IL; Kemmer GC; Pomorski TG Membrane Protein Reconstitution into Giant Unilamellar Vesicles: A Review on Current Techniques. Eur. Biophys. J. 2017, 46 (2), 103–119. [DOI] [PubMed] [Google Scholar]
- (6).Shi Z; Sachs JN; Rhoades E; Baumgart T Biophysics of α-Synuclein Induced Membrane Remodelling. Phys. Chem. Chem. Phys. 2015, 17 (24), 15561–15568. [DOI] [PMC free article] [PubMed] [Google Scholar]
- (7).Doeven MK; Folgering JHA; Krasnikov V; Geertsma ER; Van den bogaart G; Poolman B Distribution, Lateral Mobility and Function of Membrane Proteins Incorporated into Giant Unilamellar Vesicles. Biophys. J. 2005, 88 (2), 1134–1142. [DOI] [PMC free article] [PubMed] [Google Scholar]
- (8).Islam Md. Z.; Ariyama H; Alam J. Md.; Yamazaki M Entry of Cell-Penetrating Peptide Transportan 10 into a Single Vesicle by Translocating Across Lipid Membrane and Its Induced Pores. Biochemistry 2014, 53 (2), 386–396. [DOI] [PubMed] [Google Scholar]
- (9).Aimon S; Callan-jones A; Berthaud A; Pinot M; Toombes GES; Bassereau P Membrane Shape Modulates Transmembrane Protein Distribution. Dev. Cell 2014, 28 (2), 212–218. [DOI] [PMC free article] [PubMed] [Google Scholar]
- (10).Garten M; Aimon S; Bassereau P; Toombes GES Reconstitution of a Transmembrane Protein, the Voltage-Gated Ion Channel, KvAP, into Giant Unilamellar Vesicles for Microscopy and Patch Clamp Studies. J. Vis. Exp. 2015, No. 95, No. e52281. [DOI] [PMC free article] [PubMed] [Google Scholar]
- (11).Göpfrich K; Haller B; Staufer O; Dreher Y; Mersdorf U; Platzman I; Spatz JP One-Pot Assembly of Complex Giant Unilamellar Vesicle-Based Synthetic Cells. ACS Synth. Biol. 2019, 8 (5), 937–947. [DOI] [PMC free article] [PubMed] [Google Scholar]
- (12).Noireaux V; Libchaber A A Vesicle Bioreactor as a Step toward an Artificial Cell Assembly. Proc. Natl. Acad. Sci. U. S. A. 2004, 101 (51), 17669–17674. [DOI] [PMC free article] [PubMed] [Google Scholar]
- (13).Nomura SM; Tsumoto K; Hamada T; Akiyoshi K; Nakatani Y; Yoshikawa K Gene Expression within Cell-Sized Lipid Vesicles. ChemBioChem 2003, 4, 1172–1175. [DOI] [PubMed] [Google Scholar]
- (14).Kurihara K; Tamura M; Shohda K; Toyota T; Suzuki K; Sugawara T Self-Reproduction of Supramolecular Giant Vesicles Combined with the Amplification of Encapsulated DNA. Nat. Chem. 2011, 3 (10), 775–781. [DOI] [PubMed] [Google Scholar]
- (15).Bagatolli LA; Gratton E Two Photon Fluorescence Microscopy of Coexisting Lipid Domains in Giant Unilamellar Vesicles of Binary Phospholipid Mixtures. Biophys. J. 2000, 78 (1), 290–305. [DOI] [PMC free article] [PubMed] [Google Scholar]
- (16).Zhao J; Wu J; Heberle FA; Mills TT; Klawitter P; Huang G; Costanza G; Feigenson GW Phase Studies of Model Biomembranes: Complex Behavior of DSPC/DOPC/Cholesterol. Biochim. Biophys. Acta BBA - Biomembr. 2007, 1768 (11), 2764–2776. [DOI] [PMC free article] [PubMed] [Google Scholar]
- (17).Zhao J; Wu J; Shao H; Kong F; Jain N; Hunt G; Feigenson G Phase Studies of Model Biomembranes: Macroscopic Coexistence of Lα+Lβ, with Light-Induced Coexistence of Lα+Lo Phases. Biochim. Biophys. Acta BBA - Biomembr. 2007, 1768 (11), 2777–2786. [DOI] [PMC free article] [PubMed] [Google Scholar]
- (18).Konyakhina TM; Goh SL; Amazon J; Heberle FA; Wu J; Feigenson GW Control of a Nanoscopic-to-Macroscopic Transition: Modulated Phases in Four-Component DSPC/DOPC/POPC/Chol Giant Unilamellar Vesicles. Biophys. J. 2011, 101 (2), L8–L10. [DOI] [PMC free article] [PubMed] [Google Scholar]
- (19).Wang H-Y; Chan SH; Dey S; Castello-serrano I; Rosen MK; Ditlev JA; Levental KR; Levental I Coupling of Protein Condensates to Ordered Lipid Domains Determines Functional Membrane Organization. Sci. Adv. 2023, 9, No. eadf6205, DOI: 10.1126/sciadv.adf6205. [DOI] [PMC free article] [PubMed] [Google Scholar]
- (20).Veatch SL; Polozov IV; Gawrisch K; Keller SL Liquid Domains in Vesicles Investigated by NMR and Fluorescence Microscopy. Biophys. J. 2004, 86 (5), 2910–2922. [DOI] [PMC free article] [PubMed] [Google Scholar]
- (21).Angelova MI; Soléau S; Méléard Ph.; Faucon F; Bothorel P Preparation of Giant Vesicles by External AC Electric Fields Kinetics and Applications. Prog. Colloid Polym. Sci. 1992, 89, 127–131. [Google Scholar]
- (22).Herold C; Chwastek G; Schwille P; Petrov EP Efficient Electroformation of Supergiant Unilamellar Vesicles Containing Cationic Lipids on ITO-Coated Electrodes. Langmuir 2012, 28 (13), 5518–5521. [DOI] [PubMed] [Google Scholar]
- (23).Reeves JP; Dowben RM Formation and Properties of Thin-Walled Phospholipid Vesicles. J. Cell. Physiol. 1969, 73 (1), 49–60. [DOI] [PubMed] [Google Scholar]
- (24).Darszon A; Vandenberg CA; Schönfeld M; Ellisman MH; Spitzer NC; Montal M Reassembly of Protein-Lipid Complexes into Large Bilayer Vesicles: Perspectives for Membrane Reconstitution. Proc. Natl. Acad. Sci. U. S. A. 1980, 77 (1), 239–243. [DOI] [PMC free article] [PubMed] [Google Scholar]
- (25).Needham D; Mcintosh TJ; Evans E Thermomechanical and Transition Properties of Dimyristoylphosphatidylcholine/Cholesterol Bilayers. Biochemistry 1988, 27 (13), 4668–4673. [DOI] [PubMed] [Google Scholar]
- (26).Angelova MI; Dimitrov DS Liposome Electroformation. Faraday Discuss. Chem. Soc. 1986, 81, 303–311. [Google Scholar]
- (27).Dimitrov DS; Angelova MI Lipid Swelling and Liposome Formation Mediated by Electric Fields. Biochem. Bioenerg. 1988, 19 (2), 323–336. [Google Scholar]
- (28).Dimitrov DS; Angelova MI Lipid Swelling and Liposome Formation on Solid Surfaces in External Electric Fields. In New Trends in Colloid Science; Hoffmann H, Ed.; Progress in Colloid & Polymer Science: Steinkopff: Darmstadt, 1987; Vol. 73, pp. 48–56. [Google Scholar]
- (29).Groves JT Bending Mechanics and Molecular Organization in Biological Membranes. Annu. Rev. Phys. Chem. 2007, 58 (1), 697–717. [DOI] [PubMed] [Google Scholar]
- (30).Rozovsky S; Kaizuka Y; Groves JT Formation and Spatio-Temporal Evolution of Periodic Structures in Lipid Bilayers. J. Am. Chem. Soc. 2005, 127 (1), 36–37. [DOI] [PubMed] [Google Scholar]
- (31).Rodriguez N; Pincet F; Cribier S Giant Vesicles Formed by Gentle Hydration and Electroformation: A Comparison by Fluorescence Microscopy. Colloids Surf. B Biointerfaces 2005, 42 (2), 125–130. [DOI] [PubMed] [Google Scholar]
- (32).Faizi HA; Tsui A; Dimova R; Vlahovska PM Bending Rigidity, Capacitance, and Shear Viscosity of Giant Vesicle Membranes Prepared by Spontaneous Swelling, Electroformation, Gel-Assisted, and Phase Transfer Methods: A Comparative Study. Langmuir 2022, 38 (34), 10548–10557. [DOI] [PMC free article] [PubMed] [Google Scholar]
- (33).Veatch SL; Keller SL Seeing Spots: Complex Phase Behavior in Simple Membranes. Biochim. Biophys. Acta BBA - Mol. Cell Res 2005, 1746 (3), 172–185. [DOI] [PubMed] [Google Scholar]
- (34).Baykal-caglar E; Hassan-zadeh E; Saremi B; Huang J Preparation of Giant Unilamellar Vesicles from Damp Lipid Film for Better Lipid Compositional Uniformity. Biochim. Biophys. Acta BBA - Biomembr 2012, 1818 (11), 2598–2604. [DOI] [PubMed] [Google Scholar]
- (35).Bryant G; Taylor MB; Darwish TA; Krause-heuer AM; Kent B; Garvey CJ Effect of Deuteration on the Phase Behaviour and Structure of Lamellar Phases of Phosphatidylcholines – Deuterated Lipids as Proxies for the Physical Properties of Native Bilayers. Colloids Surf. B Biointerfaces 2019, 177, 196–203. [DOI] [PubMed] [Google Scholar]
- (36).Veatch SL; Gawrisch K; Keller SL Closed-Loop Miscibility Gap and Quantitative Tie-Lines in Ternary Membranes Containing Diphytanoyl PC. Biophys. J. 2006, 90 (12), 4428–4436. [DOI] [PMC free article] [PubMed] [Google Scholar]
- (37).Hauri EH; Papineau D; Wang J; Hillion F High-Precision Analysis of Multiple Sulfur Isotopes Using NanoSIMS. Chem. Geol. 2016, 420, 148–161. [Google Scholar]
- (38).Kraft ML; Weber PK; Longo ML; Hutcheon ID; Boxer SG Phase Separation of Lipid Membranes Analyzed with High-Resolution Secondary Ion Mass Spectrometry. Science 2006, 313 (5795), 1948–1951. [DOI] [PubMed] [Google Scholar]
- (39).Lozano MM; Liu Z; Sunnick E; Janshoff A; Kumar K; Boxer SG Colocalization of the Ganglioside G M1 and Cholesterol Detected by Secondary Ion Mass Spectrometry. J. Am. Chem. Soc. 2013, 135 (15), 5620–5630. [DOI] [PMC free article] [PubMed] [Google Scholar]
- (40).Boxer SG; Kraft ML; Weber PK Advances in Imaging Secondary Ion Mass Spectrometry for Biological Samples. Annu. Rev. Biophys. 2009, 38 (1), 53–74. [DOI] [PubMed] [Google Scholar]
- (41).Ngassam VN; Su W-C; Gettel DL; Deng Y; Yang Z; Wang-tomic N; Sharma VP; Purushothaman S; Parikh AN Recurrent Dynamics of Rupture Transitions of Giant Lipid Vesicles at Solid Surfaces. Biophys. J. 2021, 120 (4), 586–597. [DOI] [PMC free article] [PubMed] [Google Scholar]
- (42).Bleecker JV; Cox PA; Foster RN; Litz JP; Blosser MC; Castner DG; Keller SL Thickness Mismatch of Coexisting Liquid Phases in Noncanonical Lipid Bilayers. J. Phys. Chem. B 2016, 120 (10), 2761–2770. [DOI] [PMC free article] [PubMed] [Google Scholar]
- (43).Grusky DS; Moss FR; Boxer SG Recombination between 13 C and 2 H to Form Acetylide (13 C 2 2 H −) Probes Nanoscale Interactions in Lipid Bilayers via Dynamic Secondary Ion Mass Spectrometry: Cholesterol and GM 1 Clustering. Anal. Chem. 2022, 94 (27), 9750–9757. [DOI] [PMC free article] [PubMed] [Google Scholar]
- (44).Lozano MM; Hovis JS; Moss FR; Boxer SG Dynamic Reorganization and Correlation among Lipid Raft Components. J. Am. Chem. Soc. 2016, 138 (31), 9996–10001. [DOI] [PMC free article] [PubMed] [Google Scholar]
- (45).Veatch SL; Keller SL Separation of Liquid Phases in Giant Vesicles of Ternary Mixtures of Phospholipids and Cholesterol. Biophys. J. 2003, 85 (5), 3074–3083. [DOI] [PMC free article] [PubMed] [Google Scholar]
- (46).Larsen J; Hatzakis NS; Stamou D Observation of Inhomogeneity in the Lipid Composition of Individual Nanoscale Liposomes. J. Am. Chem. Soc. 2011, 133 (28), 10685–10687. [DOI] [PubMed] [Google Scholar]
- (47).Moss FR; Boxer SG Atomic Recombination in Dynamic Secondary Ion Mass Spectrometry Probes Distance in Lipid Assemblies: A Nanometer Chemical Ruler. J. Am. Chem. Soc. 2016, 138 (51), 16737–16744. [DOI] [PMC free article] [PubMed] [Google Scholar]
- (48).Tokumasu F; Jin AJ; Feigenson GW; Dvorak JA Nanoscopic Lipid Domain Dynamics Revealed by Atomic Force Microscopy. Biophys. J. 2003, 84 (4), 2609–2618. [DOI] [PMC free article] [PubMed] [Google Scholar]
- (49).Bhatia T; Husen P; Ipsen JH; Bagatolli LA; Simonsen AC Fluid Domain Patterns in Free-Standing Membranes Captured on a Solid Support. Biochim. Biophys. Acta BBA - Biomembr. 2014, 1838 (10), 2503–2510. [DOI] [PubMed] [Google Scholar]
- (50).Garg S; Castro-roman F; Porcar L; Butler P; Bautista PJ; Krzyzanowski N; Perez-salas U Cholesterol Solubility Limit in Lipid Membranes Probed by Small Angle Neutron Scattering and MD Simulations. Soft Matter 2014, 10 (46), 9313–9317. [DOI] [PubMed] [Google Scholar]
- (51).Huang J; Buboltz JT; Feigenson GW Maximum Solubility of Cholesterol in Phosphatidylcholine and Phosphatidylethanolamine Bilayers. Biochim. Biophys. Acta BBA - Biomembr 1999, 1417 (1), 89–100. [DOI] [PubMed] [Google Scholar]
- (52).Stevens MM; Honerkamp-smith AR; Keller SL Solubility Limits of Cholesterol, Lanosterol, Ergosterol, Stigmasterol, and β-Sitosterol in Electroformed Lipid Vesicles. Soft Matter 2010, 6 (23), 5882. [DOI] [PMC free article] [PubMed] [Google Scholar]
- (53).Kahya N; Scherfeld D; Bacia K; Poolman B; Schwille P Probing Lipid Mobility of Raft-Exhibiting Model Membranes by Fluorescence Correlation Spectroscopy. J. Biol. Chem. 2003, 278 (30), 28109–28115. [DOI] [PubMed] [Google Scholar]
- (54).Konyakhina TM; Feigenson GW Phase Diagram of a Polyunsaturated Lipid Mixture: Brain Sphingomyelin/1-Stearoyl-2-Docosahexaenoyl-Sn-Glycero-3-Phosphocholine/Cholesterol. Biochim. Biophys. Acta BBA - Biomembr 2016, 1858 (1), 153–161. [DOI] [PMC free article] [PubMed] [Google Scholar]
- (55).Boban Z; Mardešić I; Subczynski WK; Jozić D; Raguz M Optimization of Giant Unilamellar Vesicle Electroformation for Phosphatidylcholine/Sphingomyelin/Cholesterol Ternary Mixtures. Membranes 2022, 12 (5), 525. [DOI] [PMC free article] [PubMed] [Google Scholar]
Associated Data
This section collects any data citations, data availability statements, or supplementary materials included in this article.