

Abstract
Background
UK cardiovascular disease (CVD) incidence and mortality have declined in recent decades but socioeconomic inequalities persist.
Aim
To present a new CVD model, and project health outcomes and the impact of guideline-recommended statin treatment across quintiles of socioeconomic deprivation in the UK.
Design and setting
A lifetime microsimulation model was developed using 117 896 participants in 16 statin trials, 501 854 UK Biobank (UKB) participants, and quality-of-life data from national health surveys.
Method
A CVD microsimulation model was developed using risk equations for myocardial infarction, stroke, coronary revascularisation, cancer, and vascular and non-vascular death, estimated using trial data. The authors calibrated and further developed this model in the UKB cohort, including further characteristics and a diabetes risk equation, and validated the model in UKB and Whitehall II cohorts. The model was used to predict CVD incidence, life expectancy, quality-adjusted life years (QALYs), and the impact of UK guideline-recommended statin treatment across socioeconomic deprivation quintiles.
Results
Age, sex, socioeconomic deprivation, smoking, hypertension, diabetes, and cardiovascular events were key CVD risk determinants. Model-predicted event rates corresponded well to observed rates across participant categories. The model projected strong gradients in remaining life expectancy, with 4–5-year (5–8 QALYs) gaps between the least and most socioeconomically deprived quintiles. Guideline-recommended statin treatment was projected to increase QALYs, with larger gains in quintiles of higher deprivation.
Conclusion
The study demonstrated the potential of guideline-recommended statin treatment to reduce socioeconomic inequalities. This CVD model is a novel resource for individualised long-term projections of health outcomes of CVD treatments.
Keywords: cardiovascular disease, individual patient characteristics, inequality, Markov microsimulation model, socioeconomic status, quality-adjusted life years
Introduction
Cardiovascular diseases (CVDs) are the leading cause of morbidity and mortality globally.1 In the UK, despite declines in age-standardised CVD mortality and morbidity over the last few decades, CVD remains a significant burden for the health system.2 Regional and socioeconomic inequalities persist, with slower improvements in the most deprived areas3,4 and increasing gaps in life expectancy at birth between the least and the most deprived quintiles from 5–7 to 6–8 years from 2001 to 2017.3
Disease policy models use epidemiological evidence to model key disease stages and relationships, and project the health status of individuals and populations.5 Unlike CVD risk equations, such as QRISK or SCORE,6,7 which estimate risk of a particular CVD outcome over a fixed period (typically 5 or 10 years), policy models can project long-term risks, accounting for competing risks, and enable estimation of long-term quality-of-life (QoL)-adjusted survival and costs, providing useful predictions for clinical and policy decision making. Policy models are often developed using summary data,8,9 which do not allow reliable assessment of outcomes in distinct patients. In recent years, however, an increasing number of CVD policy models, developed using individual-participant data (IPD), have emerged.10–15 These models, however, have often used older data,13–15 limiting their usefulness for contemporary policy analysis. Although the use of newer data to recalibrate CVD risk equations has been shown to improve their performance in contemporary populations,16,17 the authors of the current study are not aware of efforts to update policy models, which are structurally more complex, using newer data.
This article presents a new individual-based CVD microsimulation policy model, developed using IPD from trials and a large contemporary UK population cohort. The model was employed to assess health outcomes across UK quintiles of socioeconomic deprivation and the impact of guideline-recommended statin therapy on socioeconomic inequalities.
How this fits in
| This study presents a new cardiovascular disease microsimulation policy model that enables individualised lifetime predictions of disease risks, survival, and quality of life. The model quantified gaps at middle age of 4–5 years in life expectancy (5–8 quality-adjusted life years) across quintiles of socioeconomic deprivation in the UK. The study found that guideline-recommended statin treatment has a good potential to reduce health inequalities. Strengthening statin use would lead to larger benefits and further reductions in health inequalities. |
Method
The CVD microsimulation policy model structure
This CVD policy model is a microsimulation model of the progression of CVD and key competing events. The model (see schematic in Supplementary Figure S1) includes seven events, namely first occurrences of myocardial infarction (MI), stroke, coronary revascularisation (including percutaneous coronary intervention and coronary artery bypass grafting), incident cancer, incident diabetes, and vascular and non-vascular death. Parametric proportional hazards risk equations inform the risk of these events. The model inputs are individuals’ characteristics of age; sex; ethnicity; body mass index (BMI); smoking status; blood pressure; lipids; haemoglobin A1C (HbA1c) and creatinine levels; previous CVD history; treated hypertension; diabetes and cancer history; mental illness; physical activity; diet quality; and socioeconomic deprivation (based on Townsend Score) (see details in Supplementary Table S1 and Supplementary Information S1). The model projects disease events and health-related QoL annually until death or 110 years of age using each individual’s characteristics. In each annual cycle, the occurrences of events are simulated in a random order. Individuals’ age and history of events are updated annually and inform the subsequent events’ risks in a time-dependent manner.
Estimation and calibration of model risk equations
The risk equations underlying the CVD policy model were developed using Cholesterol Treatment Trialists’ (CTT) Collaboration and UK Biobank (UKB) IPD. First, Cox proportional hazards risk equations were estimated for model endpoints except incident diabetes (unavailable in CTT Collaboration data provided for this study) using 117 896 individuals from 16 randomised statin trials from the CTT Collaboration.18 Second, data from the 501 854 participants aged 40–70 years, recruited in the UKB between 2006 and 2010 throughout the UK, and their follow-up information until 31 March 201719 was used to calibrate the risk equations and develop a de novo incident diabetes risk equation. Separate parametric risk equations were fitted for individuals without and with CVD history, with the exception of the incident diabetes and incident cancer equations that were fitted across all participants. Parameter uncertainty was assessed using bootstrapping.20 See Supplementary Information S2 for further details.
Model validation
The model was validated by comparing the model-simulated cumulative incidences of each endpoint with the observed cumulative incidences overall and in participant categories. This included validating the UKB-calibrated model in the UKB cohort and among Whitehall II participants (n = 6761; 10 years’ follow-up; external validation) (see Supplementary Information S2 and S3).
Health-related QoL
Health-related QoL associated with participant characteristics and disease histories was estimated using a linear regression model of EuroQoL-5 Dimension (EQ-5D) utility using pooled 2006, 2011, and 2017 Health Survey for England (HSE) participant data. QoL utility ranges from −0.594 for the worst health state to 1 for full health where 0 is equivalent to death and values <0 represent health states worse than death in the EQ-5D-3L used in 2006 and 2011.21 The EQ-5D-5L, used in HSE 2017, was mapped into EQ-5D-3L22 before pooling. The QoL model was integrated into the CVD model to annually predict individuals’ QoL.
Model applications
The CVD microsimulation model was used to perform lifelong projections for all UKB participants using their baseline characteristics. The authors executed 500 microsimulations for each individual to minimise the Monte Carlo uncertainty, and probabilistic sensitivity analyses using 500 and 1000 bootstrap coefficient sets for individuals without and with CVD history at entry, respectively. The results were summarised in categories of UKB participants by CVD history, age, sex, and estimated 10-year CVD risk (QRISK 3 score).6
This model was used to assess the remaining life years, quality-adjusted life years (QALYs), and the effects of statin treatment, as recommended by the UK National Institute for Health and Care Excellence guidance,8 across quintiles of socioeconomic deprivation under the scenarios of full statin coverage and real-world use of statin treatment, as observed in UKB in 2015/2016 (Supplementary Information S2 and S4). The 10-year, 20-year, and lifetime projections of life years and QALYs for UKB participants were standardised to mid-2020 UK population distribution by sex, age, and socioeconomic quintile (based on the Index of Multiple Deprivation) (for details see Supplementary Information S2).
Software and computing
All analyses were performed using R (version 4.2.1). The model simulation utilised Queen Mary University of London’s Apocrita High Performance Computing facility, supported by Queen Mary University of London Research-IT.23
Stakeholder involvement
The project was guided by multidisciplinary project management and steering groups, including primary care and specialist clinicians, lay people, trialists, statisticians, and health economists. Three lay people were involved as members of these groups, helping refine methodology and approaches to presenting study findings.
Results
Summary of the CTT Collaboration and UKB data
In CTT Collaboration trials, 68 018 participants without and 49 878 with CVD history were followed over 3.9 and 4.6 years on average, respectively. In UKB, 444 576 participants without and 57 278 with CVD history were followed for 8.1 and 7.9 years on average, respectively. Their characteristics are summarised in Table 1. The details of contributing trials and the numbers of events during follow-up are summarised in Supplementary Tables S2 and S3.
Table 1.
Baseline characteristics of study participants
| Characteristic | CTT Collaboration | UK Biobank | ||
|---|---|---|---|---|
|
| ||||
| Without CVD history | With CVD history | Without CVD history | With CVD history | |
| n | 68 018 | 49 878 | 444 576 | 57 278 |
|
| ||||
| Age, years (SD) | 62.3 (9.2) | 62.7 (9.1) | 56.0 (8.1) | 60.4 (7.0) |
|
| ||||
| Sex, male, n (%) | 43 972 (64.6) | 39 085 (78.4) | 194 996 (43.9) | 33 734 (58.9) |
|
| ||||
| Ethnicity, n (%) | ||||
| White | 49 170 (72.3) | 38 901 (78.0) | 420 409 (94.6) | 54 488 (95.1) |
| Black | 6110 (9.0) | 1226 (2.5) | 7268 (1.6) | 770 (1.3) |
| South Asian | NA | NA | 6946 (1.6) | 1053 (1.8) |
| Othera | 12 738 (18.7) | 9751 (19.5) | 9953 (2.2) | 967 (1.7) |
|
| ||||
| Smoking status, n (%) | ||||
| Non-smoker | 54 145 (79.6)b | 40 324 (80.8)b | 250 261 (56.3) | 25 137 (43.9) |
| Ex-smoker | NA | NA | 148 312 (33.4) | 25 211 (44.0) |
| Current smoker | 13 873 (20.4) | 9554 (19.2) | 46 003 (10.3) | 6930 (12.1) |
|
| ||||
| BMI (kg/m2), n (%) | ||||
| <18.5 | 670 (1.0) | 251 (0.5) | 2370 (0.5) | 256 (0.4) |
| ≥18.5–<25 | 19 963 (29.3) | 15 023 (30.1) | 149 300 (33.6) | 13 415 (23.4) |
| ≥25–<30 | 28 598 (42.0) | 23 711 (47.5) | 189 650 (42.7) | 24 241 (42.3) |
| ≥30–<35 | 13 532 (19.9) | 8487 (17.0) | 74 714 (16.8) | 13 222 (23.1) |
| ≥35–<40 | 3708 (5.5) | 1806 (3.6) | 20 662 (4.6) | 4328 (7.6) |
| ≥40 | 1547 (2.3) | 600 (1.2) | 7880 (1.8) | 1816 (3.2) |
|
| ||||
| LDL cholesterol, mmol/L, mean (SD) | 3.5 (0.89) | 3.8 (0.85) | 3.6 (0.82) | 3.1 (0.87) |
|
| ||||
| HDL cholesterol, mmol/L, mean (SD) | 1.3 (0.38) | 1.1 (0.31) | 1.5 (0.37) | 1.3 (0.36) |
|
| ||||
| HbA1c, mmol/mol, mean (SD) | NA | NA | 35.8 (6.2) | 38.6 (8.7) |
|
| ||||
| Creatinine, umol/L, mean (SD) | 92 (23.8) | 98 (22.7) | 71 (15.1) | 77 (19.8) |
|
| ||||
| Systolic blood pressure, mmHg, mean (SD) | 142 (20.3) | 139 (22.1) | 138 (18.6) | 139 (18.9) |
|
| ||||
| Diastolic blood pressure, mmHg, mean (SD) | 83 (11.2) | 81 (11.3) | 82 (10.1) | 81 (10.5) |
|
| ||||
| On hypertension treatment, n (%) | 35 478 (52.2) | 25 472 (51.1) | 71 930 (16.2) | 26 184 (45.7) |
|
| ||||
| Prior diabetes (any), n (%) | 15 131 (22.2) | 7949 (15.9) | 21 567 (4.9) | 8171 (14.3) |
| Prior type 1 diabetes, n (%) | NA | NA | 2741 (0.6) | 1479 (2.6) |
|
| ||||
| Prior cancer, n (%) | 32 (0.1) | 25 (0.1) | 32 713 (7.4) | 5861 (10.2) |
|
| ||||
| Prior CVD, n (%) | ||||
| MI only | NA | 24 866 (49.9) | NA | 2071 (3.6) |
| Peripheral arterial disease only | NA | 3186 (6.4) | NA | 6806 (11.9) |
| Stroke only | NA | 3875 (7.8) | NA | 5137 (9.0) |
| Other coronary heart disease onlyc | NA | 9631 (19.3) | NA | 28 973 (50.6) |
| ≥2 | NA | 8320 (16.7) | NA | 14 291 (25.0) |
|
| ||||
| Townsend deprivation score,d n (%) | ||||
| Quintile 1 (least deprived) | NA | NA | 166 141 (37.4) | 18 960 (33.1) |
| Quintile 2 | NA | NA | 89 397 (20.1) | 10 957 (19.1) |
| Quintile 3 | NA | NA | 72 626 (16.3) | 9034 (15.8) |
| Quintile 4 | NA | NA | 64 448 (14.5) | 9178 (16.0) |
| Quintile 5 | NA | NA | 51 964 (11.7) | 9149 (16.0) |
|
| ||||
| Physical activity, n (%) | ||||
| High level | NA | NA | 145 206 (32.7) | 16 780 (29.3) |
| Moderate level | NA | NA | 146 156 (32.9) | 17 679 (30.9) |
| Low level | NA | NA | 65 932 (14.8) | 10 105 (17.6) |
| Missing | NA | NA | 87 282 (19.6) | 12 714 (22.2) |
|
| ||||
| History of severe mental illness, n (%) | NA | NA | 36 087 (8.1) | 6324 (11.0) |
|
| ||||
| Unhealthy diet (including uncertain), n (%) | NA | NA | 158 569 (35.7) | 21 705 (37.9) |
Other ethnicity includes Chinese, Mixed, White and Black Caribbean, White and Black African, White and Asian, any other mixed background, and other ethnic group.
Includes ex-smokers.
Other coronary heart disease includes acute rheumatic fever, chronic rheumatic heart diseases, hypertensive heart disease, angina pectoris, other acute ischaemic heart disease, chronic ischaemic heart disease, pulmonary heart disease, and other form of heart disease.
Townsend Score used to categorise UK Biobank participants into quintiles of socioeconomic deprivation using national cut-off values. BMI = body mass index. CTT = Cholesterol Treatment Trialists. CVD = cardiovascular disease. HbA1c = haemoglobin A1C. HDL = high-density lipoprotein. LDL = low-density lipoprotein. MI = myocardial infarction. NA = not available. SD = standard deviation.
Risk equations
MI was strongly associated with an increased risk of stroke, and MI and stroke were associated with an increased risk of vascular death, with increases greatest in the years of these events. Coronary revascularisation was associated with a reduced risk of vascular death. Duration since diabetes diagnosis was associated with increased risks of all cardiovascular events and, in those without diagnosed diabetes, higher HbA1c levels were associated with increased risks of all cardiovascular events. These patterns were similar between people without and with CVD history although magnitudes differed (Figure 1 and Supplementary Tables S4–S6).
Figure 1.
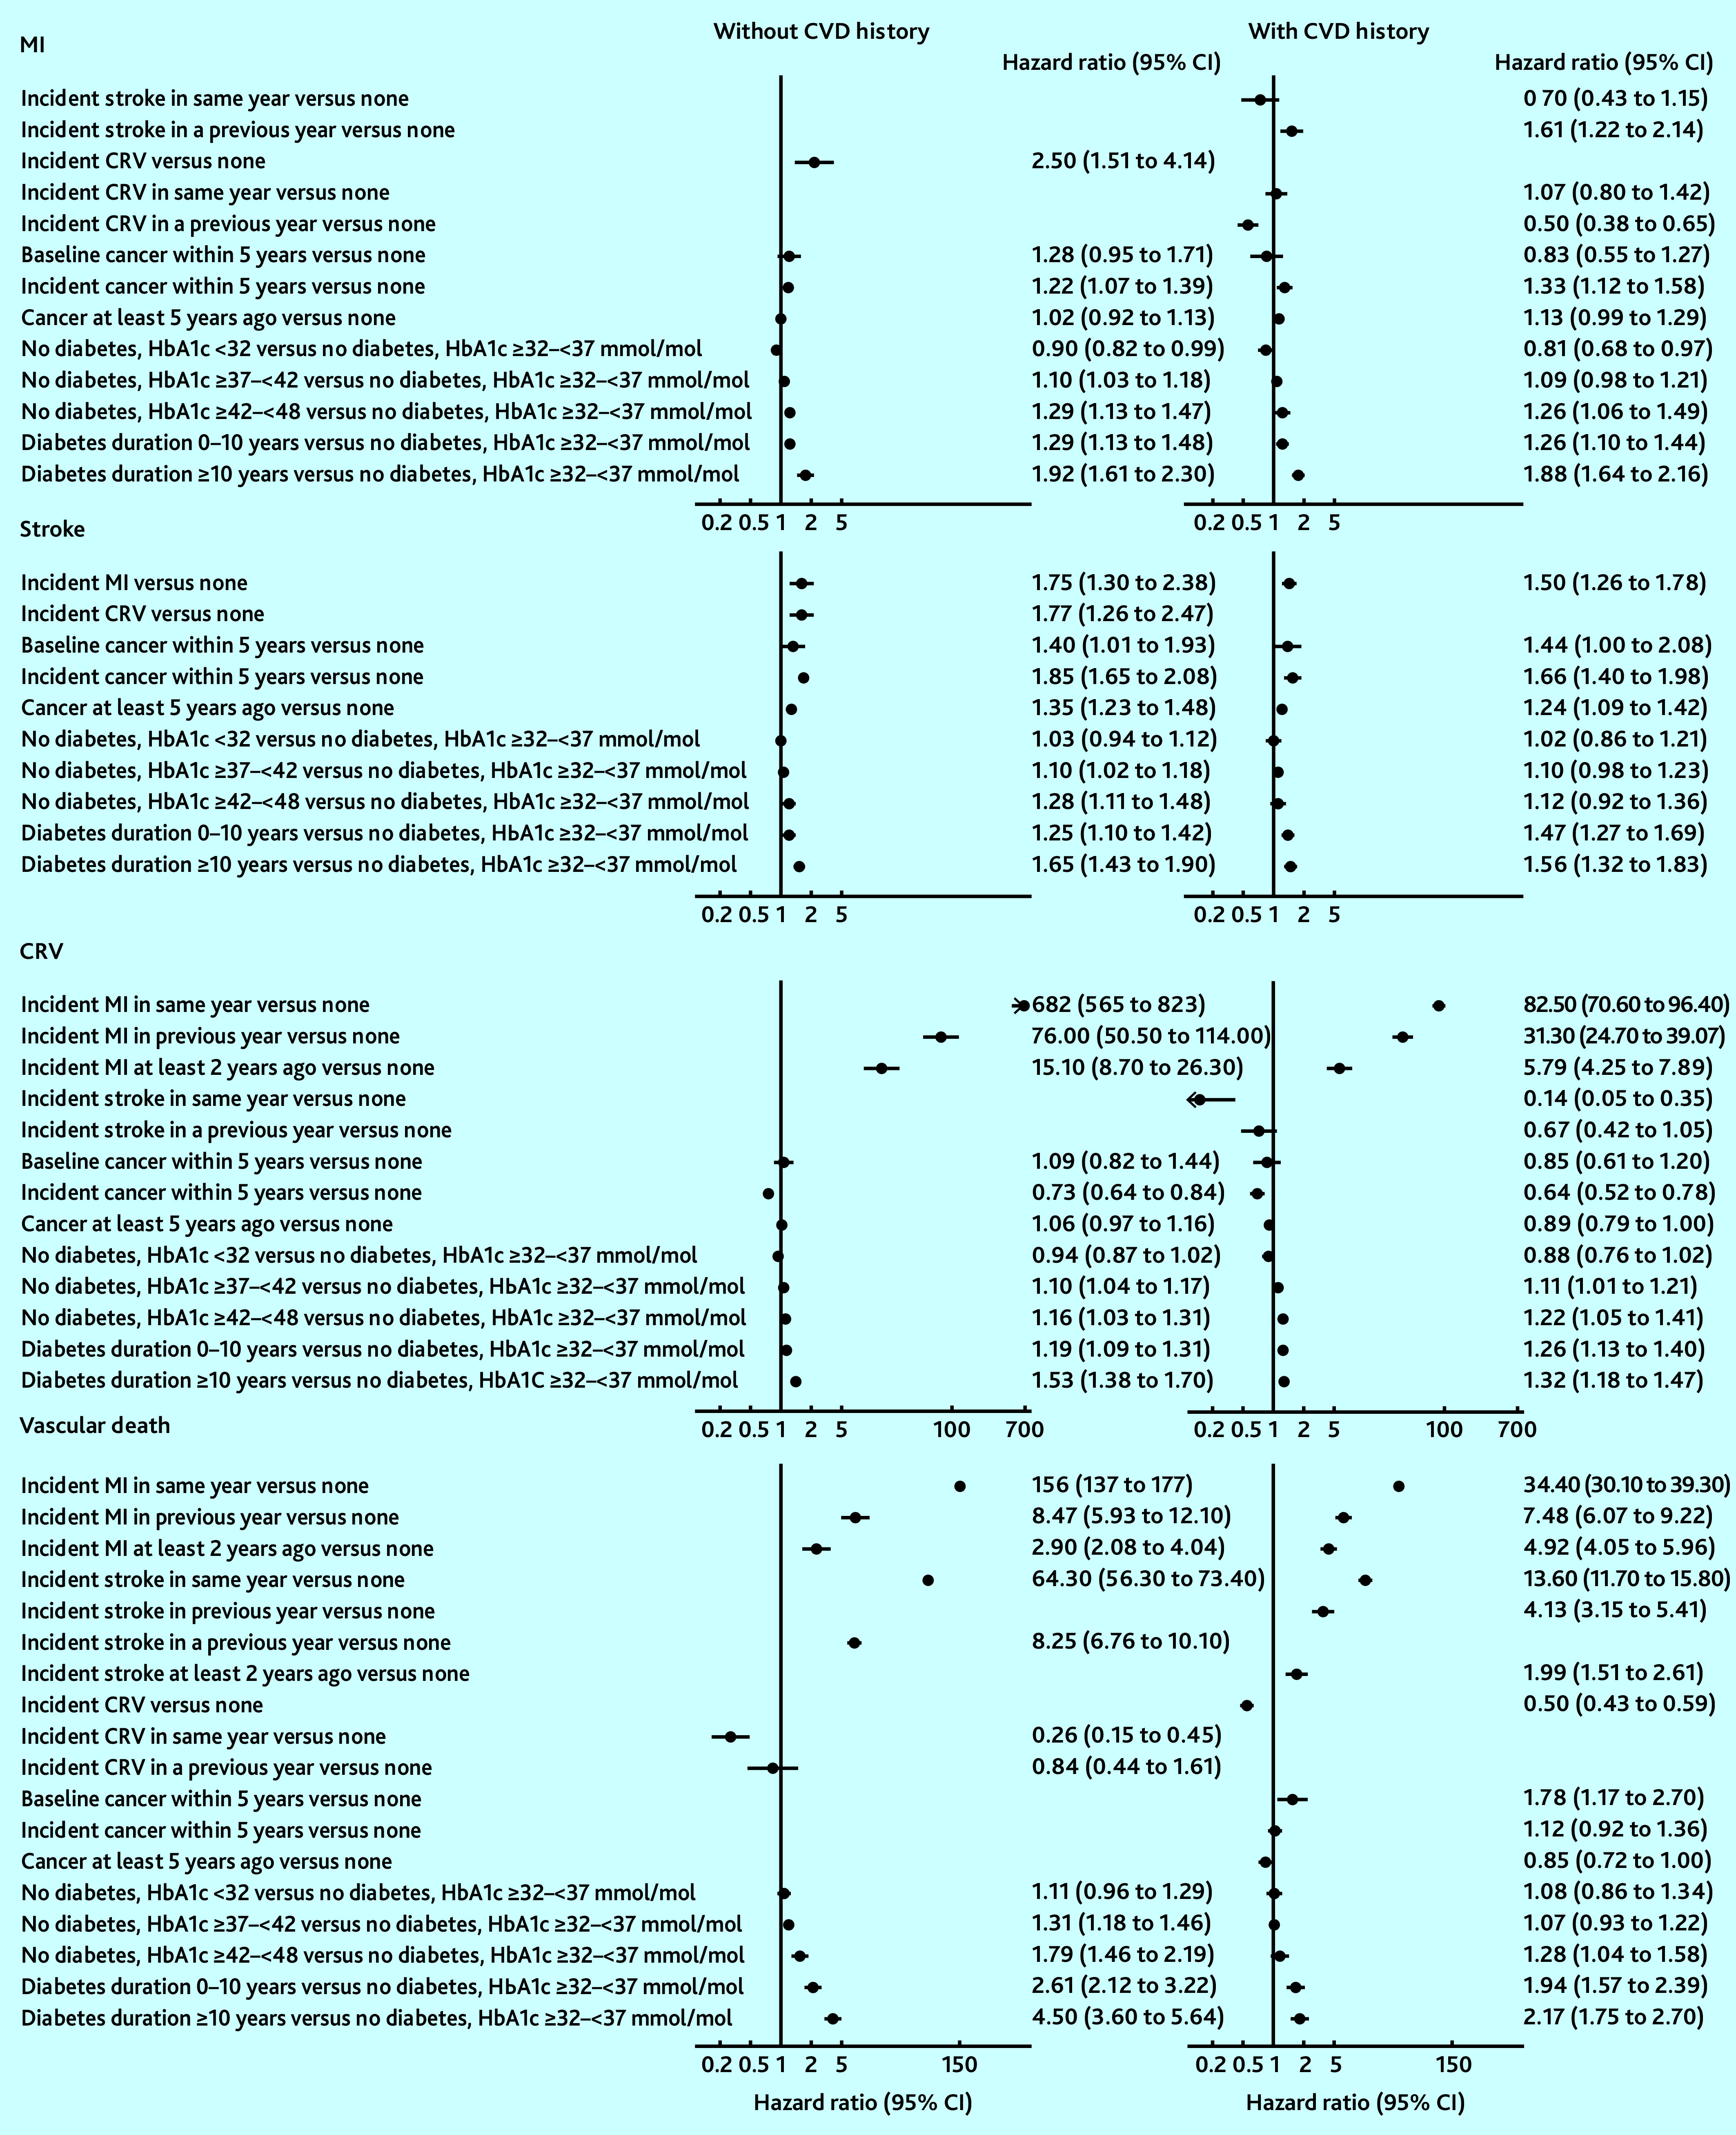
Risk of vascular endpoints associated with disease-event histories. Adjusted for other individual characteristics at entry and current age. See Supplementary Tables S4–S6 for full details of the risk equations. CRV = coronary revascularisation. CVD = cardiovascular disease. HbA1c = haemoglobin A1C. MI = myocardial infarction.
Age, male sex, smoking, treated hypertension, unhealthy diet, and lower physical activity were strongly associated with an increased risk of cardiovascular events. Greater socioeconomic deprivation was associated with a higher risk of stroke, incident diabetes, and vascular and non-vascular death (Supplementary Tables S4–S6).
Model validation
In the internal validation of the model based on CTT Collaboration risk equations, the model-predicted cumulative incidence rates closely matched the observed rates (Supplementary Figure S2). External validation of the model based on CTT Collaboration risk equations in the UKB cohort indicated the need for calibration to improve the accuracy of predictions. After calibration, there was good correspondence between cumulative incidence rates predicted by the model and the observed rates in the UKB for all endpoints across follow-up years in categories of participants (Figure 2 and Supplementary Figures S3 and S4). The UKB-calibrated model demonstrated a good overall performance in the external Whitehall II cohort (Figure 2).
Figure 2.
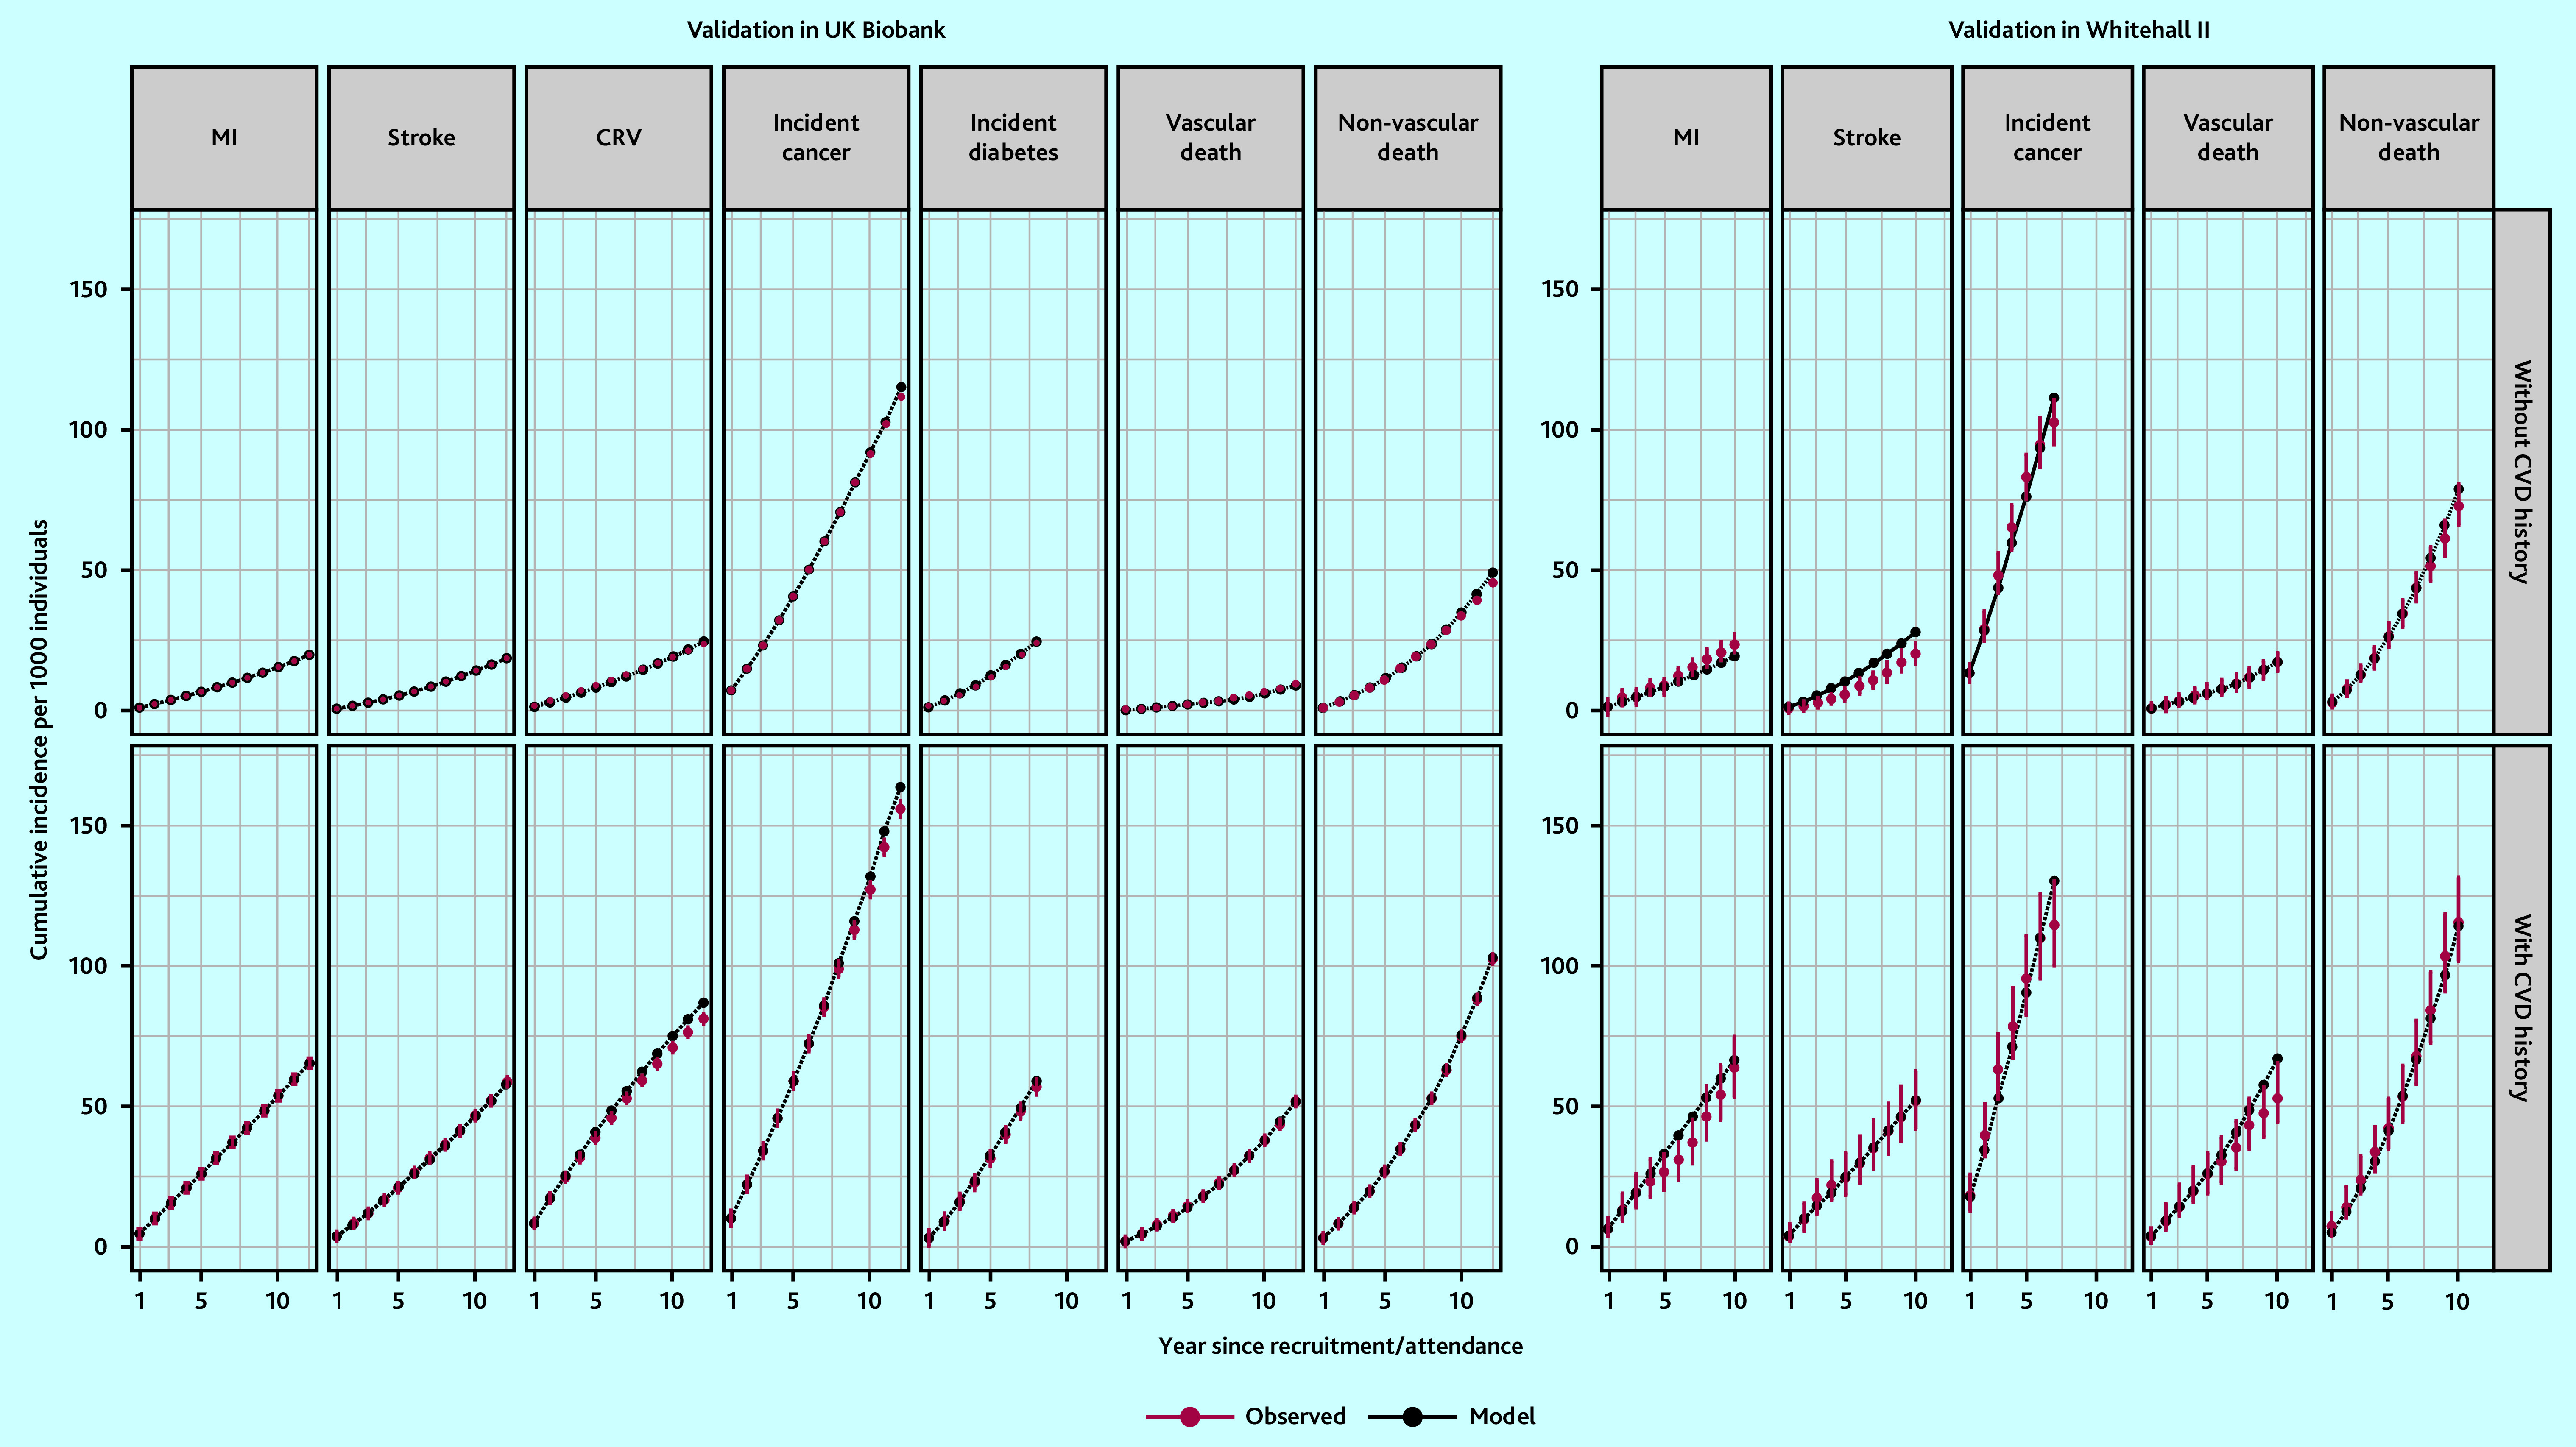
Validation of the CVD model in UK Biobank and Whitehall II Phase 9 participants. Validation covers 12 years in UK Biobank (8 years for incidence diabetes because of stopping follow-up earlier) and 10 years in Whitehall II Phase 9 data (7 years for incidence cancer because of stopping follow-up earlier). CRV = coronary revascularisation. CVD = cardiovascular disease. MI = myocardial infarction.
Effects of CVD events on QoL
CVD was a key determinant of QoL. MI was associated with a decrement in EQ-5D utility of 0.10 (95% confidence interval [CI] = 0.03 to 0.16) in the year of event and 0.07 (95% CI = 0.04 to 0.10) in subsequent years. Stroke was associated with a decrement of 0.09 (95% CI = 0.04 to 0.13) in the year of event and 0.13 (95% CI = 0.11 to 0.16) in subsequent years. Diabetes was associated with a decrement of 0.04 (95% CI = 0.03 to 0.06) in the first 10 years from diagnosis and 0.08 (95% CI = 0.06 to 0.10) in subsequent years. Cancer affecting daily life was associated with a decrement in QoL of 0.13 (95% CI = 0.11 to 0.14) (Supplementary Table S7). For use in the CVD microsimulation model, the cancer-related utility decrement was revised to 0.03 informed by the literature24–26 to reflect any cancer history.
Long-term projections of survival and QALYs
The differences in CVD risk between individuals of different age, sex, and cardiovascular risk were reflected in their model-predicted survival and QALYs (Figure 3). For individuals in the same age and sex category, shorter life expectancy and fewer QALYs were predicted for people with CVD history or higher 10-year CVD risk. Males had shorter life expectancy but more QALYs as a proportion of their life expectancy than females. The projected remaining life expectancy (from age at entry) ranged between 19.5 (95% CI = 18.7 to 20.4) and 38.9 (95% CI = 37.3 to 40.2) years (12.2 [95% CI = 11.7 to 12.8] to 33.0 [95% CI = 31.8 to 34.0] QALYs) for males, and 25.2 (95% CI = 24.2 to 25.9) and 42.1 (95% CI = 40.3 to 43.7) (14.7 [95% CI = 14.0 to 15.5] to 33.0 years (95% CI = 31.8 to 34.0] QALYs) for females. Being in the highest 10-year CVD risk category (≥20%) or having CVD history was associated with up to 10 years’ lower life expectancy and 14 less QALYs, compared with those in the same age group with the lowest risk (see summary of parameter uncertainty in Supplementary Tables S8–S10 and the events’ accumulation in Supplementary Figure S5).
Figure 3.

Predicted remaining life expectancy (years) and QALYs for UK Biobank participants. Predicted outcomes presented by CVD history, sex, age, and, for people without CVD history, by 10-year CVD risk (QRISK3). CVD = cardiovascular disease. QALY = quality-adjusted life year. NA = not available.
Health outcomes across quintiles of socioeconomic deprivation
There were moderate gradients at 10 years in the predicted years of life and QALYs across the quintiles of socioeconomic deprivation (Figure 4). Over a longer duration, the gradients in the predicted survival and QALYs increased. Over a lifetime, individuals in the most socioeconomically deprived quintile had 4–5 years’ shorter life expectancy (5–8 less QALYs) than those in the least deprived quintile.
Figure 4.
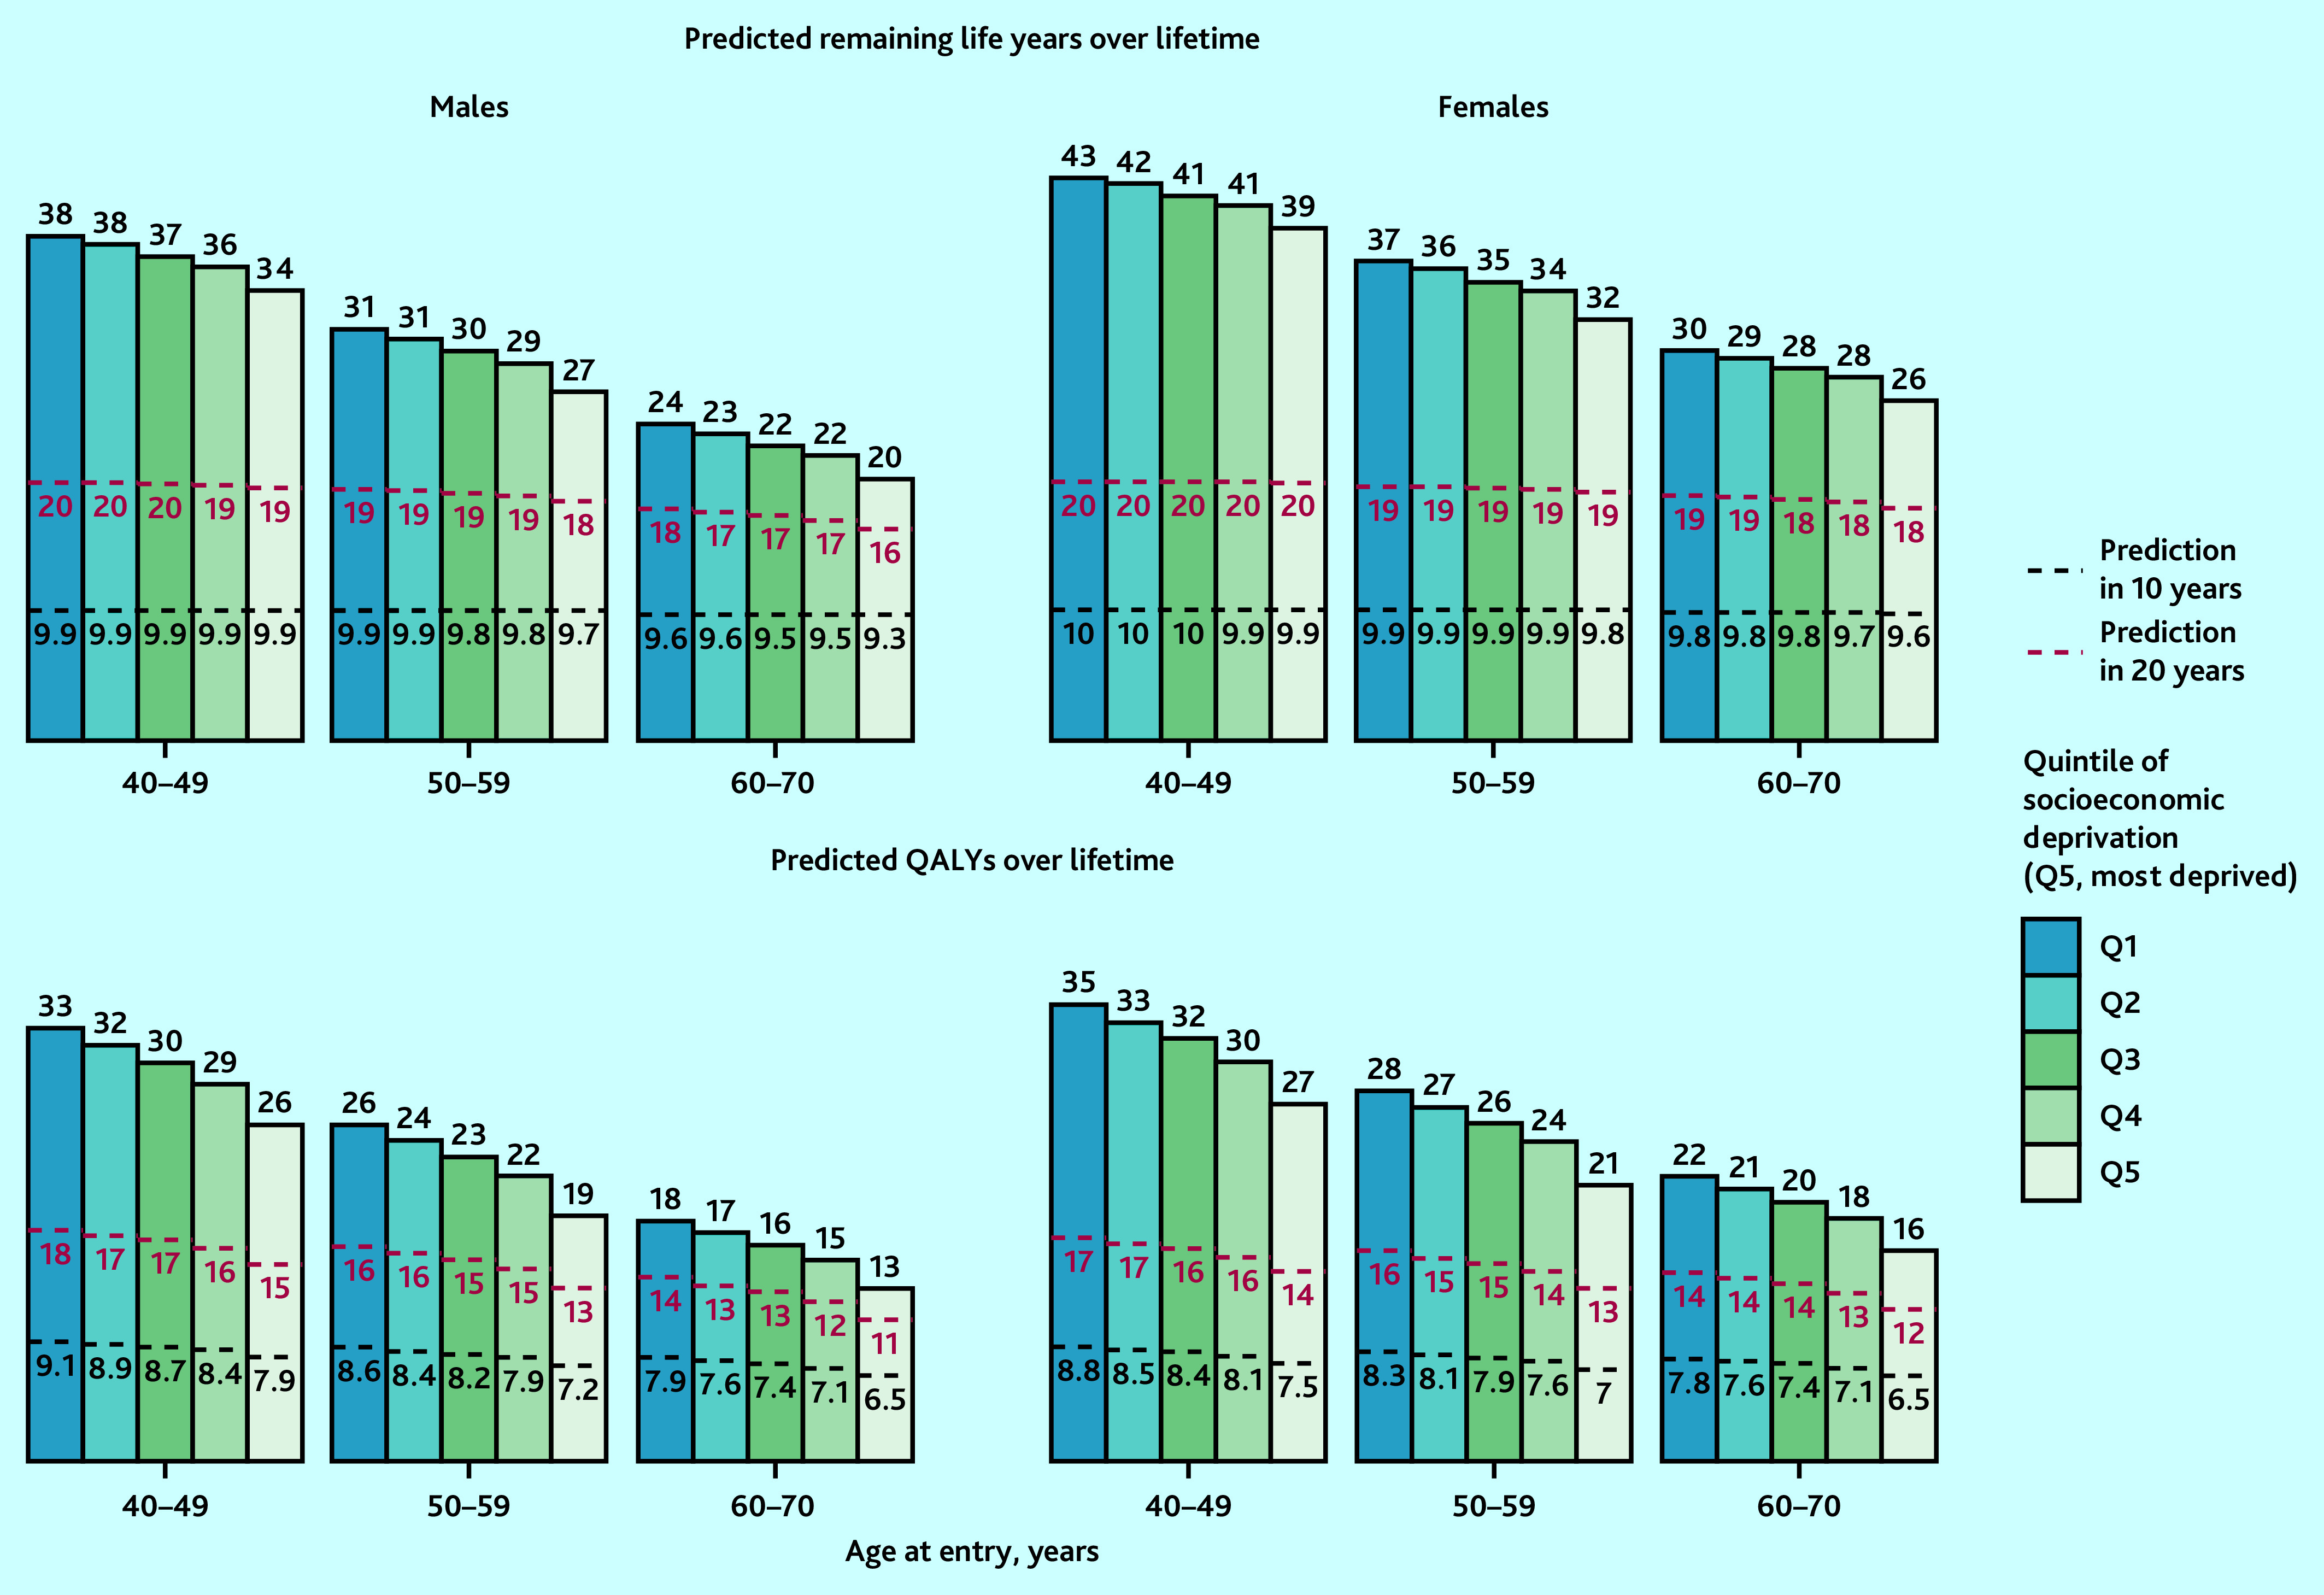
Predicted life years and QALYs in 10 years, 20 years, and over lifetime, by sex, age, and quintile of socioeconomic deprivation in the UK. Predicted remaining life years and QALYs by age, sex, and socioeconomic deprivation quintiles (using Townsend Score) at entry into UK Biobank were standardised to mid-2020 UK population distribution by age, sex, and quintile of socioeconomic deprivation (using Index of Multiple Deprivation quintiles). The bars represent remaining life years or QALYs over lifetime and the areas under the black-dotted lines and red-dotted lines represent QALYs in 10 years and QALYs in 20 years, respectively. CVD = cardiovascular disease. QALY = quality-adjusted life year.
Benefits from statin therapy across quintiles of socioeconomic deprivation
UKB participants in more socioeconomically deprived quintiles were more likely to be at higher CVD risk and, therefore, meet statin treatment criteria, and gained more benefit. For instance, compared with no use of statin therapy, if all people in their 50s recommended statin therapy were initiating and taking it over their lifetime, 703 and 360 life years (399 and 170 QALYs) per 1000 males and females were projected to be gained in the most deprived quintile, respectively, compared with 406 and 94 life years (277 and 55 QALYs) projected to be gained in the least deprived quintile (Figure 5).
Figure 5.
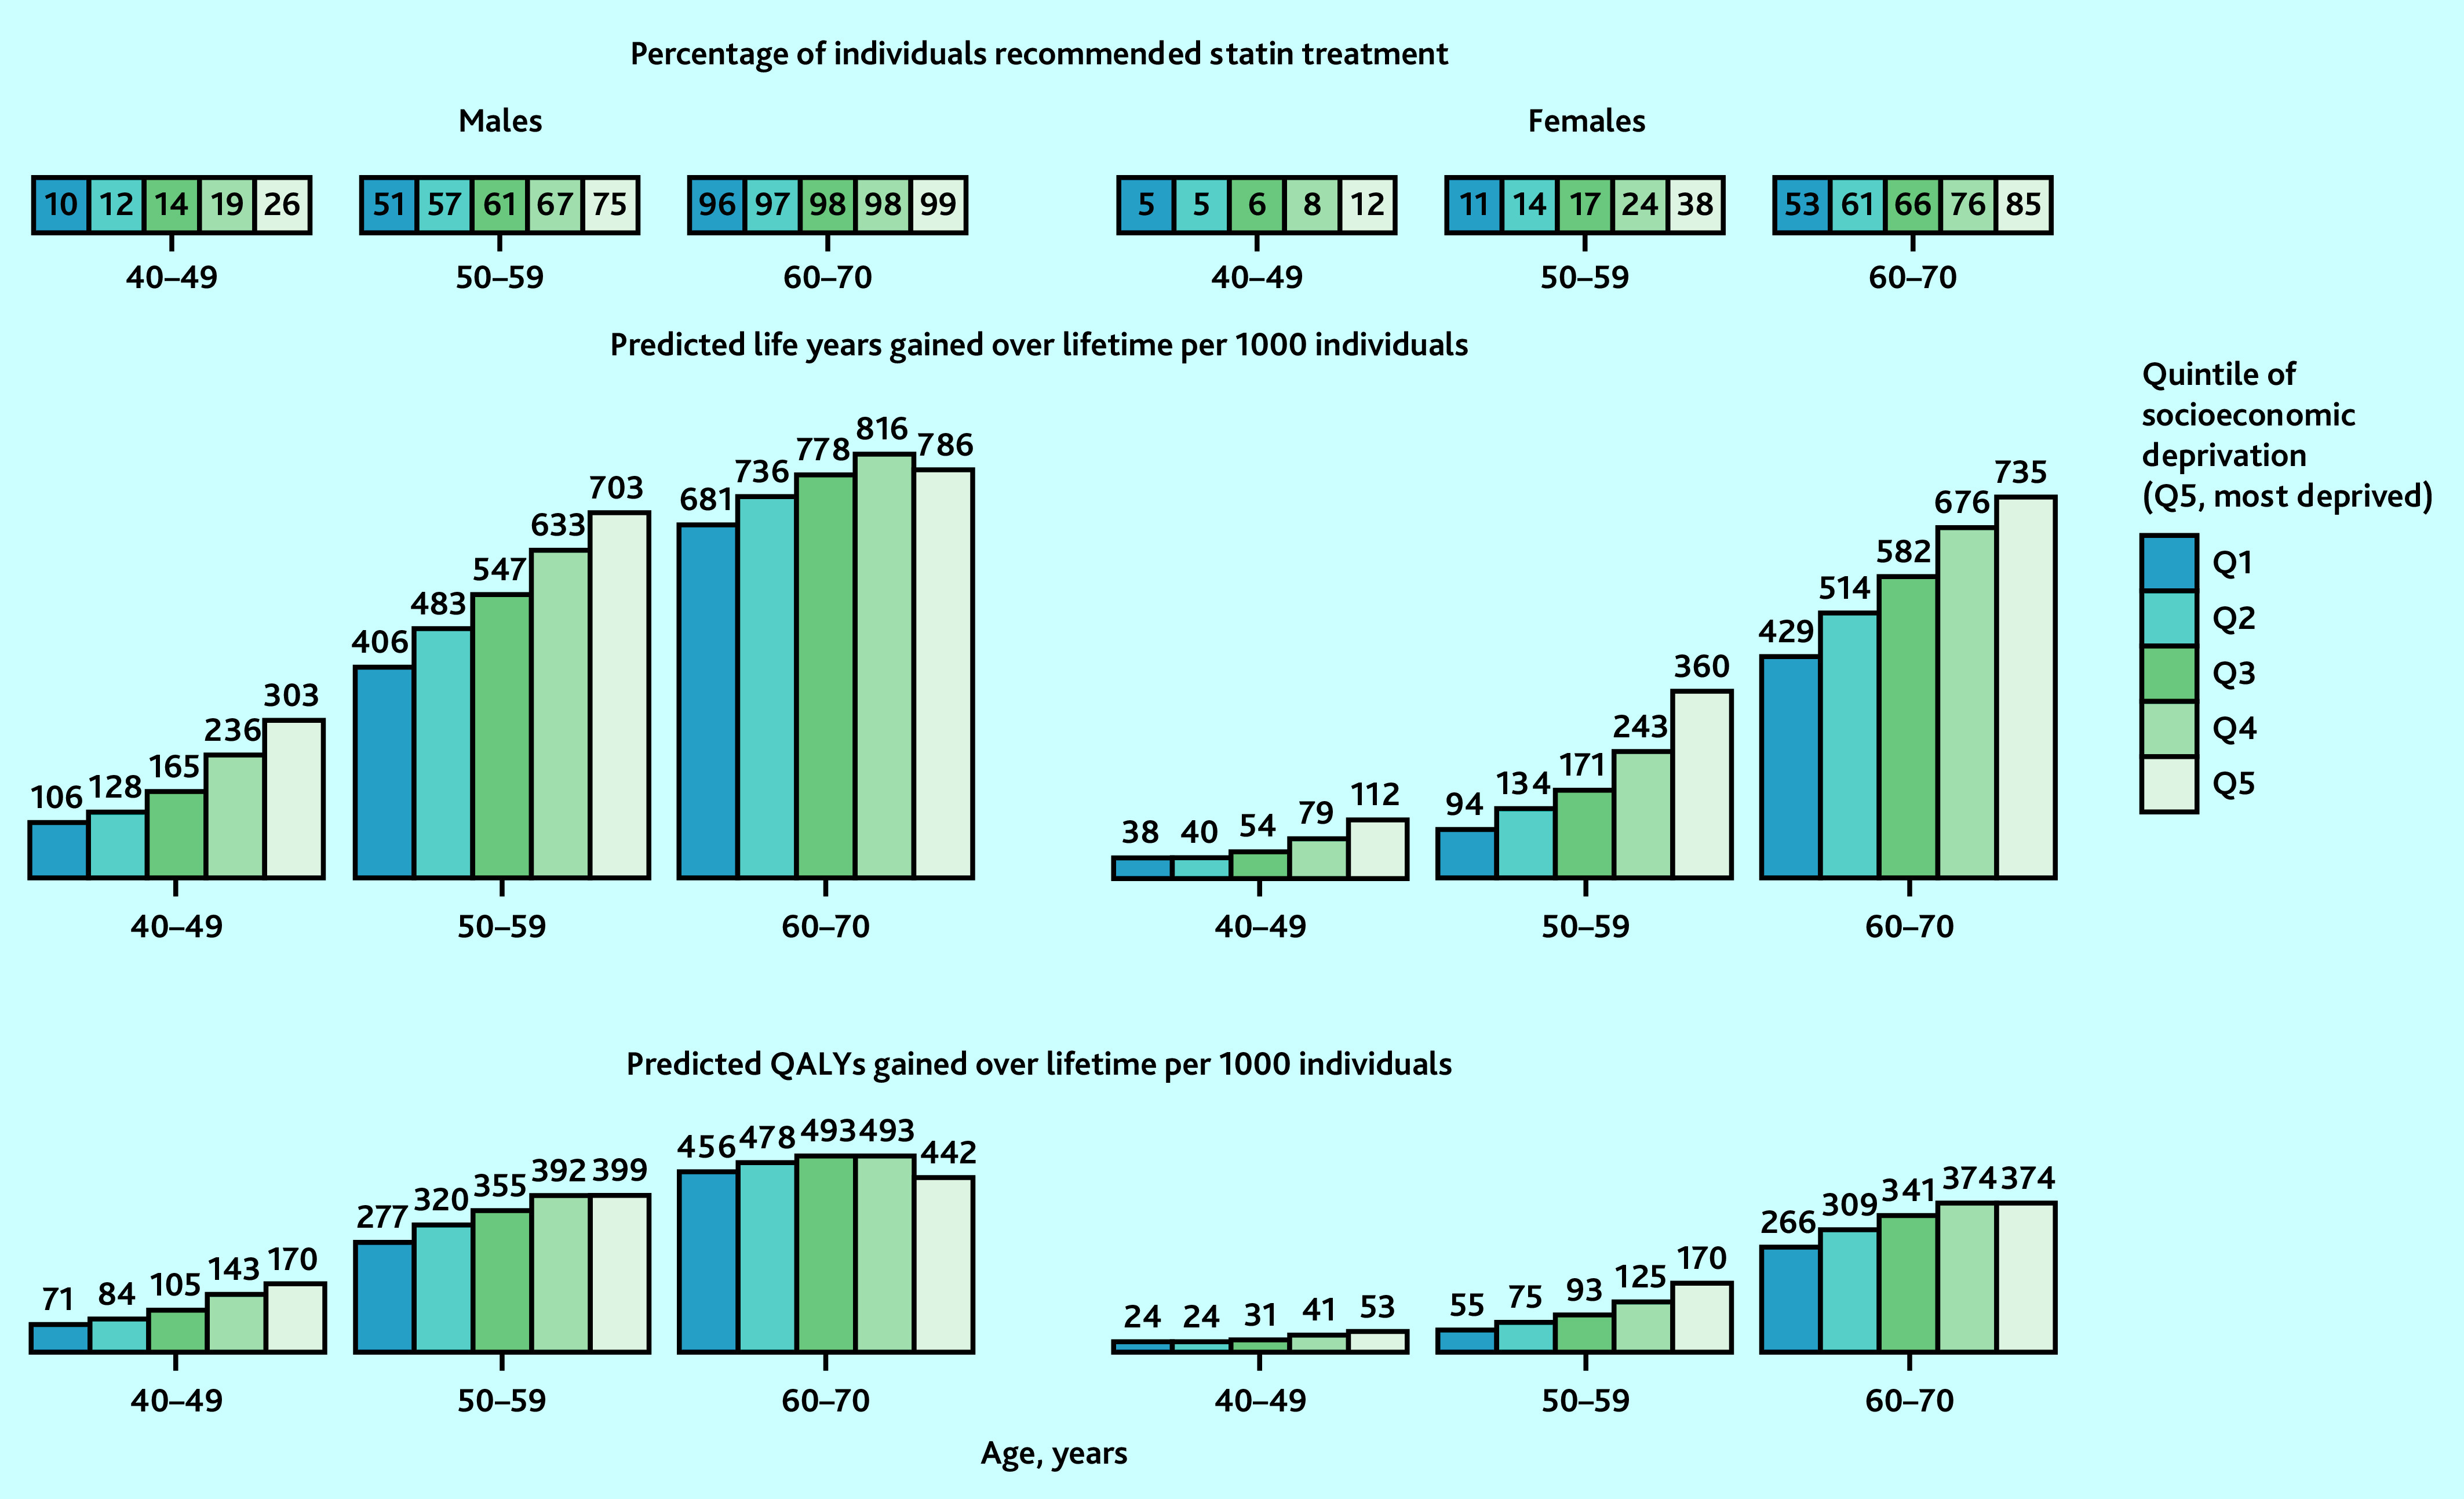
Predicted lifetime benefit from UK guideline-recommended statin therapy, by sex, age, and quintile of socioeconomic deprivation in UK. Predicted life years and QALYs gained with full implementation of UK National Institute for Health and Care Excellence guideline-recommended statin therapy at entry into UK Biobank were standardised to mid-2020 UK population distribution by age, sex, and quintile of socioeconomic deprivation (using Index of Multiple Deprivation quintiles). Atorvastatin 20 mg/day was used for individuals without cardiovascular (CVD) history but with a 10-year CVD risk ≥10% and/or type 1 diabetes, an estimated glomerular filtration rate (eGFR) <60 mL/min/1.732, or albuminuria; and atorvastatin 80 mg/day for individuals with CVD history (20 mg in those with eGFR <60 mL/min/1.732). QALY = quality-adjusted life year.
In scenario analysis, the real-world use of statin treatment among eligible participants ranged from about 40% in the least deprived to 45% in the most deprived quintile and, although treatment benefits were proportionately reduced, larger benefits were projected in quintiles with higher socioeconomic deprivation (Supplementary Figure S6).
Model web interface and prediction for a typical individual
The CVD microsimulation model interface and user guide are available at https://livedataoxford.shinyapps.io/shiny_ctt_ukb_model. The model interface enables users to project outcome for one or a group of patients. To illustrate its use, the model predicted 5.2% 10-year and 40% lifetime cumulative incidence of major vascular event (MI, stroke, coronary revascularisation, or vascular death), 28 years’ further lifespan, and 23 QALYs over the lifetime for a 60-year-old White male, non-smoker, overweight (BMI 25–30 kg/m2), in quintile 3 of socioeconomic deprivation, with moderate physical activities, a healthy diet, a low-density lipoprotein cholesterol of 3.6 mmol/L, a high-density lipoprotein cholesterol of 1 mmol/L, creatinine of 82 umol/L, blood pressure of 140/80 mmHg, HbA1c of 40 mmol/mol, not on antihypertensive or statin treatment, without histories of CVD, severe mental illness, cancer, or diabetes, and with 12.6% estimated 10-year CVD risk (QRISK3).
For UKB participants without CVD at entry, Supplementary Figure S7 presents model-predicted 10-year risks of major vascular event against QRISK3 10-year CVD risks.
Discussion
Summary
This study presents a new CVD microsimulation policy model that enables individualised lifetime predictions of disease risks, survival, and QoL. The model demonstrated good predictive accuracy across diverse patient categories of the UK population. The model quantified gaps at middle age of 4–5 years in life expectancy (corresponding to 5–8 QALYs) across quintiles of socioeconomic deprivation in the UK and demonstrated good potential of guideline-recommended statin treatment to reduce these gaps.
Strengths and limitations
The main strengths of this CVD model are in its use of rich contemporary IPD, including a larger set of characteristics and disease endpoints than other previous studies. First, the model has the advantage of reflecting contemporary CVD trends in the UK, being derived from a large current UK population cohort. Second, it includes a rich set of individual characteristics of high policy interest, including socioeconomic deprivation, physical activity, and diet quality. Third, the microsimulation framework can track individuals’ history and multiple interacting comorbidities.27 Fourth, the model includes incident diabetes and cancer as key competing disease risks to better reflect overall health and enable inclusion of a broader range of effects. Finally, the model can inform assessments of the net effects and cost-effectiveness of therapies.
The CVD model has some limitations. The UKB is a cohort of people healthier than the general UK population, with underrepresentation of those in more socioeconomically deprived categories.28 Notwithstanding this, the model projections for different individuals using their characteristics are likely generalisable to similar individuals in the general population. To enhance generalisability of the current findings, the results were standardised to the 2020 UK population by age, sex, and socioeconomic deprivation. Moreover, the oldest individuals during UKB follow-up were in their 80s and further research is needed to assess the model performance among older people.
Comparison with existing literature
The inequalities in health outcomes associated with socioeconomic deprivation at age 40–70 years reported in the present study are expectedly smaller than the previous estimates of 6–8 years estimated at birth,3 but they echo studies suggesting that socioeconomic deprivation remains an important health determinant.29–31 The current study also quantified and reported larger gradient in inequalities when QoL was considered in addition to individuals’ survival. Similar to recent studies,32–35 the authors note that the use of statin treatment was not worse among those in the more socioeconomically disadvantaged categories.
Implications for practice
The CVD microsimulation model could help inform strategies for CVD management, including assessments of their cost-effectiveness across UK population categories and the impact on health inequalities.
This study found that guideline-recommended statin treatment has good potential to reduce inequalities in health across socioeconomic status, although the reductions are larger for differences in life expectancy than for QALYs, underlining the need for multifaceted action to tackle health disparities. Strengthening statin use would lead to larger benefits and larger reductions in health inequalities.
Acknowledgments
The authors would like to thank the Project Oversight Group: Colin Baigent, Alison Gater, Borislava Mihaylova, Stephen Morris, Paul Roderick (Chair), Natalie Rowland, Peter Sever, and Liam Smeeth. The authors thank members of the public with whom the project and emerging results were discussed. This research has been conducted using data from the CTT Collaboration: https://www.cttcollaboration.org; UK Biobank resource under application number 56 757: www.ukbiobank.ac.uk; and the Whitehall II study: www.ucl.ac.uk/epidemiology-health-care/research/epidemiology-and-public-health/research/whitehall-ii. The authors thank all the participants, staff, and other contributors to these resources.
Funding
This study was funded by the UK National Institute for Health and Care Research (NIHR) Health Technology Assessment Programme (reference: 17/140/02). Further support from the British Heart Foundation, the UK Medical Research Council, the NIHR Barts Biomedical Research Centre (reference: NIHR203330), and National Health and Medical Research Council, Australia is acknowledged. The study was designed and analysed independently of all funders and the views expressed are those of the author(s) and not necessarily those of the NIHR, the Department of Health and Social Care, or any other funder.
Ethical approval
Ethics committee approval was not required for this secondary research study.
Data
Requests for individual patient data from trials contributing into the Cholesterol Treatment Trialists’ (CTT) Collaboration should be made directly to the data custodians of each trial (see CTT Collaboration data policy at https://www.cttcollaboration.org). Other data underlining this work may be obtained from third parties (UK Biobank: https://www.ukbiobank.ac.uk; and Whitehall II study: www.ucl.ac.uk/epidemiology-health-care/research/epidemiology-and-public-health/research/whitehall-ii) and are not publicly available. Researchers can apply to use the UK Biobank resource and Whitehall II study data. The R code of the CVD microsimulation model (License: MIT License) is available at http://www.herc.ox.ac.uk/downloads/supportingmaterial and from https://github.com/RunguoWu/UK_CVD_model.
Provenance
Freely submitted; externally peer reviewed.
Competing interests
Anthony Keech reports research support from Abbott, Amgen, ASPEN, Bayer, Mylan, Novartis, Sanofi, and Viatris; speaker fees from Novartis; and is a Data Safety Monitoring Board member for Kowa. John Robson reports funding from North East London Integrated Care Service. Jane Armitage reports receiving a grant to their research institution from Novartis for the ORION 4 trial of inclisiran. John Simes reports receiving grants for his institution from Amgen, Bayer, BMS, MSD, Pfizer, and Roche; consulting fees from FivepHusion; and is a chair (unpaid) of STAREE DSMB. Colin Baigent reports research grants from Boehringer Ingelheim and Health Data Research UK, and is a chair (unpaid) of a Data Safety Monitoring Board for Merck. All other authors have declared no competing interests.
Contributors
CTT Collaboration secretariat: Jane Armitage, Colin Baigent, Elizabeth Barnes, Lisa Blackwell, Rory Collins, Kelly Davies, Jonathan Emberson, Jordan Fulcher, Heather Halls, William G Herrington, Lisa Holland, Anthony Keech, Adrienne Kirby, Borislava Mihaylova, Rachel O’Connell, David Preiss, Christina Reith, John Simes, and Kate Wilson. CTT Collaboration trialists: A to Z trial (phase Z): Michael Blazing, Eugene Braunwald, James de Lemos, and Sabina Murphy; Terje R Pedersen, Marc Pfeffer, Harvey White, and Stephen Wiviott; AFCAPS/TEXCAPS (AirForce/Texas Coronary Atherosclerosis Prevention Study): Michael Clearfield, John R Downs, Antonio Gotto Jr, and Stephen Weis; ALERT (Assessment of Lescol in Renal Transplantation): Bengt Fellström, Hallvard Holdaas (deceased), Alan Jardine, and Terje R Pedersen; ALLHAT (Antihypertensive and Lipid-Lowering Treatment to Prevent Heart Attack Trial): David Gordon and Barry Davis; Curt Furberg, Richard Grimm, Sara Pressel, Jeffrey L Probstfield, Mahboob Rahman, and Lara Simpson; ALLIANCE (Aggressive Lipid-Lowering Initiation Abates New Cardiac Events): Michael Koren; ASCOT (Anglo-Scandinavian Cardiac Outcomes Trial): Björn Dahlöf, Ajay Gupta, Neil Poulter, Peter Sever, and Hans Wedel; ASPEN (Atorvastatin Study for the Prevention of Coronary Heart Disease Endpoints in Non-Insulin Dependent Diabetes Mellitus): Robert H Knopp (deceased); AURORA (A study to evaluate the Use of Rosuvastatin in subjects On Regular haemodialysis: an Assessment of survival and cardiovascular events): Stuart Cobbe, Bengt Fellström, Hallvard Holdaas (deceased), Alan Jardine, Roland Schmieder, and Faiez Zannad; CARDS (Collaborative Atorvastatin Diabetes Study): D John Betteridge (deceased), Helen M Colhoun, Paul N Durrington, John Fuller (deceased), Graham A Hitman, and Andrew Neil; CARE (Cholesterol And Recurrent Events Study): Eugene Braunwald, Barry Davis, C Morton Hawkins, Lemuel Moyé, Marc Pfeffer, and Frank Sacks; CORONA (Controlled Rosuvastatin Multinational Trial in Heart Failure): John Kjekshus, Hans Wedel and John Wikstrand; 4D (Die Deutsche Diabetes Dialyse Studie): Christoph Wanner and Vera Krane; GISSI (Gruppo Italiano per lo Studio della Sopravvivenza nell’Infarto miocardico) Heart Failure and Prevention trials: Maria Grazia Franzosi, Roberto Latini, Donata Lucci, Aldo Maggioni, Roberto Marchioli, Enrico B Nicolis, Luigi Tavazzi, and Gianni Tognoni; HOPE-3: Jackie Bosch, Eva Lonn, and Salim Yusuf; HPS (Heart Protection Study): Jane Armitage, Louise Bowman, Rory Collins, Anthony Keech, Martin Landray, Sarah Parish, Richard Peto, and Peter Sleight (deceased); IDEAL (Incremental Decrease in Endpoints through Aggressive Lipid-lowering): John JP Kastelein and Terje R Pedersen; JUPITER (Justification for the Use of Statins in Prevention: an Intervention Trial Evaluating Rosuvastatin): Robert Glynn, Antonio Gotto Jr, John JP Kastelein, Wolfgang Koenig, Jean MacFadyen, and Paul M Ridker; LIPID (Long-term Intervention with Pravastatin in Ischaemic Disease): Anthony Keech, Stephen MacMahon, Ian Marschner, Andrew Tonkin, John Shaw (deceased), John Simes, and Harvey White; LIPS (Lescol Intervention Prevention Study): Patrick W Serruys; Post-CABG (Post-Coronary Artery Bypass Graft Study): Genell Knatterud (deceased); PROSPER (Prospective Study of Pravastatin in the Elderly at Risk): Gerard J Blauw, Stuart Cobbe, Ian Ford, Peter Macfarlane, Chris Packard, Naveed Sattar, James Shepherd (deceased), and Stella Trompet; PROVE-IT (Pravastatin or Atorvastatin Evaluation and Infection Therapy): Eugene Braunwald, Christopher P Cannon, and Sabina Murphy; SEARCH (Study of Effectiveness of Additional Reductions in Cholesterol and Homocysteine): Rory Collins, Jane Armitage, Louise Bowman, Richard Bulbulia, Richard Haynes, Sarah Parish, Richard Peto, and Peter Sleight (deceased); SPARCL (Stroke Prevention by Aggressive Reduction in Cholesterol Levels): Pierre Amarenco and K Michael Welch; 4S (Scandinavian Simvastatin Survival Study): John Kjekshus, Terje R Pedersen, and Lars Wilhelmsen; TNT (Treating to New Targets): Philip Barter, Antonio Gotto Jr, John LaRosa, John JP Kastelein, and James Shepherd (deceased); WOSCOPS (West of Scotland Coronary Prevention Study): Stuart Cobbe, Ian Ford, Sharon Kean, Peter Macfarlane, Chris Packard, Michele Roberston, Naveed Sattar, James Shepherd (deceased), and Robin Young. Other CTT Collaboration members: Hiroyuki Arashi, Robert Clarke, Marcus Flather, Shinya Goto, Uri Goldbourt, Jemma Hopewell, G Kees Hovingh, George Kitas, Connie Newman, Marc S Sabatine, Gregory G Schwartz, Liam Smeeth, Jonathan Tobert, John Varigos, and Junichi Yamamguchi.
Discuss this article:
Contributor Information
Collaborators: CTT Collaboration secretariat, Jane Armitage, Colin Baigent, Elizabeth Barnes, Lisa Blackwell, Rory Collins, Kelly Davies, Jonathan Emberson, Jordan Fulcher, Heather Halls, William G Herrington, Lisa Holland, Anthony Keech, Adrienne Kirby, Borislava Mihaylova, Rachel O’Connell, David Preiss, Christina Reith, John Simes, Kate Wilson, CTT Collaboration trialists: A to Z trial (phase Z), Michael Blazing, Eugene Braunwald, James de Lemos, Sabina Murphy, Terje R Pedersen, Marc Pfeffer, Harvey White, Stephen Wiviott, AFCAPS/TEXCAPS (AirForce/Texas Coronary Atherosclerosis Prevention Study), Michael Clearfield, John R Downs, Antonio Gotto, Jr, Stephen Weis, ALERT (Assessment of Lescol in Renal Transplantation), Bengt Fellström, Hallvard Holdaas, Alan Jardine, Terje R Pedersen, ALLHAT (Antihypertensive and Lipid-Lowering Treatment to Prevent Heart Attack Trial), David Gordon, Barry Davis, Curt Furberg, Richard Grimm, Sara Pressel, Jeffrey L Probstfield, Mahboob Rahman, Lara Simpson, ALLIANCE (Aggressive Lipid-Lowering Initiation Abates New Cardiac Events), Michael Koren, ASCOT (Anglo-Scandinavian Cardiac Outcomes Trial), Björn Dahlöf, Ajay Gupta, Neil Poulter, Peter Sever, Hans Wedel, ASPEN (Atorvastatin Study for the Prevention of Coronary Heart Disease Endpoints in Non-Insulin Dependent Diabetes Mellitus), Robert H Knopp, AURORA (A study to evaluate the Use of Rosuvastatin in subjects On Regular haemodialysis: an Assessment of survival and cardiovascular events), Stuart Cobbe, Bengt Fellström, Hallvard Holdaas, Alan Jardine, Roland Schmieder, Faiez Zannad, CARDS (Collaborative Atorvastatin Diabetes Study), D John Betteridge, Helen M Colhoun, Paul N Durrington, John Fuller, Graham A Hitman, Andrew Neil, CARE (Cholesterol And Recurrent Events Study), Eugene Braunwald, Barry Davis, C Morton Hawkins, Lemuel Moyé, Marc Pfeffer, Frank Sacks, CORONA (Controlled Rosuvastatin Multinational Trial in Heart Failure), John Kjekshus, Hans Wedel, John Wikstrand, 4D (Die Deutsche Diabetes Dialyse Studie), Christoph Wanner, Vera Krane, GISSI (Gruppo Italiano per lo Studio della Sopravvivenza nell’Infarto miocardico) Heart Failure and Prevention trials, Maria Grazia Franzosi, Roberto Latini, Donata Lucci, Aldo Maggioni, Roberto Marchioli, Enrico B Nicolis, Luigi Tavazzi, Gianni Tognoni, HOPE-3, Jackie Bosch, Eva Lonn, Salim Yusuf, HPS (Heart Protection Study), Jane Armitage, Louise Bowman, Rory Collins, Anthony Keech, Martin Landray, Sarah Parish, Richard Peto, Peter Sleight, IDEAL (Incremental Decrease in Endpoints through Aggressive Lipid-lowering), John JP Kastelein, Terje R Pedersen, JUPITER (Justification for the Use of Statins in Prevention: an Intervention Trial Evaluating Rosuvastatin), Robert Glynn, Antonio Gotto, Jr, John JP Kastelein, Wolfgang Koenig, Jean MacFadyen, Paul M Ridker, LIPID (Long-term Intervention with Pravastatin in Ischaemic Disease), Anthony Keech, Stephen MacMahon, Ian Marschner, Andrew Tonkin, John Shaw, John Simes, Harvey White, LIPS (Lescol Intervention Prevention Study), Patrick W Serruys, Post-CABG (Post-Coronary Artery Bypass Graft Study), Genell Knatterud, PROSPER (Prospective Study of Pravastatin in the Elderly at Risk), Gerard J Blauw, Stuart Cobbe, Ian Ford, Peter Macfarlane, Chris Packard, Naveed Sattar, James Shepherd, Stella Trompet, PROVE-IT (Pravastatin or Atorvastatin Evaluation and Infection Therapy), Eugene Braunwald, Christopher P Cannon, Sabina Murphy, SEARCH (Study of Effectiveness of Additional Reductions in Cholesterol and Homocysteine), Rory Collins, Jane Armitage, Louise Bowman, Richard Bulbulia, Richard Haynes, Sarah Parish, Richard Peto, Peter Sleight, SPARCL (Stroke Prevention by Aggressive Reduction in Cholesterol Levels), Pierre Amarenco, K Michael Welch, 4S (Scandinavian Simvastatin Survival Study), John Kjekshus, Terje R Pedersen, Lars Wilhelmsen, TNT (Treating to New Targets), Philip Barter, Antonio Gotto, Jr, John LaRosa, John JP Kastelein, James Shepherd, WOSCOPS (West of Scotland Coronary Prevention Study), Stuart Cobbe, Ian Ford, Sharon Kean, Peter Macfarlane, Chris Packard, Michele Roberston, Naveed Sattar, James Shepherd, Robin Young, Other CTT Collaboration members, Hiroyuki Arashi, Robert Clarke, Marcus Flather, Shinya Goto, Uri Goldbourt, Jemma Hopewell, G Kees Hovingh, George Kitas, Connie Newman, Marc S Sabatine, Gregory G Schwartz, Liam Smeeth, Jonathan Tobert, John Varigos, and Junichi Yamamguchi
References
- 1.World Health Organization Cardiovascular diseases (CVDs) 2021. https://www.who.int/news-room/fact-sheets/detail/cardiovascular-diseases-(cvds) (accessed 29 Jan 2024).
- 2.Bhatnagar P, Wickramasinghe K, Wilkins E, et al. Trends in the epidemiology of cardiovascular disease in the UK. Heart. 2016;102(24):1945–1952. doi: 10.1136/heartjnl-2016-309573. [DOI] [PMC free article] [PubMed] [Google Scholar]
- 3.Marmot M, Allen J, Boyce T, et al. Health equity in England: the Marmot review 10 years on. 2020 doi: 10.1136/bmj.m693. https://www.health.org.uk/publications/reports/the-marmot-review-10-years-on (accessed 29 Jan 2024). [DOI] [PubMed] [Google Scholar]
- 4.Asaria P, Fortunato L, Fecht D, et al. Trends and inequalities in cardiovascular disease mortality across 7932 English electoral wards, 1982–2006: Bayesian spatial analysis. Int J Epidemiol. 2012;41(6):1737–1749. doi: 10.1093/ije/dys151. [DOI] [PMC free article] [PubMed] [Google Scholar]
- 5.Briggs A, Sculpher M, Claxton K. Decision modelling for health economic evaluation. Oxford: Oxford University Press; 2006. [Google Scholar]
- 6.Hippisley-Cox J, Coupland C, Brindle P. Development and validation of QRISK3 risk prediction algorithms to estimate future risk of cardiovascular disease: prospective cohort study. BMJ. 2017;357:j2099. doi: 10.1136/bmj.j2099. [DOI] [PMC free article] [PubMed] [Google Scholar]
- 7.SCORE2 working group and ESC Cardiovascular risk collaboration SCORE2 risk prediction algorithms: new models to estimate 10-year risk of cardiovascular disease in Europe. Eur Heart J. 2021;42(25):2439–2454. doi: 10.1093/eurheartj/ehab309. [DOI] [PMC free article] [PubMed] [Google Scholar]
- 8.National Institute for Health and Care Excellence Lipid modification: cardiovascular risk assessment and the modification of blood lipids for the primary and secondary prevention of cardiovascular disease. 2014 https://www.nice.org.uk/guidance/ng238/evidence/full-guideline-july-2014-pdf-13254225661 (accessed 6 Feb 2024). [PubMed] [Google Scholar]
- 9.Constanti M, Floyd CN, Glover M, et al. Cost-effectiveness of initiating pharmacological treatment in stage one hypertension based on 10-year cardiovascular disease risk: a Markov modeling study. Hypertension. 2021;77(2):682–691. doi: 10.1161/HYPERTENSIONAHA.120.14913. [DOI] [PMC free article] [PubMed] [Google Scholar]
- 10.Lewsey JD, Lawson KD, Ford I, et al. A cardiovascular disease policy model that predicts life expectancy taking into account socioeconomic deprivation. Heart. 2015;101(3):201–208. doi: 10.1136/heartjnl-2014-305637. [DOI] [PMC free article] [PubMed] [Google Scholar]
- 11.Asaria M, Walker S, Palmer S, et al. Using electronic health records to predict costs and outcomes in stable coronary artery disease. Heart. 2016;102(10):755–762. doi: 10.1136/heartjnl-2015-308850. [DOI] [PMC free article] [PubMed] [Google Scholar]
- 12.Kypridemos C, Guzman-Castillo M, Hyseni L, et al. Estimated reductions in cardiovascular and gastric cancer disease burden through salt policies in England: an IMPACTNCD microsimulation study. BMJ Open. 2017;7(1):e013791. doi: 10.1136/bmjopen-2016-013791. [DOI] [PMC free article] [PubMed] [Google Scholar]
- 13.Pandya A, Sy S, Cho S, et al. Cost-effectiveness of 10-year risk thresholds for initiation of statin therapy for primary prevention of cardiovascular disease. JAMA. 2015;314(2):142–150. doi: 10.1001/jama.2015.6822. [DOI] [PMC free article] [PubMed] [Google Scholar]
- 14.Heart Protection Study Collaborative Lifetime cost effectiveness of simvastatin in a range of risk groups and age groups derived from a randomised trial of 20 536 people. BMJ. 2006;333(7579):1145. doi: 10.1136/bmj.38993.731725.BE. [DOI] [PMC free article] [PubMed] [Google Scholar]
- 15.Nijhuis RL, Stijnen T, Peeters A, et al. Apparent and internal validity of a Monte Carlo–Markov model for cardiovascular disease in a cohort follow-up study. Med Decis Making. 2006;26(2):134–144. doi: 10.1177/0272989X05284103. [DOI] [PubMed] [Google Scholar]
- 16.Pennells L, Kaptoge S, Wood A, et al. Equalization of four cardiovascular risk algorithms after systematic recalibration: individual-participant meta-analysis of 86 prospective studies. Eur Heart J. 2019;40(7):621–631. doi: 10.1093/eurheartj/ehy653. [DOI] [PMC free article] [PubMed] [Google Scholar]
- 17.Wallisch C, Heinze G, Rinner C, et al. Re-estimation improved the performance of two Framingham cardiovascular risk equations and the pooled cohort equations: a nationwide registry analysis. Sci Rep. 2020;10(1):8140. doi: 10.1038/s41598-020-64629-6. [DOI] [PMC free article] [PubMed] [Google Scholar]
- 18.Downs J, Gotto A, Clearfield M, et al. Protocol for a prospective collaborative overview of all current and planned randomized trials of cholesterol treatment regimens. Am J Cardiol. 1995;75(16):1130–1134. doi: 10.1016/s0002-9149(99)80744-9. [DOI] [PubMed] [Google Scholar]
- 19.Sudlow C, Gallacher J, Allen N, et al. UK Biobank: an open access resource for identifying the causes of a wide range of complex diseases of middle and old age. PLoS Med. 2015;12(3):e1001779. doi: 10.1371/journal.pmed.1001779. [DOI] [PMC free article] [PubMed] [Google Scholar]
- 20.Gray AM, Clarke PM, Wolstenholme JL, Wordsworth S. Applied methods of cost-effectiveness analysis in health care. New York, NY: Oxford University Press; 2011. [Google Scholar]
- 21.Dolan P. Modeling valuations for EuroQol health states. Med Care. 1997;35(11):1095–1108. doi: 10.1097/00005650-199711000-00002. [DOI] [PubMed] [Google Scholar]
- 22.Hernandez Alava M, Pudney S, Wailoo A. Estimating the relationship between EQ-5D-5L and EQ-5D-3L: results from a UK population study. Pharmacoeconomics. 2023;41(2):199–207. doi: 10.1007/s40273-022-01218-7. [DOI] [PMC free article] [PubMed] [Google Scholar]
- 23.Butcher S, King T, Zalewski L. Apocrita — high performance computing cluster for Queen Mary University of London. London: Queen Mary University of London; 2017. [Google Scholar]
- 24.Wu M, Brazier JE, Kearns B, et al. Examining the impact of 11 long-standing health conditions on health-related quality of life using the EQ-5D in a general population sample. Eur J Health Econ. 2015;16(2):141–151. doi: 10.1007/s10198-013-0559-z. [DOI] [PMC free article] [PubMed] [Google Scholar]
- 25.Tsiplova K, Pullenayegum E, Cooke T, et al. EQ-5D-derived health utilities and minimally important differences for chronic health conditions: 2011 Commonwealth Fund Survey of Sicker Adults in Canada. Qual Life Res. 2016;25(12):3009–3016. doi: 10.1007/s11136-016-1336-0. [DOI] [PubMed] [Google Scholar]
- 26.Keng MJ, Leal J, Bowman L, et al. Decrements in health-related quality of life associated with adverse events in people with diabetes. Diabetes Obes Metab. 2022;24(3):530–538. doi: 10.1111/dom.14610. [DOI] [PMC free article] [PubMed] [Google Scholar]
- 27.Kuntz K, Sainfort F, Butler M, et al. Decision and simulation modeling in systematic reviews. Rockville, MD: Agency for Healthcare Research and Quality; 2013. [PubMed] [Google Scholar]
- 28.Fry A, Littlejohns TJ, Sudlow C, et al. Comparison of sociodemographic and health-related characteristics of UK Biobank participants with those of the general population. Am J Epidemiol. 2017;186(9):1026–1034. doi: 10.1093/aje/kwx246. [DOI] [PMC free article] [PubMed] [Google Scholar]
- 29.Singh GK. Area deprivation and widening inequalities in US mortality, 1969–1998. Am J Public Health. 2003;93(7):1137–1143. doi: 10.2105/ajph.93.7.1137. [DOI] [PMC free article] [PubMed] [Google Scholar]
- 30.Woods LM, Rachet B, Riga M, et al. Geographical variation in life expectancy at birth in England and Wales is largely explained by deprivation. J Epidemiol Community Health. 2005;59(2):115–120. doi: 10.1136/jech.2003.013003. [DOI] [PMC free article] [PubMed] [Google Scholar]
- 31.Seaman R, Riffe T, Leyland AH, et al. The increasing lifespan variation gradient by area-level deprivation: a decomposition analysis of Scotland 1981–2011. Soc Sci Med. 2019;230:147–157. doi: 10.1016/j.socscimed.2019.04.008. [DOI] [PMC free article] [PubMed] [Google Scholar]
- 32.Thalmann I, Preiss D, Schlackow I, et al. Population-wide cohort study of statin use for the secondary cardiovascular disease prevention in Scotland in 2009–2017. Heart. 2023;109(5):388–395. doi: 10.1136/heartjnl-2022-321452. [DOI] [PMC free article] [PubMed] [Google Scholar]
- 33.Wu R, Rison SCG, Raisi-Estabragh Z, et al. Gaps in antihypertensive and statin treatments and benefits of optimisation: a modelling study in a 1 million ethnically diverse urban population in UK. BMJ Open. 2021;11(12):e052884. doi: 10.1136/bmjopen-2021-052884. [DOI] [PMC free article] [PubMed] [Google Scholar]
- 34.Jones N, Fischbacher C, Guthrie B, et al. Factors associated with statin treatment for the primary prevention of cardiovascular disease in people within 2 years following diagnosis of diabetes in Scotland, 2006–2008. Diabet Med. 2014;31(6):640–646. doi: 10.1111/dme.12409. [DOI] [PMC free article] [PubMed] [Google Scholar]
- 35.Boruzs K, Juhász A, Nagy C, et al. Relationship between statin utilization and socioeconomic deprivation in Hungary. Front Pharmacol. 2016;7:66. doi: 10.3389/fphar.2016.00066. [DOI] [PMC free article] [PubMed] [Google Scholar]