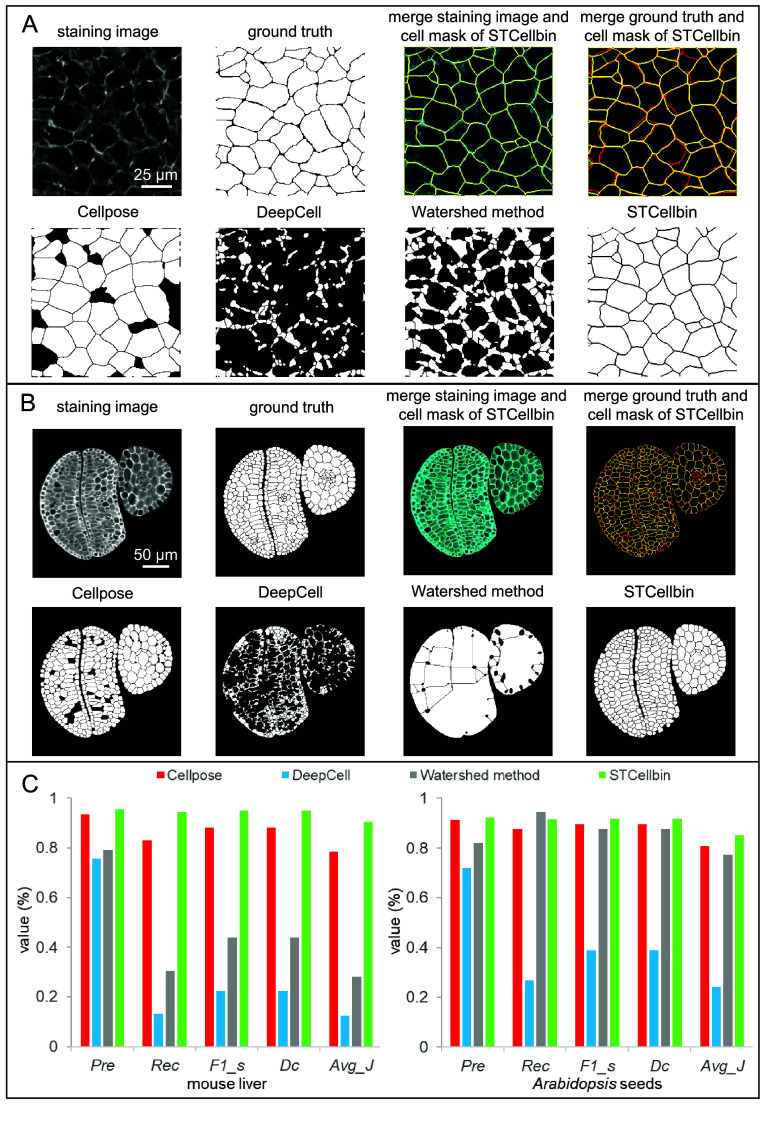
Figure 3.
Comparison of cell segmentation performance. (A) Cell segmentation results on the cropped area from the mouse liver dataset. In the merged images, cell masks are in yellow, staining images are in cyan, and ground truths are in red. (B) Cell segmentation results on the cropped area from the Arabidopsis seed dataset. In the merged images, cell masks are in yellow, staining images are in cyan, and ground truths are in red. (C) Indicator comparison of cell segmentation results on the cropped areas from the mouse liver and Arabidopsis seed datasets.

