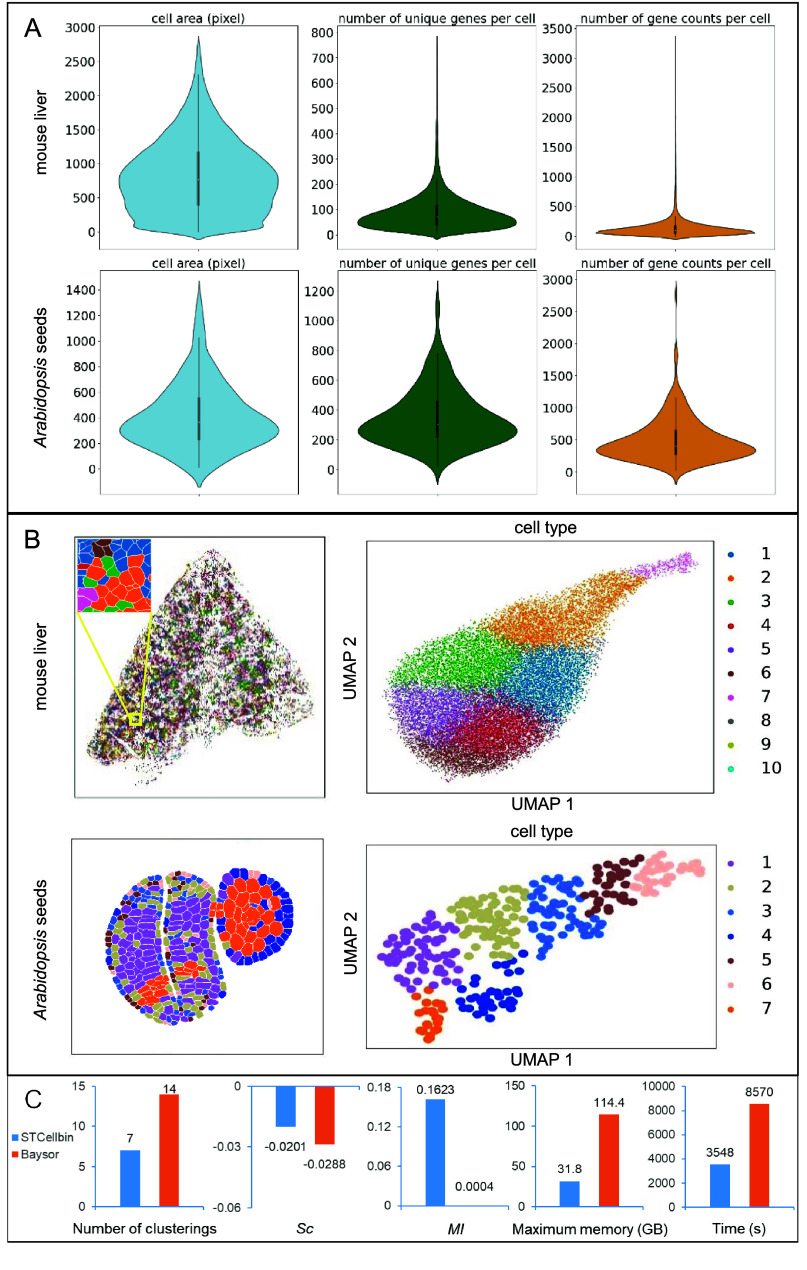
Figure 4.
Downstream analysis results and comparison. (A) Statistical results of cell area, gene number per cell, and gene expression per cell of STCellbin on the mouse liver dataset and cropped area from the Arabidopsis seed dataset. (B) Clustering results and UMAPs of STCellbin on the mouse liver dataset and cropped area from the Arabidopsis seed dataset. (C) Indicator comparison of downstream analysis results on the cropped area from the Arabidopsis seed dataset, where Sc and MI are averaged across all clusters.

