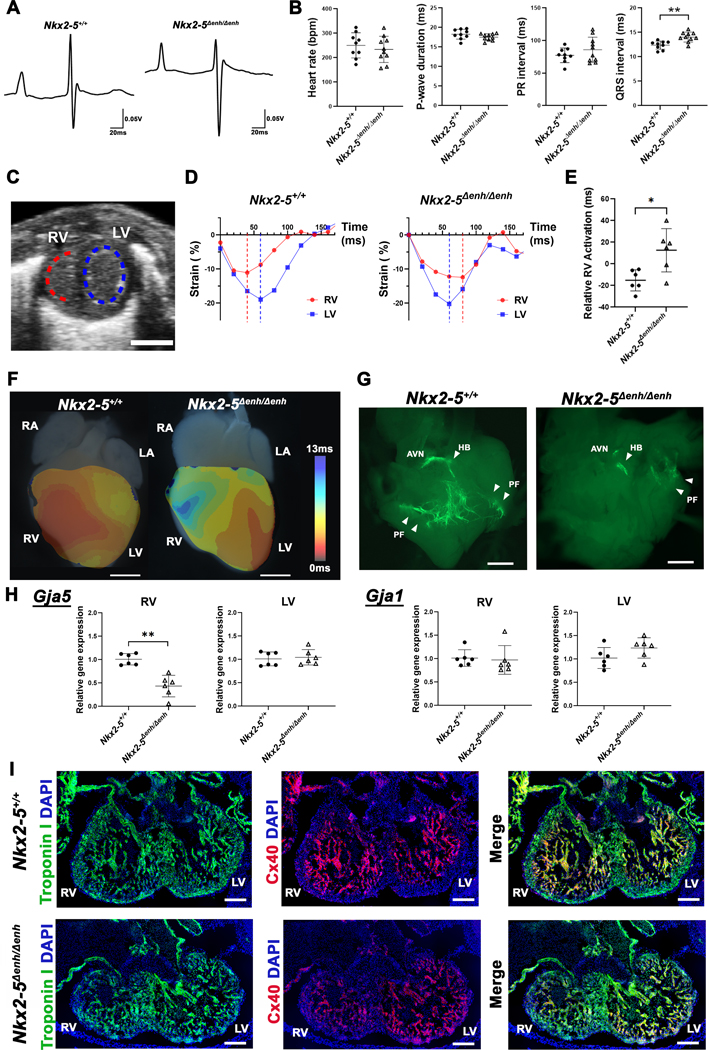
Figure 4. Physiological assessment of Nkx2–5∆enh/∆enh vs wildtype mice.
(A) Representative surface electrocardiogram traces in Nkx2–5∆enh/∆enh and wildtype littermates at birth (P1). (B) Comparisons of heart rate, P-wave duration, PR interval, and QRS interval between Nkx2–5∆enh/∆enh and wildtype mice. QRS interval is significantly prolonged in Nkx2–5∆enh/∆enh mice. **p < 0.01 by Student’s t-test. n = 9−10 per group. Data are presented as mean ± SD. (C) Representative B-mode snapshot of both ventricles in short-axis view. Endocardial segments used for circumferential strain are shown with dotted lines in red for the right ventricle (RV) and in blue for the left ventricle (LV). (D) Representative strain tracings of both ventricles in Nkx2–5∆enh/∆enh and wildtype mice with dotted vertical line representing peak systolic contraction. Nkx2–5∆enh/∆enh showed delayed relative RV activation with respect to LV. (E) Relative RV activation showing variability and delays in Nkx2–5∆enh/∆enh mice. *p < 0.05 by Student’s t-test. n = 6 per group. Data are presented as mean ± SD. (F) Representative activation maps of wildtype (left) and Nkx2–5∆enh/∆enh (right) hearts acquired by optical mapping at P1. Electrical activation of RV is delayed in Nkx2–5∆enh/∆enh compared to wildtype. RA, right atrium; RV, right ventricle; LA, left atrium; LV, left ventricle. Scale bars: 1 mm. (G) Representative whole-mount fluorescence images of the dissected RV at P1 to visualize Purkinje cells expressing Contactin2-eGFP. Nkx2–5∆enh/∆enh hearts show variable degrees of Purkinje fiber network hypoplasia, with a spectrum ranging from absent to near normal levels in the RV. n = 3 for wildtype and n = 8 for Nkx2–5∆enh/∆enh were examined. Scale bars: 2 mm. AVN, atrioventricular node; HB, His bundle; PF, Purkinje Fibers. (H) qPCR for Gja5 (encoding Cx40) and Gja1 (encoding Cx43) in the RV and LV at embryonic day E12.5. Gja5 expression was significantly reduced in the RV but not Gja1. **p < 0.01 by Student’s t-test. Expression of Gja5 in LV and Gja1 in RV were compared by Mann-Whitney U test. n = 6 per group. Data are presented as mean ± SD. (I) Immunofluorescence staining for troponin I (green) and Cx40 (red) in embryonic hearts at E12.5. Nkx2–5∆enh/∆enh hearts show less Cx40 expression in the trabecular myocardium in the RV compared to wildtype. n = 3 per group were examined. Scale bars: 200 µm.

