

Abstract

The COVID-19 infection has been more problematic for individuals with certain health predispositions. Coronaviruses could also interfere with neural diseases if the viruses succeed in entering the brain. Therefore, it might be of principal interest to examine a possible coupling of coronaviruses and amyloid fibrils. Here, molecular dynamics simulations were used to investigate direct coupling of SARS-CoV-2 and Aβ fibrils, which play a central role in neural diseases. The simulations revealed several stable binding configurations and their dynamics of Aβ42 fibrils attached to spike proteins of the Omicron and Alpha variants of SARS-CoV-2.
Introduction
The novel coronavirus SARS-CoV-2 can infect human cells by coupling the receptor binding domains (RBDs) of its spike proteins to ACE2 proteins, which are present on respiratory, cardiovascular, and other cell membranes.1,2 In principle, this strong binding of RBD could be blocked by peptides extracted from ACE2.3,4 In the later Omicron version of SARS-CoV-2, the RBD became more positively charged.5 This provided better binding to heparan sulfate molecules, present on cell membranes, which are active in the initial (attachment) phase of the virus binding.6
In principle, the “sticky” SARS-CoV-2 spike receptors could bind to many other proteins and cellular structures. One of the authors (T.P.) even proposed that SARS-CoV-2 could interfere with neurodegenerative diseases upon realizing that his communication abilities, compromised by Parkinson’s disease (PD), were temporarily improved after the SARS-CoV-2 infection. A similar repair (regeneration) and rejuvenation of the liver were observed in animal models7,8 upon infection by the bacteria (Mycobacterium leprae and M. lepromatosis) causing Hansen’s disease (leprosy).9 In principle, coronaviruses might enter the brain by alternative pathways,10 providing a route for a possible connection between SARS-CoV-2 and neurodegenerative diseases. These possibilities are supported by various observations, for example, showing that the number of amyloids has decreased in PD patients affected by COVID-19.11 Recent studies have shown that SARS-CoV-2 can bind to αsynuclein (αSyn) amyloids12 and affect their aggregation.13,14 SARS-CoV-2 and other viruses can also directly provide peptides derived from their proteins that can self-assemble in brain tissues.15
Given all these observations, we intend to model by molecular dynamics (MD) simulations a direct binding of the spike proteins of SARS-CoV-2 with Aβ amyloids,16,17 which might be related to communication problems.18 We will search for configurations of Aβ42 amyloid fibrils that can bind in a stable way to the spike receptors of Alpha and Omicron variants of SARS-CoV-2, which were globally dominant at different stages of the infection.
Results and Discussion
In the preparation of the simulations, we took from the Protein Data Bank the PDB 6M17 and PDB 7WVN structures of the spike proteins in the Alpha and Omicron SARS-CoV-2 variants, respectively, as well as the PDB 2MXU structure of Aβ42. In the simulations, 12-sheet-long Aβ amyloids (5 nm long) were placed at a contact distance from the Alpha and Omicron RBDs, as shown in Figure 1. Initially, the amyloid Aβ42 fibrils were kept in two different orientations, where nonpolar (A) LEU34, MET35 and acidic (B) residues GLU22, ASP23 were placed in contact RBD. Then, the whole system was solvated in a physiological concentration of 0.15 mM NaCl and neutralized by additional ions. Additional binding configurations were obtained by considering different longitudinal orientations of the fibrils placed on two major binding sites found on RBDs, as discussed later. The systems were simulated with NAMD319 and the CHARMM force field.20 First, the systems were minimized for 2 ns and simulated for 2 ns while being fixed to accommodate the ions. Then, 200 ns simulations were run without constraints, except for three residues of the proteins (Methods).
Figure 1.
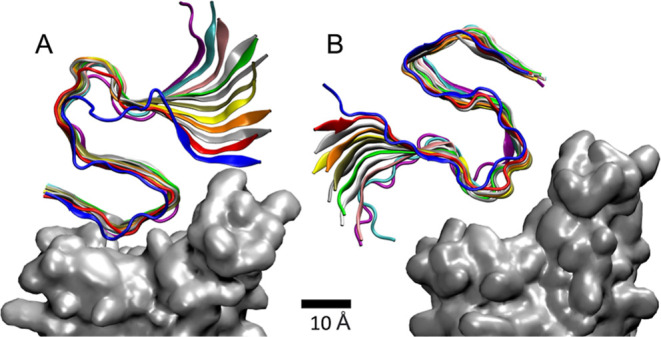
MD simulations of (A) nonpolar and (B) acidic sides (residues) of the Aβ42 (12-mer) fibril coupled to RBD in the spike of SARS-CoV-2 (Omicron). In a more detailed analysis, (A,B) correspond to configurations in Figure 4B,D, respectively.
Figure 2A,B shows typical simulation snapshots of the nonpolar side of the Aβ42 fibril attached to the Omicron and Alpha RBDs of SARS-CoV-2, respectively. This fibril side is dominated by the less polar LEU34, MET35, and VAL40 residues and two polar GLY37 and GLY38 residues. When this fibril side is attached to Omicron RBD, the hydrophobic coupling is mostly provided by the PHE483, PHE453, and LEU452 (RBD) residues, while a relatively stable hydrogen bond is formed between the TYR498 (RBD) and GLY37 (fibril) residues. When this fibril side is attached to Alpha RBD, the hydrophobic coupling is provided by the LEU455, PHE456, PHE486, and PHE490 (RBD) residues, while hydrogen bonds are formed between the THY449 (RBD) and GLY37 (fibril) residues. Figure 2C also shows a typical snapshot of the acidic side of the Aβ42 fibril attached to the Omicron RBD, but this fibril side does not bind in a stable way to the Alpha RBD. This fibril side is dominated by the negatively charged GLU23 and ASP22 residues, forming hydrogen bonds with the ARG490 and ARG495 (RBD) residues, and nonpolar ALA202 and VAL199 residues, mostly binding to the PHE453 and PHE483 (RBD) residues.
Figure 2.
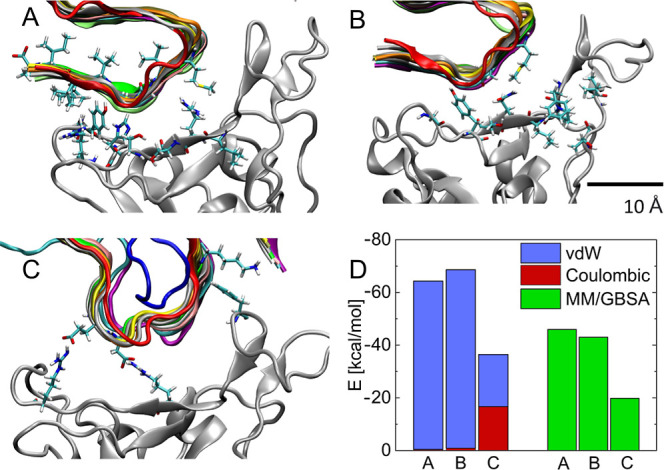
Details of coupling between the nonpolar side of the Aβ fibril and (A) Omicron and (B) Alpha RBDs. (C) Charged side of the Aβ fibril coupled with the Omicron RBD. (D) Average coupling energies and MM/GBSA free energies calculated for the above cases. The direct coupling energies are split into Coulombic and vdW contributions. Here, (A,B,C) correspond to the configurations in Figure 4B (Omicron), 4B (Alpha), and 4D (Omicron), respectively.
In the above three stable cases, the fibril is sliding on RBDs without losing its structure, as demonstrated in Figure 3A,B, where the distances between the middle residue of RBD (ARG490 in Omicron and GLN493 in Alpha) and one end of the fibril are shown as a function of time.21 The charged side of the fibril slides more and eventually fully departs from the Alpha RBD. To examine this sliding, we have calculated the 1D diffusion constant D for the amyloid sliding on the RBD (Methods). Figure 3E and F show the time-dependent mean squared displacement, MSD(τ), and diffusion constant, D(τ), calculated in these three cases, respectively; the actual D was averaged over the last 20 ns of the simulations. When the nonpolar side of the fibril slides on the Omicron and Alpha RBDs, D ≈ 10.23 Å2/ps and 4.77 Å2/ps, respectively. However, when the charged side of the fibril slides on the Omicron RBD, D ≈ 20.65 Å2/ps.
Figure 3.
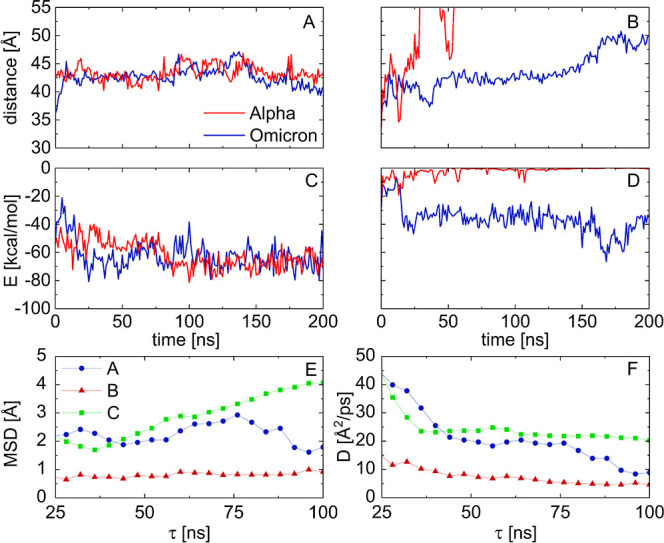
Distances traveled in 200 ns by fibrils with (A) nonpolar and (B) acidic orientations coupled to the Alpha and Omicron RBDs. (C,D,) Binding energies calculated for these cases. The acidic orientation of the fibril departs from the Alpha RBD. (E) Time-dependent MSD calculated for the three stable cases from Figure 2A,B,C. (F) Time-dependent diffusion constants calculated for these three cases.
Figure 3C,D provides the time-dependent binding energies between the nonpolar and charged sides of the fibril, respectively, and the Alpha and Omega RBDs of SARS-CoV-2, calculated in 200 ns long trajectories. These direct energies are calculated by the NAMD energy plugin (dielectric constant of water) with a cutoff of 3 Å. The obtained energies reveal that the nonpolar side of the fibril has a stronger binding to RBDs than its charged side. When these energies are averaged over the last 100 ns (Figure 2D), one can find that cases with smaller binding energies have larger diffusion constants (Figure 3F). The average energies are also split into van der Waals (vdW) and electrostatic contributions. When the nonpolar side of the fibril is coupled to the RBD of either SARS-CoV-2 variant, the vdW contributions [Lennard-Jones (LJ) potential] are dominant. However, when the charged side of the fibril is coupled to the Omicron RBD (Figure 3C), the energy contributions are comparable. Figure 2D also presents the binding free energies, ΔGMMGB–SA, of the Aβ fibril and RBDs, calculated by the MM/GBSA method (Methods). The obtained free energies are qualitatively the same as the direct energies but about 20–30% smaller.
In Figure 4, we summarize the observed (meta)stable configurations of the Aβ42 fibril adsorbed on the RBDs of SARS-CoV-2. Within 10–20 ns, the fibrils become stabilized in these configurations in four different orientations within two RBD regions, giving in total of eight configurations, as shown in Figure 4 (B–I). The average binding energies in these configurations are also presented in Figure 4. Figures S1–4 reveal the energy contributions by the residues. Within the next 200 ns, we observe sliding of the fibrils in these configurations. Overall, the nonpolar part of the fibril binds better. However, the fibril binds better on the Omicron RBD in one of the two longitudinal orientations and on the Alpha RBD in the other longitudinal configuration. These data reveal that both fibril and RBD surfaces are complex and capable of good fitting in very specific configurations. Although the Omicron RBD is more charged than the Alpha RBD, the amyloid binds better in the nonpolar orientation. Therefore, the binding is primarily provided by the vdW interactions, as implicated by Figure 2D.
Figure 4.

Possible stable configurations of the Aβ42 fibril on RBDs. (A) Side and top views of the RBD (Omicron) with visualized blue and red regions where the fibril (dashed) binds. The two ends of the fibril are labeled 1 and 2. (B–E) Configurations of the fibril in the two nesting areas, where the 1 end of the fibril is at the top and the views from this end along the fibril are shown. (F–I) Same when the 2 end of the fibril is at the top. The fibril-RBD binding energies in these configurations are also provided. In brackets, we report the standard deviation in kcal/mol. Figures S1–4 show contributions to these coupling energies by residues.
In summary, we have used classical MD simulations to show that Aβ42 amyloid fibrils can bind to the RBDs of the spike proteins in SARS-CoV-2 (Alpha and Omicron). We have identified eight binding configurations of the amyloid fibrils, where the interactions are largely based on a nonspecific vdW coupling. In stable binding configurations, the fibrils can diffusively slide on the RBD surfaces. In principle, SARS-CoV-2 could interfere with neural disorders if it succeeds in entering the brain tissue. The fact that Aβ amyloid fibrils could bind to spike receptors and slide on their surfaces could also promote the development of fibrillar antivirals and lead to other applications.
Methods
The systems were simulated by NAMD19 and the CHARMM36 protein force field.20 The cut-offs of vdW and Coulombic interactions were 10 Å, and the long-range Coulombic interactions were calculated by the PME method (periodic boundary conditions).22 The simulations were performed in the NpT ensemble (p = 1 bar and T = 310 K), using the Langevin dynamics with a damping constant of 1 ps–1 and a time step of 2 fs. After 2 ns of minimization, the systems were simulated for 200 ns without constraints, except for the three residues at the bottom of the spike protein. For each variant of SARS-CoV-2, we have simulated eight different trajectories within locally stable binding configurations. The hydrogen bonds were evaluated with the HBonds Plugin in VMD and the default setup (cutoff distance of 3 Å, cutoff angle of 20°).27
Binding Energies
When calculating the binding energies, we choose a 12 Å cutoff distance between the RBD and amyloid residues. The electrostatic and vdW energy contributions were calculated by the NAMD energy plugin. The electrostatic contribution is given by
| 1 |
where  is a distance between the charges, qi and qj, and ε = ε0 εr, where ε0 is a vacuum permitivity and εr = 78.4 is
a dielectric constant of water. To increase the
efficiency of the simulations, pairwise interaction calculations were
not performed beyond a cutoff distance.
is a distance between the charges, qi and qj, and ε = ε0 εr, where ε0 is a vacuum permitivity and εr = 78.4 is
a dielectric constant of water. To increase the
efficiency of the simulations, pairwise interaction calculations were
not performed beyond a cutoff distance.
The LJ 6–12 potential energies can describe vdW long-range attraction and close-distance atomic repulsion
 |
2 |
where εij is the maximum stabilization energy for
the i-th
and the j-th atoms, σij is the distance between the i-th and j-th atoms at the minimum of the potential, and rij is the actual distance between
the two atoms. The LJ parameters between different atom types were
calculated from σij = (σii + σjj)/2 and  (Lorentz–Berthelot rules).
Molecular Mechanics with Generalized Born and Surface Area Free Energies
Molecular mechanics with generalized Born and surface area solvation (MMGB-SA) calculations have also been performed. The MM/GBSA method23−26 was used to calculate the binding free energies between the amyloids and the RBD. The free energy was obtained from separate MMGB-SA calculations into three parts (amyloids, RBD, and the whole complex) by extracting them from the explicit solvent MD simulation. The MMGB-SA free energies were calculated as
| 3 |
where EMM, Gsolv–p, Gsolv–np, and TΔSconf are the sum of bonded and LJ energy terms, the polar contribution to the solvation energy, the nonpolar contribution, and the conformational entropy, respectively. NAMD3 was used to calculate the first three terms of eq 3 for the dielectric constant of water, ε = 78.4. The Gsolv–np term for each system configuration was calculated as a linear function of the solvent-accessible surface area, determined using a probe radius of 1.4 Å, as Gsolv–np = γ SASA, where γ = 0.00542 kcal mol–1 Å–2 is the surface tension. The approximate binding free energies of the studied complexes were calculated as26
| 4 |
The obtained energy contributions are reported in Figure S5.
Diffusion Constants
The MSD and time-dependent diffusion constant D(τ) were calculated with a VMD plugin27 with default values. The MSD of the fibril on the RBDs in the three stable cases was calculated over the entire trajectory with a step of 100 frames from
| 5 |
where τ is the lag time and r(τ) is the position of a selected atom in the fibril moving in 1D along the RBD. The MSD was computed at lag time r(τ) from 25 to 100 ns. The D(τ) was calculated with the same frames from MSD using the expression
| 6 |
where E = 1 is the dimensionality of the present system (linear movement along the x axis).27 The actual diffusion constant D is obtained by averaging D(τ) over the last 20 ns of the simulation trajectories.
Acknowledgments
P.K. acknowledges support from NSF DMR 2212123.
Supporting Information Available
The Supporting Information is available free of charge at https://pubs.acs.org/doi/10.1021/acsomega.3c08481.
Coupling energies by the residues and energy contributions in the MMGB-SA calculations (PDF)
The authors declare no competing financial interest.
Supplementary Material
References
- Scialo F.; Daniele A.; Amato F.; Pastore L.; Matera M. G.; Cazzola M.; Castaldo G.; Bianco A. ACE2: The Major Cell Entry Receptor for SARS-CoV-2. Lung 2020, 198, 867–877. 10.1007/s00408-020-00408-4. [DOI] [PMC free article] [PubMed] [Google Scholar]
- Jackson C. B.; Farzan M.; Chen B.; Choe H. Mechanisms of SARS-CoV-2 entry into cells. Nat. Rev. Mol. Cell Biol. 2022, 23, 3–20. 10.1038/s41580-021-00418-x. [DOI] [PMC free article] [PubMed] [Google Scholar]
- Han Y.; Král P. Computational Design of ACE2-Based Peptide Inhibitors of SARS-CoV-2. Acs. Nano 2020, 14, 5143–5147. 10.1021/acsnano.0c02857. [DOI] [PMC free article] [PubMed] [Google Scholar]
- Chaturvedi P.; Han Y.; Král P.; Vuković L. Adaptive Evolution of Peptide Inhibitors for Mutating SARS-CoV-2. Adv. Theory Simul 2020, 3, 2000156. 10.1002/adts.202000156. [DOI] [PMC free article] [PubMed] [Google Scholar]
- Pawlowski P. H. Additional Positive Electric Residues in the Crucial Spike Glycoprotein S Regions of the New SARS-CoV-2 Variants. Infect. Drug Resist. 2021, 14, 5099–5105. 10.2147/IDR.S342068. [DOI] [PMC free article] [PubMed] [Google Scholar]
- Kearns F. L.; Sandoval D. R.; Casalino L.; Clausen T. M.; Rosenfeld M. A.; Spliid C. B.; Amaro R. E.; Esko J. D. Spike-heparan sulfate interactions in SARS-CoV-2 infection. Curr. Opin. Struct. Biol. 2022, 76, 102439. 10.1016/j.sbi.2022.102439. [DOI] [PMC free article] [PubMed] [Google Scholar]
- Deps P.; Collin S. M. Mycobacterium lepromatosis as a Second Agent of Hansen’s Disease. Front. Microbiol. 2021, 12, 698588. 10.3389/fmicb.2021.698588. [DOI] [PMC free article] [PubMed] [Google Scholar]
- Hess S.; Kendall T. J.; Pena M.; Yamane K.; Soong D.; Adams L.; Truman R.; Rambukkana A. In vivo partial reprogramming by bacteria promotes adult liver organ growth without fibrosis and tumorigenesis. Cell Rep. Med. 2022, 3, 100820. 10.1016/j.xcrm.2022.100820. [DOI] [PMC free article] [PubMed] [Google Scholar]
- Hess S.; Pena M.; Kendal T. J.; et al. In vivo partial reprogramming by bacteria promotes adult livre organ growth without fibrosis and tumorigenesis. Cell Rep. Med. 2022, 11, 100820. [DOI] [PMC free article] [PubMed] [Google Scholar]
- Butowt R.; von Bartheld C. S. The route of SARS-CoV-2 to brain: have we been barking up the wrong tree?. Mol. Neurodegener. 2022, 17, 20. 10.1186/s13024-022-00529-9. [DOI] [PMC free article] [PubMed] [Google Scholar]
- Ziff O. J.; Ashton N. J.; Mehta P. R.; Brown R.; Athauda D.; Heaney J.; Heslegrave A. J.; Benedet A. L.; Blennow K.; Checkley A. M.; Houlihan C. F.; Gauthier S.; Rosa-Neto P.; Fox N. C.; Schott J. M.; Zetterberg H.; Benjamin L. A.; Paterson R. W. Amyloid processing in COVID-19-associated neurological syndromes. J. Neurochem. 2022, 161, 146–157. 10.1111/jnc.15585. [DOI] [PMC free article] [PubMed] [Google Scholar]
- Jana A. K.; Lander C. W.; Chesney A. D.; Hansmann U. H. E. Effect of an Amyloidogenic SARS-COV-2 Protein Fragment on a-Synuclein Monomers and Fibrils. J. Phys. Chem. B 2022, 126, 3648–3658. 10.1021/acs.jpcb.2c01254. [DOI] [PMC free article] [PubMed] [Google Scholar]
- Jana A. K.; Greenwood A. B.; Hansmann U. H. E. Presence of a SARS-CoV-2 Protein Enhances Amyloid Formation of Serum Amyloid A. J. Phys. Chem. B 2021, 125, 9155–9167. 10.1021/acs.jpcb.1c04871. [DOI] [PMC free article] [PubMed] [Google Scholar]
- Mesias V. S. D.; Zhu H.; Tang X.; Dai X.; Liu W.; Guo Y.; Huang J. Moderate Binding between Two SARS-CoV-2 Protein Segments and a-Synuclein Alters Its Toxic Oligomerization Propensity Differently. J. Phys. Chem. Lett. 2022, 13, 10642–10648. 10.1021/acs.jpclett.2c02278. [DOI] [PMC free article] [PubMed] [Google Scholar]
- Charnley M.; Islam S.; Bindra G. K.; Engwirda J.; Ratcliffe J.; Zhou J.; Mezzenga R.; Hulett M. D.; Han K.; Berryman J. T.; Reynolds N. P. Neurotoxic amyloidogenic peptides in the proteome of SARS-COV2: potential implications for neurological symptoms in COVID-19. Nat. Commun. 2022, 13, 3387. 10.1038/s41467-022-30932-1. [DOI] [PMC free article] [PubMed] [Google Scholar]
- Mihaescu A. S.; Valli M.; Uribe C.; Diez-Cirarda M.; Masellis M.; Graff-Guerrero A.; Strafella A. P. Beta amyloid deposition and cognitive decline in Parkinson’s disease: a study of the PPMI cohort. Mol. Brain 2022, 15, 79. 10.1186/s13041-022-00964-1. [DOI] [PMC free article] [PubMed] [Google Scholar]
- Price D. L. New perspectives on Alzheimer’s disease. Annu. Rev. Neurosci. 1986, 9, 489–512. 10.1146/annurev.ne.09.030186.002421. [DOI] [PubMed] [Google Scholar]
- Mueller K. D.; Van Hulle C. A.; Koscik R. L.; Jonaitis E.; Peters C. C.; Betthauser T. J.; Christian B.; Chin N.; Hermann B. P.; Johnson S. Amyloid beta associations with connected speech in cognitively unimpaired adults. Alzheimers Dement. (Amst) 2021, 13, e12203 10.1002/dad2.12203. [DOI] [PMC free article] [PubMed] [Google Scholar]
- Phillips J. C.; Braun R.; Wang W.; Gumbart J.; Tajkhorshid E.; Villa E.; Chipot C.; Skeel R. D.; Kalé L.; Schulten K. Scalable Molecular Dynamics with NAMD. J. Comput. Chem. 2005, 26, 1781–1802. 10.1002/jcc.20289. [DOI] [PMC free article] [PubMed] [Google Scholar]
- MacKerell A. D.; Bashford D.; Bellott M.; Dunbrack R. L.; Evanseck J. D.; Field M. J.; Fischer S.; Gao J.; Guo H.; Ha S.; et al. All-Atom Empirical Potential for Molecular Modeling and Dynamics Studies of Proteins. J. Phys. Chem. B 1998, 102, 3586–3616. 10.1021/jp973084f. [DOI] [PubMed] [Google Scholar]
- Zheng L.; Zhao H.; Han Y.; Qian H.; Vukovic L.; Mecinović J.; Král P.; Huck W. T. S. Catalytic transport of molecular cargo using diffusive binding along a polymer track. Nat. Chem. 2019, 11, 359–366. 10.1038/s41557-018-0204-7. [DOI] [PubMed] [Google Scholar]
- Darden T.; York D.; Pedersen L. Particle Mesh Ewald: An N.log(N) Method for Ewald Sums in Large Systems. J. Chem. Phys. 1993, 98, 10089–10092. 10.1063/1.464397. [DOI] [Google Scholar]
- Ylilauri M.; Pentikäinen O. T. MMGBSA as a tool to understand the binding affinities of filamin-peptide interactions. J. Chem. Inf. Model. 2013, 53, 2626–2633. 10.1021/ci4002475. [DOI] [PubMed] [Google Scholar]
- Rico M. I.; Lebedenko C. G.; Mitchell S. M.; Banerjee I. A. Molecular dynamics simulations, docking and MMGBSA studies of newly designed peptide-conjugated glucosyloxy stilbene derivatives with tumor cell receptors. Mol. Divers. 2022, 26, 2717–2743. 10.1007/s11030-021-10354-9. [DOI] [PubMed] [Google Scholar]
- Jupudi S.; Rajagopal K.; Murugesan S.; Kumar B. K.; Raman K.; Byran G.; Chennaiah J.; Muthiah V. P.; Dasan P B.; Sankaran S. Identification of Papain-Like Protease inhibitors of SARS CoV-2 through HTVS, Molecular docking, MMGBSA and Molecular dynamics approach. S. Afr. J. Bot. 2022, 151, 82–91. 10.1016/j.sajb.2021.11.033. [DOI] [PMC free article] [PubMed] [Google Scholar]
- Guimarães C. R. W.; Mathiowetz A. M. Addressing Limitations with the MM-GB/SA Scoring Procedure using the WaterMap Method and Free Energy Perturbation Calculations. J. Chem. Inf. Model. 2010, 50, 547–559. 10.1021/ci900497d. [DOI] [PubMed] [Google Scholar]
- Giorgino T. Computing diffusion coefficients in macromolecular simulations: the Diffusion Coefficient Tool for VMD. J. Open Source Softw. 2019, 4 (41), 1698. 10.21105/joss.01698. [DOI] [Google Scholar]
Associated Data
This section collects any data citations, data availability statements, or supplementary materials included in this article.