

Abstract
Background
Ascertainment of heart failure (HF) hospitalizations in cardiovascular trials is costly and complex, involving processes that could be streamlined by using routinely collected healthcare data (RCD). The utility of coded RCD for HF outcome ascertainment in randomized trials requires assessment. We systematically reviewed studies assessing RCD-based HF outcome ascertainment against “gold standard” (GS) methods to study the feasibility of using such methods in clinical trials.
Methods
Studies assessing International Classification of Disease (ICD) coded RCD-based HF outcome ascertainment against GS methods and reporting at least one agreement statistic were identified by searching MEDLINE and Embase from inception to May 2021. Data on study characteristics, details of RCD and GS data sources and definitions, and test statistics were reviewed. Summary sensitivities and specificities for studies ascertaining acute and prevalent HF were estimated using a bivariate random effects meta-analysis. Heterogeneity was evaluated using I2 statistics and hierarchical summary receiver operating characteristic (HSROC) curves.
Results
A total of 58 studies of 48,643 GS-adjudicated HF events were included in this review. Strategies used to improve case identification included the use of broader coding definitions, combining multiple data sources, and using machine learning algorithms to search free text data, but these methods were not always successful and at times reduced specificity in individual studies. Meta-analysis of 17 acute HF studies showed that RCD algorithms have high specificity (96.2%, 95% confidence interval [CI] 91.5–98.3), but lacked sensitivity (63.5%, 95% CI 51.3–74.1) with similar results for 21 prevalent HF studies. There was considerable heterogeneity between studies.
Conclusions
RCD can correctly identify HF outcomes but may miss approximately one-third of events. Methods used to improve case identification should also focus on minimizing false positives.
Supplementary Information
The online version contains supplementary material available at 10.1186/s13643-024-02477-5.
Keywords: Randomized trials,; Methods comparison,; Outcome ascertainment,; Streamlined clinical trials,; Systematic review,; Meta-analysis
Introduction
Heart failure (HF) is an important cause of morbidity and mortality in the general population affecting 1–3% of adults, with over 64 million people estimated to be affected worldwide [1–3]. It is a significant burden on healthcare systems, accounting for about 2% of all healthcare expenditure in countries across Europe and the USA [1, 2]. Therefore, HF is an important target for treatment, requiring large randomized, controlled trials to assess potential interventions. Such large trials can be complex and costly [4, 5]. Ascertainment of HF admissions in a clinical trial often requires clinic visits (with or without manual medical records review) to identify potential events, gathering clinical documents for reported events, and independent clinical adjudication to confirm or refute events. This process could be streamlined to reduce the complexity and overall cost of trials [6–8]. Routinely collected healthcare data (RCD) may help to achieve this goal by supporting the ascertainment of HF outcomes during within-trial periods, and post-trial assessments of the impact on longer-term HF risk [9].
RCD is defined as “healthcare data collected for purposes other than research or without specific a priori research questions developed before collection” [10]. When patients are diagnosed with HF during a healthcare encounter, this diagnosis, along with other data relating to the encounter, are recorded in RCD, usually in the form of coded diagnoses. The most common RCD source is hospital administrative claims data (ACD), an umbrella term for data generated as part of the financial administration of hospitals [11, 12]. Other RCD sources include patient or disease registries and epidemiological surveys (detailed definitions of RCD sources used are provided in Additional file 1: Supplemental Methods). RCD can be used to ascertain events by searching the data for specific codes or coding algorithms.
Ascertaining hospitalizations for HF from such sources can be problematic as HF is a chronic disease with episodes of decompensation requiring admission, and commonly used coding systems do not distinguish between acute events and prevalent chronic disease.
A meta-analysis published in 2014 of 11 studies reporting sensitivity and specificity of coded administrative data for ascertaining HF, showed that pooled sensitivity was 75% (95% confidence interval [CI] 74.7–75.9) and pooled specificity was 97% (95% CI 96.8–96.9) [13]. These findings mirrored two previous reviews [14, 15]. However, there was a limited number of studies in this review, and some studies had very small numbers of HF events. It is also possible that coding practices have improved over the last decade. A systematic review from 2020, focused entirely on Europe and including 20 studies using electronic health records and primary care data, reported sensitivities ≤ 66% and specificities ≥ 95% in most of the studies [16]. However, it excluded other data sources such as claims databases and registries and was geographically restricted. We have systematically reviewed all studies that assessed the utility of RCD for HF outcome ascertainment to summarise the currently available evidence supporting their use in cardiovascular outcomes trials.
Methods
This review follows the PRISMA (Preferred Reporting for Systematic Reviews and Meta-Analyses) guidelines for conducting and reporting a systematic review [17].
Search strategy
A search was conducted of all available peer-reviewed literature on MEDLINE and Embase, from their inception (1946 and 1974 respectively), until May 2021 using the Ovid search engine. The initial search strategy was broad and aimed to include any studies where RCD was used to ascertain HF. No limits were set for the initial search. Multiple search terms, including different phrasings or synonyms of the same term were used (see Systematic Review Protocol in the Supplementary Appendix for search strategy and inclusion criteria). After removing duplicates, the titles and abstracts of potentially eligible articles were reviewed and those meeting the inclusion criteria underwent full-text review. The references of the full-text papers were hand-searched for additional relevant articles.
Inclusion and exclusion criteria
To be included in the review, a study was required to assess the utility of coded RCD for ascertainment of HF against gold standard (GS) ascertainment criteria. We selected full-length, peer-reviewed articles published in English that used RCD to ascertain HF events and reported at least one agreement statistic, or sufficient data to allow its calculation, for International Classification of Disease (ICD) code-based definitions of HF. All studies included must have defined a GS against which to assess the RCD-based ascertainment method and include at least 50 HF events identified using the GS method relevant to that study. The GS method is defined as the reference standard against which each study assessed their RCD-based outcome ascertainment method. Examples include medical records review using pre-specified criteria. Articles were excluded if they used free-text electronic medical records (i.e., narrative clinical notes) as the sole RCD source as these would be considered medical records and are often used as the GS for event adjudication (see Systematic Review Protocol in Supplementary Appendix for detailed exclusion criteria).
Data extraction
The full-text articles were reviewed by the first author (MAG) who abstracted the data into a data collection form. The author extracted study characteristics, details of the data sources (RCD and GS), type of hospital encounter (e.g., inpatient, outpatient, or emergency department attendances), and data definitions used, along with agreement statistics for the ICD code or coding algorithm used to ascertain HF. The agreement statistics extracted included sensitivity, specificity, positive predictive value (PPV), negative predictive value (NPV), and kappa scores. Where agreement statistics were unavailable, raw data was extracted for calculation where possible. Most routine databases list the main reason for hospitalization (most responsible diagnosis) in a primary position and secondary complications or pre-existing comorbidities in secondary positions. As the distinction between these categories is likely to be important in ascertaining incident episodes of heart failure (e.g., hospitalization due to HF decompensation) as potential trial outcomes, the coding positions and agreement statistics according to coding position were also abstracted where available. If a study used more than one RCD definition or algorithm, the algorithm with the best agreement statistics was used for the main analysis.
Studies were categorized according to which types of RCD-based and GS HF events were included. Studies that only included hospitalizations for decompensated HF, irrespective of a prior HF diagnosis, were categorized as acute HF studies. These studies were the main focus of the analysis as such methods could be used to collect follow-up information in a clinical trial. Studies that included all individuals with HF recorded over the study period (new and pre-existing HF) were categorized as prevalent HF studies. Such methods could be used to identify potential participants for inclusion in clinical trials. Studies that defined HF as a comorbid disease in individuals admitted with another main diagnosis such as myocardial infarction were also included in the prevalent HF category.
If a study assessed both acute and prevalent HF, or different ICD versions, or more than one coding position separately, the agreement statistics were extracted for all relevant event types or RCD algorithms for subgroup analysis. The first author conducted a second review of the abstracted data comparing them against the original abstract to correct any discrepancies in the data collection form. Any uncertainties were resolved through discussion with two senior clinicians (MMM and RJH).
Study quality assessment
A quality assessment of the included studies was undertaken using the revised tool for Quality Assessment of Diagnostic Accuracy Studies (QUADAS-2) [18]. Three authors (WK, ME, and AEM) independently reviewed the studies and extracted data using the QUADAS-2 template, and the first author reviewed and collated the final quality assessment. Studies were classified as having a low, high, or unclear risk of bias for 4 domains (patient selection, index test, reference standard, and flow and timing) and the first 3 domains were also assessed for applicability to the review question (see Supplemental Methods in Additional file 1 for details). Studies were considered to have a “low risk” of bias or “low concern” regarding applicability if all domains were low risk. If one or more domains had unclear or high risk the study was considered to be “at risk” of bias or have “some concerns” regarding applicability. A sensitivity analysis excluding studies at risk of bias was undertaken.
Statistical analysis
Studies were grouped according to whether they assessed acute or prevalent HF. Other potential sources of heterogeneity included coding system, position and definitions used, RCD and GS data source, study size, publication date, and country or region (e.g., Europe). All agreement statistics (sensitivity, specificity, PPV or NPV) and 95% CI (exact binomial CI) were calculated using available data (see Additional file 1: Figure S1 for an example 2 × 2 table) [19]. Summary sensitivity, specificity, and a summary receiver operating characteristic (SROC) plot with a summary curve (using the hierarchical SROC model) were obtained using the Stata command metandi [20]. As these are random effects models that may give undue weight to smaller studies, an additional sensitivity analysis was undertaken limited to studies with > 200 GS events.
The I2 statistic was used to assess heterogeneity between the sensitivity and specificity estimates in addition to visual inspection of the HSROC curves [21]. All analyses were performed using Stata version 17.
Formal testing for publication bias was undertaken by a regression of the log diagnostic odds ratio against 1/√effective sample size (ESS), weighted by ESS, with a P < 0.05 for the slope coefficient indicating significant asymmetry [22] (see Additional file 1, Supplemental Methods, Statistical Methods and Interpretation for details).
Results
Qualitative synthesis
Study selection
The initial Embase and MEDLINE searches yielded 2790 articles in total and an additional 56 records were identified through a manual search of references during full-text review. After the removal of duplicates and non-English language articles and abstract review, 129 articles were selected for full-text review. Of these, 71 were excluded and 58 articles were included in the final synthesis (Fig. 1).
Fig. 1.
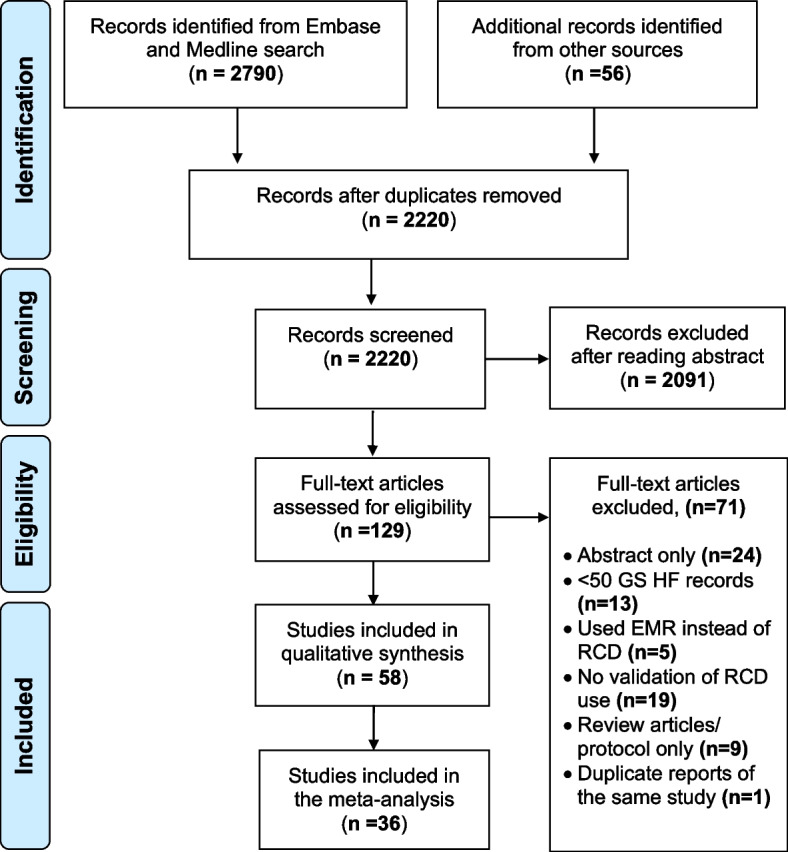
Preferred Reporting Items for Systematic Reviews and Meta-Analyses (PRISMA) flowchart summarising the study selection process. Legend: EMR indicates electronic medical records; GS, gold standard; HF, heart failure; n, number of records and RCD, routinely collected healthcare data
Study characteristics
The 58 studies included 48,643 GS HF events in total. 34 studies (including 30,458 GS HF events) assessed acute HF outcomes [23–57], 21 studies (including 5210 HF events) assessed prevalent HF [12, 49, 58–76] while three studies (with 12,975 HF events) assessed both [77–79]. The majority of the studies (59%) were conducted in the USA and Canada. Additional file 1: Table S1 and Table S2 summarize the characteristics of the 58 studies.
Study quality assessment
The overall risk of bias was low for 28 (48%) studies (Additional file 1: Table S3). Of the remaining 30 studies, 7 had at least one high-risk domain and 23 had one or more domains with unclear risk of bias. Of 7 studies with high-risk domains, 6 had a reference standard at risk of not correctly classifying the target condition [28, 57, 68, 70, 71, 79] while, in one study, patients were inappropriately excluded from the analysis as they did not receive the reference standard [57]. Concerns regarding applicability were low for 42 studies (72%). Fourteen of the 16 studies with “some concern” regarding applicability were also considered “at risk” for overall risk of bias, with concerns about the reference standard being the most common issue in both areas.
Gold standard data sources and definition
Forty-nine (85%) studies used hospital medical records as the GS data source (Additional file 1: Table S4 summarizes the sources of routine and GS data). The remaining studies used primary care records (2 studies) [49, 76], and specialty databases or registries containing coded clinical data (5 studies) [12, 24, 35, 42, 57]. One study assessed outcomes against participant self-report [71], and another study conducted prospective medical assessments and echocardiography [37].
Most studies (85%) undertook a further adjudication step of the GS source data conducting clinical adjudication of the medical records according to study defined or guideline criteria. Three studies used the recoding of medical records by professional coders as the GS source [28, 68, 79] while the remaining six studies did not undertake any adjudication (Additional file 1: Table S5 summarizes the GS ascertainment methods used, and Table S6 the main guideline criteria used for GS adjudication).
Routine data sources and definition
Forty-two (72%) studies relied solely on admitted care or inpatient data sources, whilst 15 (26%) studies also used outpatient or emergency department data [23, 30, 40–42, 45, 49–51, 53, 54, 59, 71, 76, 77]. One (2%) study only used outpatient data [67]. Additional file 1: Table S4 summarises the main routine data sources. 42 studies (72%) used HDD as the main RCD source. Only three (5%) studies included prescribing data [39, 57, 71], while two (3.5%) studies included laboratory data [23, 50] 50 (86%) studies used only one RCD source, whilst eight (14%) studies used a combination of two or more sources [23, 39, 50, 57, 71–73, 76]. Two (3%) studies combined coded HDD with machine learning algorithms and keyword searches to ascertain HF events from free text HDD, electronic medical records, and discharge summaries [72, 73].
All the studies identified used data coded in one of three revisions of the ICD coding system (ICD-8, -9, or -10) with some studies using more than one. 32 (55%) studies used ICD-9 codes only, 16 (28%) studies used ICD-10 codes only and one (2%) used ICD-8 codes only [28]. Nine (16%) studies used a combination of revisions [25, 34, 39, 48, 50, 53, 65, 70, 76].
The coding algorithms used varied considerably between studies. Four (7%) studies did not define the specific coding algorithm used [25, 29, 58, 62]. The commonest ICD-9 code used was 428.x (heart failure) alone (17 studies) or in combination with other codes (20 studies). The commonest ICD-10 code used was I50.x (heart failure) alone (9 studies) or in combination with others (15 studies). Additional file 1: Tables S7 and S8 summarize the ICD-9 and -10 coding algorithms used respectively, while Additional file 1: Table S9 includes a list of all the HF codes used in the studies along with their definitions.
Most studies specified the ICD HF code position (primary, secondary, any) within the database. Among 37 studies ascertaining acute HF, 4 (11%) studies reported algorithms with HF codes in the primary position and any position separately [28, 30, 44, 56], 11 (30%) only reported algorithms with HF codes in the primary position, and 21 (57%) only reported algorithms with codes in any position. One study algorithm (2%) used codes in positions 1–6 [36].
Ascertainment of acute heart failure
Results of individual studies
Table 1 summarizes the agreement statistics of the main study algorithm(s) for each study considering acute HF grouped by country (as RCD sources are likely to be similar) and ordered by sensitivity or PPV (highest to lowest). There was a wide range of performance across studies with sensitivities ranging from as low as 13% to > 90%. Only 8/23 (35%) studies reported a sensitivity > 80%. Although specificity also ranged widely between 20 and > 90%, 17/21 (81%) studies reported a specificity > 80%.
Table 1.
Agreement statistics for the best ICD code-based algorithm(s) for acute heart failure studies
| First author | Year | Country | GS HF events | RCD source | GS source | ICD version | ICD algorithm/code pos. | Sensitivity (95% CI) | Specificity (95% CI) | PPV (95% CI) | NPV (95% CI) | Kappa (95% CI) |
|---|---|---|---|---|---|---|---|---|---|---|---|---|
| Huang [33] | 2017 | USA | 369 | HDD | MR | 9 | Best alg. | 96.6 (96.3–96.8) | – | 92.3 (92.0–92.6) | – | – |
| Rosamond [56] | 2012 | USA | 425 | HDD | MR | 9 | Any | 95.0 | 17.0 | 62.0 | – | – |
| 1ry | 43.0 | 95.0 | 93.0 | – | – | |||||||
| Fisher [28] | 1992 | USA | 788 | ACD | MR (re-coded to ICD–9) | 8 | Any | 89.0 (86.6–91.1) | 95.4 (94.9–95.9) | 71.0 (68.1–73.8) | 98.6 (98.2–98.8) | – |
| 402 | 1ry | 85.0 (81.2–88.4) | 99.2 (99.0–99.4) | 87.0 (83.3–90.2) | 99.1 (98.8–99.2) | – | ||||||
| Birman-Deych [78] | 2005 | USA | – | Registry | MR | 9 | Any | 83.0 | 86.0 | 85.0 | – | – |
| Schellenbaum [47] | 2006 | USA | 712 | HDD | MR | 9 | Any | 80.8 (77.7–83.6) | 90.4 (89.6–91.2) | 53.6 (50.6–56.7) | 97.2 (96.6–97.6) | – |
| Heckbert [32] | 2004 | USA | 795 | HDD | MR | 9 | Any | 79.0 (76.0–81.8) | 97.7 (97.6–97.9) | 45.3 (42.7–48.0) | 99.5 (99.4–99.6) | 0.56 (0.53–0.59) |
| Alqaisi [23] | 2009 | USA | 260 | ACD | MR | 9 | Any/Der. | 76.3 | 74.5 | – | – | – |
| Any/Val. | 78.5 | 68.6 | – | – | – | |||||||
| Goff [31] | 2000 | USA | 1376 | Registry | MR | 9 | Any/alg.3 | 67.1 (64.5–69.6) | 92.6 (91.7–93.4) | 77.1 (74.6–79.5) | 88.3 (87.3–89.3) | – |
| Psaty [44] | 2016 | USA | 1863 | ACD | MR | 9 | Any | 53.5 (51.2–55.8) | 89.9 (88.9–90.9) | 72.5 (70.1–74.9) | 79.6 (78.3–80.8) | – |
| 1ry | 27.2 (25.2–29.3) | 99.0 (98.6–99.3) | 93.2 (90.7–95.2) | 73.2 (72.0–74.5) | – | |||||||
| Cohen [50] | 2020 | USA | 1172 | ACD | MR | 9, 10 | Any | 45.6 (42.7–48.5) | 88.2 (85.8–90.3) | 84.0 (80.9, 86.7) | 54.4 (51.7–57.0) | – |
| Presley [55] | 2018 | USA | 360 | HDD | EMR | 9 | 1ry | 45.1 (25.1–65.1) | 99.4 (99.2–99.6) | 89.7 (86.8–92.7) | 93.9 (89.1–98.6) | – |
| Allen [77] | 2014 | USA | 46 | Registry | MR | 9 | Alg. 2 | 41.7 (16.1–72.2) | 98.1(96.1–99.0) | 33.3 (12.8–63.1) | 98.6 (96.8–99.4) | – |
| Jollis [35] | 1993 | USA | 1788 | ACD | Registry | 9 | Any | 36. 0 (33.8–38.3) | 96.0 (95.6–96.4) | 59.2 (56.3–62.2) | 90.3 (89.7–90.8) | 0.39 |
| Li [57] | 2011 | USA | 477 | ACD a + registry | Registry | 9 | Any | 27.9 (23.9–32.1) | 75.6 (72.0–79.0) | 47.8 (41.8–53.9) | 56.7 (53.1–60.2) | – |
| Best alg | 13.0 (10.1–16.4) | 98.0 (96.5–99.0) | 83.8 (73.4–91.3) | – | – | |||||||
| Roger [45] | 2004 | USA | 658 | HDD | MR | 9 | 1ry | – | – | 82.0 (81.1–82.9) | – | – |
| McCullough [41] | 2002 | USA | 200 | ACD | MR | 9 | Study alg | – | – | 73.8 | – | – |
| Frolova [30] | 2015 | Canada | 733 | HDDb | MR | 10 | Any | 92.8 (90.6–94.5) | 20.5 (12.0–31.6) | 92.1 (90.0–94.0) | 22.1 (12.9–33.8) | – |
| 1ry | 73.9 (70.6–77.1) | 71.2 (59.4–81.2) | 96.3 (94.4–97.7) | 21.4 (16.4–27.1) | – | |||||||
| Juurlink [79] | 2006 | Canada | 482 | HDD | MR re-coding | 10 | 1ry | 79.0 (75.0–83.0) | 99.5 (99.4–99.6) | 85.0 (82.0–89.0) | 99.3 (99.1–99.4) | 0.82 (0.79–0.84) |
| Austin [24] | 2002 | Canada | 5475 | HDD | Registry | 9 | 1ry | 58.5 (57.2–59.8) | 96.8 (96.6–96.9) | 65.1 (63.8–66.5) | 95.8 (95.6–96.0) | 0.58 |
| Lee [38] | 2005 | Canada | 1808 | HDD | MR | 9 | 1ry | – | – | 94.3 (93.1–95.4) | – | – |
| Blackburn [25] | 2011 | Canada | 345 | HDD | MR | 9 | 1ry | – | – | 73.8 | – | – |
| 10 | 1ry | – | – | 84.5 | – | – | ||||||
| Cozzolino [27] | 2019 | Italy | 124 | HDD | MR | 9 | 1ry | 96.0 (91.0–99.0) | 90.0 (81.0–96.0) | 94.0 (88.0–97.0) | 93.0 (85.0–98.0) | – |
| Fonseca [29] | 2008 | Portugal | 168 | HDD | MR | 9 | Any | 77.4 (70.3–83.5) | 59.1 (46.3–71.0) | 82.8 (76.0–88.4) | 50.6 (39.0–62.2) | – |
| Bosco-Levy [26] | 2019 | France | 229 | HDD | MR | 10 | Any | 64.2 (58.0–70.4) | – | 60.5 (53.7–67.3) | – | – |
| Mahonen [39] | 2013 | Finland | 313 | Multiplea | MR | 8, 9, 10 | Study alg. | 48.5 (42.9–54.2) | 99.7 (99.5–99.8) | 85.9 (79.7–90.5) | 85.9 (79.7–90.5) | – |
| Merry [42] | 2009 | Netherlands | 154 | HDD | Registry | 9 | Any | 43.0 (35.3–51.2) | 99.9 (99.9–100.0) | 80.0 (69.7–87.6) | 99.6 (99.5–99.7) | – |
| Ingelsson [34] | 2005 | Sweden | 321 | HDD | MR | 8, 9, 10 | 1ry | – | – | 95.0 (89.6–97.8) | – | – |
| Any | – | – | 81.7 (76.9–85.7) | – | – | |||||||
| Schaufelberger [46] | 2020 | Sweden | 911 | HDD | MR | 10 | Any | – | – | 94.4 | – | – |
| Thygesen [54] | 2011 | Denmark | 50 | HDD | MR | 10 | 1ry | – | – | 100 (92.9–100) | – | – |
| Mard [40] | 2010 | Denmark | 637 | HDD | MR | 10 | Any | – | – | 84.0 (81.2–86.6) | – | – |
| Delekta [51] | 2007 | Denmark | 418 | HDD | MR | 10 | Any | – | – | 83.6 (80.1–86.7) | – | – |
| Kümler [37] | 2008 | Denmark | 429 | HDD | Study doctorc | 10 | Any | 29.4 (25.1–33.9) | 98.9 (98.5–99.3) | 80.8 (73.7–86.6) | 90.0 (88.9–91.1) | – |
| Sundbøll [53] | 2016 | Denmark | 100 | HDD | MR | 8,10 | 1st any/1ry | – | – | 76.0 (66.0-83.0) | – | – |
| Pfister [52] | 2013 | UK | 379 | HDD | MR | 10 | Any | – | – | 95.7 | – | – |
| Khand [36] | 2005 | UK | 216 | HDD | MR | 10 | 1–6 | – | – | 86.7 (82.4–90.1) | – | – |
| Teng [48] | 2008 | Australia | 1001 | HDD | MR | 9, 10 | 1ry | – | – | 98.8 | – | – |
| Ono [43] | 2020 | Japan | 5404 | ACD | EMR | 10 | 1ry | – | – | 95.7 (95.2–96.2) | – | – |
Studies grouped by country and ordered by sensitivity or PPV (highest to lowest). Some studies contribute > 1 algorithm if assessing codes in > 1 position, or different ICD versions. See Table 1 in Additional file 1 for details of the algorithms used
ACD indicates administrative claims data where the data source is specified as claims data by study, Alg. algorithm, CI confidence interval, EMR electronic medical record, GS gold standard, HDD hospital discharge data, HF heart failure, ICD International Classification of Diseases, MR medical records, Pos. position, PPV positive predictive value, NPV negative predictive value, RCD routinely collected data, Val. validation cohort
aTwo or more data sources
bRCD sources highlighted in bold from one country all used the same (or similarly structured) RCD source
cProspective history and examination by study doctor
Meta-analysis
Sufficient data for meta-analysis was available for 17,986 GS HF events from 17/37 studies assessing RCD for acute HF. The funnel plot for publication bias with the superimposed regression line is shown in Additional file 1: Figure S2. The p value for the slope coefficient was not statistically significant (P value = 0.73) indicating a symmetrical funnel plot and a low likelihood of publication bias.
Table 2 provides the summary statistics for acute and prevalent RCD algorithms overall and according to the diagnostic position of HF codes. The summary sensitivity and specificity for acute HF studies were 63.5% (95% CI 51.3–74.1) and 96.2% (95% CI 91.5–98.3) respectively (Table 2). The agreement was similar in studies which included codes in the primary diagnostic position and any diagnostic position. When the analysis was restricted to 14 studies (17,540 GS HF events in total) with > 200 GS HF events the summary sensitivity was lower while specificity remained unchanged (Table 2 and Additional file 1: Figure S3a). When the analysis was restricted to 9 studies at low risk of bias, summary sensitivity was lower while specificity was similar (Table 2).
Table 2.
Agreement statistics for coding algorithms ascertaining acute and prevalent heart failure according to coding position
| Coding algorithms according to event type and code position | Algorithms (N) | Sensitivity (95% CI) | I2 for sensitivity (95% CI) | Specificity (95% CI) | I2 for specificity (95% CI) |
|---|---|---|---|---|---|
| Acute HF | |||||
| All | 17 | 63.5% (51.3–74.1) | 99.3 (99.0–99.2) | 96.2% (91.5–98.3) | 99.7 (99.6–99.7) |
| All studies with > 200 GS events | 14 | 59.8% (48.1–70.5) | 99.3 (99.1–99.4) | 96.2% (92.1–98.2) | 99.6 (99.6–99.7) |
| Studies at low risk of bias | 9 | 55.5% (45.1–65.4) | 98.9 (98.7–99.2) | 97.2% (89.7–99.3) | 99.7 (99.7–99.8) |
| Any diagnostic position | 13 | 62.3% (47.7–75.0) | 99.5 (99.4–99.6) | 94.2% (84.0–98.1) | 99.7 (99.7–99.8) |
| 1ry diagnostic position | 7 | 71.0% (49.4–86.0) | 99.8 (99.7–99.8) | 97.8% (93.4–99.3) | 99.7 (99.7–99.8) |
| Prevalent HF | |||||
| All | 21 | 63.7% (55.3–71.3) | 98.6 (98.3–98.8) | 98.1% (97.0–98.8) | 98.7 (98.5–98.9) |
| All studies with > 200 GS events | 10 | 60.8% (50.9–70.6) | 99.4 (99.3–99.5) | 98.1% (96.4–99.0) | 99.2 (99.0–99.4) |
| Studies at low risk of bias | 8 | 64.3% (54.0–73.4) | 98.9 (98.6–99.2) | 97.7% (96.2–98.6) | 97.9 (97.2–98.6) |
| Any diagnostic position | 17 | 63.0% (53.9–71.3) | 98.7 (98.4–98.9) | 98.2% (96.9–99.0) | 99.0 (98.8–99.2) |
| 2ry diagnostic position | 4 | 66.4% (45.8–82.2) | 99.2 (98.9–99.5) | 97.1% (96.0–98.0) | 88.9 (79.6–98.3) |
CI indicates confidence intervals, HF heart failure, I2 I2 statistic describing the percentage of variation across studies that is due to heterogeneity rather than chance, N number of study algorithms (the same study can contribute > 1 algorithm in the subgroups if > 1 diagnostic position used, or the same study assessed acute and prevalent HF)
Figure 2 shows the forest plot of paired sensitivities and specificities for acute HF studies. There was marked heterogeneity between studies ascertaining acute HF (I2 99.3% and 99.7% for sensitivity and specificity respectively). The SROC plot for acute HF (Fig. 3a) has a wide 95% prediction region with individual study algorithms scattered away from the HSROC curve also suggesting considerable heterogeneity between studies, with no clear relationship between sensitivity and specificity. Heterogeneity remained regardless of the coding position used (Additional file 1: Figure S4).
Fig. 2.

Forest plot of paired sensitivities and specificities of study algorithms ascertaining acute heart failure. Legend: Algorithms sorted by diagnostic code position. Summary points estimated using a bivariate random effects model. CI indicates confidence intervals; FN, false negatives; FP, false positives; I2, I2statistic describing the percentage of variation across studies that is due to heterogeneity rather than chance; TN, true negatives and TP, true positives
Fig. 3.

SROC plots for the diagnostic accuracy of coding algorithms ascertaining acute and prevalent heart failure. Legend: a Acute heart failure (HF) algorithms and b Prevalent HF algorithms. HSROC indicates hierarchical summary receiver operating characteristic curve, grey circle, the sensitivity and (1-specificity) of an individual study with the size of the circle proportionate to study size; summary point, summary sensitivity, and specificity; 95% confidence region, 95% confidence region for the summary point, and the 95% prediction region, the area in which we can say with 95% certainty the true sensitivity and specificity of a future study will be contained
Subgroup analysis
Given the significant heterogeneity between studies, Additional file 1: Table S10 summarises agreement statistics for studies ascertaining acute HF according to other subgroups of interest that are potential sources of heterogeneity. While there were differences in summary statistics between subgroups, they had wide confidence intervals. However, algorithms from studies using medical records as the GS data source reported a higher summary sensitivity (72.6%, 95% CI 61.2–81.7) than those using registry data (41.2%, 95% CI 30.3–53.0) with similar summary specificities. Four studies with < 1500 participants had higher summary sensitivity (75.3%, 95% CI 41.4–93.0) and lower specificity (76.1%, 95% CI 63.2–85.4) compared to 13 studies with ≥ 1500 participants (59.8%, 95% CI 48.2–70.5 and 97.9%, 95% CI 95.4–99.1 respectively).
There was considerable heterogeneity with I2 ≥ 98% within all subgroups (Additional file 1: Table S10). Some of these subgroups only included a small number of studies and the summary results should be interpreted with caution.
Ascertainment of prevalent heart failure
Results of individual studies
Table 3 summarizes the agreement statistics of the main study algorithm(s) for each study ascertaining prevalent HF grouped by country and ordered by sensitivity or PPV (highest to lowest).
Table 3.
Agreement statistics for the best algorithm (s) assessing prevalent heart failure
| First author | Country | GS HF events | RCD source | GS source | ICD coding | Sensitivity (95% CI) | Specificity (95% CI) | PPV (95% CI) | NPV (95% CI) | Kappa (95% CI) | |
|---|---|---|---|---|---|---|---|---|---|---|---|
| Version | Pos./Alg | ||||||||||
| Borzecki [67] | USA | 82 | ACD | MR | 9 | Any | 77.0 | 99.0 | – | – | 0.74 |
| Birman-Deych [78] | USA | 11014 | Registry | MR | 9 | Any | 76.0 (75.2–76.8) | 98.0 (97.7–98.2) | 97.0 (96.6–97.3) | 82.4 (81.8–83.0) | – |
| Rector [71] | USA | 218 | ACD a | Self-report | 9 | Best alg. | 70.2 (63.6–76.2) | 91.0 (90.0–91.9) | 33.3 (29.0–98.4) | 98.0 (97.4–98.4) | – |
| Allen [77] | USA | 108 | Registry | MR | 9 | Alg. 2 | 61.5 (39.6–79.5) | 98.5 (96.6–99.3) | 68.6 (44.9–85.4) | 97.9 (95.9–99.0) | – |
| Van Doorn [75] | USA | 217 | HDD | MR | 10 | Any | 56.7 (49.8–63.4) | 98.7 (96.7–99.6) | 96.9 (92.1–99.1) | 76.3 (71.8–80.4) | 0.59 |
| Fleming [59] | USA | 103 | ACD | MR | 9 | Study alg. | 46.6 (36.7–56.7) | 95.9 (94.9–96.7) | 37.2 (28.9–46.2) | 97.1 (96.3–97.8) | 0.38 |
| Kieszak [69] | USA | 145 | ACD | MR | 9 | Any | – | – | – | – | 0.38 |
| Etzioni [12] | USA | 249 | HDD | Registry | 9 | Secondary | – | – | – | – | 0.22 |
| Schultz [76] | Canada | 99 | HDD + ACD | Primary care record | 8, 9, 10 | Alg. 4 | 84.8 (76.2–91.3) | 97.0 (96.2–97.7) | 55.6 (47.3–63.7) | 99.3 (98.9–99.6) | – |
| Xu [72] | Canada | 296 | HDD | MR | 10 | Any | 57.4 (51.8–63.0) | 99.2 (98.8–99.6) | 92.4 (88.6–96.2) | 93.4 (92.3–94.5) | – |
| + EMR | Any + MLA | 83.3 (73.9–92.8) | 97.3 (95.6–98.9) | 83.3 (73.9–92.8) | 97.3 (95.6–98.9) | – | |||||
| Juurlink [79] | Canada | 1371 | HDD | Re–coded MR | 10 | Secondary | 82.0 (80.0–84.0) | 96.0 (95.6–96.3) | 68.0 (65.0–70.0) | 98.1 (97.8–98.3) | 0.71 (0.69–0.73) |
| So [65] | Canada | 55 | HDD | MR | 10 | Secondary | 80.0 (67.0–89.6) | 97.8 (93.8–99.6) | 93.6 (82.5–98.7) | 92.5 (86.9–96.2) | – |
| 9 | Secondary | 81.8 (68.7–90.5) | 96.4 (91.8–98.8) | 90.0 (78.2–96.7) | 93.0 (87.5–96.6) | – | |||||
| Quan (2002) [63] | Canada | 128 | HDD | MR | 9 | Any | 77.3 (69.1–84.3) | 98.7 (97.8–99.3) | 87.6 (80.1–93.1) | 97.3 (96.2–98.2) | 0.80 |
| Quan (2008) [70] | Canada | 333 | Re-coded MR | MR | 9 | Any | 71.8 (66.6–76.5) | 99.3 (99.0–99.5) | 90.2 (86.0–93.5) | 97.5 (96.9–98.0) | 0.78 |
| HDD | MR | 10 | Any | 68.6 (63.2–73.5) | 99.3 (99.0–99.6) | 90.1 (85.8–93.5) | 97.2 (96.6–97.7) | 0.76 | |||
| Humphries [60] | Canada | 58 | HDD | MR | 9 | Any | 65.5 (51.9–77.5) | 95.0 (93.2–96.4) | 50.0 (38.3–61.7) | 97.3 (95.9–98.3) | 0.53 |
| Wilchesky [49] | Canada | 1057 | ACD | Primary care record | 9 | Any | 41.5 (38.5–44.6) | 96.1 (95.7–96.4) | 44.4 (41.3–47.6) | 95.6 (95.2–95.9) | – |
| Henderson [68] | Australia | 392 | HDD |
Re-coded MR |
10 | Any (98–99) | 87.0 (83.1–90.2) | 99.4 (99.2–99.6) | 89.9 (86.2–92.7) | 99.3 (99.0–99.5) | 0.88 |
| 153 | Any (00–01) | 86.3 (79.7–91.0) | 99.7 (99.6–99.8) | 86.3 (79.7–91.0) | 99.7 (99.6–99.8) | 0.86 | |||||
| Powell [61] | Australia | 172 | HDD | MR | 9 | Secondary | 62.2 (54.5–69.5) | 98.3 (97.4–98.9) | 81.7 (74.0–87.9) | 95.4 (94.2–96.4) | – |
| Preen [62] | Australia | 100 | HDD | MR | 9 | Any | 40.0 (30.3–50.3) | 99.8 (99.5–99.9) | 90.9 (78.3–97.5) | 97.0 (96.1–97.7) | – |
| Sarfati [64] | New Zealand | 64 | HDD | MR | 9 | Any | 31.3 (20.2–44.1) | 98.0 (96.4–99.0) | 66.7 (47.2–82.7) | 91.8 (89.2–94.0) | 0.38 (0.25–0.51) |
| Chong [58] | Singapore | 469 | HDD | MR | 9 | Secondary | 35.4 (31.1–39.9) | 97.1 (96.5–97.7) | 65.9 (59.2–71.7) | 90.6 (89.5–91.6) | 0.40 (0.39–0.42) |
| Kaspar [73] | Germany | 222 | HDD | MR | 10 | Any + MLA | 83.8 (78.3–88.4) | 97.2 (95.8–98.2) | 89 .0 (83.9–92.9) | 95.7 (94.1–97.0) | – |
| + EMR | Any | 49.5 (42.8–56.3) | 99.1 (98.2–99.7) | 94.0 (88.1–97.6) | 87.9 (85.6–89.9) | – | |||||
| Soo [66] | UK | 546 | HDD | MR | 10 | Any | 52.4 (48.2–56.5) | 91.6 (90.5–92.6) | 56.0 (51.6–60.2) | 90.4 (89.2–91.5) | 0.45 |
| Luthi [74] | Switzerland | 52 | HDD | MR | 10 | Any | 48.1 (34.0–62.4) | 93.2 (91.3–94.8) | 30.5 (20.8–41.6) | 96.7 (95.2–97.8) | 0.32 (0.21–0.43) |
Studies from one country using the same RCD source are shown in bold lettering
ACD indicates administrative claims data, Alg. algorithm, CI confidence interval, EMR electronic medical record, GS gold standard, HDD hospital discharge data, HF heart failure, ICD International Classification of Diseases, MLA machine learning algorithm, Pos. position, PPV positive predictive value, NPV negative predictive value, RCD routinely collected data
aACD including pharmacy claims data
There was a wide range of performance across studies similar to acute HF studies, but a specificity ≥ 90% was reported by all 22 studies reporting specificities while only 27% reported a sensitivity ≥ 80%.
Meta-analysis
Twenty-one of 24 studies (including 19,840 GS HF events) ascertaining prevalent HF provided sufficient data for meta-analysis. Statistical testing for publication bias showed no significant asymmetry (P value = 0.57) indicating a low likelihood of publication bias (Additional file 1: Figure S2). The overall summary sensitivity and specificity were 63.7% (95% CI 55.3–71.3) and 98.1% (95% CI 97.0–98.8) respectively (Table 2). The result of restricting the analysis to 10 studies with > 200 GS events was similar to the impact on acute HF (Table 2 and Additional file 1: Figure S3b). Restricting the analysis to 8 studies at low risk of bias produced similar summary sensitivity and specificity to the overall result (Table 2).
Figure 4 shows the forest plot of paired sensitivities and specificities for prevalent HF studies. There was significant heterogeneity between studies similar to acute HF studies (Table 2, Fig. 3b, Additional file 1: Figure S5).
Fig. 4.

Forest plot of paired sensitivities and specificities of study algorithms ascertaining prevalent heart failure. Legend: Algorithms sorted by diagnostic code position. Summary points are estimated using a bivariate random effects model. CI indicates confidence intervals; FN, false negatives; FP, false positives; I2, I2 statistic describing the percentage of variation across studies that is due to heterogeneity rather than chance; TN, true negatives and TP, true positive
Discussion
RCD sources are becoming increasingly accessible to researchers and are an invaluable resource for cost-effective, streamlined clinical research. The present study demonstrated that acute HF outcomes ascertained using RCD have good specificity (96%) but lack sensitivity (63%) with similar results for prevalent HF outcomes. This indicates that whilst RCD-based ascertainment is effective at correctly identifying people who have HF, it missed one-third of cases, suggesting that further improvements are required in HF outcome ascertainment methods. The wide confidence intervals around the summary estimate of sensitivity are compatible with RCD-based ascertainment methods missing between 45 and 19% of acute heart failure cases. Furthermore, there was significant heterogeneity between studies and within subgroups which is not explained by differences in RCD coding algorithms, the GS or the country of origin, study size, or year of publication, suggesting there may be other factors such as differences in the populations studied. Therefore, both the summary statistics and subgroup analysis must be interpreted with caution.
A previous review suggested that the use of broader parameters along with laboratory and prescription data may help identify more cases [13]. However, this study has not been able to confirm this, as there were only a few studies using these sources. Eight studies used algorithms combining different sources, coding combinations, periods of data identification etc. [23, 31, 33, 39, 57, 59, 76, 77]. However, the sensitivity in these studies was no different from other studies with simpler algorithms and RCD sources, indicating that the use of complex algorithms did not necessarily improve sensitivity [23, 33, 76]. Using multiple codes from the same source compared to I50x/428x alone (broad vs narrow algorithms) has also not led to a significant increase in sensitivity for acute HF studies (67.1% vs 70.7%) in this meta-analysis (Additional file 1: Table S10). However, this comparison is again between the results of different studies. One study of 99 GS events compared several narrow versus broad coding definitions and found no difference in diagnostic accuracy [76]. Although using machine learning algorithms or keyword searches of free-text entries improved sensitivity this came at the cost of lower specificity in individual studies [72, 73].
Characteristics of better performing algorithms
There were 5 studies with acute HF algorithms that performed above the estimated average with sensitivities > 75% while maintaining specificities > 90% [27, 28, 32, 47, 79]. However, two of these used re-coded medical records as the GS to assess coding practices [28, 79] and all of these studies were considered ‘at risk’ of bias. The use of recoded data may not be a true reflection of the actual presence or absence of disease and may explain the high concordance. In contrast, three studies using registry data as the GS source had worse sensitivities than average (Table 1). This suggests that differences in the GS may explain some of the variation between studies. The only commonalities of the remaining 3 high-performing studies were the use of ICD-9 coded inpatient HDD as the RCD source and adjudicated medical records as the GS.
Prevalent HF studies performed better with 12 studies demonstrating sensitivities > 75% while maintaining specificities > 96%. Five of these studies used RCD from Canadian hospital discharge abstract databases which are coded according to national standards [63, 65, 72, 76, 79]. One of these combined HDD with physician billing data obtaining a sensitivity and specificity of 84.8% and 97.0% respectively (Table 3) [76]. One Canadian study increased its sensitivity from 57.4% (95% CI 51.8–63.0) using an ICD-10 code search of HDD alone to 83.3% (95% CI 73.9–72.8%) by combining the code search with a machine learning algorithm of unstructured free-text entries while maintaining specificity [72]. Similar results were obtained by a German study where combining an ICD-10 code search of HDD with a machine learning algorithm of unstructured free-text improved sensitivity from 49.5% (95% CI 42.8–56.3) to 83.8% (95% CI 78.3–88.4) [73]. The study with the highest sensitivity, specificity, and kappa scores was an Australian study which again used re-coded medical records as the GS, which may explain the high concordance [68].
Limitations of review
There are some limitations to this review. The availability of agreement statistics and information such as the coding algorithms used was variable and made direct comparison between all studies difficult. The quality of the available studies was variable with about half of studies assessed as ‘at risk’ of bias. However, restricting to studies with ‘low risk’ of bias resulted in similar summary estimates of sensitivity and specificity.
This meta-analysis utilizes the currently recommended bivariate and HSROC models which are random effects models that may give undue weight to smaller studies. However, the aim of the meta-analysis is not to present an exact summary but an overall estimate of the likely average sensitivity and specificity of using RCD for ascertainment of HF outcomes. The potential impact of using random-effects meta-analysis was assessed by doing an additional analysis limited to studies with > 200 GS events.
The comparisons between the different algorithms were limited as they were assessed in diverse study populations rather than within the same population, requiring cautious interpretation of the summary statistics and subgroup analysis. For example, a possible impact of the coding position was demonstrated in the meta-analysis results, with studies ascertaining acute HF in the primary position having better summary sensitivity and specificity than those using codes in any position (Table 2). However, four acute HF studies assessing the impact of coding position on diagnostic performance within each study all showed that using codes in the primary position reduces sensitivity and improves specificity compared to codes in any position (Table 1) [28, 30, 44, 56].
This review was also restricted to English language articles and 24 abstract-only studies were excluded. This may have led to publication bias along with any studies that may have been withheld from publication due to poor validation statistics. However, there was no statistically significant publication bias detected.
The WHO ICD-8, -9, and -10 codes do not support separate coding of HF sub-types (e.g., HF with preserved ejection fraction). Although some studies did include additional codes from the ICD-CM codes (USA) and the ICD-CA codes (Canada), this review could only assess the ascertainment of acute HF and prevalent HF irrespective of subtype. The implementation of the new WHO ICD-11 codes, which include heart failure codes capturing preserved, mid-range, and reduced ejection fraction, may allow HF subtypes to be captured in the future [80].
Practical implications and future directions
When using acute HF outcomes to assess treatment effects in trials, a high false negative rate (low sensitivity) will have no impact on the point estimate of the overall treatment effect (provided the missing events are evenly distributed between the control arm and active arm), but it will reduce the statistical power of the trial and lead to widening of confidence intervals. In contrast, low specificity (high false positive rate) can lead to underestimation of treatment effects. Therefore, it is important to ensure that any steps taken to improve the sensitivity of HF algorithms have minimal impact on specificity. A logical way to achieve this may be to broaden the diagnostic codes used to capture HF (and/or combine more than one data source) as attempted by some studies and add a second method to maintain specificity such as a manual review of RCD records by clinicians to confirm or refute suspected events. This second method is less resource-intensive than GS adjudication of medical records and may improve diagnostic accuracy in a similar way to using machine learning algorithms on free text entries but has not been used in any of the studies reviewed [72, 73].
Finally, the considerable variation in agreement statistics between studies may be related to differences in coding practices. Therefore, any new RCD source or ascertainment method is likely to require validation prior to use for HF outcome ascertainment.
Conclusions
While there is significant heterogeneity in studies assessing RCD-based HF outcome ascertainment, this study confirms that the presence of HF codes in RCD correctly identifies true HF but significantly underestimates events. Strategies used to improve case identification include the use of broader coding definitions, multiple data sources, and machine learning algorithms of free text data. However, these methods were not always successful and at times reduced specificity in individual studies. Therefore, methods used to improve case identification should also focus on minimizing false positives.
Supplementary Information
Additional file 1: Supplemental methods. Table S1. Characteristics of studies ascertaining acute heart failure (ordered by country and number of gold standard events). Table S2. Characteristics of studies ascertaining prevalent heart failure (ordered by country and number of gold standard events). Table S3. QUADAS-2 study quality assessment. Table S4. Sources of routine and gold standard data by country or region. Table S5. Gold standard heart failure ascertainment methods used in the reviewed studies. Table S6. Guidelines used for gold standard adjudication. Table S7. ICD-9 coding algorithms used to define heart failure in the studies reviewed. Table S8. ICD-10 coding algorithms used to define heart failure in the studies reviewed. Table S9. List of ICD codes used across the studies and their definitions. Table S10. Summary diagnostic accuracy statistics for coding algorithms ascertaining acute heart failure according to subgroup. Supplemental Figure S1. Calculation of performance statistics. Supplemental Figure S2. Funnel plot for the meta-analysis of studies ascertaining acute and prevalent HF using effective sample size weighted regression tests of funnel plot asymmetry. Supplemental Figure S3. SROC plot for the diagnostic accuracy of coding algorithms in studies with > 200 gold standard (GS) heart failure (HF) events. Supplemental Figure S4. SROC plots for the diagnostics accuracy of RCD algorithms ascertaining acute heart failure according to coding position. Supplemental Figure S5. SROC plots for the diagnostics accuracy of RCD algorithms ascertaining prevalent heart failure according to coding position.
Acknowledgments
Rights retention
For the purpose of open access, the author(s) has applied a Creative Commons Attribution (CC BY) license to any Author Accepted Manuscript version arising.
Abbreviations
- ACD
Administrative claims data
- CI
Confidence intervals
- GS
Gold standard
- HDD
Hospital discharge data
- HF
Heart failure
- ICD
International Classification of Disease
- NPV
Negative predictive value
- PPV
Positive predictive value
- RCD
Routinely collected healthcare data
- (H)SROC
(Hierarchical) summary receiver operating characteristic
Authors’ contributions
All authors contributed to the study’s conception and design. A literature search, qualitative synthesis, and statistical analysis were performed by Michelle A. Goonasekera. Marion M. Mafham and Richard J. Haynes acted as second reviewers to resolve any uncertainties. Waseem Karsan, Muram El-Nayir, Amy E. Mallorie, and Michelle A. Goonasekera undertook the quality assessment. Statistical analysis and data interpretation were supervised by Sarah Parish and Alison Offer. The first draft of the manuscript was written by Michelle A. Goonasekera, and all authors commented on previous versions of the manuscript. All authors read and approved the final manuscript.
Funding
This study was conducted using Departmental funding from the Clinical Trial Service Unit (CTSU), Nuffield Department of Population Health, University of Oxford. CTSU receives support from the UK Medical Research Council (which funds the MRC Population Health Research Unit in a strategic partnership with the University of Oxford, MC-UU_00017/3, MC-UU_00017/5), the British Heart Foundation, Cancer Research UK and Health Data Research (HDR) UK.”
Availability of data and materials
This study brought together existing data openly available at locations cited in the reference documentation and all data generated or analyzed are included in the published article and supplementary files.
Declarations
Ethics approval and consent to participate
Not applicable.
Consent for publication
Not applicable.
Competing interests
S.P., M.M., A.O., R.H., M.G., WK, ME, and AEM work in the Clinical Trial Service Unit and Epidemiological Studies Unit of the Nuffield Department of Population Health at the University of Oxford. The Clinical Trial Service Unit and Epidemiological Studies Unit have a staff policy of not taking any personal payments directly or indirectly from industry (with reimbursement sought only for the costs of travel and accommodation to attend scientific meetings). It has received research grants from Abbott, AstraZeneca, Bayer, Boehringer Ingelheim, Eli Lilly, GlaxoSmithKline, The Medicines Company, Merck, Mylan, Novartis, Novo Nordisk, Pfizer, Roche, Schering, and Solvay, which are governed by University of Oxford contracts that protect their independence.
Footnotes
Publisher’s Note
Springer Nature remains neutral with regard to jurisdictional claims in published maps and institutional affiliations.
References
- 1.McMurray JJ, Pfeffer MA. Heart failure. Lancet. 2005;365(9474):1877–1889. doi: 10.1016/S0140-6736(05)66621-4. [DOI] [PubMed] [Google Scholar]
- 2.James SL, Abate D, Abate KH, Abay SM, Abbafati C, Abbasi N, et al. Global, regional, and national incidence, prevalence, and years lived with disability for 354 diseases and injuries for 195 countries and territories, 1990–2017: a systematic analysis for the Global Burden of Disease Study 2017. Lancet. 2018;392(10159):1789–1858. doi: 10.1016/S0140-6736(18)32279-7. [DOI] [PMC free article] [PubMed] [Google Scholar]
- 3.Bragazzi NL, Zhong W, Shu J, Abu Much A, Lotan D, Grupper A, et al. Burden of heart failure and underlying causes in 195 countries and territories from 1990 to 2017. Eur J Prev Cardiol. 2021;28(15):1682–1690. doi: 10.1093/eurjpc/zwaa147. [DOI] [PubMed] [Google Scholar]
- 4.Sertkaya A, Wong HH, Jessup A, Beleche T. Key cost drivers of pharmaceutical clinical trials in the United States. Clin Trials. 2016;13(2):117–126. doi: 10.1177/1740774515625964. [DOI] [PubMed] [Google Scholar]
- 5.Speich B, von Niederhäusern B, Schur N, Hemkens LG, Fürst T, Bhatnagar N, et al. Systematic review on costs and resource use of randomized clinical trials shows a lack of transparent and comprehensive data. J Clin Epidemiol. 2018;96:1–11. doi: 10.1016/j.jclinepi.2017.12.018. [DOI] [PubMed] [Google Scholar]
- 6.Zannad F, Pfeffer MA, Bhatt DL, Bonds DE, Borer JS, Calvo-Rojas G, et al. Streamlining cardiovascular clinical trials to improve efficiency and generalisability. Heart. 2017;103(15):1156. doi: 10.1136/heartjnl-2017-311191. [DOI] [PubMed] [Google Scholar]
- 7.Calvo G, McMurray JJV, Granger CB, Alonso-García Á, Armstrong P, Flather M, et al. Large streamlined trials in cardiovascular disease. Eur Heart J. 2014;35(9):544–548. doi: 10.1093/eurheartj/eht535. [DOI] [PubMed] [Google Scholar]
- 8.Collins R. Back to the future: the urgent need to re-introduce streamlined trials. Eur Heart J Suppl. 2018;20(suppl C):C14–C17. [Google Scholar]
- 9.Van Staa T-P, Goldacre B, Gulliford M, Cassell J, Pirmohamed M, Taweel A, et al. Pragmatic randomized trials using routine electronic health records: putting them to the test. BMJ. 2012;344:e55. doi: 10.1136/bmj.e55. [DOI] [PMC free article] [PubMed] [Google Scholar]
- 10.Benchimol EI, Smeeth L, Guttmann A, Harron K, Moher D, Petersen I, et al. The REporting of studies Conducted using Observational Routinely-collected health Data (RECORD) statement. PLoS Med. 2015;12(10):e1001885. doi: 10.1371/journal.pmed.1001885. [DOI] [PMC free article] [PubMed] [Google Scholar]
- 11.Cadarette SM, Wong L. An introduction to health care administrative data. Can J Hosp Pharm. 2015;68(3):232–237. doi: 10.4212/cjhp.v68i3.1457. [DOI] [PMC free article] [PubMed] [Google Scholar]
- 12.Etzioni DA, Lessow C, Bordeianou LG, Kunitake H, Deery SE, Carchman E, et al. Concordance between registry and administrative data in the determination of comorbidity: a multi-institutional study. Ann Surg. 2020;272(6):1006–1011. doi: 10.1097/SLA.0000000000003247. [DOI] [PubMed] [Google Scholar]
- 13.McCormick N, Lacaille D, Bhole V, Avina-Zubieta JA. Validity of heart failure diagnoses in administrative databases: a systematic review and meta-analysis. Plos One. 2014;9(8):e104519. doi: 10.1371/journal.pone.0104519. [DOI] [PMC free article] [PubMed] [Google Scholar]
- 14.Quach S, Blais C, Quan H. Administrative data have high variation in validity for recording heart failure. Can J Cardiol. 2010;26(8):e306–e312. doi: 10.1016/s0828-282x(10)70438-4. [DOI] [PMC free article] [PubMed] [Google Scholar]
- 15.Saczynski JS, Andrade SE, Harrold LR, Tjia J, Cutrona SL, Dodd KS, et al. A systematic review of validated methods for identifying heart failure using administrative data. Pharmacoepidemiol Drug Saf. 2012;21(SUPPL. 1):129–140. doi: 10.1002/pds.2313. [DOI] [PMC free article] [PubMed] [Google Scholar]
- 16.Davidson J, Banerjee A, Muzambi R, Smeeth L, Warren-Gash C. Validity of acute cardiovascular outcome diagnoses recorded in European electronic health records: a systematic review. Clin Epidemiol. 2020;12:1095–1111. doi: 10.2147/CLEP.S265619. [DOI] [PMC free article] [PubMed] [Google Scholar]
- 17.Page MJ, McKenzie JE, Bossuyt PM, Boutron I, Hoffmann TC, Mulrow CD, et al. The PRISMA 2020 statement: an updated guideline for reporting systematic reviews. BMJ. 2021;372:n71. doi: 10.1136/bmj.n71. [DOI] [PMC free article] [PubMed] [Google Scholar]
- 18.Whiting PF, Rutjes AW, Westwood ME, Mallett S, Deeks JJ, Reitsma JB, et al. QUADAS-2: a revised tool for the quality assessment of diagnostic accuracy studies. Ann Intern Med. 2011;155(8):529–536. doi: 10.7326/0003-4819-155-8-201110180-00009. [DOI] [PubMed] [Google Scholar]
- 19.Seed P. DIAGT: Stata module to report summary statistics for diagnostic tests compared to true disease status. Statistical Software Components. 2010.
- 20.Harbord RM, Whiting P. Metandi: Meta-analysis of diagnostic accuracy using hierarchical logistic regression. Stata J. 2009;9(2):211–229. [Google Scholar]
- 21.Dwamena B. MIDAS: Stata module for meta-analytical integration of diagnostic test accuracy studies. Statistical Software Components. 2007.
- 22.Deeks JJ, Macaskill P, Irwig L. The performance of tests of publication bias and other sample size effects in systematic reviews of diagnostic test accuracy was assessed. J Clin Epidemiol. 2005;58(9):882–893. doi: 10.1016/j.jclinepi.2005.01.016. [DOI] [PubMed] [Google Scholar]
- 23.Alqaisi F, Williams LK, Peterson EL, Lanfear DE. Comparing methods for identifying patients with heart failure using electronic data sources. BMC Health Serv Res. 2009;9:237. doi: 10.1186/1472-6963-9-237. [DOI] [PMC free article] [PubMed] [Google Scholar]
- 24.Austin PC, Daly PA, Tu JV. A multicenter study of the coding accuracy of hospital discharge administrative data for patients admitted to cardiac care units in Ontario. Am Heart J. 2002;144(2):290–296. doi: 10.1067/mhj.2002.123839. [DOI] [PubMed] [Google Scholar]
- 25.Blackburn DF, Shnell G, Lamb DA, Tsuyuki RT, Stang MR, Wilson TW. Coding of heart failure diagnoses in Saskatchewan: a validation study of hospital discharge abstracts. J Popul Ther Clin Pharmacol. 2011;18(3):e407–e415. [PubMed] [Google Scholar]
- 26.Bosco-Levy P, Duret S, Picard F, Dos Santos P, Puymirat E, Gilleron V, et al. Diagnostic accuracy of the international classification of diseases, tenth revision, codes of heart failure in an administrative database. Pharmacoepidemiol Drug Saf. 2019;28(2):194–200. doi: 10.1002/pds.4690. [DOI] [PubMed] [Google Scholar]
- 27.Cozzolino F, Montedori A, Abraha I, Eusebi P, Grisci C, Heymann AJ, et al. A diagnostic accuracy study validating cardiovascular ICD-9-CM codes in healthcare administrative databases. The Umbria data-value project. PLoS ONE. 2019;14(7):e0218919. doi: 10.1371/journal.pone.0218919. [DOI] [PMC free article] [PubMed] [Google Scholar]
- 28.Fisher ES, Whaley FS, Krushat WM, Malenka DJ, Fleming C, Baron JA, et al. The accuracy of Medicare's hospital claims data: progress has been made, but problems remain. Am J Public Health. 1992;82(2):243–248. doi: 10.2105/ajph.82.2.243. [DOI] [PMC free article] [PubMed] [Google Scholar]
- 29.Fonseca C, Sarmento PM, Marques F, Ceia F. Validity of a discharge diagnosis of heart failure: implications of misdiagnosing. Congest Heart Fail. 2008;14(4):187–191. doi: 10.1111/j.1751-7133.2008.07752.x. [DOI] [PubMed] [Google Scholar]
- 30.Frolova N, Bakal JA, McAlister FA, Rowe BH, Quan H, Kaul P, et al. Assessing the use of international classification of revision codes from the emergency department for the identification of acute heart failure. JACC: Heart Fail. 2015;3(5):386–91. doi: 10.1016/j.jchf.2014.11.010. [DOI] [PubMed] [Google Scholar]
- 31.Goff DC, Jr, Pandey DK, Chan FA, Ortiz C, Nichaman MZ. Congestive heart failure in the United States: Is there more than meets the I(CD Code)? The Corpus Christi Heart Project. Arch Intern Med. 2000;160(2):197–202. doi: 10.1001/archinte.160.2.197. [DOI] [PubMed] [Google Scholar]
- 32.Heckbert SR, Kooperberg C, Safford MM, Psaty BM, Hsia J, McTiernan A, et al. Comparison of self-report, hospital discharge codes, and adjudication of cardiovascular events in the Women’s Health Initiative. Am J Epidemiol. 2004;160(12):1152–1158. doi: 10.1093/aje/kwh314. [DOI] [PubMed] [Google Scholar]
- 33.Huang H, Turner M, Raju S, Reich J, Leatherman S, Armstrong K, et al. Identification of acute decompensated heart failure hospitalisations using administrative data. Am J Cardiol. 2017;119(11):1791–1796. doi: 10.1016/j.amjcard.2017.03.007. [DOI] [PubMed] [Google Scholar]
- 34.Ingelsson E, Ärnlöv J, Sundström J, Lind L. The validity of a diagnosis of heart failure in a hospital discharge register. Eur J Heart Fail. 2005;7(5):787–791. doi: 10.1016/j.ejheart.2004.12.007. [DOI] [PubMed] [Google Scholar]
- 35.Jollis JG, Ancukiewicz M, DeLong ER, Pryor DB, Muhlbaier LH, Mark DB. Discordance of databases designed for claims payment versus clinical information systems: Implications for outcomes research. Ann Intern Med. 1993;119(8):844–850. doi: 10.7326/0003-4819-119-8-199310150-00011. [DOI] [PubMed] [Google Scholar]
- 36.Khand AU, Shaw M, Gemmel I, Cleland JGF. Do discharge codes underestimate hospitalisation due to heart failure? Validation study of hospital discharge coding for heart failure. Eur J Heart Fail. 2005;7(5):792–797. doi: 10.1016/j.ejheart.2005.04.001. [DOI] [PubMed] [Google Scholar]
- 37.Kümler T, Gislason GH, Kirk V, Bay M, Nielsen OW, Køber L, et al. Accuracy of a heart failure diagnosis in administrative registers. Eur J Heart Fail. 2008;10(7):658–660. doi: 10.1016/j.ejheart.2008.05.006. [DOI] [PubMed] [Google Scholar]
- 38.Lee DS, Donovan L, Austin PC, Gong Y, Liu PP, Rouleau JL, et al. Comparison of coding of heart failure and comorbidities in administrative and clinical data for use in outcomes research. Med Care. 2005;43(2):182–188. doi: 10.1097/00005650-200502000-00012. [DOI] [PubMed] [Google Scholar]
- 39.Mahonen M, Jula A, Harald K, Antikainen R, Tuomilehto J, Zeller T, et al. The validity of heart failure diagnoses obtained from administrative registers. Eur J Prev Cardiol. 2013;20(2):254–259. doi: 10.1177/2047487312438979. [DOI] [PubMed] [Google Scholar]
- 40.Mard S, Nielsen FE. Positive predictive value and impact of misdiagnosis of a heart failure diagnosis in administrative registers among patients admitted to a University Hospital cardiac care unit. Clin Epidemiol. 2010;2:235–239. doi: 10.2147/CLEP.S12457. [DOI] [PMC free article] [PubMed] [Google Scholar]
- 41.McCullough PA, Philbin EF, Spertus JA, Kaatz S, Sandberg KR, Weaver WD, et al. Confirmation of a heart failure epidemic: findings from the Resource Utilization Among Congestive Heart Failure (REACH) study. J Am Coll Cardiol. 2002;39(1):60–69. doi: 10.1016/s0735-1097(01)01700-4. [DOI] [PubMed] [Google Scholar]
- 42.Merry AH, Boer JM, Schouten LJ, Feskens EJ, Verschuren WM, Gorgels AP, et al. Validity of coronary heart diseases and heart failure based on hospital discharge and mortality data in the Netherlands using the cardiovascular registry Maastricht cohort study. Eur J Epidemiol. 2009;24(5):237–247. doi: 10.1007/s10654-009-9335-x. [DOI] [PubMed] [Google Scholar]
- 43.Ono Y, Taneda Y, Takeshima T, Iwasaki K, Yasui A. Validity of claims diagnosis codes for cardiovascular diseases in diabetes patients in Japanese administrative database. Clin Epidemiol. 2020;12:367–375. doi: 10.2147/CLEP.S245555. [DOI] [PMC free article] [PubMed] [Google Scholar]
- 44.Psaty BM, Delaney JA, Arnold AM, Curtis LH, Fitzpatrick AL, Heckbert SR, et al. Study of cardiovascular health outcomes in the era of claims data. Circulation. 2016;133(2):156–164. doi: 10.1161/CIRCULATIONAHA.115.018610. [DOI] [PMC free article] [PubMed] [Google Scholar]
- 45.Roger VL, Weston SA, Redfield MM, Hellermann-Homan JP, Killian J, Yawn BP, et al. Trends in heart failure incidence and survival in a community-based population. JAMA. 2004;292(3):344–350. doi: 10.1001/jama.292.3.344. [DOI] [PubMed] [Google Scholar]
- 46.Schaufelberger M, Ekestubbe S, Hultgren S, Persson H, Reimstad A, Schaufelberger M, et al. Validity of heart failure diagnoses made in 2000–2012 in western Sweden. ESC Heart Fail. 2020;7(1):37–46. doi: 10.1002/ehf2.12519. [DOI] [PMC free article] [PubMed] [Google Scholar]
- 47.Schellenbaum GD, Heckbert SR, Smith NL, Rea TD, Lumley T, Kitzman DW, et al. Congestive heart failure incidence and prognosis: case identification using central adjudication versus hospital discharge diagnoses. Ann Epidemiol. 2006;16(2):115–122. doi: 10.1016/j.annepidem.2005.02.012. [DOI] [PubMed] [Google Scholar]
- 48.Teng THK, Finn J, Hung J, Geelhoed E, Hobbs M. A validation study: how effective is the hospital morbidity data as a surveillance tool for heart failure in Western Australia? Aust Public Health. 2008;32(5):405–7. doi: 10.1111/j.1753-6405.2008.00269.x. [DOI] [PubMed] [Google Scholar]
- 49.Wilchesky M, Tamblyn RM, Huang A. Validation of diagnostic codes within medical services claims. J Clin Epidemiol. 2004;57(2):131–141. doi: 10.1016/S0895-4356(03)00246-4. [DOI] [PubMed] [Google Scholar]
- 50.Cohen SS, Roger VL, Weston SA, Jiang R, Movva N, Yusuf AA, et al. Evaluation of claims-based computable phenotypes to identify heart failure patients with preserved ejection fraction. Pharmacol Res Perspect. 2020;8(6):e00676. doi: 10.1002/prp2.676. [DOI] [PMC free article] [PubMed] [Google Scholar]
- 51.Delekta J, Hansen SM, AlZuhairi KS, Bork CS, Joensen AM. The validity of the diagnosis of heart failure (I50.0-I50.9) in the Danish National Patient Register. Dan Med J. 2018;65(4):5470. [PubMed] [Google Scholar]
- 52.Pfister R, Michels G, Wilfred J, Luben R, Wareham NJ, Khaw K-T. Does ICD-10 hospital discharge code I50 identify people with heart failure? A validation study within the EPIC-Norfolk study. Int J Cardiol. 2013;168(4):4413–4414. doi: 10.1016/j.ijcard.2013.05.031. [DOI] [PubMed] [Google Scholar]
- 53.Sundbøll J, Adelborg K, Munch T, Frøslev T, Sørensen HT, Bøtker HE, et al. Positive predictive value of cardiovascular diagnoses in the Danish National Patient Registry: a validation study. BMJ Open. 2016;6(11):e012832. doi: 10.1136/bmjopen-2016-012832. [DOI] [PMC free article] [PubMed] [Google Scholar]
- 54.Thygesen SK, Christiansen CF, Christensen S, Lash TL, Sørensen HT. The predictive value of ICD-10 diagnostic coding used to assess Charlson comorbidity index conditions in the population-based Danish National Registry of Patients. BMC Med Res Methodol. 2011;11:83. doi: 10.1186/1471-2288-11-83. [DOI] [PMC free article] [PubMed] [Google Scholar]
- 55.Presley CA, Min JY, Chipman J, Greevy RA, Grijalva CG, Griffin MR, et al. Validation of an algorithm to identify heart failure hospitalisations in patients with diabetes within the veterans health administration. BMJ Open. 2018;8(3):e020455. doi: 10.1136/bmjopen-2017-020455. [DOI] [PMC free article] [PubMed] [Google Scholar]
- 56.Rosamond WD, Chang PP, Baggett C, Johnson A, Bertoni AG, Shahar E, et al. Classification of heart failure in the atherosclerosis risk in communities (ARIC) study. Circ Heart Fail. 2012;5(2):152–159. doi: 10.1161/CIRCHEARTFAILURE.111.963199. [DOI] [PMC free article] [PubMed] [Google Scholar]
- 57.Li Q, Glynn RJ, Dreyer NA, Liu J, Mogun H, Setoguchi S. Validity of claims-based definitions of left ventricular systolic dysfunction in medicare patients. Pharmacoepidemiol Drug Saf. 2011;20(7):700–708. doi: 10.1002/pds.2146. [DOI] [PubMed] [Google Scholar]
- 58.Chong WF, Ding YY, Heng BH. A comparison of comorbidities obtained from hospital administrative data and medical charts in older patients with pneumonia. BMC Health Serv Res. 2011;11(1):105. doi: 10.1186/1472-6963-11-105. [DOI] [PMC free article] [PubMed] [Google Scholar]
- 59.Fleming ST, Sabatino SA, Kimmick G, Cress R, Wu XC, Trentham-Dietz A, et al. Developing a claim-based version of the ACE-27 comorbidity index: a comparison with medical record review. Med Care. 2011;49(8):752–760. doi: 10.1097/MLR.0b013e318215d7dd. [DOI] [PubMed] [Google Scholar]
- 60.Humphries KH, Rankin JM, Carere RG, Buller CE, Kiely FM, Spinelli JJ. Co-morbidity data in outcomes research: are clinical data derived from administrative databases a reliable alternative to chart review? J Clin Epidemiol. 2000;53(4):343–349. doi: 10.1016/s0895-4356(99)00188-2. [DOI] [PubMed] [Google Scholar]
- 61.Powell H, Lim LLY, Heller RF. Accuracy of administrative data to assess comorbidity in patients with heart disease: an Australian perspective. J Clin Epidemiol. 2001;54(7):687–693. doi: 10.1016/s0895-4356(00)00364-4. [DOI] [PubMed] [Google Scholar]
- 62.Preen DB, Holman CDAJ, Lawrence DM, Baynham NJ, Semmens JB. Hospital chart review provided more accurate comorbidity information than data from a general practitioner survey or an administrative database. J Clin Epidemiol. 2004;57(12):1295–1304. doi: 10.1016/j.jclinepi.2004.03.016. [DOI] [PubMed] [Google Scholar]
- 63.Quan H, Parsons GA, Ghali WA. Validity of information on comorbidity derived from ICD-9-CCM administrative data. Med Care. 2002;40(8):675–685. doi: 10.1097/00005650-200208000-00007. [DOI] [PubMed] [Google Scholar]
- 64.Sarfati D, Hill S, Purdie G, Dennett E, Blakely T. How well does routine hospitalisation data capture information on comorbidity in New Zealand? N Z Med J. 2010;123(1310):50–61. [PubMed] [Google Scholar]
- 65.So L, Evans D, Quan H. ICD-10 coding algorithms for defining comorbidities of acute myocardial infarction. BMC Health Serv Res. 2006;6:161. doi: 10.1186/1472-6963-6-161. [DOI] [PMC free article] [PubMed] [Google Scholar]
- 66.Soo M, Robertson LM, Ali T, Clark LE, Fluck N, Johnston M, et al. Approaches to ascertaining comorbidity information: validation of routine hospital episode data with clinician-based case note review. BMC Res Notes. 2014;7:253-. doi: 10.1186/1756-0500-7-253. [DOI] [PMC free article] [PubMed] [Google Scholar]
- 67.Borzecki AM, Wong AT, Hickey EC, Ash AS, Berlowitz DR. Identifying hypertension-related comorbidities from administrative data: what's the optimal approach? Am J Med Qual. 2004;19(5):201–206. doi: 10.1177/106286060401900504. [DOI] [PubMed] [Google Scholar]
- 68.Henderson T, Shepheard J, Sundararajan V. Quality of diagnosis and procedure coding in ICD-10 administrative data. Med Care. 2006;44(11):1011–1019. doi: 10.1097/01.mlr.0000228018.48783.34. [DOI] [PubMed] [Google Scholar]
- 69.Kieszak SM, Flanders WD, Kosinski AS, Shipp CC, Karp H. A comparison of the Charlson comorbidity Index derived from medical record data and administrative billing data. J Clin Epidemiol. 1999;52(2):137–142. doi: 10.1016/s0895-4356(98)00154-1. [DOI] [PubMed] [Google Scholar]
- 70.Quan H, Li B, Duncan Saunders L, Parsons GA, Nilsson CI, Alibhai A, et al. Assessing validity of ICD-9-CM and ICD-10 administrative data in recording clinical conditions in a unique dually coded database. Health Serv Res. 2008;43(4):1424–1441. doi: 10.1111/j.1475-6773.2007.00822.x. [DOI] [PMC free article] [PubMed] [Google Scholar]
- 71.Rector TS, Wickstrom SL, Shah M, Thomas Greeenlee N, Rheault P, Rogowski J, et al. Specificity and sensitivity of claims-based algorithms for identifying members of Medicare+Choice health plans that have chronic medical conditions. Health Serv Res. 2004;39(6 Pt 1):1839–1857. doi: 10.1111/j.1475-6773.2004.00321.x. [DOI] [PMC free article] [PubMed] [Google Scholar]
- 72.Xu Y, Martin E, D'Souza AG, Doktorchik CTA, Jiang J, Lee S, et al. Enhancing ICD-Code-based case definition for heart failure using electronic medical record data. J Card Fail. 2020;15:610–7. doi: 10.1016/j.cardfail.2020.04.003. [DOI] [PubMed] [Google Scholar]
- 73.Kaspar M, Fette G, Güder G, Seidlmayer L, Ertl M, Dietrich G, et al. Underestimated prevalence of heart failure in hospital inpatients: a comparison of ICD codes and discharge letter information. Clin Res Cardiol. 2018;107(9):778–787. doi: 10.1007/s00392-018-1245-z. [DOI] [PMC free article] [PubMed] [Google Scholar]
- 74.Luthi J-C, Troillet N, Eisenring M-C, Sax H, Burnand B, Quan H, et al. Administrative data outperformed single-day chart review for comorbidity measure. Internat J Qual Health Care. 2007;19(4):225–231. doi: 10.1093/intqhc/mzm017. [DOI] [PubMed] [Google Scholar]
- 75.van Doorn C, Bogardus ST, Williams CS, Concato J, Towle VR, Inouye SK. Risk adjustment for older hospitalized persons: a comparison of two methods of data collection for the Charlson index. J Clin Epidemiol. 2001;54(7):694–701. doi: 10.1016/s0895-4356(00)00367-x. [DOI] [PubMed] [Google Scholar]
- 76.Schultz SE, Rothwell DM, Chen Z, Tu K. Identifying cases of congestive heart failure from administrative data: a validation study using primary care patient records. Chron Dis Inj Canada. 2013;33(3):160–166. [PubMed] [Google Scholar]
- 77.Allen LA, Yood MU, Wagner EH, Aiello Bowles EJ, Pardee R, Wellman R, et al. Performance of claims-based algorithms for identifying heart failure and cardiomyopathy among patients diagnosed with breast cancer. Med Care. 2014;52(5):e30–e38. doi: 10.1097/MLR.0b013e31825a8c22. [DOI] [PMC free article] [PubMed] [Google Scholar]
- 78.Birman-Deych E, Waterman AD, Yan Y, Nilasena DS, Radford MJ, Gage BF. Accuracy of ICD-9-CM codes for identifying cardiovascular and stroke risk factors. Med Care. 2005;43(5):480–485. doi: 10.1097/01.mlr.0000160417.39497.a9. [DOI] [PubMed] [Google Scholar]
- 79.Juurlink D PC, Croxford R, Chong A, Austin P, Tu J, Laupacis A. . Canadian Institute for Health Information Discharge Abstract Database: a validation study. Toronto: : Institute for Clinical Evaluative Sciences; 2006.
- 80.International Classification of Diseases . Eleventh Revision (ICD-11) Geneva: World Health Organisation; 2022. [Google Scholar]
Associated Data
This section collects any data citations, data availability statements, or supplementary materials included in this article.
Supplementary Materials
Additional file 1: Supplemental methods. Table S1. Characteristics of studies ascertaining acute heart failure (ordered by country and number of gold standard events). Table S2. Characteristics of studies ascertaining prevalent heart failure (ordered by country and number of gold standard events). Table S3. QUADAS-2 study quality assessment. Table S4. Sources of routine and gold standard data by country or region. Table S5. Gold standard heart failure ascertainment methods used in the reviewed studies. Table S6. Guidelines used for gold standard adjudication. Table S7. ICD-9 coding algorithms used to define heart failure in the studies reviewed. Table S8. ICD-10 coding algorithms used to define heart failure in the studies reviewed. Table S9. List of ICD codes used across the studies and their definitions. Table S10. Summary diagnostic accuracy statistics for coding algorithms ascertaining acute heart failure according to subgroup. Supplemental Figure S1. Calculation of performance statistics. Supplemental Figure S2. Funnel plot for the meta-analysis of studies ascertaining acute and prevalent HF using effective sample size weighted regression tests of funnel plot asymmetry. Supplemental Figure S3. SROC plot for the diagnostic accuracy of coding algorithms in studies with > 200 gold standard (GS) heart failure (HF) events. Supplemental Figure S4. SROC plots for the diagnostics accuracy of RCD algorithms ascertaining acute heart failure according to coding position. Supplemental Figure S5. SROC plots for the diagnostics accuracy of RCD algorithms ascertaining prevalent heart failure according to coding position.
Data Availability Statement
This study brought together existing data openly available at locations cited in the reference documentation and all data generated or analyzed are included in the published article and supplementary files.