

Abstract
Background:
Traumatic spinal cord injuries (TSCI) greatly affect the lives of patients and their families. Prognostication may improve treatment strategies, health care resource allocation, and counseling. Multivariable clinical prediction models (CPMs) for prognosis are tools that can estimate an absolute risk or probability that an outcome will occur.
Objectives:
We sought to systematically review the existing literature on CPMs for TSCI and critically examine the predictor selection methods used.
Methods:
We searched MEDLINE, PubMed, Embase, Scopus, and IEEE for English peer-reviewed studies and relevant references that developed multivariable CPMs to prognosticate patient-centered outcomes in adults with TSCI. Using narrative synthesis, we summarized the characteristics of the included studies and their CPMs, focusing on the predictor selection process.
Results:
We screened 663 titles and abstracts; of these, 21 full-text studies (2009-2020) consisting of 33 distinct CPMs were included. The data analysis domain was most commonly at a high risk of bias when assessed for methodological quality. Model presentation formats were inconsistently included with published CPMs; only two studies followed established guidelines for transparent reporting of multivariable prediction models. Authors frequently cited previous literature for their initial selection of predictors, and stepwise selection was the most frequent predictor selection method during modelling.
Conclusion:
Prediction modelling studies for TSCI serve clinicians who counsel patients, researchers aiming to risk-stratify participants for clinical trials, and patients coping with their injury. Poor methodological rigor in data analysis, inconsistent transparent reporting, and a lack of model presentation formats are vital areas for improvement in TSCI CPM research.
Keywords: multivariable, prediction model, predictor selection, prognosis, systematic review, traumatic spinal cord injury
Introduction
Traumatic spinal cord injury (TSCI) is a life-changing event that results in devastating physical, social, and vocational consequences for patients and their families.1 Patients living with TSCI can experience a loss of independence, lower quality of life, and increased mortality rates,2,3 placing great importance on the ability to prognosticate outcomes to inform long-term strategies and achieve optimal management. The study of TSCI prognosis (further referred to as a prognostic study)—understanding the risk of future health outcomes in individuals with the condition—can help improve clinical decision making, inform health care policy, and translate new therapeutics or approaches to patient management at the bedside.4
Broadly, prognostic studies can be categorized into four distinct but interrelated themes: fundamental prognosis research, prognostic factor research, prognostic model research, and stratified medicine research.4 Prognostic model research produces clinical prediction models (CPMs) for prognosis, which are tools that amalgamate multiple influential patient-related factors into a defined system that can estimate an absolute risk or probability that an outcome will occur.5,6 Methods for prediction model development have been widely discussed,7–9 yet there is no consensus on the best approach to building such models.9
There are a variety of methods for selecting predictors and narrowing down the selection for inclusion in the final model.7,8 Clinically relevant predictors, or “candidate predictors,” are first selected for possible inclusion in the model, often based on previous literature or clinical expertise. Subsequent efforts to select a final set of predictors should ideally balance model performance with practicality and face validity for clinical application.9 An appropriate variable selection strategy is crucial in prediction model development because it allows for the identification of a set of relevant variables that can provide the best fit for the model, resulting in accurate predictions.10 On the other hand, overfitting the model to the data can lead to overly complex models that may not generalize well to new data and result in inaccurate predictions. Variable selection can also improve the interpretability of the model by limiting the number of variables included, making it easier to understand how each of them contribute to the prediction. Importantly, variable selection can help to reduce the risk of bias and increase the statistical power of the model by removing redundant or irrelevant variables.
Given the potential variability in approach to this predictor selection process, the approach taken by different authors can provide insights for future research seeking to extend or improve model development within a subject area. This can include knowledge on which predictors have (or have not) been feasible or worthwhile to measure in the clinical setting, thus informing the development of more applicable models in the future. It also provides an opportunity for studies using advanced machine learning techniques to compare their data-driven selection of predictors with traditional knowledge-driven predictor selection. The claim that advanced machine learning methods are superior to traditional approaches is sometimes exaggerated,11 and there is a need for more well-designed comparisons between the statistical and the machine learning models before such conclusions can be made. Although the current literature on the application of machine learning to prediction modelling research in TSCI is limited,12 the increase in data availability portend these techniques to become more mainstream.13
Wilson et al.14 have published a systematic review of studies reporting predictors of neurological outcome, functional status, and death after TSCI (prognostic factor research). However, despite their potential usefulness, a comprehensive overview of multivariable CPMs (i.e., a combination of variables predicting an outcome) for TSCI, and the predictor selection strategies used to develop these models, is currently lacking. The primary objectives of this systematic review are to (1) provide a comprehensive overview of the landscape of multivariable CPMs, giving specific attention to the participants, predictors, and outcomes used in model development, and (2) describe all phases of the predictor selection process and evaluate which predictors are commonly considered for inclusion in modeling and, among these, which predictors are consistently retained in the final model. Accurately predicting outcomes in TSCI can inform long-term strategies and achieve optimal management for patients, ultimately aiding to promote goal-concordant care and improve patients' quality of life.
Material and Methods
Protocol and registration
The protocol for this systematic review adheres to the recommendations by the Preferred Reporting Items for Systematic Reviews and Meta-Analysis (PRISMA) statement,15 and it was registered with the International Prospective Register of Systematic Reviews (PROSPERO) (CRD42022304107).
Eligibility criteria
All details on inclusion and exclusion criteria are provided in Table 1. We included longitudinal studies with the stated a priori intention of developing a new multivariable CPM (henceforth simply referred to as CPM) for predicting any patient-centered outcome for individuals with TSCI. Studies reporting results for individuals with nontraumatic SCI (NTSCI), a heterogeneous TSCI and NTSCI population, or where the etiology was not reported were excluded. We also omitted case-control studies and cross-sectional studies as these are inappropriate study designs for prognostic model development.16,17 Case series, case reports, qualitative studies, comments, and animal studies were also excluded. Although reviews were not included, their reference lists were used to validate the search strategy.
Table 1.
Inclusion and exclusion criteria for selecting studies
| Exclusion criteria | Description |
|---|---|
| Preprints and other non-peer-reviewed studies | |
| Publications lacking full access; abstracts for conferences | |
| Animal studies | |
| Patient population: pediatric population; nontraumatic spinal cord injury (NTSCI) | NTSCI occurs when an acute or chronic disease process, such as a tumor, inflammation, vascular disease, infection, or degenerative disc disease, generates the primary injury. NTSCI is out of scope in the context of the study's research objectives. |
| Study design: case-control studies, cross-sectional studies, case series, case reports, qualitative studies, comments, reviews | |
| Process outcomes | For example, hospital length of stay |
| Types of prognostic research other than prediction modeling studies: predictor finding studies or prediction model impact studies | These types of prognostic research do not primarily aim to develop statistical models that predict individual risk of a future outcome. |
| Etiologic research | Research aiming to determine the presence or absence of a presumed causal relationship between a putative risk factor and a specific clinical condition. Etiological research explains the cause of an outcome, i.e., whether an outcome can be reliably attributed to a particular risk factor, possibly with adjustment for confounders using a multivariable approach. There are similarities in the design and analysis of prognostic and etiologic studies (e.g., multivariable statistical modeling), but predicting outcomes is distinct from explaining their cause. |
| Inclusion | Description |
| Peer-reviewed publications; full-text articles | |
| English language | |
| Human studies | |
| Patient population: adult traumatic spinal cord injury | |
| Study design: prospective or retrospective cohort study; randomized controlled trials | A cohort study is the best design to answer prognostic questions, and a prospective study is preferable to a retrospective study, although retrospective studies dominate the literature. Prognostic models derived from randomized trials have limited generalizability but may still be used for prognostic research. |
| Patient-centered outcomes | Clinical prediction models applicable to daily practice are of most use if they focus on patient-centered outcomes, e.g., occurrence or remission of disease, death, complications, tumour growth, pain, treatment response, or quality of life. |
| Prognostic research type: prognostic model research | Also referred to as prediction modeling studies. Studies on multivariable models intended to make prognostic predictions in individuals. Only studies developing new prediction models were considered. |
Eligibility criteria were based on the different categories of prognostic research outlined earlier.4 Only prognostic model studies, also referred to as prediction modelling studies, were considered. A prediction model is a formal combination of multiple predictors from which risks of a specific endpoint or outcome can be calculated for individual patients.6 Therefore, the prediction model is multivariable in nature (combining more than two variables), and the data must be analyzed using techniques suitable for model development.7 A key, and sometimes subtle, distinction is the difference between prognostic factor research (predictor finding studies) and prognostic model research (prediction modelling studies). When unclear, we used the author's description of the study objective to make the distinction between prognostic factor and prognostic model research,18 and we only included studies where the stated aim was the development of a CPM for prognosticating outcomes in individuals with TSCI.
Search strategy
A search of electronic databases was performed followed by supplementary strategies to capture additional relevant articles. Prediction modelling studies touch on topics at the intersection of medicine and advanced computational techniques, therefore we selected databases to cover literature from a broad spectrum of research topics including clinical and biomedical sciences, as well as computer and engineering sciences. The electronic databases identified to be relevant to the research question were MEDLINE, PubMed, EMBASE, Scopus, and IEEE. On August 31, 2021, these databases were searched with a combined indexed term (where applicable) and free-text search approach for English articles, with no date restrictions (i.e., from database inception).
The search query was developed on Ovid MEDLINE and translated to the remaining databases. Search terms were selected to capture three main concepts: (1) TSCI, (2) prediction models, and (3) modeling techniques. We used prior studies and established frameworks describing prognostic research and prognostic model development to select appropriate terms.5,16,17 In prognostic studies, “prediction models” are also commonly referred to as “prognostic models,” “prediction rules,” or “risk scores” in the literature.5 Moreover, although “multivariate” and “multivariable” can hold distinct meanings, they are often used interchangeably.19 These are some of the key synonyms reflected in the search strategy. The full search performed on Ovid MEDLINE is provided in Table 2.
Table 2.
Search query performed on Ovid MEDLINE(R)
| # | Searches | Results |
|---|---|---|
| 1 | Prognosis/ | 546,396 |
| 2 | (predict* adj2 model*).ti,ab. | 114,531 |
| 3 | (predict* adj2 rule*).ti,ab. | 3320 |
| 4 | (prognost* adj2 model*).ti,ab. | 7259 |
| 5 | (risk* adj2 score*).ti,ab. | 30,440 |
| 6 | (prognost* adj2 rule*).ti,ab. | 86 |
| 7 | 1 or 2 or 3 or 4 or 5 or 6 | 681,936 |
| 8 | Spinal Cord Injuries/ | 39,856 |
| 9 | (trauma* adj2 spinal cord injur*).tw. | 3253 |
| 10 | 8 or 9 | 40,668 |
| 11 | Multivariate Analysis/ | 129,547 |
| 12 | Regression Analysis/ | 132,282 |
| 13 | (multi* adj2 (analys* or model*)).ti,ab. | 465,453 |
| 14 | (regression* adj2 (analys* or model*)).ti,ab. | 499,208 |
| 15 | 11 or 12 or 13 or 14 | 973,810 |
| 16 | 7 and 10 | 1029 |
| 17 | 7 and 10 and 15 | 144 |
| 18 | (“21377202” or “31455175” or “27327967” or “28716636”).ui. | 4 |
| 19 | 17 and 18 | 4 |
| 20 | Machine Learning/ | 17,503 |
| 21 | machine learning.ti,ab. | 42,944 |
| 22 | (ML or MLA).ti,ab. | 806,290 |
| 23 | 20 or 21 or 22 | 850,212 |
| 24 | 15 or 23 | 1,775,602 |
| 25 | 7 and 10 and 24 | 160 |
For all included studies, reference lists were manually searched to identify additional studies that meet the inclusion criteria and to build a more complete data set.
Selection of studies
The results of the search from all databases were imported into Covidence (Veritas Health Innovation, Melbourne, Australia) for automatic duplicate removal and overall systematic review management (i.e., primary screening, secondary screening, and data extraction). Two reviewers independently screened article titles and abstracts for relevance to the research question and to confirm inclusion and exclusion criteria. Discrepancies were resolved through discussion by reviewers to reach consensus, and a third reviewer was consulted to reach a final decision when necessary.
All articles deemed to be relevant from the initial screen, or for which the relevance could not be ascertained from the title and abstract alone, were included into full-text screening for a secondary review of eligibility and methodological quality assessment.
Risk of bias assessment
To critically examine included studies, we adopted the guidelines described in PROBAST (Prediction model Risk Of Bias ASsessment Tool)16 to assess the risk of bias (ROB) and applicability of prediction modelling studies that were included after full-text screening confirmed their eligibility.
PROBAST provides an approach to identify potential ROB by considering four domains of study design: participants, predictors, outcome, and analysis. Each domain is judged as being low, unclear, or high ROB based on answers to a series of signalling questions. Two reviewers piloted the tool on a sample of 10 included studies and agreed to give an overall high-risk judgement for a study if more than two domains were deemed high risk, as low if one domain or less was judged as low risk, and as unclear if any of the four domains were deemed to have unclear ROB. The PROBAST tool was then applied in duplicate to each included study, and discrepancies in overall ROB were resolved through discussion to achieve consensus. Studies that initially passed full-text screening but were deemed to have a high overall ROB (i.e., more than two domains rated high ROB) were subsequently excluded.
The PROBAST tool was also applied to assess the applicability of each included study, using the signalling questions to verify that the described prognostic model was applicable for its intended use in the target population. Any study rated to have a domain with high concern for applicability was reassessed for inclusion according to the eligibility criteria and subsequently was excluded if agreed by both reviewers.
Data extraction
We extracted data related to model development for all CPMs described in included studies. For studies reporting more than one CPM, distinct CPMs were extracted by selecting those with a unique outcome or unique set of predictors, unless the authors explicitly adopted one model over another; in which case, only the preferred model was included. Our data extraction strategy was developed by drawing elements from the CHARMS (CHecklist for critical Appraisal and data extraction for systematic Reviews of prediction Modelling Studies) framework (details of data items are provided in eTable 1).17 The total number of candidate predictors considered in each study was recorded using the reported number when available or by deduction using the available information when necessary.
Our data extraction strategy expanded on the CHARMS framework in several ways. First, we recorded whether studies adhered to the TRIPOD (Transparent Reporting of a multivariable prediction model for Individual Prognosis Or Diagnosis) guidelines.20 Second, we drew insights from Malley et al. on preparing raw clinical data for secondary statistical analysis to guide our categorization of methods used to handle predictors and missing data during model development analysis.21 Lastly, we extended on the extraction of information regarding predictor selection during model development. The CHARMS framework distinguishes between two sequential phases of predictor selection: (1) selection of predictors for inclusion in multivariable modelling, and (2) selection of predictors during multivariable modelling. We added to this by collecting data on a phase of predictor selection that precedes both, whereby authors describe the reasons for choosing an initial set of candidate predictors (e.g., expert opinion, reference to previous literature, etc.). Reasons for selecting predictors were identified iteratively throughout data extraction. Moreover, we pre-defined a set of options for categorizing the methods used for selection of predictors during multivariable modelling: backward elimination, forward elimination, stepwise selection (backward or forward), all-possible/best subset selection, LASSO, and other.7,22,23
The preliminary data extraction sheet based on the CHARMS framework was implemented on an Excel spreadsheet and piloted on five studies by both reviewers. Results from the pilot were reviewed, and the data extraction sheet was refined to include elements that more specifically addressed our objectives. With the final data extraction sheet, one reviewer extracted all relevant data from the included studies, and a second reviewer verified the extracted data. Differences were resolved through discussion until consensus was achieved.
Data synthesis
Data were arranged in tabular format and discussed narratively, using descriptive statistics where appropriate. We also evaluated the consistency for which a predictor was deemed to hold significant predictive value according to the classification scheme displayed in Figure 1.
Figure 1.

Classification scheme for evaluating the consistency for which a predictor was deemed to hold significant predictive value across the 21 included studies.
Results
Search results
The search and study selection flow diagram, including reasons for exclusion of full-text studies, are shown in Figure 2. After title and abstract screening, subsequent full-text review for eligibility, and risk of bias assessment of eligible studies, we included 21 prediction modelling studies consisting of the development of 33 unique CPMs for prognosticating patient-centered outcomes in TSCI.24–44
Figure 2.

PRISMA flow diagram depicting the study selection protocol. CPM = clinical prediction model; ROB = risk of bias.
Risk of bias assessment and reporting of included studies
None of the 21 studies included for data extraction were rated to be low ROB in all domains. Specifically, all studies were deemed high ROB in the Data Analysis domain, commonly due to inappropriate handling of enrolled participants in the analysis (signalling question 4.3), evaluation of relevant model performance measures (signalling question 4.7), and accounting for model overfitting and optimism in model performance (signalling question 4.8).45 Full details on the ROB for each domain for all included studies are provided in Table 3. In total, 9.5% (2/21) of studies claimed adherence to the TRIPOD reporting guidelines.34,35
Table 3.
Results from PROBAST risk of bias assessment of included studies
| Study author | Risk of bias | Overall assessment | |||
|---|---|---|---|---|---|
| Participants | Predictors | Outcome | Analysis | ||
| Ariji et al. | + | + | - | - | + |
| Belliveau et al. | + | + | + | - | + |
| DeVries et al. | + | + | + | - | + |
| Elliott et al. | + | + | - | - | + |
| Engel-Haber et al. | + | + | + | - | + |
| Facchinello et al. | + | + | + | - | + |
| Fallah et al. | + | + | + | - | + |
| Hicks et al. | + | + | + | - | + |
| Hupp et al. | + | + | + | - | + |
| Kaminski et al. | + | + | + | - | + |
| Pavese et al. (2016) | + | + | + | - | + |
| Pavese et al. (2019) | + | + | + | - | + |
| Richard-Denis et al. | + | + | + | - | + |
| Shibahashi et al. | + | + | + | - | + |
| Tanadini et al. | + | + | + | - | + |
| van Middendorp et al. | + | + | + | - | + |
| Wilson et al. (2012; [40]) | + | + | + | - | + |
| Wilson et al. (2012; [41]) | + | + | + | - | + |
| Winchester et al. | - | + | + | - | + |
| Xie et al. | + | - | + | - | + |
| Zhao et al. | - | + | + | - | + |
| Legend | + | Low risk of bias | |||
| - | High risk of bias | ||||
Note: PROBAST = Prediction model Risk Of Bias Assessment Tool.
Data source, study design, and model development
The 21 studies reported data on TSCI study participants where the median of samples was 377, and the range was 30 to 6827 (Table 4). The mean age ranged from 38.3 to 60.1, and the proportion of female participants ranged from 18.8% to 43.8%. For the 17 studies that reported American Spinal Injury Association Impairment Scale (AIS) grade in the acute period following injury, the mean proportions were 43.3%, 11.8%, 16.2%, and 28.7% for AIS grades A, B, C, and D, respectively. We summarize details of the data source, study design, and model development of these studies in Tables 4, 5, and 6, categorized by the type of outcome being predicted.
Table 4.
Participant characteristics from included studies
| Study authors, year | Sample size (participants with outcome) | Mean age (SD) | Female, % | Level of injury | Severity of injury (acute period) | Follow-up duration | |||
|---|---|---|---|---|---|---|---|---|---|
| AIS A | AIS B | AIS C | AIS D | ||||||
| Functional outcome | |||||||||
| Ariji et al., 2020 | 137a (N/A) | 60.1 (16.0) | 19.70 | 114 with tetraplegia; 23 with paraplegia | 49 | 19 | 44 | 25 | 6 mo ± 2 wk |
| Belliveau et al., 2016 | 3097 (variable) | 41.5 (17.1) | 20 | NR | 1276 | 406 | 585 | 830 | 1 yr after hospital discharge |
| DeVries et al., 2020 | 862 (562) | Mean NR; 16.7% ≥65 years of age | 23.30 | NR | 257 | 77 | 149 | 379 | ≥12 mo |
| Elliot et al., 2018 | 4327 (1333) | 40.3 (17.5) | 19.90 | Lowest sensory level: 2325 (47.3%) cervical; 1813 (36.9%) thoracic; 592 (12.0%) lumbar; 185 (3.8%) sacral. | 1831 | 656 | 792 | 1636 | 1 yr after injury |
| Engel-Haber et al., 2020 | 639 (303) | 43 (17) | 21 | 378 (59%) with tetraplegia (C1-C8) | 210 | 74 | 126 | 229 | 1 yr after injury |
| Facchinello et al., 2017 | 172 (N/A) | 48.9 (18.0) | NR | 28.5% high cervical (C1–C4); 37.8% low cervical (C5–T1); 13.4% thoracic (T2–T10); 20.3% thoracolumbar (T11–L2) | 68 | 17 | 25 | 62 | 1 yr after injury (n=125); 6 mo after injury if data missing (n=47) |
| Hicks et al., 2017 | 278 (123) | 44(18) | 20.5 | NR | 113 | 30 | 55 | 74 | 1 yr after injury |
| Hupp et al., 2018 | 224 (31) | 46.0 (NR) | 18.8 | Tetraplegic TSCI patients only, 6 (2.7%) Cl, 9 (4.0%) C2, 26 (11.6%) C3, 80 (35.7%) C4, 56 (25.0%) C5, 29 (13.0%) C6, 14 (6.3%) C7, 1 (0.5%) C8, 1 (0.5%) Tl, 2 (0.9%) not testable | 53b | 29 | 41 | 98 | 6 mo (n=199); 1 yr if data missing (n=25) |
| Kaminski et al., 2017 | 76 (N/A) | 43 (18) | 23.7 | 35 (46.1%) C1-C7, 41 (53.9%) Tl-Ll | 40 | 8 | 7 | 20 | 1 yr after injury |
| Pavese et al., 2016 | 1250 (398) | 42.5 (17.6) | 20.3 | 617 (49.4%) C1-C8; 451 (36.1%) T1-T12; 147 (11.8%) L1-L5; 2 (0.2%) S1-S5; 33 (2.6%) not testable | 556 | 140 | 192 | 341c | 1 yr after injury |
| Pavese et al., 2019d | 1250 (725) | 42.5 (17.6) | 20.3 | 617 (49.4%) C1-C8; 451 (36.1%) T1-T12; 147 (11.8%) L1-L5; 2 (0.2%) S1-S5; 33 (2.6%) not testable | 556 | 140 | 192 | 341 | 1 yr after injury |
| Richard-Denis et al., 2018 | 88 (N/A) | 42.1 (16.5) | 19.3 | 19.3% high tetraplegia (C1-C4); 29.5% low tetraplegia (C5-T1); 11.4% high paraplegia (T2-T7); 39.8% low paraplegia (T8-L1) | 65e | 23e | 6 mo after injury | ||
| van Middendorp et al., 2011 | 492 (200) | 44(17) | 21 | 271 (55%) with tetraplegia (C1-C8) | 240 | 66 | 76 | 110 | 1 yr after injury (n=374); 6 mo after injury if data missing (n=118) |
| Wilson et al., 2012 (5) | 376 (148) | 43.2 (16.9) | 21.8 | NR | 136 | 63 | 58 | 119 | 1 yr after injury; 6 mo after injury if data missing |
| Winchester et al., 2009 | 30 (N/A) | 38.3 (13.6) | 26.7 | NR 23 (76.7%) with tetraparesis; 7 (23.3%) with paraparesis | NR Only patients with AIS C and D enrolled. | After 36 sessions of locomotor training (3-mo period). Patients only enrolled if duration of injury was ≤ 60 months. | |||
| Neurological outcome | |||||||||
| Tanadini et al., 2014 | 103 (outcome 1); 122 (outcome 2) | NR | NR | Only C4-C6 cervical NLI | Only sensorimotor complete (AIS A) patients | 6 mo after injury (outcome 1) or 1 yr after injury (outcome 2) | |||
| Zhao et al., 2020 | 377 (205) | 46.05 (17.93) | 43.8 | Only cervical NLI (Cl-Tl) | 129 | 61 | 72 | 115 | 6 mo after injury |
| Survival | |||||||||
| Fallah et al., 2021 | 849 (68, 45)f | 46.3 (19.8) | 22.9 | 282 (33.8%) high cervical (C1-C4); 276 (33.1%) low cervical (C5-T1); 112 (13.4%) thoracic (T2-T10); 150 (18%) thoracolumbar (T11-L2) | 324 | 93 | 157 | 250 | In-hospital period and 1 yr after SCI |
| Shibahashi et al., 2019 | 6827 (415g) | Median (IQR): 63 (49-73)g | 21.3g | 6147 (83%) cervical; 643 (9%) thoracic; 520 (7%) lumbar; 55 (1%) cauda equinag | 1563 (21%) complete cord syndrome; 5802 (79%) incomplete cord syndromeh | In-hospital period; specific duration NR. | |||
| Other | |||||||||
| Wilson et al., 2012 (6) | 411(160) | 44.4 (17.0) | 25.1 | Only cervical NLI (C2-T1) | 144 | 66 | 86 | 115 | During acute hospitalization period; mean time from admission to discharge 34.3 ± 54.6 days. |
| Xie et al., 2021 | 162 (25) | 58.9 (12.5) | 24.7 | Only cervical NLI (C1-C7) 66 (40.7%) C1-C4; 96 (59.3%) C4-C7 | 28 | 134 | During initial hospitalization; time period NRi | ||
Note: AIS = American Spinal Injury Association Impairment Scale; IQR = interquartile range; mo = month; NLI = neurological level of injury; NR = not reported; wk = week; yr = year.
Ariji et al., 2020: 4 outliers excluded to reduce sample to 133 after initial model development.
Hupp et al., 2018: AIS grade in 3 patients not testable.
Pavese et al., 2016: 3 patients (0.2%) AIS E; 18 patients (1.4%) not testable.
Pavese et al., 2019: The same retrospective cohort described in Pavese et al., 2016 is used for model development.
Richard-Denis et al., 2018: AIS A/B and AIS C/D are grouped together.
Fallah et al., 2021: 68 patients with 1-year mortality; 45 patients with in-hospital mortality.
Shibahashi et al., 2019: Based on 7365 patients before exclusion for multivariable modelling.
Shibahashi et al., 2019: AIS not used. Severity of injury grouped as complete cord syndrome or incomplete cord syndrome.
Xie et al., 2021: Median time of acute respiratory failure onset was 3 days after injury.
Table 5.
Data source of included studies
| Study authors, year | Location | Source | Setting | Missing data |
|---|---|---|---|---|
| Functional outcome | ||||
| Ariji et al., 2020 | Spinal injuries center in Fukuoka, Japan | Registry data; January 2012 - October 2018 | Hospital specializing in spine and SCI | Complete-case analysis |
| Belliveau et al., 2016 | SCIMS | Registry data; 2010-2014 | Inpatient rehabilitation | Complete-case analysis |
| DeVries et al., 2020 | RHSCIR | Registry data; 2004-2017 | Acute care and rehabilitation | Complete-case analysis |
| Elliot et al., 2018 | SCIMS | Registry data; 2007-2016 | Inpatient rehabilitation | Complete-case analysis |
| Engel-Haber et al., 2020 | SCIMS | Registry data; January 2011 - September 2015 | Inpatient rehabilitation | Complete-case analysis |
| Facchinello et al., 2017 | Hôpital du Sacré- Cœur-de-Montréal, Quebec, Canada | Prospective cohort; January 2010 - June 2016 | Level I trauma center specialized in SCI | Complete-case analysis |
| Hicks et al., 2017 | RHSCIR | Registry data; 2004-2014 | Acute care and rehabilitation | Complete-case analysis |
| Hupp et al., 2018 | EM-SCI | Registry data; July 2001 - October 2015 | Rehabilitation centres | Complete-case analysis |
| Kaminski et al., 2017 | NR | Prospective cohort; April 2010 - November 2013 | Level I trauma center specialized in SCI | Multiple imputation analysis |
| Pavese et al., 2016 | EM-SCI | Registry data; July 2001 - December 2012 | Rehabilitation centers | Complete-case analysis A weighting approach to correct for missing data |
| Pavese et al., 2019a | EM-SCI | Registry data; July 2001 - December 2012 | Rehabilitation centers | Complete-case analysis A weighting approach to correct for missing data |
| Richard-Denis et al., 2018 | NR | Prospective cohort; January 2010 - February 2015 | Level I trauma center specialized in SCI | Complete-case analysis |
| van Middendorp et al., 2011 | EM-SCI | Registry data; July 2001 - June 2008. | Rehabilitation centers | Complete-case analysis |
| Wilson et al., 2012 [40] | Combined data from the North American Clinical Trials Network for SCI database and the STASCIS database; hospitals at six institutions throughout North America. | Registry data; August 2002 - September 2009 | Hospital setting | Complete-case analysis (for predictor and outcome data) Multiple imputation procedure |
| Winchester et al., 2009 | Spinal Cord Injury Laboratory at The University of Texas Southwestern Medical Center at Dallas, United States | Registry data; study period NR | Outpatient SCI laboratory | Complete-case analysisb |
| Neurological outcome | ||||
| Tanadini et al., 2014 | EM-SCI | Registry data; study period NR | Rehabilitation centers | Complete-case analysis |
| Zhao et al., 2020 | Huashan Hospital of Fudan University | Registry data; December 2008 - May 2018 | Neurosurgery department in a tertiary center | Complete-case analysisc |
| Survival | ||||
| Fallah et al., 2021 | Vancouver General Hospital Acute SCI Unit; part of RHSCIR | Registry data; July 2004 - September 2016 | Acute SCI center | Complete-case analysis |
| Shibahashi et al., 2019 | Japan Trauma Data Bank; 260 emergency hospitals in Japan | Registry data; 2004-2015 | Emergency hospitals | Complete-case analysis Pairwise deletion method |
| Other | ||||
| Wilson et al., 2012 (6) | STASCIS | Registry data; 2002-2009 | Trauma center - acute inpatient setting. | Complete-case analysis |
| Xie et al., 2021 | Qingdao Municipal Hospital | Registry data; January 2014 - September 2020 | Acute care center | Complete-case analysis |
Note: EM-SCI = European Multicenter Study on Human Spinal Cord Injury database, 19 European SCI centers; NR = not reported; RHSCIR = Rick Hansen Spinal Cord Injury Registry, 18 acute care and 14 rehabilitation hospitals across Canada; SCI = spinal cord injury; SCIMS = National Spinal Cord Injury Model Systems Database, 14 centres across United States; STASCIS = Surgical Timing in Acute Spinal Cord Injury Study data registry, six North American trauma centers.
Pavese et al., 2019: The same retrospective cohort described in Pavese et al., 2016 is used for model development.
Winchester et al., 2009: Complete-case analysis was inferred. Handling of missing data was not described.
Zhao et al., 2020: Complete-case analysis assumed. Handling of missing data was not described.
Table 6.
Model development details from included studies
| Study authors, year | Distinct models, n | Outcome definition | Methods | Predictors | |||||
|---|---|---|---|---|---|---|---|---|---|
| Candidate predictors | Final predictors | ||||||||
| N | Reasons for initial selection of predictors | Methods for predictor selection for inclusion in modelling | Timing of predictor measurement | N | Methods for predictor selection during modelling | ||||
| Functional outcome | |||||||||
| Ariji et al., 2020 | 1 | SCIM total score representing ADL competency 6 mo after injury | Linear regression modelling | 153 | Author choice, convenience in clinical setting, simplicity of model | All candidate predictors | 4 wk ± 3 d | 6 | All possible/best subset selection; Stepwise (backward) selection |
| Belliveau et al., 2016 | 16 |
|
Artificial neural networks; logistic regression modelling | 14 | Reference to literature | All candidate predictors (ANN models), candidate predictors limited to same variables used for ANN (LR models) | <9 wk after injury | 9 | All possible/best subset selection |
| DeVries et al., 2020 | 2 | Functional ambulation assessed by FIM locomotion component | Unsupervised machine learning algorithm (unsupervised k-means clustering); logistic regression modelling | 17 | Reference to literature | Principal component analysis | 0-15 d after injury | 17 | Full model approach |
| Elliot et al., 2018 | 1 | Volitional voiding based on patient self-report to a standard follow-up question. All other forms of bladder management were considered nonvolitional. | Logistic regression modelling | 6 | Author choice, reference to literature | All candidate predictors | Discharge from inpatient rehabilitation; time period NR. | 4 | Full model approach |
| Engel-Haber et al., 2020 | 2 | Independent ambulatory ability 1 yr after injury defined by FIM locomotion component | Logistic regression modelling | 5 | Reference to literature | All candidate predictors | 0-15 d after injury | 5 | Full model approach |
| Facchinello et al., 2017 | 2 | Functional outcome quantified by total SCIM (SCIM-III) score (0-100) | Classification and regression tree analysis | 11 | Reference to literature | All candidate predictors (full model); pre-selection based on author choice (simplified model) | During acute hospitalization; time period NR. | 4 | Other - regression tree splitting rule |
| Hicks et al., 2017 | 1 | Independent ambulatory ability 1 yr after injury defined by FIM locomotion component | Logistic regression modelling | 5 | Reference to literature | All candidate predictors | 0-15 dafter injury | 3 | Full model, stepwise selection |
| Hupp et al., 2018 | 2 | Presence of a SCIM (SCIM-II & III) score of 100 | Logistic regression modelling | 9 | Author choice, reference to literature | All candidate predictors | 16-40 d after injury when available; 0-15 d after injury if missing | 5 | Stepwise selection (with bootstrap resampling) |
| Kaminski et al., 2017 | 1 | SCIM (SCIM-III) total score (range: 0-100) | Linear regression modelling | 12 | Reference to literature | All candidate predictors | Early acute period (at arrival to the hospital prior to surgery); time period NR. | 4 | Stepwise (forward) selection |
| Pavese et al., 2016 | 2 | Bladder function - urinary continence and complete bladder emptying assessed by SCIM (SCIM-II & III) item 6 | Logistic regression modelling | 182 | Reference to literature | All candidate predictors | 16-40 d after injury when available (n=1195); 0-15 d after injury if missing (n=5) | 3 | Stepwise (forward) selection |
| Pavese et al., 2019a | 2b | Bowel function - independent bowel management, with reliable bowel movements and continence assessed by SCIM (SCIM-II & III) item 7 | Logistic regression modelling | 182 | Reference to literature | All candidate predictors | 16-40 dafter injury when available (n=1195); 0-15 d after injury if missing (n=5) | 1 | Stepwise (forward) selection |
| Richard-Denis et al., 2018 | 2 | SCIM (SCIM-III) total score (range: 0-100) | Linear regression modelling | 16 | Reference to literature | Pre-selection based on univariable analysis | During acute hospitalization; time period NR | 4 | Full model approach |
| van Middendorp et al., 2011 | 1 | Independent ambulatory ability 1 yr after injury defined by the SCIM indoor mobility item | Logistic regression modelling | 17 | Reference to literature, convenience in clinical setting | All candidate predictors | 0-15 d after injury | 5 | All possible/best subset selection, convenience in clinical setting, simplicity of model |
| Wilson et al., 2012 [40] | 2 |
|
Linear regression modelling for primary (continuous) outcome; logistic regression modelling for secondary (binary) outcome | 4 | Reference to literature | Author consensus, reference to literature, convenience in clinical setting | <3 d after injury | 4 | Full model approach |
| Winchester et al., 2009 | 1 | Locomotor recovery after body weight–supported treadmill training (BWSTT); assessed by over ground walking speed using the 10-m walking test. | Linear regression modelling | 10 | Author choice, reference to literature | All candidate predictors | Initial evaluation upon admission to rehabilitation; time period NR. | 4 | Stepwise selection |
| Neurological outcome | |||||||||
| Tanadini et al., 2014 | 2 |
|
Unbiased recursive partitioning technique - conditional inference tree (URP-CTREE) | 10 | Author choice, reference to literature | All candidate predictors | 0-15 d after injury | 2 | LASSO, Other - sequential tests of independence between predictors and outcomes |
| Zhao et al., 2020 | 2 | Ordinal change in AIS grade at follow-up | Logistic regression modelling | 10 | Author choice, reference to literature, biological plausibility | All candidate predictors (full model); pre-selection based on author choice (simplified model) | Admission <6 hr after injury; time period for assessment NR. | 10 Stepwise (forward) selection | |
| Survival | |||||||||
| Fallah et al., 2021 | 1 | Mortality in the acute (in-hospital) and longterm (1-yr) period | Machine learning techniques; weighting procedure used to assign points for each predictor; Cox regression model for categorical predictors; neural networks and decision trees for continuous variables | 12 | Reference to literature, expert opinion, availability in study database | Pre-selection based on univariable analysis | Acute period after injury; time period NRc | 11 | LASSO |
| Shibahashi et al., 2019 | 1 | In-hospital mortality | Logistic regression modelling | 12 | Author choice, biological plausibility | All candidate predictors | Initial hospitalization. Time period NR. | 8 | Full model approach |
| Other | |||||||||
| Wilson et al., 2012 [41] | 1 | Occurrence of ≥ 1 complication events during the acute inpatient hospital period | Togistic regression modelling | 7 | Reference to literature, availability in study database | Pre-selection based on univariable analysis, author consensus | <24 hr after injury | 5 | Backward elimination |
| Xie et al., 2021 | 1 | Onset of acute respiratory failure | Togistic regression modelling | 27 | Author choice, reference to literature, biological plausibility, convenience in clinical setting | Pre-selection based on univariable analysis | Upon admission, <48 hr after injury | 5 | Stepwise (forward) selection |
Note: ADL = activities of daily living; AIS = American Spinal Injury Association Impairment Scale; d = day; FIM = Functional Independence Measure; hr = hours; mo = month; NR = not reported; SCIM = Spinal Cord Independence Measure; wk = week; yr = year.
Pavese et ak, 2019: The same retrospective cohort described in Pavese et ak, 2016 is used for model development.
Pavese et ak, 2019: Two models developed (full and simplified versions). Only the simplified version is recommended based on performance in an external validation cohort.
Fallah et ak, 2021: Predictor assessment can be assumed to be in the acute period <15 d after injury, similar to other published studies using RHSCIR data.
Model development was based on prospective cohort data in 14.3% (3/21) of studies and on registry data for the remaining 85.7% (18/21). In total, 38.1% (8/21) were single-center studies and 61.9% (13/21) were multicenter studies. The majority (92.3%, n = 12) of multicenter data sources were SCI-specific registries. These were the Surgical Timing in Acute Spinal Cord Injury Study (STASCIS) data registry in the United States (n = 2), the Rick Hansen Spinal Cord Injury Registry (RHSCIR) in Canada (n = 2), the National Spinal Cord Injury Model Systems database in the United States (n = 3), and the European Multicenter Study on Human Spinal Cord Injury (EM-SCI) database in multiple countries across Europe (n = 5). Participant data were derived from a variety of clinical settings, with specialized tertiary or quaternary care centers (33.3%, n = 7) and rehabilitation centers (42.9%, n = 9) being the most frequent. The remaining were general hospitals, mixed, or other (23.8%, n = 5).
In nearly all studies (95.2%, n = 20), complete-case analysis was used for handling missing data (Table 5). Multiple imputation analysis was the primary method for handling missing data in one study.33
A variety of model development methods were used across the 21 studies, ranging from traditional statistical techniques to advanced machine learning methods. Four studies used more than one technique. Overall, logistic regression was used in 14 studies, linear regression in five studies, Cox regression in one study, and machine learning techniques (e.g., artificial neural networks, k-means clustering) in five studies.
Among the five studies that used machine learning techniques, the specific analytic approaches varied. Belliveau et al. used artificial neural networks, and divided 80% of the dataset for “network training” and the remaining 20% for cross-validation.25 DeVries et al.26 used an unsupervised machine learning algorithm and assessed K-means cluster stability through resampling the dataset 2000 times to compute the Jaccard similarities to the original cluster. Facchinello et al.29 used regression trees and applied 10-fold cross validation, in which the dataset is divided into 10 subgroups, nine of which are used for model training and the last one for model validation. Tanadini et al.38 applied conditional inference trees (an unbiased recursive partitioning technique) to their whole dataset and applied resampling techniques to establish prediction accuracy. Fallah et al.30 applied machine learning techniques to identify nonlinear associations between predictors and their outcome, and also used 10-fold cross validation.
Final models in included studies
Overall, there were 33 unique CPMs: 10 studies reported one final CPM and the other 11 reported more than one (range, 2 to 16 models; see Table 7).
Table 7.
Finals models from included studies
| Study author, year ± model specification | Final predictors | Outcome | Time interval | Validation | Performance metrics | Model presentation |
|---|---|---|---|---|---|---|
| Ariji et al., 2020 | Age at injury, three key muscles (C6, wrist extensors; C8, finger flexors; and L3, knee extensors), SCIM item 13 and WISCI (6 predictors) | ADL competency | 6 mo ± 2 wk | Internal validation - bootstrapping | Adjusted R-squared: 0.83, F-statistic vs. constant model: 111 .5, p < 0.001 | Regression formula |
| Belliveau et al., 2016 (1) - ANN used to model 3 ambulation outcomes | Age at injury; motor scores for L2, L3, S1 myotomes (4 predictors) | Independent walking ability | 1 year posthospital discharge | Internal validation - cross- validation | Summary of performance across 3 models: >85% case classification accuracy; AUCs between 0.86-0.90; CIs NR | Models not presented |
| Belliveau et al., 2016 - ANN used to model 5 nonambulation self-care outcomes | Included: sex, age, upper extremity motor score and lower extremity motor score, and motor scores at C5, C6, C7, C8, Tl, L2, L3, and SI myotomes (range: 5-9 predictors) | Independence in selected self-care activities | 1 year posthospital discharge | Internal validation - cross- validation | Summary of performance across 5 models: 76%-86% case classification accuracy; AUCs between 0.70-0.82; CIs NR | Models not presented |
| Belliveau et al., 2016 - LR used to model 3 ambulation outcomes | Age at injury; motor scores for L2, L3, S1 myotomes (4 predictors) | Independent walking ability | 1 year posthospital discharge | NR | Summary of performance across 3 models: >86% case classification accuracy; AUCs between 0.86-0.88; CIs NR | Models not presented |
| Belliveau et al., 2016 - LR used to model 5 nonambulation self-care outcomes | Included: sex, age, upper extremity motor score and lower extremity motor score, and motor scores at C5, C6, C7, C8, Tl, L2, L3, and S1 myotomes. (range: 5-9 predictors) | Independence in selected self-care activities (bed- chair transfers, bladder & bladder management, eating and toileting) | 1 year posthospital discharge | NR | Summary of performance across 5 models: 76%-86% case classification accuracy; AUCs between 0.70-0.78; CIs NR | Models not presented |
| DeVries et al., 2020 - LR model | Age at injury, AIS grade, ISNCSCI muscle motor scores from L2-S1 myotomes (highest of either limb), and sensory light touch and sensory pinprick scores from L2-S1 dermatomes (highest of either limb) (17 predictors) | Independent walking ability | 1 year after injury; participants with outcome at discharge were also included | NR | F1-score (95% CI), 0.93 (0.90-0.95); AUC (95% CI), 0.90 (0.88-0.92) | Models not presented |
| DeVries et al., 2020 - unsupervised MLA model | Age at injury, AIS grade, ISNCSCI muscle motor scores from L2-S1 myotomes (highest of either limb), and sensory light touch and sensory pin prick scores from L2-S1 dermatomes (highest of either limb) (17 predictors) | Independent walking ability | 1 year after injury; participants with outcome at discharge were also included | NR | F1-score (95% CI), 0.89 (0.87–0.91); AUC (95% CI), 0.89 (0.87–0.91) | Models not presented |
| Elliot et al., 2018 | Lower extremity motor score, age, gender, degree of sacral sparing and sensory level (5 predictors) | Volitional bladder voiding | 1 year after injury | NR | AUC 0.932, CIs NR | Results of multivariate analyses reported (odds ratio and 95% CI) |
| Engel-Haber et al., 2020 - five-variable model | Age, motor scores at L3 and S1 myotomes, light touch sensation scores at L3 and S1 dermatomes (5 predictors) | Independent walking ability | 1 year after injury | NR | AUC (95% CI), 0.929 (0.910 - 0.949) | Regression formula and point score chart |
| Engel-Haber et al., 2020 - three- variable model | Age, motor score at L3, light touch sensation score at S1 dermatome (3 predictors) | Independent walking ability | 1 year after injury | NR | AUC (95% CI), 0.927 (0.907-0.947) | Regression formula and point score chart |
| Facchinello et al., 2017 - full model | AIS gradea, NLI, Injury Severity Score, pressure ulcer occurrence (4 predictorsb) | Functional recovery | 12 mo; 6 mo if data missing | Internal validation - cross- validation | R-squared for learning procedures: 0.705; R-squared (standard deviation) for training procedures: 0.632 (0.03) | Regression tree |
| Facchinello et al., 2017 - simplified model | AIS gradea and NLI (2 predictorsb) | Functional recovery | 12 mo; 6 mo if data missing | Internal validation - cross- validation | R-squared for learning procedures: 0.539; R-squared (standard deviation) for training procedures: 0.517 (0.01) | Regression tree |
| Fallah et al., 2021 | Age, AIS, NLI, Abbreviated Injury Scale scores (7), and AOSpine injury morphology (11 predictors) | In-hospital and 1 -yr mortality | In-hospital period and 1 yr after injury | Internal validation - cross- validation External validation / temporal |
|
The SCI Risk Score (SCIRS) point score chart; hypothetical patient scenarios |
| Hicks et al., 2017 | Age, motor score at L3, light touch sensation score at S1 dermatome (3 predictors) | Independent walking ability | 1 yr after injury | Internal validation - cross- validation | AUC (95% CI), 0.866 (0.816- 0.916); goodness of fit assessed via Hosmer-Lemeshow test | Regression formula and point score chart |
| Hupp et al., 2018 - clinical prediction model | Clinical predictors only: Age, ISNCSCI total motor score (2 predictors) | Complete functional recovery | 6 mo; 12 mo if data missing | Internal validation - bootstrapping | AUC (95% CI), 0.936 (0.904-0.968) | Results for multivariate analyses (coefficient, standard error) presented in supplementary tables. |
| Hupp et al., 2018 - clinical + neurophysiological prediction model | Clinical + neurophysiological predictors: Age, ISNCSCI total motor score, motor evoked potential score, somatosensory evoked potential score, nerve conduction study score (5 predictors) | Complete functional recovery | 6 mo; 12 mo if data missing | Internal validation - bootstrapping | AUC (95% Cl), 0.956 (0.930-0.982)c | Results for multivariate analyses (coefficient, standard error) presented in supplementary tables. Also, score chart for electrophysiological examination data. |
| Kaminski et al., 2017 | ISNCSCI total LT score, AIS grade, ISS, and the ISNCSCI total motor score (4 predictors) | Functional recovery | 1 yr after injury | Internal validation - bootstrapping | R-squared, 0.573 | Regression formula |
| Pavese et al., 2016 - full model | Lower extremity motor score, light- touch sensation in the S3 dermatome, and SCIM subscale respiration and sphincter management (3 predictors) | Bladder function - urinary continence and complete bladder emptying | 1 yr after injury | External validation / temporal | AUC (95% Cl), 0.936 (0.922-0.951); calibration plot reported | Regression formula |
| Pavese et al., 2016 - simplified model | Lower extremity motor score (1 predictor) | Bladder function - urinary continence and complete bladder emptying | 1 yr after injury | External validation / temporal | AUC (95% CI), 0.912(0.895–0.930); calibration plot reported | Regression formula |
| Pavese et al, 2019 | ISNCSCI total motor score (1 predictor) | Bowel function - independent bowel management, with reliable bowel movements and continence | 1 yr after injury | External validation / temporal | AUC (95% CI), 0.837(0.815-0.859); calibration plot reported | Regression formula |
| Richard-Denis et al., 2018 - tetraplegia model | AIS grade, occurrence of complications, presence of early spasticity and LOS (4 predictors) | Functional recovery | 6 mo after injury | NR | R-squared=0.671 | Results of multivariate analyses reported (β coefficients with 95% CI) |
| Richard-Denis et al., 2018 - paraplegia model | AIS grade, body mass index, ISS, and presence of early spasticity (4 predictors) | Functional recovery | 6 mo after injury | NR | R-squared=0.548 | Results of multivariate analyses reported (β coefficients with 95% CI) |
| Shibahashi et al., 2019 | Age, sex, Glascow Coma Score on arrival, hypotension on arrival, bradycardia on arrival, severe head injury, ISS, and neurological SCI severityd (8 predictors) | Early (in-hospital) mortality | In-hospital period | NR | AUC (95% CI), 0.88 (0.86–0.90) | Results of multivariate analyses (odds ratio and 95% CI); Kaplan–Meier estimates of survival |
| Tanadini et al., 2014 - outcome 1 | Early (<2 weeks) upper extremity motor score, early (<2 weeks) motor Zone of Partial Preservation (right). (2 predictors | Total bilateral upper extremity motor score | 6 mo after injury | Internal validation - bootstrapping | Root-mean-squared error as a measure of prediction accuracy: 10.36 (95% CI 8.04-12.79). | Visual representation of a conditional tree |
| Tanadini et al., 2014 - outcome 2 | Early (<2 weeks) upper extremity motor score (1 predictor) | Achievement of a 2-motor level improvement within the cervical cord (left or right side) | 12 mo after injury | Internal validation - bootstrapping | Misclassification rate as a measure of prediction accuracy: 24.4 (95% CI 12.5-37.7) | Visual representation of a conditional tree |
| van Middendorp etal. 2011 | Age, motor scores at L3 and S1 myotomes, light touch sensation scores at L3 and S1 dermatomes (5 predictors) | Independent walking | 1 yr after injury; 6 mo if data missing | External validation / temporal | AUC (95% CI), 0.956 (0.936-0.976, p<.0001). | Regression formula |
| Wilson et al., 2012 [40] - primary (continuous) functional outcome | Age, acute AIS grade, acute ISNCSCI total motor score, and intramedullary signal characteristics on the spinal magnetic resonance imaging (4 predictors) | Functional recovery | 1 yr after injury; 6 mo if data missing | Internal validation - bootstrapping | R-squared=0.52d | Regression formula (“predictive model equation”); hypothetical patient scenarios. |
| Wilson et al., 2012 [40] - secondary (binary) functional outcome | Age, acute AIS grade, acute ISNCSCI total motor score, and intramedullary signal characteristics on the spinal magnetic resonance imaging (4 predictors) | Functional independence | 1 yr after injury; 6 mo if data missing | Internal validation - bootstrapping | AUC=0.93d; CIs NR | Regression formula (“predictive model equation”); hypothetical patient scenarios |
| Wilson et al., 2012 [41] | Age, admission AIS grade, energy of injury mechanism, absence of steroid administration, presence of comorbid illness (5 predictors) | Acute complication development | During acute hospitalization period | NR | AUC=0.75; CIs NR | Results of multivariate analyses (odds ratio and 95% CI); hypothetical patient scenarios |
| Winchester et al., 2009 | Time from injury onset (square root), voluntary bowel and bladder voiding, functional spasticity score, and walking speed before locomotor training (4 predictors) | Locomotor recovery after body weight-supported treadmill training | After 36 sessions of locomotor training (3- mo period); patients only enrolled if duration of injury was ≤ 60 mo | External validation - temporal | R-squared=0.783 Calibration reported (scattergram with line of identity) | Regression formula; demonstration for how to use model |
| Xie et al., 2021 | Cervical NLI, AIS grade, hemoglobin, platelet to lymphocyte ratio, neutrophil percentage to albumin ratio (5 predictors) | Onset of acute respiratory failure | During initial hospitalization; time period not specified | Internal validation - bootstrapping External validation - geographical | AUC (95% CI), 0.933 (0.887-0.980) Calibration plot and Hosmer-Lemeshow test (p = .686) indicated good predictive accuracy. | Nomogram; web-based calculator developed for nomogram; hypothetical patient scenarios |
| Zhao et al., 2020 - model A | Age, gender, mechanism of injury, AIS grade at admission, type of injury, coagulation status (6 predictors) | Change in AIS grade | 6 mo after injury | NR | AUC (95% CI), 0.841 (0.798–0.885) | Results of multivariate analyses reported (odds ratio and 95% CI) |
| Zhao et al., 2020 - model B | Age, gender, mechanism of injury, AIS grade at admission, type of injury, coagulation status, white blood cell counts, neutrophil ratio, lymphocyte ratio and neutrophil-to-lymphocyte (10 predictors) | Change in AIS grade | 6 mo after injury | NR | AUC (95% CI), 0.944 (0.923–0.964) | Results of multivariate analyses reported (odds ratio and 95% CI) |
Note: ADL = activities of daily living; AIS = American Spinal Injury Association Impairment Scale; ANN = artificial neural network; AUC = area under the curve; Cl = confidence interval; ISNCSCI = International Standards for Neurological Classification of Spinal Cord Injury; LR = logistic regression; NLI = neurological level of injury; NR = not reported; SCIM = Spinal Cord Independence Measure; WISCI = Walking Index for Spinal Cord Injury
Facchinello et al., 2017: In the full model and simplified model, AIS grade was the most important predictor.
Facchinello et al., 2017: Predictors included as primary splitters in the optimized regression tree.
Hupp et al., 2018: Adding neurohysiological predictors showed a significant increase of the AUC compared to clinical predictors alone (p = .019).
Wilson et al., 2012 (5): average across 10 imputation iterations.
Outcomes were categorized into functional outcome, neurological outcome, survival, and other.14 Overall, 71.4% (15/21) of studies predicted a functional outcome, 9.5% (2/21) a neurological outcome, 9.5% (2/21) survival, and 9.5% (2/21) other. The two studies in the other category predicted the occurrence of complications (as per the study authors' definition) during the acute period41 and the onset of acute respiratory failure43 after TSCI. For the 15 studies evaluating functional outcomes, the Spinal Cord Independence Measure (SCIM)46,47 and the Functional Independence Measure (FIM)48 were common scales used for outcome specification, used in 53.3% (8/15) and 33.3% (5/15) of studies, respectively. Full details on the outcome definitions used across the 21 studies are provided in Table 6.
Model validation was reported in 60.6% (20/33) of the final CPMs. Of these, internal validation only (bootstrapping or cross-validation) was performed for 13 CPMs, external validation only (temporal or geographic) for five, and both internal and external validation for two (Table 7).
Model performance was reported in a variety of ways and depended on the model development methods used, particularly the type of outcome (e.g., binary, continuous) being predicted. Of the 33 unique CPMs (Table 7), overall model performance using the R2 statistic was reported in 24.2% of models (8/33). Discrimination was reported in 69.7% of models (23/33), and the area-under-the-curve of a receiver operating characteristic curve was the most frequent method used to evaluate discrimination. Calibration was only reported in 18.1% of models (6/33), using a calibration plot in four instances and the Hosmer-Lemeshow test in two.
Distinct model presentation formats7 were provided for 57.6% (19/33) of final CPMs; they were regression formulas (n = 12), regression trees or visual representations of a conditional tree (n = 4), score charts (n = 2), and a nomogram implemented on a web-based calculator (n = 1). Moreover, four final CPMs included hypothetical patient scenarios or demonstrations to illustrate how the CPM can be applied in practice.
Summary of predictor selection processes
We distinguished between three phases of predictor selection during prediction model development: (1) initial selection of predictors, (2) predictor selection for inclusion in modelling, and (3) predictor selection during modelling (Table 6). Eleven studies had more than one reason for considering a predictor; the most frequent reasons were referencing previous literature (n = 19, 90.5%) and author choice (n = 8, 38.1%). Methods for predictor selection for inclusion in multivariable modelling (phase 2) most frequently involved including all candidate predictors (n = 14, 66.7%) without any preselection before modelling. The most frequent methods for predictor selection during multivariable modelling (phase 3) were stepwise (forward or backward) selection (n = 9, 42.9%), full model approach (n = 7, 33.3%), and all possible/best subset selection (n = 3, 14.3%).
Table 6 provides an overview of the number of predictors (candidate and final) used in model development. Age at injury was the most frequent candidate predictor, appearing in 100% of the studies, whereas blood and imaging markers were the least frequent candidate predictors, each appearing in 9.5% (2/21) of studies. Age at injury was again the most frequent final predictor (13/21, 61.9%), whereas variables related to sacral sparing and zone of partial preservation were the least frequent, each appearing as a final predictor in one study. Table 8 is a matrix illustrating which category of candidate or final predictor was used for each study. The “other” category includes predictors from three studies, and they were neurophysiological variables,32 the Modified Ashworth Scale,42 and year of admittance.37 A full description of candidate and final predictors used across the 21 included studies is provided in eTable 2.
Table 8.
Matrix depicting predictor categories for candidate and final predictors in included studies
| Candidate predictors (n) | Final predictors (n) | Age at injury | Sex | ISNCSCI motor scores | ISNCSCI sensory scores | ISNCSCI aggregate scores | Sacral sparing | Zone of partial preservation (ZPP) | NLI | AIS grade (injury severity) | Measures of function | Blood markers | Imaging markers | Patient presentation & acute setting features | Anthropometric & medical history features | Other | ||
|---|---|---|---|---|---|---|---|---|---|---|---|---|---|---|---|---|---|---|
| Ariji et al. | 153 | 6 | x | x | x | x | ||||||||||||
| Belliveau et al. | 14 | 9 | x | x | x | x | x | |||||||||||
| DeVries et al. | 17 | 17 | x | x | x | x | ||||||||||||
| Elliot et al. | 6 | 5 | x | x | x | x | x | x | ||||||||||
| Engel-Haber et al. | 5 | 5 | x | x | x | |||||||||||||
| Facchinello et al. | 11 | 4 | x | x | x | x | ||||||||||||
| Fallah et al. | 12 | 11 | x | x | x | x | x | |||||||||||
| Hicks et al. | 5 | 3 | x | x | x | |||||||||||||
| Hupp et al. | 9 | 5 | x | x | x | x | x | |||||||||||
| Kaminski et al. | 12 | 4 | x | x | x | x | x | x | x | |||||||||
| Pavese et al. (2016) | 182 | 3 | x | x | x | x | x | x | x | x | x | x | ||||||
| Pavese et al. (2019) | 182 | 1 | x | x | x | x | x | x | x | x | x | x | ||||||
| Richard-Denis et al. | 16 | 4 | x | x | x | x | x | x | x | |||||||||
| Shibahashi et al. | 12 | 8 | x | x | x | x | ||||||||||||
| Tanadini et al. | 10 | 2 | x | x | x | x | ||||||||||||
| van Middendorp et al. | 17 | 5 | x | x | x | x | ||||||||||||
| Wilson et al. (2012; 1) | 4 | 4 | x | x | x | x | ||||||||||||
| Wilson et al. (2012; 2) | 7 | 5 | x | x | x | x | x | |||||||||||
| Winchester et al. | 10 | 4 | x | x | x | x | x | |||||||||||
| Xie et al. | 27 | 5 | x | x | x | x | x | |||||||||||
| Zhao et al. | 10 | 10 | x | x | x | x | x | x | ||||||||||
| Consistency of predictor significance | Inconsistently significant | Inconsistently significant | Consistently significant | Inconsistently significant | Consistently significant | Consistently insignificant | Inconsistently significant | Inconsistently significant | Inconsistently significant | Consistently significant | Consistently significant | Consistently significant | Consistently significant | Inconsistently significant | Insufficient evidence | |||
| Legend | Variable was considered as a candidate predictor only | Variable was considered as a candidate predictor and retained in the final model | ||||||||||||||||
We applied the classification scheme described in the methods (Figure 1) to evaluate the consistency with which different categories of candidate predictors were deemed to hold significant predictive value (i.e., retained in the final CPM) (see Table 8, bottom row). All candidate predictor categories were identified in at least two studies; therefore, there was sufficient evidence from included studies to evaluate the consistency with which candidate predictors were kept in the final CPM. However, because the “other” category included three different predictors from three different studies, we concluded there was insufficient evidence to evaluate this category.
Figure 3 compares the frequency that each predictor category was used as a candidate predictor versus the frequency that it was selected as a final predictor after modelling.
Figure 3.
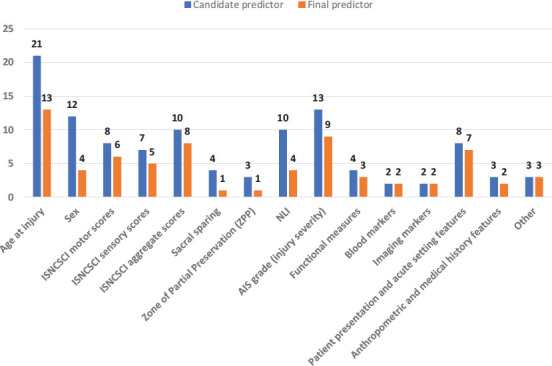
Frequency of candidate and final predictor types in included studies. AIS = American Spinal Injury Association Impairment Scale; ISNCSCI = International Standards for Neurological Classification of Spinal Cord Injury; NLI = neurological level of injury.
Given the potential impact of the type of outcome on the choice of candidate predictors and their retainment in the final model, we performed descriptive statistics on the subset of studies predicting a functional outcome (15 of 21 studies). Age at injury remained as the most frequent candidate predictor, appearing in 100% of the 15 studies. This was followed by ISNCSCI aggregate scores and AIS grade, each appearing in 9/15 studies (60.0%). Imaging markers were the least frequent, appearing in one study; blood and imaging markers were no longer selected as candidate predictors. In terms of final predictors, age at injury was again the most frequent (9/15, 60.0%), whereas variables related to the zone of partial preservation were the least frequent, not appearing as a final predictor in any study despite being a candidate predictor in two. When applying the classification scheme (Figure 1) to this subset of studies, ISNCSCI motor scores, ISNCSCI sensory scores, measures of function, and patient presentation/acute setting features were the four predictor categories that consistently held predictive value (i.e., predictor was retained in the final model in at least 75% of instances).
Discussion
The goal of this systematic review was to assess the current state of CPMs developed for prognostication in TSCI. To this end, we identified and summarized the available evidence from 21 studies reporting 33 unique CPMs.
Risk of bias among included studies
Most of the included studies were retrospective in nature and based on data from SCI-specific registries in North America and Europe. When participant data are drawn from existing sources, there is a greater risk of bias given the higher chance that data are being collected for a purpose other than model development and are also often without a protocol.45 However, given that these registries were established for the purpose of advancing TSCI research,49–52 data were more likely collected using prespecified and consistent methods that ensure that participant data are systematically and validly recorded.5
On the other hand, all studies were deemed to be at high ROB with respect to the Analysis domain, which may be influenced by the primary method used to handle missing data. Of the included studies, all except one33 employed complete-case analysis, which was shown by Bouwmeester et al.'s53 systematic review to be the most common method of choice when dealing with missing data in prediction model studies. However, by simply excluding enrolled participants with any missing data from the analysis, there is an increased risk of bias in predictor–outcome associations and in the final model performance. Analyzed individuals (those with complete data) are more likely a selective rather than a completely random sample of the original full study sample.54 Using more appropriate methods, such as multiple imputation,54,55 will be a key step to improving the rigor of analysis in prediction model development in TSCI research. At the very least, to allow for judgment of the impact of missing data on the overall risk of bias, authors may provide the distributions of the predictors and outcomes between excluded versus analyzed groups or a comparison of the predictor–outcome associations and model predictive performance with and without inclusion of the participants with missing values.45
Model development techniques and machine learning
A variety of model development techniques were identified, ranging from regression approaches to modern machine learning methods such as artificial neural networks25 and decision tree analysis.30 In this review, we identified two studies that have already begun comparing statistical versus machine learning modelling techniques.25,26 Belliveau et al. developed CPMs for predicting functional outcomes 1 year after discharge from inpatient rehabilitation for TSCI using both artificial neural networks and logistic regression and found that the performance of models generated by neural networks matched or exceeded the performance of models analyzed using traditional logistic regression.25 Similarly, DeVries et al.26 investigated the use of an unsupervised machine learning algorithms for the prediction of walking recovery following TSCI and found that unsupervised machine performed similarly to CPMs based on logistic regression. Therefore, based on a limited number of studies, there is currently no consistent information to suggest that advanced machine learning methods are superior to traditional approaches for developing CPMs. This will be an important area of future research, especially for realizing the full potential and applicability of machine learning in TSCI prognosis research.
Predictor selection process
We identified various predictor selection strategies being used for each stage of the selection process. For the initial selection of predictors (phase 1), the most frequent strategy was referencing previous literature (n = 19, 90.5%). Prior to conducting a prediction modelling study, reviewing the existing literature on a topic is a valuable strategy for narrowing a theoretically infinite possibility of data points down to those that have demonstrated previous prognostic performance with the outcome.9 Systematic reviews that count the number of times a variable was found important or significant in the different studies have been shown to be helpful in identifying candidate predictors11 and are a primary way that the present systematic review can contribute to the TSCI literature and the development or updating of future CPMs.
Selection and final inclusion of predictors in modelling
This review found that functional outcomes were most commonly the focus of TSCI prognostication, with independent ambulation being the most frequently studied functional outcome. This aligns with previous research highlighting the importance of mobility after injury as a key functional recovery priority for TSCI patients.56 However, we observed a relatively low proportion of studies predicting neurological outcomes (9.5%, n = 2) or survival (9.5%, n = 2), which contrasts with the findings of a systematic review by Wilson et al. that found a more balanced distribution with 25 studies for a neurological outcome, 22 for a functional outcome, and 15 for survival.14 This discrepancy highlights a gap in the current TSCI literature, as neurological and survival outcomes have not been frequently studied using CPMs in TSCI prognosis research. It should be noted that the scope of our review was restricted to prediction modelling studies,6 whereas the review by Wilson et al. focused on predictor finding studies,57 which may explain some of the differences in findings.
An established body of literature examining prognostic factors for TSCI has been described in previous systematic reviews.14,58,59 Significant predictors identified in these studies were typically demographic and clinical examination features collected in the acute setting, such as age, neurological examination findings, injury mechanism, and biomarkers derived from imaging. Among these, the severity of injury, as measured by the AIS grade,60 was among the strongest predictors. In the present review, age at injury was universally considered as a predictor across all 21 included studies. However, according to our evaluation, it was a predictor that was inconsistently deemed to hold significant predictive value (i.e., it was selected as a final predictor in 25% to 75% of studies in which it was considered). Through various variable selection techniques in studies developing CPMs, age was not always retained as a significant predictor in the final model. These findings were consistent when limiting to the subset of 15 studies predicting functional outcomes (the largest category by outcome type). In terms of blood and imaging markers, despite the emergence of advanced neuroimaging and molecular biomarkers sensitive to SCI disease processes,61,62 these predictors were rarely considered in currently published TSCI CPMs (considered in two studies each; Table 8). This is consistent with gaps identified in CPMs for spinal disorders in general63 and neurocritical care.64
Performance metrics in prediction modelling
Included studies used a variety of methods to report the performance of CPMs (Table 7). Discrimination and calibration are regarded as a basic requirement for reporting performance in prediction modelling studies to report,45 however discrimination was reported in 69.7% of studies and calibration in only 18.1%. With regard to discrimination, the AUC (Area Under the Receiver Operating Characteristic curve) was the most frequently reported metric and is considered a standard method for assessing the accuracy of predictive models.11 When the AUC was reported, the discriminative performance was at least acceptable (>0.7) in all studies,65 however formal comparison between CPMs was not possible given the heterogeneity of reported outcomes. Moreover, while the AUC is accurate for balanced datasets, it has been shown to be less accurate when used on imbalanced datasets.66 Saito and Rehmsmeier67 have suggested that the F1-score be used in place of the AUC. They found that the AUC was falsely elevated when there was a greater amount of false positive classifications present, but the F1-score remained appropriately low. This theoretical promise for maintaining accurate prognostic performance when using imbalanced data has been demonstrated by DeVries et al.,26 but there has been no further work in TSCI prognosis research to evaluate optimal performance evaluation in different datasets.
Current barriers to TSCI prognosis research
Only two studies (9.52%) reported adherence to the TRIPOD statement. However, poor reporting is not unique to TSCI research. Indeed, Heus et al. found that items considered essential for transparent reporting were consistently missing in a high proportion of models in high impact journals across 37 clinical domains.68 Complete reporting is necessary to judge the validity and applicability of CPMs20; therefore, poor reporting represents a significant barrier to progress in the field of prediction model research. Adherence to reporting according to the TRIPOD statement will be an important goal for future research in TSCI model development, helping facilitate better dissemination of research.68
Once a prediction model is developed, its clinical use is dependent on evidence of successful validation and, ideally, on evidence of clinical impact when using the model. Many of the CPMs included in this review (26 of 33 unique CPMs across all included studies) have not been externally validated. This is a key barrier to their successful implementation into clinical practice.69 Moreover, despite the importance of model presentation for translating findings into clinical practice,11 only 57.6% of the distinct CPMs published across the 21 studies included a model presentation format to promote the application of their model. CPMs are often too complex for daily use in the clinical setting,5 making presentation formats such as nomograms and score charts essential to their dissemination. Moreover, user-friendly formats such as web-based calculators will be critical to supporting the growth and adoption of machine learning models into clinical practice as these modern techniques become more mainstream in TSCI research.12 In addition to poor reporting of prediction modelling studies,68 a lack of model presentation formats published alongside new CPMs represents a significant barrier to TSCI prognosis research. Compared to studies that develop new CPMs, there is a relative scarcity of validation and impact studies,6,70 and the lack of transportability of published models hindering the ability for external researchers to conduct such studies may be a contributing factor to this.
The validation of CPMs for TSCI prognosis is essential for ensuring their reliability and clinical utility.69 Therefore, it is important for researchers to involve domain experts and use context-relevant data in the validation process.71 This can help to mitigate biases and improve the external validity of the models, as the use of data that accurately reflects the context in which the models will be used is crucial for ensuring the accuracy and usefulness of AI systems.12 By considering the role of context and human expertise in the validation process, researchers can work toward developing more accurate and reliable CPMs for TSCI prognosis, which can ultimately promote patient-centered care and inform the development of future models.
Strengths and Limitations
The strengths of this review were its rigorous design and standardized systematic review protocol, including blinded review of abstracts and quality assessments. The literature search process was standardized, and the included studies were assessed for their methodological quality. Furthermore, we tailored and expanded on the validated CHARMS data extraction framework17 to specifically address the objectives of our review.
Search terms for studies on prediction models are imperfect72 and may partly be a consequence of poor reporting of prediction modelling studies, particularly in the title and abstract.68 We aimed to minimize the risk of missing relevant studies through an extensive search of a broad range of search terms in five electronic databases supplemented by reference lists of included studies. Moreover, once potentially relevant studies were identified through the search, there was often an unavoidable subjective nature to distinguishing between a prediction modelling study and a predictor finding study. This challenge has been previously described in a scoping review of prediction models.73 We addressed this subjectivity by defining our approach to such ambiguous studies a priori and reviewing all studies independently and in duplicate.
Finally, inclusion of studies with small sample sizes or those without external validation may limit the validity in our findings. However, given the likewise limited research on TSCI-centered CPMs, we did not apply exclusion criteria based on these limitations to provide a comprehensive overview of all CPMs. To be consistent with the reporting of these limitations, we followed PROBAST guidelines16 for the assessment of risk of bias in included studies and the CHARMS checklist17 for reporting of key aspects of study design including sample size (Table 4) and validation (Table 7). This systematic approach will provide clinicians and researchers with valuable preliminary insight while contributing to generalizability and applicability of our findings across diverse settings and patient populations.
Conclusion
Prediction modelling studies for TSCI serve clinicians who counsel patients, researchers aiming to risk-stratify participants for clinical trials, and patients coping with this devastating condition. In this systematic review, we provide a comprehensive overview of the CPMs that have been developed for prognosticating patient-centered outcomes in individuals with TSCI. Furthermore, we detail variable selection strategies to inform prospective researchers planning to extend or improve on the currently published models. Findings suggest that most currently published CPMs have been developed to predict functional outcomes, with opportunity for further work in the prognostication of neurological and survival outcomes. There was also some discrepancy between the candidate predictors most frequently considered for model development and those most consistently deemed to hold significant value as final predictors, suggesting a role for the variable selection strategy in influencing which predictors are retained in the final model.
More consistent use of model presentation formats and transparent reporting of prediction modelling studies are needed to support the dissemination and advancement of TSCI prognosis research. This systematic review aims to inform future research to better understand the prognosis for TSCI and leverage this knowledge to develop, validate, and effectively translate CPMs that have the potential to individualize and optimize the quality of care provided to patients with TSCI.
Supplementary Material
Acknowledgments
We thank the Praxis Spinal Cord Institute for their research support throughout the duration of the study.
Funding Statement
Financial Support R.H. received a grant from the Praxis Spinal Cord Institute for employment purposes throughout this study. E.T. received research support from AbbVie and Mitsubishi Tanabe Pharma, although this is outside of and unrelated to the submitted work. All other authors report having no conflicts of interest related to the current study to disclose, financial or otherwise.
REFERENCES
- 1.Ahuja CS, Wilson JR, Nori S, et al. Traumatic spinal cord injury. Nat Rev Dis Primer. 2017;3(1):1–21. doi: 10.1038/nrdp.2017.18. [DOI] [PubMed] [Google Scholar]
- 2.Chamberlain JD, Meier S, Mader L, von Groote PM, Brinkhof MWG. Mortality and longevity after a spinal cord injury: Systematic review and meta-analysis. Neuroepidemiology. 2015;44(3):182–198. doi: 10.1159/000382079. [DOI] [PubMed] [Google Scholar]
- 3.Dijkers M. Quality of life after spinal cord injury: A meta analysis of the effects of disablement components. Spinal Cord. 1997;35(12):829–840. doi: 10.1038/sj.sc.3100571. [DOI] [PubMed] [Google Scholar]
- 4.Hemingway H, Croft P, Perel P, et al. Prognosis research strategy (PROGRESS) 1: A framework for researching clinical outcomes. BMJ. 2013;346:e5595. doi: 10.1136/bmj.e5595. [DOI] [PMC free article] [PubMed] [Google Scholar]
- 5.Moons KGM, Royston P, Vergouwe Y, Grobbee DE, Altman DG. Prognosis and prognostic research: What, why, and how? BMJ. 2009;338:b375. doi: 10.1136/bmj.b375. [DOI] [PubMed] [Google Scholar]
- 6.Steyerberg EW, Moons KGM, van der Windt DA, et al. Prognosis Research Strategy (PROGRESS) 3: Prognostic model research. PLoS Med. 2013;10(2):e1001381. doi: 10.1371/journal.pmed.1001381. https://www.ncbi.nlm.nih.gov/pmc/articles/PMC3564751/ [DOI] [PMC free article] [PubMed] [Google Scholar]
- 7.Steyerberg EW. Clinical Prediction Models: A Practical Approach to Development, Validation, and Updating. 2nd ed. Springer Cham; 2019. [Google Scholar]
- 8.Harrell FE., Jr Regression Modeling Strategies: With Applications to Linear Models, Logistic and Ordinal Regression, and Survival Analysis. Springer Cham; 2015. [Google Scholar]
- 9.Royston P, Moons KGM, Altman DG, Vergouwe Y. Prognosis and prognostic research: Developing a prognostic model. BMJ. 2009;338:b604. doi: 10.1136/bmj.b604. [DOI] [PubMed] [Google Scholar]
- 10.Chowdhury MZI, Turin TC. Variable selection strategies and its importance in clinical prediction modelling. Fam Med Community Health. 2020;8(1) doi: 10.1136/fmch-2019-000262. [DOI] [PMC free article] [PubMed] [Google Scholar]
- 11.Steyerberg EW, editor. Clinical Prediction Models: A Practical Approach to Development, Validation, and Updating. Springer Cham; 2019. Statistical models for prediction; pp. 59–93. [DOI] [Google Scholar]
- 12.Khan O, Badhiwala JH, Wilson JRF, Jiang F, Martin AR, Fehlings MG. Predictive modeling of outcomes after traumatic and nontraumatic spinal cord injury using machine learning: Review of current progress and future directions. Neurospine. 2019;16(4):678–685. doi: 10.14245/ns.1938390.195. [DOI] [PMC free article] [PubMed] [Google Scholar]
- 13.Shah ND, Steyerberg EW, Kent DM. Big data and predictive analytics: Recalibrating expectations. J Am Med Assoc. 2018;320(1):27–28. doi: 10.1001/jama.2018.5602. [DOI] [PubMed] [Google Scholar]
- 14.Wilson JR, Cadotte DW, Fehlings MG. Clinical predictors of neurological outcome, functional status, and survival after traumatic spinal cord injury: A systematic review. J Neurosurg Spine. 2012;17(1 Suppl):11126. doi: 10.3171/2012.4.AOSPINE1245. [DOI] [PubMed] [Google Scholar]
- 15.Moher D, Liberati A, Tetzlaff J, Altman DG. Preferred reporting items for systematic reviews and meta-analyses: The PRISMA statement. BMJ. 2009;339:b2535. doi: 10.1136/bmj.b2535. [DOI] [PMC free article] [PubMed] [Google Scholar]
- 16.Wolff RF, Moons KGM, Riley RD, et al. PROBAST: A tool to assess the risk of bias and applicability of prediction model studies. Ann Intern Med. 2019;170(1):51–58. doi: 10.7326/M18-1376. [DOI] [PubMed] [Google Scholar]
- 17.Moons KGM, Groot JAH de, Bouwmeester W, et al. Critical appraisal and data extraction for systematic reviews of prediction modelling studies: The CHARMS checklist. PLoS Med. 2014;11(10):e1001744. doi: 10.1371/journal.pmed.1001744. [DOI] [PMC free article] [PubMed] [Google Scholar]
- 18.Kent P, Cancelliere C, Boyle E, Cassidy JD, Kongsted A. A conceptual framework for prognostic research. BMC Med Res Methodol. 2020;20(1):172. doi: 10.1186/s12874-020-01050-7. [DOI] [PMC free article] [PubMed] [Google Scholar]
- 19.Hidalgo B, Goodman M. Multivariate or multivariable regression? Am J Public Health. 2013;103(1):39–40. doi: 10.2105/AJPH.2012.300897. [DOI] [PMC free article] [PubMed] [Google Scholar]
- 20.Collins GS, Reitsma JB, Altman DG, Moons KG. Transparent reporting of a multivariable prediction model for individual prognosis or diagnosis (TRIPOD): The TRIPOD statement. BMC Med. 2015;13(1):1. doi: 10.1186/s12916-014-0241-z. [DOI] [PMC free article] [PubMed] [Google Scholar]
- 21.Malley B, Ramazzotti D, Wu JT-yu. Secondary Analysis of Electronic Health Records. Springer Cham; 2016. Data preprocessing; p. 115141. [DOI] [Google Scholar]
- 22.Chowdhury MZI, Turin TC. Variable selection strategies and its importance in clinical prediction modelling. BMJ. doi: 10.1136/fmch-2019-000262. https://fmch.bmj.com/content/8/1/e000262 . [DOI] [PMC free article] [PubMed] [Google Scholar]
- 23.Heinze G, Wallisch C, Dunkler D. Variable selection – A review and recommendations for the practicing statistician. Biom J Biom Z. 2018;60(3):431–449. doi: 10.1002/bimj.201700067. [DOI] [PMC free article] [PubMed] [Google Scholar]
- 24.Ariji Y, Hayashi T, Ideta R, et al. A prediction model of functional outcome at 6 months using clinical findings of a person with traumatic spinal cord injury at 1 month after injury. Spinal Cord. 2020;58(11):1158–1165. doi: 10.1038/s41393-020-0488-5. [DOI] [PubMed] [Google Scholar]
- 25.Belliveau T, Jette AM, Seetharama S, et al. Developing artificial neural network models to predict functioning one year after traumatic spinal cord injury. Arch Phys Med Rehabil. 2016;97(10):1663–1668.e3. doi: 10.1016/j.apmr.2016.04.014. [DOI] [PubMed] [Google Scholar]
- 26.DeVries Z, Hoda M, Rivers CS, et al. Development of an unsupervised machine learning algorithm for the prognostication of walking ability in spinal cord injury patients. Spine J. 2020;20(2):213–224. doi: 10.1016/j.spinee.2019.09.007. [DOI] [PubMed] [Google Scholar]
- 27.Elliott C., Dallas K., Zlatev D., Comiter C., Crew J., Shem K. Volitional voiding of the bladder after spinal cord injury: Validation of bilateral lower extremity motor function as a key predictor. J Urol. 2018;199(4 Suppl 1):e726–727. doi: 10.1016/j.juro.2018.02.064. [DOI] [PubMed] [Google Scholar]
- 28.Engel-Haber E, Zeilig G, Haber S, Worobey L, Kirshblum S. The effect of age and injury severity on clinical prediction rules for ambulation among individuals with spinal cord injury. Spine J. 2020;20(10):1666–1675. doi: 10.1016/j.spinee.2020.05.551. [DOI] [PubMed] [Google Scholar]
- 29.Facchinello Y, Beausejour M, Richard-Denis A, Thompson C, Mac-Thiong JM. The use of regression tree analysis for predicting the functional outcome following traumatic spinal cord injury. J Neurotrauma. 2017 doi: 10.1089/neu.2017.5321. (j82, 8811626) [DOI] [PubMed] [Google Scholar]
- 30.Fallah N, Noonan V, Waheed Z, et al. Development of a machine learning algorithm for predicting in-hospital and one-year mortality after traumatic spinal cord injury: Mortality prediction tool for spinal cord injury. Spine J. 2021;(101130732) doi: 10.1016/j.spinee.2021.08.003. [DOI] [PubMed] [Google Scholar]
- 31.Hicks KE, Zhao Y, Fallah N, et al. A simplified clinical prediction rule for prognosticating independent walking after spinal cord injury: A prospective study from a Canadian multicenter spinal cord injury registry. Spine J. 2017;17(10):1383–1392. doi: 10.1016/j.spinee.2017.05.031. [DOI] [PubMed] [Google Scholar]
- 32.Hupp M, Pavese C, Bachmann LM, Koller R, Schubert M. Electrophysiological multimodal assessments improve outcome prediction in traumatic cervical spinal cord injury. J Neurotrauma. 2018;35(24):2916–2923. doi: 10.1089/neu.2017.5576. [DOI] [PubMed] [Google Scholar]
- 33.Kaminski L, Cordemans V, Cernat E, M’Bra KI, MacThiong JM. Functional outcome prediction after traumatic spinal cord injury based on acute clinical factors. J Neurotrauma. 2017;34(12):2027–2033. doi: 10.1089/neu.2016.4955. [DOI] [PubMed] [Google Scholar]
- 34.Pavese C, Schneider MP, Schubert M, et al. Prediction of bladder outcomes after traumatic spinal cord injury: A longitudinal cohort study. PLoS Med. 2016;13(6):e1002041. doi: 10.1371/journal.pmed.1002041. [DOI] [PMC free article] [PubMed] [Google Scholar]
- 35.Pavese C, Bachmann LM, Schubert M, et al. Bowel outcome prediction after traumatic spinal cord injury: Longitudinal cohort study. Neurorehabil Neural Repair. 2019;33(11):902–910. doi: 10.1177/1545968319868722. [DOI] [PubMed] [Google Scholar]
- 36.Richard-Denis A, Feldman D, Thompson C, MacThiong JM. Prediction of functional recovery six months following traumatic spinal cord injury during acute care hospitalization. J Spinal Cord Med. 2018;41(3):309–317. doi: 10.1080/10790268.2017.1279818. [DOI] [PMC free article] [PubMed] [Google Scholar]
- 37.Shibahashi K, Nishida M, Okura Y, Hamabe Y. Epidemiological state, predictors of early mortality, and predictive models for traumatic spinal cord injury: A multicenter nationwide cohort study. Spine. 2019;44(7):479–487. doi: 10.1097/BRS.0000000000002871. [DOI] [PubMed] [Google Scholar]
- 38.Tanadini LG, Steeves JD, Hothorn T, et al. Identifying homogeneous subgroups in neurological disorders: Unbiased recursive partitioning in cervical complete spinal cord injury. Neurorehabil Neural Repair. 2014;28(6):507–515. doi: 10.1177/1545968313520413. [DOI] [PubMed] [Google Scholar]
- 39.van Middendorp JJ, Hosman AJF, Donders ART, et al. A clinical prediction rule for ambulation outcomes after traumatic spinal cord injury: A longitudinal cohort study. Lancet (Lond) 2011;377(9770):1004–1010. doi: 10.1016/S0140-6736(10)62276-3. [DOI] [PubMed] [Google Scholar]
- 40.Wilson JR, Grossman RG, Frankowski RF, et al. A clinical prediction model for long-term functional outcome after traumatic spinal cord injury based on acute clinical and imaging factors. J Neurotrauma. 2012;29(13):2263–2271. doi: 10.1089/neu.2012.2417. [DOI] [PMC free article] [PubMed] [Google Scholar]
- 41.Wilson JR, Arnold PM, Singh A, Kalsi-Ryan S, Fehlings MG. Clinical prediction model for acute inpatient complications after traumatic cervical spinal cord injury: A subanalysis from the Surgical Timing in Acute Spinal Cord Injury Study. J Neurosurg Spine. 2012;17(1 Suppl):46–51. doi: 10.3171/2012.4.AOSPINE1246. [DOI] [PubMed] [Google Scholar]
- 42.Winchester P, Smith P, Foreman N, et al. A prediction model for determining over ground walking speed after locomotor training in persons with motor incomplete spinal cord injury. J Spinal Cord Med. 2009;32(1):63–71. doi: 10.1080/10790268.2009.11760754. [DOI] [PMC free article] [PubMed] [Google Scholar]
- 43.Xie Y, Wang Y, Zhou Y, et al. A nomogram for predicting acute respiratory failure after cervical traumatic spinal cord injury based on admission clinical findings. Neurocrit Care. 2021;(101156086) doi: 10.1007/s12028-021-01302-4. [DOI] [PMC free article] [PubMed] [Google Scholar]
- 44.Zhao JL, Lai ST, Du ZY, et al. Circulating neutrophil-tolymphocyte ratio at admission predicts the long-term outcome in acute traumatic cervical spinal cord injury patients. BMC Musculoskelet Disord. 2020;21(1):548. doi: 10.1186/s12891-020-03556-z. [DOI] [PMC free article] [PubMed] [Google Scholar]
- 45.Moons KGM, Wolff RF, Riley RD, et al. PROBAST: A tool to assess risk of bias and applicability of prediction model studies: Explanation and elaboration. Ann Intern Med. 2019;170(1):W1–33. doi: 10.7326/M18-1377. [DOI] [PubMed] [Google Scholar]
- 46.Catz A, Itzkovich M, Steinberg F, et al. The CatzItzkovich SCIM: A revised version of the Spinal Cord Independence Measure. Disabil Rehabil. 2001;23(6):263–268. doi: 10.1080/096382801750110919. [DOI] [PubMed] [Google Scholar]
- 47.Catz A, Itzkovich M, Tesio L, et al. A multicenter international study on the Spinal Cord Independence Measure, version III: Rasch psychometric validation. Spinal Cord. 2007;45(4):275–291. doi: 10.1038/sj.sc.3101960. [DOI] [PubMed] [Google Scholar]
- 48.Ottenbacher KJ, Hsu Y, Granger CV, Fiedler RC. The reliability of the Functional Independence Measure: A quantitative review. Arch Phys Med Rehabil. 1996;77(12):1226–1232. doi: 10.1016/s0003-9993(96)90184-7. [DOI] [PubMed] [Google Scholar]
- 49.Noonan VK, Kwon BK, Soril L, et al. The Rick Hansen Spinal Cord Injury Registry (RHSCIR): A national patient-registry. Spinal Cord. 2012;50(1):22–27. doi: 10.1038/sc.2011.109. [DOI] [PubMed] [Google Scholar]
- 50.Fehlings MG, Wilson JR. Timing of surgical intervention in spinal trauma: What does the evidence indicate? Spine. 2010;35(21S):S159. doi: 10.1097/BRS.0b013e3181f330f4. [DOI] [PubMed] [Google Scholar]
- 51.Stover SL, Michael J, Go BK. History, implementation, and current status of the National Spinal Cord Injury Database. Arch Phys Med Rehabil. 1999;80(11):1365–1371. doi: 10.1016/s0003-9993(99)90246-0. [DOI] [PubMed] [Google Scholar]
- 52.van Hedel H, Wirz M, Dietz V. Standardized assessment of walking capacity after spinal cord injury: The European network approach. Neurol Res. 2008;30(1):61–73. doi: 10.1179/016164107X230775. [DOI] [PubMed] [Google Scholar]
- 53.Bouwmeester W, Zuithoff NPA, Mallett S, et al. Reporting and methods in clinical prediction research: A systematic review. PLoS Med. 2012;9(5):1–112. doi: 10.1371/journal.pmed.1001221. [DOI] [PMC free article] [PubMed] [Google Scholar]
- 54.Little RJ, Rubin DB. Statistical Analysis With Missing Data. Vol. 793. John Wiley & Sons; 2019. [Google Scholar]
- 55.Janssen S, Bajrovic A, Schild SE, Rades D. A scoring instrument to predict the survival prognoses of patients with metastatic epidural spinal cord compression from gynecological malignancies. Anticancer Res. 2016;36(10):5469–5472. doi: 10.21873/anticanres.11127. [DOI] [PubMed] [Google Scholar]
- 56.Simpson LA, Eng JJ, Hsieh JTC, Wolfe DL, Spinal Cord Injury Rehabilitation Evidence Scire Research Team The health and life priorities of individuals with spinal cord injury: A systematic review. J Neurotrauma. 2012;29(8):1548–1555. doi: 10.1089/neu.2011.2226. [DOI] [PMC free article] [PubMed] [Google Scholar]
- 57.Riley RD, Hayden JA, Steyerberg EW, et al. Prognosis Research Strategy (PROGRESS) 2: Prognostic factor research. PLoS Med. 2013;10(2):e1001380. doi: 10.1371/journal.pmed.1001380. https://www.ncbi.nlm.nih.gov/pmc/articles/PMC3564757/ [DOI] [PMC free article] [PubMed] [Google Scholar]
- 58.Cadotte DW, Wilson JR, Mikulis D, Stroman PW, Brady S, Fehlings MG. Conventional MRI as a diagnostic and prognostic tool in spinal cord injury: A systemic review of its application to date and an overview on emerging MRI methods. Expert Opin Med Diagn. 2011;5(2):121–133. doi: 10.1517/17530059.2011.556111. [DOI] [PubMed] [Google Scholar]
- 59.Al-Habib AF, Attabib N, Ball J, Bajammal S, Casha S, Hurlbert RJ. Clinical predictors of recovery after blunt spinal cord trauma: Systematic review. J Neurotrauma. 2011;28(8):1431–1443. doi: 10.1089/neu.2009.1157. [DOI] [PMC free article] [PubMed] [Google Scholar]
- 60.Kirshblum SC, Waring W, Biering-Sorensen F, et al. Reference for the 2011 revision of the International Standards for Neurological Classification of Spinal Cord Injury. J Spinal Cord Med. 2011;34(6):547–554. doi: 10.1179/107902611X13186000420242. [DOI] [PMC free article] [PubMed] [Google Scholar]
- 61.Schading S, Emmenegger TM, Freund P. Improving diagnostic workup following traumatic spinal cord injury: Advances in biomarkers. Curr Neurol Neurosci Rep. 2021;21(9):49. doi: 10.1007/s11910-021-01134-x. [DOI] [PMC free article] [PubMed] [Google Scholar]
- 62.Krishna V, Andrews H, Varma A, Mintzer J, Kindy MS, Guest J. Spinal cord injury: How can we improve the classification and quantification of its severity and prognosis? J Neurotrauma. 2014;31(3):215–227. doi: 10.1089/neu.2013.2982. [DOI] [PMC free article] [PubMed] [Google Scholar]
- 63.Wingbermühle RW, Chiarotto A, Koes B, Heymans MW, van Trijffel E. Challenges and solutions in prognostic prediction models in spinal disorders. J Clin Epidemiol. 2021;132:125–130. doi: 10.1016/j.jclinepi.2020.12.017. [DOI] [PubMed] [Google Scholar]
- 64.Wartenberg KE, Hwang DY, Haeusler KG, et al. Gap analysis regarding prognostication in neurocritical care: A joint statement from the German Neurocritical Care Society and the Neurocritical Care Society. Neurocrit Care. 2019;31(2):231–244. doi: 10.1007/s12028-019-00769-6. [DOI] [PMC free article] [PubMed] [Google Scholar]
- 65.Hosmer DW, Jr, Lemeshow S, Sturdivant RX. Applied Logistic Regression. John Wiley & Sons; 2013. [Google Scholar]
- 66.Lobo JM, Jiménez-Valverde A, Real R. AUC: A misleading measure of the performance of predictive distribution models. Glob Ecol Biogeogr. 2008;17(2):145–151. [Google Scholar]
- 67.Saito T, Rehmsmeier M. The precision-recall plot is more informative than the ROC plot when evaluating binary classifiers on imbalanced datasets. PloS One. 2015;10(3):e0118432. doi: 10.1371/journal.pone.0118432. [DOI] [PMC free article] [PubMed] [Google Scholar]
- 68.Heus P, Damen JAAG, Pajouheshnia R, et al. Poor reporting of multivariable prediction model studies: Towards a targeted implementation strategy of the TRIPOD statement. BMC Med. 2018;16(1):120. doi: 10.1186/s12916-018-1099-2. [DOI] [PMC free article] [PubMed] [Google Scholar]
- 69.Steyerberg EW, Vergouwe Y. Towards better clinical prediction models: seven steps for development and an ABCD for validation. Eur Heart J. 2014;35(29):1925–1931. doi: 10.1093/eurheartj/ehu207. [DOI] [PMC free article] [PubMed] [Google Scholar]
- 70.Moons KGM, Kengne AP, Grobbee DE, et al. Risk prediction models: II. External validation, model updating, and impact assessment. Heart. 2012;98(9):691–698. doi: 10.1136/heartjnl-2011-301247. [DOI] [PubMed] [Google Scholar]
- 71.Verma AA, Murray J, Greiner R, Cohen JP, Shojania KG, Ghassemi M, et al. Implementing machine learning in medicine. Can Med Assoc J. 2021;193(34):E1351–1357. doi: 10.1503/cmaj.202434. [DOI] [PMC free article] [PubMed] [Google Scholar]
- 72.Geersing GJ, Bouwmeester W, Zuithoff P, Spijker R, Leeflang M, Moons K. Search filters for finding prognostic and diagnostic prediction studies in medline to enhance systematic reviews. PLoS One. 2012;7(2):e32844. doi: 10.1371/journal.pone.0032844. [DOI] [PMC free article] [PubMed] [Google Scholar]
- 73.Hodel J, Stucki G, Prodinger B. The potential of prediction models of functioning remains to be fully exploited: A scoping review in the field of spinal cord injury rehabilitation. J Clin Epidemiol. 2021;139:177–190. doi: 10.1016/j.jclinepi.2021.07.015. [DOI] [PubMed] [Google Scholar]
Associated Data
This section collects any data citations, data availability statements, or supplementary materials included in this article.