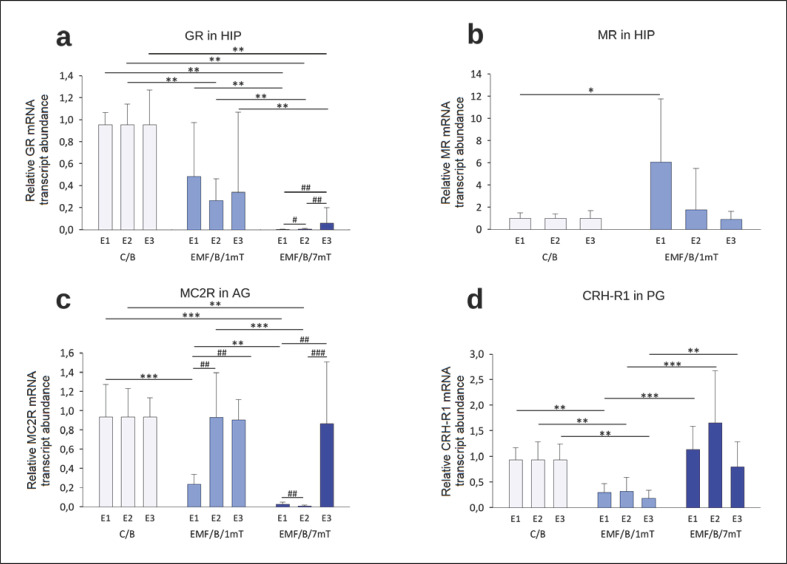
Fig. 4.
Receptor genes' “basal” relative mRNA transcript abundance (fold change vs. β-actin) GR (a) and MR (b) in the HIP, MC2R in AG (c), CRH-R1 in the PG (d) in rats exposed once to three times (E1–E3) to EMF of 1 or 7 mT or control conditions. Values are presented as mean ± SEM. Statistically significant differences between animals from the same group are denoted, #p < 0.05, ##p < 0.01, and ###p < 0.001 and these between experimental groups are denoted *p < 0.05, **p < 0.01, and ***p < 0.001 (n = 54; 6 in each group for each exposure). Note different scales on each plot.

