

Abstract
Cellular iron homeostasis is vital and maintained through tight regulation of iron import, efflux, storage and detoxification1–3. The most common modes of iron storage use proteinaceous compartments, such as ferritins and related proteins4,5. Although lipid-bounded iron compartments have also been described, the basis for their formation and function remains unknown6,7. Here we focus on one such compartment, herein named the ‘ferrosome’, that was previously observed in the anaerobic bacterium Desulfovibrio magneticus6. Using a proteomic approach, we identify three ferrosome-associated (Fez) proteins that are responsible for forming ferrosomes in D. magneticus. Fez proteins are encoded in a putative operon and include FezB, a P1B-6-ATPase found in phylogenetically and metabolically diverse species of bacteria and archaea. We show that two other bacterial species, Rhodopseudomonas palustris and Shewanella putrefaciens, make ferrosomes through the action of their six-gene fez operon. Additionally, we find that fez operons are sufficient for ferrosome formation in foreign hosts. Using S. putrefaciens as a model, we show that ferrosomes probably have a role in the anaerobic adaptation to iron starvation. Overall, this work establishes ferrosomes as a new class of iron storage organelles and sets the stage for studying their formation and structure in diverse microorganisms.
Desulfovibrio magneticus strain RS-1 is an anaerobic sulfate-reducing bacterium and an emerging model organism for studying the natural diversity of magnetite (Fe3O4) biomineralization within an organelle termed the magnetosome8,9. Independently of magnetosomes, D. magneticus makes subcellular electron-dense granules rich in iron, phosphorus and oxygen that are enclosed by a lipid-like membrane6. These granules, which we propose to name ‘ferrosomes’ for ‘iron bodies’, are visible by transmission electron microscopy (TEM) after D. magneticus transitions out of iron starvation with the supplementation of iron6. Depending on the concentration of iron supplemented, ferrosomes range in size from about 12 to 65 nm and increase in size over time (Extended Data Fig. 1). It has previously been found that the iron accumulated in ferrosomes is not sufficient for magnetosome formation and that magnetosome genes are not required for ferrosome formation6,10. While these studies support the hypothesis that the ferrosome is a distinct organelle, the molecular basis for ferrosome formation and function has remained a mystery.
The genetic blueprint of ferrosomes
To understand the mechanistic basis of ferrosome formation, we isolated ferrosomes from cell lysates through a sucrose cushion and used mass spectrometry to identify their associated proteins (Extended Data Fig. 2a–c). Mass spectrometry analysis identified three proteins highly enriched in the ferrosome fraction, DMR_28330 (FezB), DMR_28340 (FezC) and DMR_28320 (FezA), which are encoded by genes arranged in a putative operon, fezABC (Fig. 1a, b) (gene prefix given for the phonetic pronunciation of ferrosome). Of these three proteins, only FezB has a functional annotation as a heavy metal-transporting P1B-ATPase. P1B-ATPases are a large family of integral membrane proteins that transport metals across membranes using the energy of ATP hydrolysis11. FezB falls within the P1B-6-ATPase group, an uncharacterized subfamily with unique transmembrane topology and a possible role in iron transport based on genomic context in several species12. FezB has the cytoplasmic domains characteristic of all P1B-ATPases and unique motifs in the transmembrane domains responsible for metal specificity11–13 (Fig. 1b and Extended Data Fig. 3). FezC has an N-terminal heavy metal-associated (HMA) domain annotation and two predicted transmembrane domains, while FezA has a hydrophobic N-terminal region (Extended Data Fig. 2d–f). The putative transmembrane domains of FezA, FezB and FezC are consistent with our earlier observations that ferrosomes are surrounded by a lipid-like membrane6. Additionally, the characteristics of the metal-binding and transport domains suggest that the fez genes are the blueprint for ferrosome formation and function.
Fig. 1 |. Proteins enriched with ferrosomes are essential for ferrosome formation.

a, Five proteins most highly enriched in isolated ferrosomes compared with the cell lysate as detected by LC–ESI/MS: DMR_28320–DMR_28340 (uncharacterized proteins), DMR_43090 (OmpA family) and DMR_12700 (AccC). Data presented are the averages of three technical replicates (circles); error bars, s.d. b, DMR_28320–DMR_28340 are encoded by genes arranged in a putative operon. Bottom, schematic of FezB showing the conserved actuator and ATP-binding domains found in all P1B-ATPases and six putative transmembrane domains (rectangles). Signature motifs in the N-terminal domain and predicted transmembrane domains are shown. Details of this schematic are based on the alignments in Extended Data Fig. 3. c–e, Desulfovibrio magneticus strains 1 h after transitioning out of iron starvation, including wild type (WT) (c), ΔfezBC (d) and ΔfezBC::fezABC (e). White arrowheads indicate magnetosomes, which have a bullet or diamond shape that is distinguishable from ferrosomes6. Scale bars, 200 nm (magnified images, 100 nm). f, Maximum diameter of individual ferrosomes (circles) in D. magneticus WT (n = 125) and ΔfezBC::fezABC (n = 205) strains. The bar indicates the mean maximum diameter. g, A maximum-likelihood tree showing the relationship of FezB with other P1B-ATPases. The FezB signature motif in the putative metal-binding transmembrane domain distinguishes it from other subgroups of P1B-ATPases (colour ranges). The inner black strip indicates the presence of an N-terminal R-rich motif. The outer colour strip indicates the phylum or superphylum of organisms with a FezB homologue. The tree is rooted with KdpB (asterisk), and the collapsed clades contain P1B-ATPases, including CopA, CopB, ZntA and PfeT. Bootstraps > 70% are indicated with black circles. PVC, superphylum of Planctomycetes, Verrucomicrobia and Chlamydiae. h, Genes encoding FezB are found in genomic regions with additional conserved genes that encode proteins with GXXXG motifs (or, less frequently, GXXXA motifs), proteins with HMA/DUF4405 domains and proteins with a possible role in iron homeostasis. Organisms indicated in bold font are studied in this Article.
To test this hypothesis, we deleted the D. magneticus fezB and fezC genes through allelic replacement with a streptomycin-resistance cassette. The resulting mutant, ΔfezBCDm, could still form magnetosomes but was unable to form ferrosomes (Fig. 1d). Complementation of ΔfezBCDm with fezABCDm (ΔfezBC::fezABC) rescued the formation of ferrosomes, which were on average smaller than those in wild-type D. magneticus (Fig. 1c–f). The smaller ferrosome size, which was also observed in wild-type D. magneticus when the bacteria were induced to form ferrosomes with a lower concentration of iron (Extended Data Fig. 1f, j), could be due to less iron being stored in individual ferrosomes. In addition, expression of fezABCDm in trans in either the wild-type strain or the ΔfezBCDm mutant led to constitutive ferrosome production in iron-replete growth medium with no effect on magnetosome formation (Extended Data Fig. 4). Thus, ferrosomes are a structurally and genetically distinct organelle in D. magneticus.
Phylogenetic distribution of ferrosomes
We next asked whether other organisms are also capable of forming ferrosomes. Phylogenetic analysis of FezB revealed a clear group of its homologues that share signature motifs in the putative metal-binding transmembrane domains (D[Y/F]SCA and HNXXT), which define the P1B-6-ATPase subgroup12 (Fig. 1g and Supplementary Table 1). Although FezB homologues lack a known cytoplasmic N-terminal metal-binding domain, we found a notable ‘R-rich’ motif containing two or more arginine residues spaced by a variable residue (for example, RXR or RXRXR) in the N terminus of the majority of FezB homologues (Fig. 1g and Supplementary Table 1). We also identified this R-rich motif in related P1B-ATPases, including in CtpC, a metal transporter that contributes to Mycobacterium tuberculosis virulence14,15. Proteins identified in this study as FezB homologues, as well as related P1B-ATPases with an R-rich motif, were previously assigned to a family of functionally uncharacterized P-type ATPases named FUPA32 (ref. 13). FezB homologues are found in diverse species of bacteria and archaea that inhabit a range of environmental and host-associated habitats. Although metabolically diverse, the majority of these species are strict or facultative anaerobes (Supplementary Table 2). Despite the wide distribution of FezB homologues in bacteria, only two other magnetosome-forming bacteria, Magnetospirillum gryphiswaldense strain MSR-1 and Magnetospirillum sp. SO-1, have an apparent FezB homologue.
In most species, fezB lies in a conserved gene cluster (Extended Data Fig. 5a). Following closer inspection, we found that nearly all fez gene clusters encode one or more proteins that have a hydrophobic region with a conserved GXXXG motif (Fig. 1h, Extended Data Figs. 5b and 6b, and Supplementary Table 4). GXXXG motifs are common in transmembrane domains where they may facilitate protein–protein interactions and have even been shown to induce local curvature and tubulation of membranes16–18. Many fez gene clusters also encode one or more proteins with an N-terminal R-rich motif similar to that found in FezB (Extended Data Figs. 5b and 6a, and Supplementary Table 5). These proteins include both soluble and membrane proteins, including FezC (Extended Data Fig. 6a). In some of the larger fez gene clusters, we discovered a second uncharacterized P1B-ATPase (FezH) with an R-rich motif and distinct transmembrane metal-binding sites (Fig. 1g, h, Extended Data Fig. 6a and Supplementary Table 3). Conserved proteins also included a DUF4405 protein with homology to the membrane domains of FezC, a FeoA domain-containing protein and a DUF2202 ferritin-like protein with a C-terminal GXXXG motif (Fig. 1h, Extended Data Figs. 5b and 6, and Supplementary Table 6). These predicted motifs, as well as the genomic association of fez gene clusters with iron homeostasis genes12 (Extended Data Fig. 5c and Supplementary Table 7), support a model in which a complex of Fez proteins transports iron into ferrosomes for storage.
Ferrosome formation in diverse bacteria
The broad phylogenetic distribution of fez gene clusters suggests that diverse species of bacteria and archaea might be capable of forming ferrosomes. Because most of these organisms are uncultured or difficult to manipulate in the laboratory, we searched for culturable bacteria with established tools for genetic manipulation to serve as models for ferrosome formation. In addition to being genetically tractable, the gammaproteobacterium Shewanella putrefaciens strain CN-32 has been reported to form membrane-enclosed electron-dense granules consisting of mixed-valence iron, phosphorus and oxygen7,19. These granules could not be found in several other Shewanella species19. Among the Shewanella species tested in these studies, S. putrefaciens is the only one with a putative fez operon (Figs. 1h and 2a). Thus, we theorized that the iron-containing granules observed in previous studies are analogous to ferrosomes made by D. magneticus.
Fig. 2 |. fez genes are essential for ferrosome formation and function in S. putrefaciens.

a, The S. putrefaciens six-gene fez operon. Gene colours correspond to those in Fig. 1h. b–d, Micrographs of S. putrefaciens strains grown with hydrous ferric oxide, including WT (b), ΔfezSp (c) and ΔfezSp::fezSp (d). White arrows indicate ferrosomes. Scale bars, 200 nm (magnified images, 100 nm). e, Lag between strains, inferred by determining the time at which each culture reached half-maximum optical density at 595 nm (OD595). Each data point represents an independent culture, and bars correspond to the mean from six independent cultures. The data represented here are shown in Extended Data Fig. 9b. f, Growth curves of S. putrefaciens strains grown anaerobically with 0 or 100 μM EDTA. g, Growth curves of S. putrefaciens strains grown anaerobically with 0 or 100 μM EDTA together with 100 μM FeSO4. The key in f also applies to g. Data presented are the averages of three independent cultures (technical replicates); error bars, s.d.
As described in previous work, we found that S. putrefaciens forms electron-dense granules when respiring hydrous ferric oxide and/or fumarate in growth medium supplemented with iron (Fig. 2b and Extended Data Fig. 7a, b)7,19. Unlike in previous studies, we used a rich broth rather than a defined growth medium for all growth conditions. Likewise, the α-proteobacterium Rhodopseudomonas palustris strain CGA009, which has a similar fez operon to S. putrefaciens (Fig. 1h), formed electron-dense granules resembling ferrosomes when grown photoheterotrophically in anaerobic medium supplemented with iron (Extended Data Fig. 7c, d). This is in accordance with previous proteomic and transcriptomic studies showing that fez genes are expressed under anaerobic conditions in R. palustris strains CGA009 and TIE-1 (refs. 20–22). To confirm that the granules in S. putrefaciens and R. palustris are ferrosomes, we made markerless deletions of their fez gene clusters (ΔfezSp and ΔfezRp, respectively). Both the ΔfezSp and ΔfezRp mutants no longer made granules, and complementation by expression of their respective fez gene cluster in trans rescued the phenotype (Fig. 2b–d and Extended Data Fig. 7e–j). Similarly to D. magneticus, the ferrosomes observed after complementation were smaller than those in wild-type cells (Fig. 3l).
Fig. 3 |. fez genes enable ferrosome formation in foreign hosts.

a, b, WT E. coli cell pellets when grown anaerobically in the absence (a) or presence (b) of iron supplementation. c, d, Escherichia coli fezSp+ cell pellets when grown anaerobically in the absence (c) or presence (d) of iron supplementation. e–g, Micrographs of E. coli strains grown anaerobically in growth medium supplemented with iron, including WT E. coli harbouring a control plasmid (e) and E. coli fezSp+ (f, g). Electron-dense granules are indicated with arrows. Scale bars, 100 nm (e, f) and 50 nm (g). h, i, EDS spectra of an area in an E. coli cell with a control plasmid (h) and an area in an E. coli fezSp+ cell containing ferrosomes (i). A red asterisk indicates the iron peak. j, k, Micrographs of WT M. magneticum (j) and M. magneticum fezRp+ (k). Magnetosomes are indicated with white arrowheads. Yellow circles indicate areas containing one or more putative ferrosomes. Black circles indicate areas containing granules that are difficult to distinguish from magnetosomes owing to their proximity to the magnetosome chain. Scale bars, 100 nm. l, Maximum diameter of ferrosomes measured in the S. putrefaciens (Sp; n = 141) and R. palustris (Rp; n = 151) WT strains and Δfez mutants complemented with their respective fez operon (n = 217 and 160, respectively), E. coli (Ec) fezSp+ (n = 212) and M. magneticum (Mm) fezRp+ (n = 191). Each data point represents one ferrosome, and bars correspond to the mean maximum diameter.
Heterologous expression of ferrosomes
We next asked whether fez genes can lead to ferrosome formation in a naive host. To answer this question, we heterologously expressed fez gene clusters in Escherichia coli. When grown anaerobically in medium supplemented with iron, E. coli expressing fezSp (E. coli fezSp+) had a visibly dark pellet, whereas the control cultures and cultures grown without iron had a white pellet (Fig. 3a–d). Although no obvious growth phenotype was observed in E. coli fezSp+ cells, TEM identified electron-dense granules in E. coli fezSp+ cells grown with iron that were not found in E. coli cells carrying a control plasmid (Fig. 3e–g). The granules had an average diameter of around 20 nm (Fig. 3l), which is nearly double that of the proteinaceous iron storage compartments found naturally in E. coli1. To ensure that the granules observed in E. coli contain iron, we analysed their elemental composition using energy-dispersive X-ray spectroscopy (EDS) coupled with TEM and compared the spectra with those of ferrosomes in wild-type S. putrefaciens. While the spectra obtained for E. coli fezSp+ and S. putrefaciens showed similar chemical patterns, iron could only be detected when EDS analyses were focused on ferrosomes in both strains (Fig. 3h, i and Extended Data Fig. 8), demonstrating that iron was specifically accumulated in these structures. Attempts to produce ferrosomes in E. coli through expression of the R. palustris and D. magneticus fez genes were unsuccessful, perhaps owing to the more distant evolutionary relationship with these organisms.
Using another naive host, we found that the magnetosome-forming alphaproteobacterium Magnetospirillum magneticum strain AMB-1 also formed granules resembling ferrosomes when expressing the R. palustris fez operon (M. magneticum fezRp+) (Fig. 3j, k). The ferrosome-like granules in M. magneticum fezRp+ could be distinguished from magnetosomes because they were not aligned with magnetosomes and appeared less dense (Fig. 3k). Magnetite crystals in M. magneticum magnetosomes also showed sharp edges clearly distinct from the amorphous ferrosomes6. The ferrosome-like particles observed in M. magneticum fezRp+ were, on average, larger than those in E. coli fezSp+ (Fig. 3l). This could in part be due to the large pool of intracellular dissolved iron in M. magneticum, which is 10- to 100-fold larger than that in E. coli23. In summary, these results show that fez genes are necessary and sufficient for ferrosome formation in diverse bacteria.
A role for ferrosomes in iron homeostasis
The genetic components of fez gene clusters, patterns of ferrosome formation and iron accumulation in ferrosomes point to a role for this organelle in iron homeostasis. In other systems, iron storage compartments are important for surviving iron starvation. Using S. putrefaciens as a model, we found that addition of the iron chelator EDTA impaired aerobic and anaerobic growth for both the wild-type and ΔfezSp strains (Extended Data Fig. 9a). When grown aerobically, where no ferrosomes are formed7, the wild-type and ΔfezSp strains showed no difference in growth (Extended Data Fig. 9a). However, under anaerobic growth conditions with EDTA, the ΔfezSp mutant had a longer lag phase when compared with the wild-type strain (Fig. 2e and Extended Data Fig. 9b)—a phenotype that was rescued in the ΔfezSp::fezSp complementation strain (Fig. 2f). The growth defects observed with the addition of EDTA were rescued by adding equimolar concentrations of iron (Fig. 2g), suggesting that the growth phenotype is specifically due to iron limitation induced with EDTA. Overall, these results mirror the iron storage defect reported in the E. coli ferritin mutant during aerobic growth24. They are also consistent with recent findings that lag phase is a growth period dominated by accumulation of metals, such as iron, needed for the heavy enzymatic burden of exponential phase25. Therefore, we propose that ferrosomes in S. putrefaciens probably function to store iron during anaerobic metabolism, which can be accessed under severe iron starvation conditions. Further work is needed to determine whether this function is universal in all ferrosome-forming bacteria.
Discussion
In summary, our study demonstrates the genetic requirement for ferrosome formation and provides evidence that ferrosomes function as an iron storage organelle during anaerobic metabolism. Our findings that Fez proteins, which have putative membrane domains, are associated with isolated ferrosomes and are required for ferrosome function provide additional support for two independent studies that found lipid-like membranes surrounding ferrosomes6,7. This is in marked contrast to all other previously described bacterial and archaeal systems that depend on proteinaceous compartments for iron storage4,5. While this study focused on environmental bacteria, iron storage may be a universal function of ferrosomes, including in host-associated bacteria. This hypothesis is supported by several unrelated studies in multiple bacteria showing that fez gene expression is upregulated in low-iron environments26–31, including during infection by Clostridioides difficile32. In the future, ferrosomes may prove to be a novel drug target for combating pathogenic bacteria. They may also be platforms for synthetic biomining and bioremediation applications that leverage their metal-accumulating capabilities.
Online content
Any methods, additional references, Nature Research reporting summaries, source data, extended data, supplementary information, acknowledgements, peer review information; details of author contributions and competing interests; and statements of data and code availability are available at https://doi.org/10.1038/s41586-022-04741-x.
Methods
Strains, media and growth conditions
The bacterial strains used in this study are listed in Supplementary Table 8. All aerobic cultures were grown with continuous shaking at 250 r.p.m. Anaerobic cultures and plates were grown at 30 °C in an anaerobic glovebox or in sealed Balch tubes with an N2 headspace containing medium that was degassed with N2. Ferrous iron stocks were prepared by dissolving 1 M FeSO4 in 0.1 N HCl and were subsequently stored in an anaerobic glovebox. Stocks of ferric malate were prepared as 20 mM FeCl3/60 mM malate, unless otherwise stated. If needed, nitrilotriacetic acid (NTA) disodium salt was added to the ferrous iron just before use to prevent precipitation of iron in the growth medium33. NTA alone did not affect cellular growth.
Desulfovibrio magneticus strains were grown at 30 °C anaerobically in RS-1 growth medium (RGM), as described previously6,10. For growth in iron-replete medium, 100 μM ferric malate was added to RGM before inoculation. For growth in iron-limited medium (IL-RGM), iron was omitted from RGM and all glassware was soaked in oxalic acid for 1 to 2 d, as described previously6. To starve cells of iron, cultures were passaged in IL-RGM, as described previously6, or washed with IL-RGM before inoculation. To induce ferrosome formation, iron-starved cells were grown anaerobically in IL-RGM until they reached an OD650 of about 0.1, at which point ferric malate was added to the cultures at a concentration of 100 μM, unless otherwise stated6.
Shewanella putrefaciens strains were grown aerobically at 30 °C in LB or anaerobically at 30 °C in LB supplemented with 10 mM lactate and 10 mM fumarate or hydrous ferric oxide (HFO). HFO was prepared as described previously7. As needed, 1 mM ferrous iron and 2 mM NTA, 100 μM ferrous iron or 100 μM ferric malate was added to the anaerobic growth medium.
Rhodopseudomonas palustris strains were grown aerobically at 30 °C in the dark in YP medium (0.3% yeast extract and 0.3% peptone) or anaerobically in photoheterotrophic medium (PM) supplemented with 10 mM succinate (PMS-10), as described previously34. Anaerobic cultures were incubated in a growth chamber with constant light (100 μE of photosynthetically active radiation). As needed, 1 mM ferrous iron was added to the anaerobic growth medium. Because R. palustris can oxidize ferrous iron, 3.4 mM citrate trisodium dihydrate was added to prevent ferric iron precipitates from accumulating in the growth medium35.
Escherichia coli strains were grown aerobically at 37 °C in LB or anaerobically at 30 °C in M9 minimal medium supplemented with 0.4% glucose and 20 mM fumarate. For anaerobic growth, 285 μM l-cysteine was added as a reducing agent. As needed, the anaerobic medium was supplemented with iron (1 mM ferrous iron and 2 mM NTA) or without iron (0.1 mN HCl and 2 mM NTA).
Magnetospirillum magneticum strains were cultured in Magnetospirillum growth (MG) medium containing Wolfe’s vitamins36,37. Iron (30 μM) was added from a stock of 3 mM FeCl3/9 mM malate. Cells were grown in tubes filled with MG medium to the top and incubated in a 30 °C incubator, as described previously37. For growth on solid medium, 0.7% agar was added and plates were incubated at 30 °C in a sealed jar with 7% oxygen.
Antibiotics and selective reagents used were as follows: kanamycin (50 μg ml−1 for E. coli and S. putrefaciens, 125 μg ml−1 for D. magneticus, 200 μg ml−1 for R. palustris, and 7 μg ml−1 in liquid cultures and 10 μg ml−1 in solid media for M. magneticum), streptomycin (50 μg ml−1 for E. coli and D. magneticus), diaminopilmelic acid (DAP) (300 μM for E. coli WM3064) and sucrose (10% for R. palustris and S. putrefaciens, 1% for D. magneticus).
Plasmids and cloning
Plasmids used in this study are listed in Supplementary Table 9. In-frame deletion vectors targeting fezRp and fezSp were constructed by amplifying upstream and downstream homology regions from R. palustris strain CGA009 and S. putrefaciens strain CN-32 genomic DNA, respectively, using the primers listed in Supplementary Table 10. The homology regions were then inserted into the SpeI site of pAK31 using the Gibson cloning method. The deletion vector for fezBCDm was constructed by amplifying upstream and downstream homology regions from D. magneticus strain AK80 genomic DNA using the primers listed in Supplementary Table 10. The Pnpt-strAB cassette was subsequently ligated between the upstream and downstream homology regions of the deletion vector via BamHI. Expression plasmids for fezRp and fezSp were constructed by amplifying the respective gene cluster using the primers listed in Supplementary Table 10. The amplified DNA was inserted into HindIII- and SpeI-digested pAK22 via the Gibson cloning method. The ΔfezBCDm complementation vector was constructed by amplifying Pfez-fezABC from D. magneticus genomic DNA using the primers listed in Supplementary Table 10. The amplified DNA was then ligated into the SalI and XbaI sites of the expression vector pBMK7.
Plasmids were transformed into E. coli WM3064 and then transferred to D. magneticus, S. putrefaciens, R. palustris or M. magneticum via conjugation. For D. magneticus, conjugations were performed as described previously10. Allelic replacement of fezBCDm (dmr_28330–40) with strAB was achieved with streptomycin selection and sucrose counterselection, as described previously9. Attempts to isolate a fezABCDm mutant with this method were unsuccessful. Conjugal transfer of plasmids to R. palustris was performed as described previously21,38. Transconjugants were selected on YP plates with 200 μg ml−1 kanamycin. For conjugal transfer of plasmids to S. putrefaciens, overnight cultures of S. putrefaciens and E. coli WM3064 carrying the plasmid to be transferred were mixed, spotted on LB agar plates containing DAP and incubated aerobically at 30 °C for 1 d. Transconjugants were selected with 50 μg ml–1 kanamycin. ΔfezRp and ΔfezSp candidates were selected on 10% sucrose plates and screened for kanamycin sensitivity. Deletions were also confirmed by PCR. Conjugal transfer of plasmids to M. magneticum was performed as described previously, and transconjugants were selected on MG agar plates with 10 μg ml−1 kanamycin36,37.
Ferrosome isolation
Desulfovibrio magneticus was grown anaerobically in IL-RGM. Cells were then passaged 1:400 into 2 litres of anaerobic IL-RGM as described above. When the culture reached an OD650 of about 0.1, 100 μM ferric malate was added. After 3 h, cells were pelleted at 8,000g for 20 min and flash frozen in liquid nitrogen before storing at −80 °C. Samples were observed by TEM before and after the addition of iron to ensure ferrosomes had formed. We found that this method enriches for both ferrosomes and magnetosomes (Extended Data Fig. 2a–c). To prevent contamination with magnetosomes and magnetosome proteins, we isolated ferrosomes from a magnetosome gene island deletion strain, ΔMAI, and prepared the samples for proteomics.
Cell pellets were thawed on ice and resuspended with ice-cold LyA buffer (10 mM Tris-HCl pH 8.0, 50 mM NaCl and 1 mM EDTA) containing 250 mM sucrose, 1 μg ml−1 leupeptin and pepstatin A, and 1 mM PMSF. Cells were lysed by passage through a French pressure cell three times. The lysate was then passed through a 0.2-μm filter to remove unlysed cells. The filtered cell lysate was gently layered over a 65% sucrose cushion and centrifuged at 35,000 r.p.m. for 2 h at 4 °C. The resulting pellet was resuspended in 1 ml LyA supplemented with leupeptin, pepstatin and PMSF and washed two times with LyA before resuspending in a final volume of 50 μl.
Liquid chromatography and mass spectrometry
Isolated ferrosomes (5 μg) and whole-cell lysate (50 μg) were prepared for liquid chromatography followed by mass spectrometry (LC–MS) analysis as described previously39. Trypsin-digested protein samples were each analysed in triplicate using an Acquity M-class ultra-performance liquid chromatography (UPLC) system that was connected in line with a Synapt G2-Si mass spectrometer equipped with a nanoelectrospray ionization source (Waters). The UPLC system was equipped with trapping (Symmetry C18; inner diameter, 180 μm; length, 20 mm; particle size, 5 μm) and analytical (HSS T3; inner diameter, 75 μm; length, 250 mm; particle size, 1.8 μm) columns (Waters). Ion mobility-enabled, high-definition mass spectra and tandem mass spectra were acquired in a data-independent manner in positive ion mode40–42. Data acquisition was controlled using MassLynx software (version 4.1), and tryptic peptide identification and relative protein quantification using a label-free approach43–45 were performed using Progenesis QI for Proteomics software (version 4.0, Nonlinear Dynamics/Waters). This methodology has been used previously in similar experiments46–49. Raw data were searched against the D. magneticus strain RS-1 translated protein database, in FASTA format, to identify tryptic peptides. A list of all proteins identified is available in Supplementary Table 11.
Electron microscopy
Whole-cell TEM was performed as described previously6. All TEM was done using the Tecnai 12 at the EM-Lab at the University of California, Berkeley. Ferrosomes were measured with the Analyze Particles tool in ImageJ (1.52q)50.
Chemical composition of ferrosomes
Ferrosome-containing and ferrosome-free E. coli and S. putrefaciens strains were deposited on copper grids coated with a formvar carbon membrane. The chemical composition of ferrosomes was investigated with EDS (Oxford X-max 80T detector) using a transmission electron microscope (FEI Tecnai G2 operating at 200 kV). EDS spectra were acquired under Scanning TEM (STEM) mode.
Shewanella putrefaciens growth tests
For aerobic growth tests, S. putrefaciens WT and ΔfezSp strains grown aerobically overnight were used as an inoculum at a 1:1,000 dilution. For anaerobic growth tests, S. putrefaciens strains grown anaerobically to stationary phase were used as an inoculum at a 1:200 dilution. For all anaerobic growth assays, LB was supplemented with lactate (10 mM) and fumarate (10 mM) and the precultures and experiments were set up and performed inside an anaerobic glovebag. For the complementation assays shown in Fig. 2f, g, WT and ΔfezSp (both carrying the control plasmid pBBR1MCS-2) and ΔfezSp::fezSp were inoculated in anaerobic LB supplemented with lactate, fumarate and kanamycin. The 96-well plates were sealed with a Breathe-Easy (Diversified Biotech) membrane seal and incubated at 30 °C with continuous shaking, and growth was monitored by measuring the absorbance at 595 nm at 15-min intervals in a Sunrise microplate reader (Tecan) controlled with Magellan software.
For each plate assay, the early time points returned values that were below the detection limit and there was variability in the baseline reading among the wells, similar to what was described in a recent study51. To account for this variability, we normalized the data by subtracting the average of the first four measurements of each well from each time point in the corresponding well. To account for the effects of evaporation on the data, we next subtracted the average of three or four blank wells, which contained growth medium and no inoculum, from each measurement over the time course. One sample, ΔfezSp::fezSp grown with 100 μM EDTA, was omitted from further analysis owing to noise throughout the time course. The lag in growth was inferred by calculating the time at which each strain reached half-maximum OD595. To determine the growth rate, the slope of the natural log of OD595 versus time over a sliding window of seven time points was calculated. Graphs displaying the growth curves, lag times and growth rates were created using GraphPad Prism (versions 8 and 9). The raw data are provided as Supplementary Data 1.
Multiple-sequence alignments and tree construction
Unique protein sequences were obtained by searching DMR_28330 and selected subsequent target sequences against all isolates in IMG/M ER52. Representative P1B-ATPase sequences from characterized subgroups 1–4 (CopA, ZntA, CopB and PfeT, as well as a P1A-ATPase, KdpB) were also included. Sequences were aligned using MUSCLE in MEGA (7.0.26)53, with a gap open penalty of −6.9, and the resulting alignment was trimmed using Gblocks54. The trimmed alignment was used to generate a phylogeny using RAxML55 with the LG+G+F model (determined using SMS56) and 100 bootstraps. The tree was rooted with KdpB and visualized and annotated using iTol57.
To examine the synteny of fez gene clusters, we compiled a database of 304 FezB homologues identified in our phylogenetic analysis and the proteins encoded by the ten genes upstream and downstream of fezB for each species. We performed an all-versus-all search of these proteins using mmseqs2 10.6d92c58 (-s 7.5, -c 0.4, -e 1). The results from this search were uploaded into Cytoscape59 with an e-value cut-off of <0.01 to generate a sequence similarity network. The Kyoto Encyclopedia of Genes and Genomes (KEGG)60 was used to identify conserved fez gene clusters containing FezB homologues (Extended Data Fig. 5a). These proteins were then mapped to nodes in eight different groups in the sequence similarity network. The Cytoscape plugin ClusterMaker61 was used to subdivide the following groups through Markov clustering (MCL) with the inflation value set to 1.5: group 1 (−log(e value) 100); group 2 (−log(e value) 2.5); and group 3 (−log(e value) 5). Each group and subgroup with three or more proteins was then aligned with Clustal Omega62. For each alignment, HMMER 3.1b2 was used to build a hidden Markov model, which was searched against our database63,64. Subgroups that shared hits below a threshold of 1 × 10⁻²⁰ were merged and realigned. These alignments showed a conserved GXXXG motif (or, less frequently, a GXXX[A/S] motif) for proteins in groups 2 and 5 and an R-rich motif for proteins in groups 1 and 3. Putative transmembrane domains were identified with TOPCONS 1.0 (ref. 65). Sequence logos of R-rich and GXXXG motif-containing proteins were generated with WebLogo66.
Reporting summary
Further information on research design is available in the Nature Research Reporting Summary linked to this paper.
Extended Data
Extended Data Fig. 1 |. Ferrosomes are visible by TEM in whole D. magneticus cells after transitioning from iron limited to iron replete conditions.

D. magneticus cells initially grown without iron (a) are shown 0.5 (b), 1.5 (c), and 6 (d) hours after addition of 100 μM ferric malate. (e) The maximum diameter of ferrosomes represented in b-d. Each data point represents one ferrosome and the bar indicates the mean maximum diameter in nm. Micrographs of D. magneticus one hour after adding low to high concentrations of ferric malate—1 μM (f), 10 μM (g), 100 μM (h), and 1 mM (i)—to iron-starved cells. (j) The maximum diameter of ferrosomes represented in f-i. Each data point represents one ferrosome and the bar indicates the mean maximum diameter in nm. Scale bars, 200 nm.
Extended Data Fig. 2 |. Isolation of ferrosomes and characteristics of associated proteins.

(a) Ferrosomes from ΔMAI D. magneticus (left) and magnetosomes from WT D. magneticus (right) form a pellet through 65% sucrose. Transmission electron micrographs of the ferrosome pellet (b) and the magnetosome pellet (c). Scale bars, 100 nm. (d-f) Membrane domain predictions of ferrosome-associated proteins in D. magneticus. DMR_28320 (a), DMR_28330 (b), and DMR_28340 (c) have 1, 5–6, and 0–2 putative transmembrane domains, respectively, as predicted by various methods analyzed through TOPCONS 1.065.
Extended Data Fig. 3 |. Multiple sequence alignment of FezB with characterized P1B-ATPases.

Conserved functional motifs in the actuator domain and the ATP-binding domain are indicated with blue and purple stars, respectively. The CxxC and histidine-rich metal binding sites in the cytoplasmic N-terminal domain of ZntA, CopA, and CopB are boxed. Transmembrane regions, predicted using TOPCONS 1.065, are underlined for each sequence. Putative metal-binding sites in the transmembrane domains are indicated with black stars.
Extended Data Fig. 4 |. WT and ΔfezBCD. magneticus strains make ferrosomes in iron replete medium when expressing fezABC in trans.

Transmission electron micrographs of WT (a) and ΔfezBC (b) strains with a control plasmid make magnetosomes (white carets) when grown in iron replete medium. When expressing fezABC in trans, both the WT (c) and ΔfezBC (d) strains make magnetosomes as well as ferrosomes when grown in iron replete medium. Areas of the cell containing one or more putative ferrosomes are indicated with yellow circles. Scale bars, 200 nm.
Extended Data Fig. 5 |. Sequence similarity network of proteins encoded by fez gene clusters and genes frequently found near fez gene clusters.

(a) Conserved fez gene clusters that encode FezB homologs. Conserved genes within the clusters are colored black. Gene clusters were identified using the “Gene cluster” tool in KEGG for each FezB homolog, in bold: Dde_0495, Dde_0498, Thimo_2900, vfu_A02104, SMUL_2748, RPA2333, KN400_3199, DMR_28330, and EUBELI_00578. The second copy of FezB in D. alaskensis, Dde_0498, is not shown because it is not part of a predicted conserved gene cluster. (b, c) Sequence similarity network highlighting the proteins encoded by ten genes upstream and downstream of 304 FezB homologs. Each node represents a protein and edges represent protein similarities that meet the specified e-value cutoff. (b) Network containing fez gene cluster-encoded proteins. Each group (labeled 1–8) contains one or more proteins encoded by conserved genes identified in (a) which are represented by black nodes and are labeled. Proteins or domains with an annotated function are labeled. Groups of proteins were further divided into subgroups which were used to identify proteins with GxxxG motifs in groups 2 and 5 and proteins with R-rich motifs in groups 1 and 3 (see Methods). The proteins represented in this network and their group/subgroup are listed in Supplementary Tables 3–6. (c) Network of proteins encoded by genes that are frequently found upstream and downstream of fez gene clusters. Only groups of more than 30 proteins are shown and the protein or domain annotation is labeled. Proteins with a known role in iron homeostasis are common and include iron transporters (FeoA, FeoB, outermembrane siderophore receptors, and some ABC transporters) and regulators (Fur and DtxR). The proteins represented in this network are listed in Supplementary Table 7.
Extended Data Fig. 6 |. Consensus motifs and characteristics of proteins with R-rich and GxxxG motifs.

Representative proteins encoded by fez gene clusters with (a) an R-rich motif or (b) a GxxxG motif. Logo shows the consensus motif for the subgroup or group of proteins to which the representative protein belongs. Predicted protein structure schematics show approximate location of the R-rich motif, putative transmembrane helices, and GxxxG motif for each protein (not to scale).
Extended Data Fig. 7 |. Transmission electron micrographs of S. putrefaciens and R. palustris.

WT S. putrefaciens (a, b) and R. palustris (c, d), ΔfezSp (e, f), ΔfezRp (g), ΔfezSp::fezSp (h, i), and ΔfezRp::fezRp ( j). S. putrefaciens strains respiring fumarate in medium supplemented with 100 μM ferric malate (a, e, i) or 1 mM ferrous iron (b, f, j). R. palustris strains grown anaerobically (d, g, h) or aerobically (c). White arrows denote ferrosomes. Polyphosphate granules are indicated with white asterisks. Scale bars, 200 nm.
Extended Data Fig. 8 |. EDS spectra of S. putrefaciens and E. coli.

EDS spectrum of an S. putrefaciens ΔfezSp cell, which does not form ferrosomes. (b, c) EDS spectra of S. putrefaciens WT obtained from an area in the cell that contained ferrosomes (b) and an area that had no visible ferrosomes (c). The red asterisk indicates the iron peak associated with ferrosomes in WT S. putrefaciens. (d, e) Spectra of the background taken from areas of the S. putrefaciens WT (d) and ΔfezSp (e) grids that contained no cells. (f) An EDS spectrum of E. coli fezSp + obtained from an area in the cell that had no visible ferrosomes. (g, h) Spectra of the background taken from areas of the E. coli cells with a control plasmid (g) or E. coli fezSp + (h).
Extended Data Fig. 9 |. Effect of EDTA on the growth of S. putrefaciens.
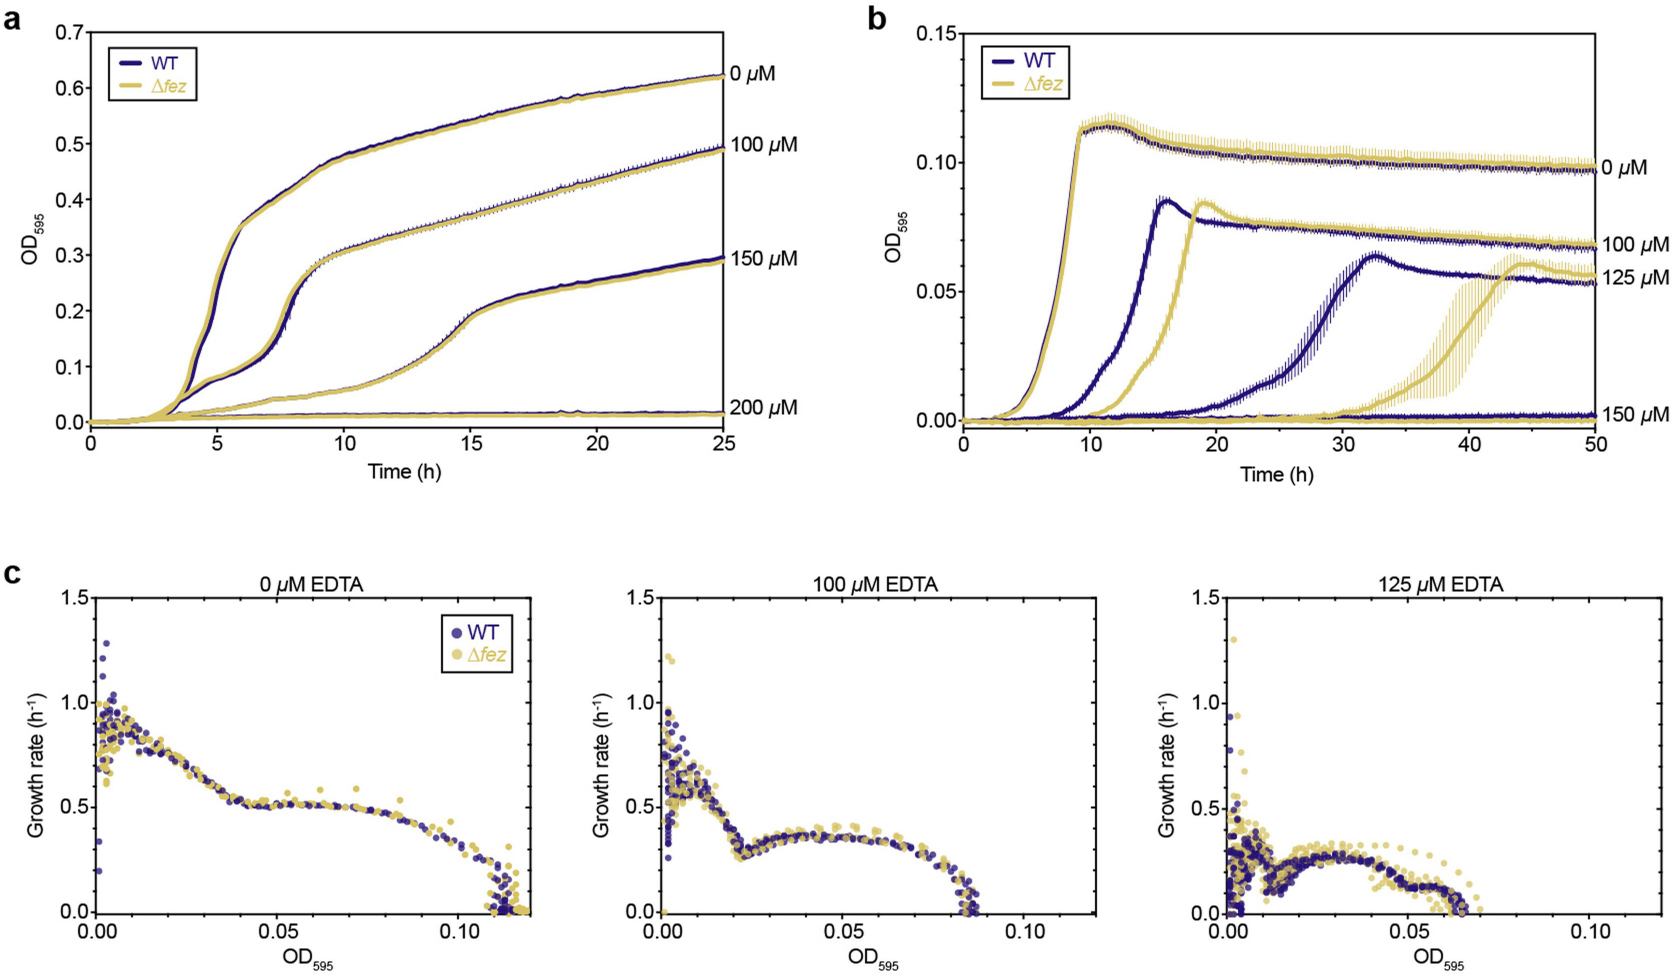
(a) OD595 measurements over time of S. putrefaciens WT (navy) and ΔfezSp (yellow) grown aerobically with the indicated concentrations of EDTA. Each line is the mean of 3 individual cultures (technical replicates); error bars indicate s.d. (b) OD595 measurements over time of S. putrefaciens WT (navy) and ΔfezSp (yellow) grown anaerobically with the indicated concentrations of EDTA. Each line is the mean of 6 individual cultures (2 biological replicates with 3 technical replicates, with the exception of 150 μM EDTA which had 2 technical replicates); error bars indicate s.d. (c) Growth rate versus OD595 of the individual cultures shown in (b). Each circle represents the growth rate for an individual culture.
Supplementary Material
Acknowledgements
We thank faculty at the EM-Lab at the University of California, Berkeley, for their assistance with TEM; A. Campos for assistance with the EDS measurements; M. Pang for assistance in culturing R. palustris for ferrosome production; K. LeGault and H. McCausland for their help with conjugations in R. palustris and M. magneticum; J. Gralnick (University of Minnesota) for providing S. putrefaciens strain CN-32; and the Coates laboratory and the Niyogi laboratory for sharing equipment. The QB3/Chemistry Mass Spectrometry Facility at the University of California, Berkeley, received support from the National Institutes of Health (shared instrumentation grant 1S10OD020062–01). Research reported in this publication was supported by funding from the National Institutes of Health (R01GM084122 and R35GM127114), the Office of Naval Research (N000141310421) and the Bakar Fellows Program. H.A.T. is supported by the National Science Foundation Graduate Research Fellowship Program under grant DGE 1752814. M.A. is supported by a grant through the Fondation pour la Recherche Médicale (ARF201909009123).
Footnotes
Competing interests The authors declare no competing interests.
Supplementary information The online version contains supplementary material available at https://doi.org/10.1038/s41586-022-04741-x.
Peer review information Nature thanks the anonymous reviewers for their contribution to the peer review of this work.
Reprints and permissions information is available at http://www.nature.com/reprints.
Data availability
The mass spectrometry proteomics data have been deposited to the ProteomeXchange Consortium via the PRIDE67 partner repository with dataset identifier PXD017470. Ferrosome-associated proteins presented in Fig. 1a were identified from the data in Supplementary Table 11. The sequences, alignment and tree data used to generate Fig. 1g are provided as Supplementary Data 2. KEGG60 and IMG/M ER52 were used to collect data.
References
- 1.Andrews SC In Advances in Microbial Physiology vol. 40 (ed. Poole RK) 281–351 (Academic, 1998). [DOI] [PubMed] [Google Scholar]
- 2.Touati D Iron and oxidative stress in bacteria. Arch. Biochem. Biophys. 373, 1–6 (2000). [DOI] [PubMed] [Google Scholar]
- 3.Andrews SC, Robinson AK & Rodríguez-Quiñones F Bacterial iron homeostasis. FEMS Microbiol. Rev. 27, 215–237 (2003). [DOI] [PubMed] [Google Scholar]
- 4.Andrews SC The ferritin-like superfamily: evolution of the biological iron storeman from a rubrerythrin-like ancestor. Biochim. Biophys. Acta 1800, 691–705 (2010). [DOI] [PubMed] [Google Scholar]
- 5.Nichols RJ, Cassidy-Amstutz C, Chaijarasphong T & Savage DF Encapsulins: molecular biology of the shell. Crit. Rev. Biochem. Mol. Biol. 52, 583–594 (2017). [DOI] [PubMed] [Google Scholar]
- 6.Byrne ME et al. Desulfovibrio magneticus RS-1 contains an iron- and phosphorus-rich organelle distinct from its bullet-shaped magnetosomes. Proc. Natl Acad. Sci. USA 107, 12263–12268 (2010). [DOI] [PMC free article] [PubMed] [Google Scholar]
- 7.Glasauer S, Langley S & Beveridge TJ Intracellular iron minerals in a dissimilatory iron-reducing bacterium. Science 295, 117–119 (2002). [DOI] [PubMed] [Google Scholar]
- 8.Sakaguchi T, Arakaki A & Matsunaga T Desulfovibrio magneticus sp. nov., a novel sulfate-reducing bacterium that produces intracellular single-domain-sized magnetite particles. Int. J. Syst. Evol. Microbiol. 52, 215–221 (2002). [DOI] [PubMed] [Google Scholar]
- 9.Grant CR, Rahn-Lee L, LeGault KN & Komeili A Genome editing method for the anaerobic magnetotactic bacterium Desulfovibrio magneticus RS-1. Appl. Env. Microbiol. 84, e01724–18 (2018). [DOI] [PMC free article] [PubMed] [Google Scholar]
- 10.Rahn-Lee L et al. A genetic strategy for probing the functional diversity of magnetosome formation. PLoS Genet. 11, e1004811 (2015). [DOI] [PMC free article] [PubMed] [Google Scholar]
- 11.Argüello JM, Eren E & González-Guerrero M The structure and function of heavy metal transport P1B-ATPases. BioMetals 20, 233 (2007). [DOI] [PubMed] [Google Scholar]
- 12.Smith AT, Smith KP & Rosenzweig AC Diversity of the metal-transporting P1B-type ATPases. J. Biol. Inorg. Chem. 19, 947–960 (2014). [DOI] [PMC free article] [PubMed] [Google Scholar]
- 13.Chan H et al. The P-type ATPase superfamily. J. Mol. Microbiol. Biotechnol. 19, 5–104 (2010). [DOI] [PubMed] [Google Scholar]
- 14.Padilla-Benavides T, Long JE, Raimunda D, Sassetti CM & Argüello JM A novel P1B-type Mn2+-transporting ATPase is required for secreted protein metallation in mycobacteria. J. Biol. Chem. 288, 11334–11347 (2013). [DOI] [PMC free article] [PubMed] [Google Scholar]
- 15.Botella H et al. Mycobacterial P1-type ATPases mediate resistance to zinc poisoning in human macrophages. Cell Host Microbe 10, 248–259 (2011). [DOI] [PMC free article] [PubMed] [Google Scholar]
- 16.Russ WP & Engelman DM The GxxxG motif: a framework for transmembrane helix–helix association. J. Mol. Biol. 296, 911–919 (2000). [DOI] [PubMed] [Google Scholar]
- 17.Unterreitmeier S et al. Phenylalanine promotes interaction of transmembrane domains via GxxxG motifs. J. Mol. Biol. 374, 705–718 (2007). [DOI] [PubMed] [Google Scholar]
- 18.Jarsch IK, Daste F & Gallop JL Membrane curvature in cell biology: an integration of molecular mechanisms. J. Cell Biol. 214, 375–387 (2016). [DOI] [PMC free article] [PubMed] [Google Scholar]
- 19.Glasauer S et al. Mixed-valence cytoplasmic iron granules are linked to anaerobic respiration. Appl. Environ. Microbiol. 73, 993–996 (2007). [DOI] [PMC free article] [PubMed] [Google Scholar]
- 20.VerBerkmoes NC et al. Determination and comparison of the baseline proteomes of the versatile microbe Rhodopseudomonas palustris under its major metabolic states. J. Proteome Res. 5, 287–298 (2006). [DOI] [PubMed] [Google Scholar]
- 21.Rey FE & Harwood CS FixK, a global regulator of microaerobic growth, controls photosynthesis in Rhodopseudomonas palustris. Mol. Microbiol. 75, 1007–1020 (2010). [DOI] [PubMed] [Google Scholar]
- 22.Bose A & Newman DK Regulation of the phototrophic iron oxidation (pio) genes in Rhodopseudomonas palustris TIE-1 is mediated by the global regulator, FixK. Mol. Microbiol. 79, 63–75 (2011). [DOI] [PMC free article] [PubMed] [Google Scholar]
- 23.Amor M et al. Magnetotactic bacteria accumulate a large pool of iron distinct from their magnetite crystals. Appl. Environ. Microbiol. 86, e01278–20 (2020). [DOI] [PMC free article] [PubMed] [Google Scholar]
- 24.Abdul-Tehrani H et al. Ferritin mutants of Escherichia coli are iron deficient and growth impaired, and fur mutants are iron deficient. J. Bacteriol. 181, 1415–1428 (1999). [DOI] [PMC free article] [PubMed] [Google Scholar]
- 25.Rolfe MD et al. Lag phase is a distinct growth phase that prepares bacteria for exponential growth and involves transient metal accumulation. J. Bacteriol. 194, 686–701 (2012). [DOI] [PMC free article] [PubMed] [Google Scholar]
- 26.Bender KS et al. Analysis of a ferric uptake regulator (Fur) mutant of Desulfovibrio vulgaris Hildenborough. Appl. Environ. Microbiol. 73, 5389–5400 (2007). [DOI] [PMC free article] [PubMed] [Google Scholar]
- 27.Uebe R et al. Deletion of a fur-like gene affects iron homeostasis and magnetosome formation in Magnetospirillum gryphiswaldense. J. Bacteriol. 192, 4192–4204 (2010). [DOI] [PMC free article] [PubMed] [Google Scholar]
- 28.Wang Q et al. Physiological characteristics of Magnetospirillum gryphiswaldense MSR-1 that control cell growth under high-iron and low-oxygen conditions. Sci. Rep. 7, 2800 (2017). [DOI] [PMC free article] [PubMed] [Google Scholar]
- 29.Pereira PM et al. Transcriptional response of Desulfovibrio vulgaris Hildenborough to oxidative stress mimicking environmental conditions. Arch. Microbiol. 189, 451–461 (2008). [DOI] [PubMed] [Google Scholar]
- 30.Zhou A et al. Hydrogen peroxide-induced oxidative stress responses in Desulfovibrio vulgaris Hildenborough. Environ. Microbiol. 12, 2645–2657 (2010). [DOI] [PubMed] [Google Scholar]
- 31.Caffrey SM & Voordouw G Effect of sulfide on growth physiology and gene expression of Desulfovibrio vulgaris Hildenborough. Antonie Van Leeuwenhoek 97, 11–20 (2010). [DOI] [PubMed] [Google Scholar]
- 32.Ho TD & Ellermeier CD Ferric uptake regulator Fur control of putative iron acquisition systems in Clostridium difficile. J. Bacteriol. 197, 2930–2940 (2015). [DOI] [PMC free article] [PubMed] [Google Scholar]
- 33.Jiao Y & Newman DK The pio operon is essential for phototrophic Fe(II) oxidation in Rhodopseudomonas palustris TIE-1. J. Bacteriol. 189, 1765–1773 (2007). [DOI] [PMC free article] [PubMed] [Google Scholar]
- 34.Kim M-K & Harwood CS Regulation of benzoate-CoA ligase in Rhodopseudomonas palustris. FEMS Microbiol. Lett. 83, 199–203 (1991). [Google Scholar]
- 35.Guan G et al. PfeT, a P1B4-type ATPase, effluxes ferrous iron and protects Bacillus subtilis against iron intoxication. Mol. Microbiol. 98, 787–803 (2015). [DOI] [PMC free article] [PubMed] [Google Scholar]
- 36.Komeili A, Vali H, Beveridge TJ & Newman DK Magnetosome vesicles are present before magnetite formation, and MamA is required for their activation. Proc. Natl Acad. Sci. USA 101, 3839–3844 (2004). [DOI] [PMC free article] [PubMed] [Google Scholar]
- 37.Murat D, Quinlan A, Vali H & Komeili A Comprehensive genetic dissection of the magnetosome gene island reveals the step-wise assembly of a prokaryotic organelle. Proc. Natl Acad. Sci. USA 107, 5593–5598 (2010). [DOI] [PMC free article] [PubMed] [Google Scholar]
- 38.Rey FE, Oda Y & Harwood CS Regulation of uptake hydrogenase and effects of hydrogen utilization on gene expression in Rhodopseudomonas palustris. J. Bacteriol. 188, 6143–6152 (2006). [DOI] [PMC free article] [PubMed] [Google Scholar]
- 39.Clark IC et al. Synthetic and evolutionary construction of a chlorate-reducing Shewanella oneidensis MR-1. mBio 6, e00282–15 (2015). [DOI] [PMC free article] [PubMed] [Google Scholar]
- 40.Plumb RS et al. UPLC/MSE: a new approach for generating molecular fragment information for biomarker structure elucidation. Rapid Commun. Mass Spectrom. 20, 1989–1994 (2006). [DOI] [PubMed] [Google Scholar]
- 41.Geromanos SJ, Hughes C, Ciavarini S, Vissers JPC & Langridge JI Using ion purity scores for enhancing quantitative accuracy and precision in complex proteomics samples. Anal. Bioanal. Chem. 404, 1127–1139 (2012). [DOI] [PubMed] [Google Scholar]
- 42.Shliaha PV, Bond NJ, Gatto L & Lilley KS Effects of traveling wave ion mobility separation on data independent acquisition in proteomics studies. J. Proteome Res. 12, 2323–2339 (2013). [DOI] [PubMed] [Google Scholar]
- 43.Levin Y & Bahn S LC–MS/MS in proteomics. Methods Mol. Biol 658, 217–231 (2010). [DOI] [PubMed] [Google Scholar]
- 44.Neilson KA et al. Less label, more free: approaches in label-free quantitative mass spectrometry. Proteomics 11, 535–553 (2011). [DOI] [PubMed] [Google Scholar]
- 45.Nahnsen S, Bielow C, Reinert K & Kohlbacher O Tools for label-free peptide quantification. Mol. Cell. Proteomics 12, 549–556 (2013). [DOI] [PMC free article] [PubMed] [Google Scholar]
- 46.Light SH et al. A flavin-based extracellular electron transfer mechanism in diverse Gram-positive bacteria. Nature 562, 140–144 (2018). [DOI] [PMC free article] [PubMed] [Google Scholar]
- 47.Engström P et al. Evasion of autophagy mediated by Rickettsia surface protein OmpB is critical for virulence. Nat. Microbiol. 4, 2538–2551 (2019). [DOI] [PMC free article] [PubMed] [Google Scholar]
- 48.Pinals RL et al. Quantitative protein corona composition and dynamics on carbon nanotubes in biological environments. Angew. Chem. Int. Ed. 59, 23668–23677 (2020). [DOI] [PMC free article] [PubMed] [Google Scholar]
- 49.Engström P, Burke TP, Tran CJ, Iavarone AT & Welch MD Lysine methylation shields an intracellular pathogen from ubiquitylation and autophagy. Sci. Adv. 7, eabg2517 (2021). [DOI] [PMC free article] [PubMed] [Google Scholar]
- 50.Schneider CA, Rasband WS & Eliceiri KW NIH Image to ImageJ: 25 years of image analysis. Nat. Methods 9, 671–675 (2012). [DOI] [PMC free article] [PubMed] [Google Scholar]
- 51.Atolia E et al. Environmental and physiological factors affecting high-throughput measurements of bacterial growth. mBio 11, e01378–20 (2020). [DOI] [PMC free article] [PubMed] [Google Scholar]
- 52.Chen I-MA et al. IMG/M v.5.0: an integrated data management and comparative analysis system for microbial genomes and microbiomes. Nucleic Acids Res. 47, D666–D677 (2018). [DOI] [PMC free article] [PubMed] [Google Scholar]
- 53.Kumar S, Nei M, Dudley J & Tamura K MEGA: a biologist-centric software for evolutionary analysis of DNA and protein sequences. Brief. Bioinform. 9, 299–306 (2008). [DOI] [PMC free article] [PubMed] [Google Scholar]
- 54.Castresana J Selection of conserved blocks from multiple alignments for their use in phylogenetic analysis. Mol. Biol. Evol. 17, 540–552 (2000). [DOI] [PubMed] [Google Scholar]
- 55.Stamatakis A RAxML version 8: a tool for phylogenetic analysis and post-analysis of large phylogenies. Bioinformatics 30, 1312–1313 (2014). [DOI] [PMC free article] [PubMed] [Google Scholar]
- 56.Lefort V, Longueville J-E & Gascuel O SMS: smart model selection in PhyML. Mol. Biol. Evol. 34, 2422–2424 (2017). [DOI] [PMC free article] [PubMed] [Google Scholar]
- 57.Letunic I & Bork P Interactive Tree Of Life (iTOL) v4: recent updates and new developments. Nucleic Acids Res. 47, W256–W259 (2019). [DOI] [PMC free article] [PubMed] [Google Scholar]
- 58.Steinegger M & Söding J MMseqs2 enables sensitive protein sequence searching for the analysis of massive data sets. Nat. Biotechnol. 35, 1026–1028 (2017). [DOI] [PubMed] [Google Scholar]
- 59.Markiel SP et al. Cytoscape: a software environment for integrated models of biomolecular interaction networks. Genome Res. 13, 2498–2504 (2003). [DOI] [PMC free article] [PubMed] [Google Scholar]
- 60.Kanehisa M & Goto S Kyoto Encyclopedia of Genes and Genomes. Nucleic Acids Res. 28, 27–30 (2000). [DOI] [PMC free article] [PubMed] [Google Scholar]
- 61.Morris JH et al. clusterMaker: a multi-algorithm clustering plugin for Cytoscape. BMC Bioinf. 12, 436 (2011). [DOI] [PMC free article] [PubMed] [Google Scholar]
- 62.Sievers F et al. Fast, scalable generation of high-quality protein multiple sequence alignments using Clustal Omega. Mol. Syst. Biol. 7, 539 (2011). [DOI] [PMC free article] [PubMed] [Google Scholar]
- 63.Finn RD, Clements J & Eddy SR HMMER web server: interactive sequence similarity searching. Nucleic Acids Res. 39, W29–W37 (2011). [DOI] [PMC free article] [PubMed] [Google Scholar]
- 64.Eddy SR Accelerated profile HMM searches. PLoS Comput. Biol. 7, e1002195 (2011). [DOI] [PMC free article] [PubMed] [Google Scholar]
- 65.Bernsel A, Viklund H, Hennerdal A & Elofsson A TOPCONS: consensus prediction of membrane protein topology. Nucleic Acids Res. 37, W465–W468 (2009). [DOI] [PMC free article] [PubMed] [Google Scholar]
- 66.Crooks GE WebLogo: a sequence logo generator. Genome Res. 14, 1188–1190 (2004). [DOI] [PMC free article] [PubMed] [Google Scholar]
- 67.Perez-Riverol Y et al. The PRIDE database and related tools and resources in 2019: improving support for quantification data. Nucleic Acids Res. 47, D442–D450 (2019). [DOI] [PMC free article] [PubMed] [Google Scholar]
Associated Data
This section collects any data citations, data availability statements, or supplementary materials included in this article.
Supplementary Materials
Data Availability Statement
The mass spectrometry proteomics data have been deposited to the ProteomeXchange Consortium via the PRIDE67 partner repository with dataset identifier PXD017470. Ferrosome-associated proteins presented in Fig. 1a were identified from the data in Supplementary Table 11. The sequences, alignment and tree data used to generate Fig. 1g are provided as Supplementary Data 2. KEGG60 and IMG/M ER52 were used to collect data.