

Abstract
The industrial manufacturing landscape is currently shifting toward the incorporation of technologies based on artificial intelligence (AI). This transition includes an evolution toward smart factory infrastructure, with a specific focus on AI-driven strategies in production and quality control. Specifically, AI-empowered computer vision has emerged as a potent tool that offers a departure from extant rule-based systems and provides enhanced operational efficiency at manufacturing sites. As the manufacturing sector embraces this new paradigm, the impetus to integrate AI-integrated manufacturing is evident. Within this framework, one salient application is AI deep learning–facilitated small-object detection, which is poised to have extensive implications for diverse industrial applications. This study describes an optimized iteration of the YOLOv5 model, which is known for its efficacious single-stage object-detection abilities underpinned by PyTorch. Our proposed “improved model” incorporates an additional layer to the model's canonical three-layer architecture, augmenting accuracy and computational expediency. Empirical evaluations using semiconductor X-ray imagery reveal the model's superior performance metrics. Given the intricate specifications of surface-mount technologies, which are characterized by a plethora of micro-scale components, our model makes a seminal contribution to real-time, in-line production assessments. Quantitative analyses show that our improved model attained a mean average precision of 0.622, surpassing YOLOv5's 0.349, and a marked accuracy enhancement of 0.865, which is a significant improvement on YOLOv5's 0.552. These findings bolster the model's robustness and potential applicability, particularly in discerning objects at reel granularities during real-time inferencing.
Keywords: Small object detection, Semiconductor, X-ray, YOLOv5, Artificial intelligence
1. Introduction
The primary objective of this research is to supplant conventional rules-based X-ray image identification with an enhanced version of the YOLOv5 algorithm, which has recently demonstrated superior performance [1]. Optimism that this refined approach will be adopted widely in industrial settings, potentially revolutionizing inventory management and quantitative identification, is widespread. Effective material management can significantly enhance the efficiency of manufacturing processes. In semiconductor and electronic-component manufacturing, meticulous management of diminutive components is of paramount importance. Such components often undergo X-ray inspection, and the precise identification and quantification of parts are imperative. The enhancement of algorithms such as YOLOv5, which is known for its exceptional performance, has become as a pivotal research domain. In contemporary industrial landscapes, a palpable shift from traditional rules-based paradigms to the integration of deep learning and other avant-garde technologies, is underway, with the goal of improving the efficiency and accuracy of material management systems. The evolution of such research and technological innovations suggests a promising future for the manufacturing sector.
Small-object detection is a pivotal research topic within the domains of computer vision and artificial intelligence [2]. Contrary to generic object-detection challenges, detecting minuscule objects presents unique difficulties due to their size and density. Nevertheless, the precise detection of these diminutive entities has profound implications for the military, medical, security, and various industrial sectors. Potential applications include the early detection of minute tumors in medical imaging, the pinpointing of compact vehicles or individuals within satellite imagery, and the detection of petite objects in surveillance camera footage. The initial methodologies for small-object detection predominantly relied on conventionally devised features. Algorithms such as scale-invariant feature transform [3] and speeded-up robust features epitomized this era [4]. However, the advent of deep learning, particularly the monumental success of AlexNet in the 2012 ImageNet challenge, shifted the paradigm. The inception of the convolutional neural network (CNN) proved instrumental to the efficient learning of local features of images. For object detection, region-based methodologies have been foundational, with algorithms such the regions (R)-CNN epitomizing this approach [5]. The R-CNN algorithm delineates prospective regions within an image that are then subjected to classification through convolutional building on an R-CNN framework. Subsequent advancements took the form of fast R-CNN and faster R-CNN [6]. These refined models integrate optimizations that improve both the precision and efficiency of small-object detection, underpinned by relentless research and technological advancements in a plethora of industrial applications. Integration of deep learning and other avant-garde techniques keeps efficacy on a perpetual upward trend. The contributions of this study include:
-
•
An added head was intentionally integrated into YOLOv5 architecture to enhance detection capabilities for finer-scale objects within images. This refinement ensures that the network exhibits heightened sensitivity to minute variations within a scene, addressing the potential for oversight in the conventional YOLOv5 model.
-
•
By prioritizing high-resolution feature maps, we precisely counted semiconductor reels within X-ray imagery, emphasizing the granularity of our approach.
-
•
While our enhancement is tailored to the detection of minute objects, the redesigned network retains its robustness for the detection of medium-to-large objects, ensuring versatility across diverse domains.
-
•
Comprehensive experiments on myriad datasets empirically demonstrated that our augmented YOLOv5 outperforms its predecessor in scenarios dominated by fine-grained objects without compromising on the detection of larger entities.
-
•
Despite the incorporation of the purposefully integrated head, meticulous architectural considerations ensured minimal computational overhead, preserving the real-time processing prowess of YOLOv5.
This paper is organized as follows: Section 2 describes the semiconductor reel package, X-ray images, object detection, and YOLOv5 before explaining the proposed system. Section 3 describes the proposed improvements to YOLOv5 and the composition and role of the process architecture. Section 4 presents the implementation, training using X-ray image data collected from an actual factory, calculation of results, and evaluation of the model in conjunction with a comparison with other models. Finally, Section 5 summarizes the proposed architecture, implementation, and test results, and describes future research directions. Table 1 presents abbreviations and explanations pertaining to AI object detection, annotated with corresponding footnotes.
Table 1.
Image detection methods.
| Abbreviation | Name |
|---|---|
| R-CNN | Region-based Convolutional Neural Network |
| Fast R-CNN [6] | Fast Region-based Convolutional Neural Network |
| Faster R-CNN | Faster Region-based Convolutional Neural Network |
| Mask R-CNN [7] | Mask Region-based Convolutional Neural Network |
| YOLO [1] | You Only Look Once |
| SSD [8] | Single Shot MultiBox Detector |
| RetinaNet [9] | RetinaNet: Focal Loss for Dense Object Detection |
| CenterNet [10] | CenterNet: Keypoint Triplets for Object Detection |
| EfficientDet [11] | EfficientDet: Scalable and Efficient Object Detection |
| Cascade R-CNN [12] | Cascade Region-based Convolutional Neural Network |
| Deformable R-CNN [13] | Deformable Region-based Convolutional Neural Network |
| CornerNet [14] | CornerNet: Detecting Objects as Paired Keypoints |
| FCOS [15] | FCOS: Fully Convolutional One-Stage Object Detection |
| RetinaMask [16] | RetinaMask: Learning to predict masks improves state-of-the-art single-shot detection for free |
| FSAF [17] | Feature Selective Anchor-Free Module for Single-Shot Object Detection |
| RepPoints [18] | RepPoints: Point Set Representation for Object Detection |
| TridentNet [19] | TridentNet: Scale-Aware Trident Networks for Object Detection |
| PANet [20] | PANet: Path Aggregation Network for Instance Segmentation |
| Libra R-CNN [21] | Libra R-CNN: Balanced Learning for Object Detection |
| Grid R-CNN [22] | Grid R-CNN: Toward Real-Time Object Detection with Grid Attention |
| SOLO [23] | SOLO: Segmenting Objects by Locations |
| CondInst [24] | Conditional Convolutions for Instance Segmentation |
2. Related research
2.1. Reel package of semiconductor components
The tape-and-reel method is used widely in the semiconductor industry to package semiconductor chips. The primary advantages of this approach include cost-effectiveness, convenience in transportation, and simplicity in transferring. For delicate semiconductor chips, this ensures safe management and transfer. Semiconductor chips are securely packaged within a tape-and-reel configuration to ensure protection against impacts and other external factors. The packaging consists of a carrier tape for storing the chips, a cover tape for their protection, and a reel for safe transport Fig. 1.
Figure 1.

Semiconductor reel.
Fig. 1 visualizes the semiconductor reel, while Fig. 2 presents a detailed design schematic of the reel tape. The carrier tape is manufactured from multi-layered polystyrene [25], which undergoes an advanced composite extrusion-and-lamination process. The carrier tape serves as a medium for the safe transportation of semiconductor chips, with the cover tape acting as a protective sealant for the upper portion of the tape. Carrier tapes are hermetically sealed with cover tape to physically protect the chips and are packaged and delivered in a roll-based format. The optimized pocket design of the carrier tape minimizes physical damage to electronic components and logistic risks, while meeting the requirements for efficient assembly of printed circuit boards [26]. In this research, object recognition using X-ray images of semiconductor reel packages will be conducted using the YOLOv5 algorithm.
Figure 2.

Reel taping.
2.2. X-ray image
X-ray imaging provides several benefits for identifying components inside semiconductor reels. One of its primary advantages is the high penetration power of X-rays due to their energy levels [26]. This allows for a clear view of the internal structures and parts of semiconductor reels. With its non-destructive nature, X-ray inspection ensures that a reel and its components remain undamaged, preserving their quality and functionality. The precise imaging ability of X-rays allows for the detection of even the smallest structures and defects. This ensures not only an accurate count of components but the ability to spot damage or defects. The process is efficient, making it possible to inspect large quantities of semiconductor reels in a short time. X-rays can also provide insights into different materials based on how they interact with them. Because of these advantages, X-ray imaging is widely used in the semiconductor industry to count components and control quality. The X-ray machine depicted in Fig. 3 is uniquely characterized by its ability to accommodate and count semiconductor components of four reels in a single run. Table 2 lists the specifications of the X-ray machine that give it the ability to capture images at relatively high resolutions.
Figure 3.
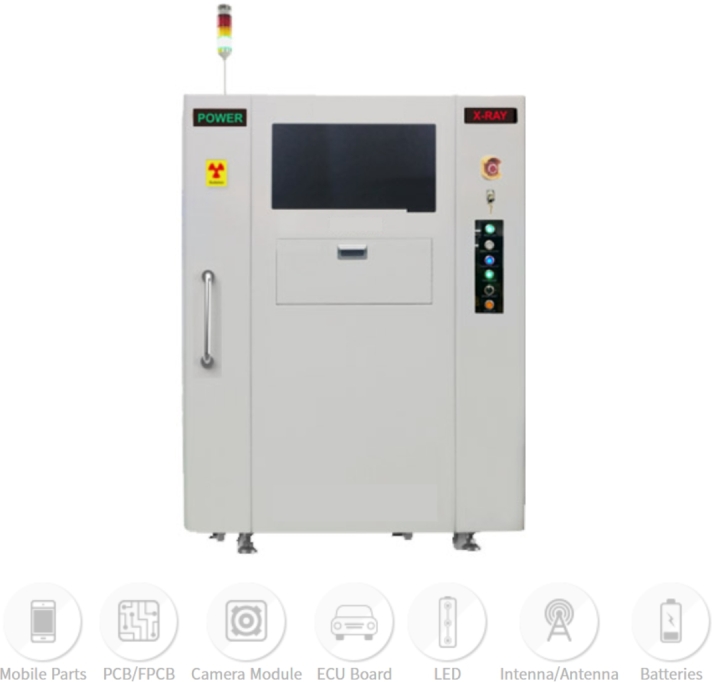
X-ray machine, applications.
Table 2.
X-ray specifications.
| Parameter | Specification |
|---|---|
| X-ray source | 110 kV, 25 W, 5 μm focal spot size |
| Image Detection system | 6.9μm pixels / 49 μm pixels size |
| Inspection Area | Max. 300mm Reel / Min 100mm Reel |
| Utility | Power : 220VAC |
| Dimension, weight | (W) 1,112mm (D) 1,610mm (H) 1,550mm, 1,700kg |
| ETC | Barcode scanner, label printer |
2.3. Object detection
The CNN has revolutionized the domains of image processing and pattern recognition. Traditional image-processing techniques rely predominantly on manual feature extraction, which serves as the foundation for classification tasks. However, CNNs make it possible to directly learn features from raw image data. This paradigm shift has contributed to significantly more accurate and efficient outcomes application domains. The hierarchical structure inherent to CNNs captures the spatial hierarchy of data, enabling the recognition of intricate patterns. As a result, deep learning methodologies, spearheaded by CNNs, drive both mainstream research and commercial applications. Meanwhile, the technical advancement of R-CNN has led to significant transformation of the object-detection arena. While traditional object-detection methodologies were often sluggish and imprecise, R-CNN capitalizes on the feature-extraction ability of CNNs to expeditiously and accurately detect multiple objects within an image. An R-CNN employs a selective search algorithm to extract prospective object-containing regions, which are then classified through a CNN. This strategy not only offers superior object-detection precision but also lays the foundational framework for the development of advanced techniques such as fast R-CNNs and faster R-CNNs. An R-CNN is considered a cornerstone technology that has catalyzed the progression of deep learning–based object detection.
Based on the description provided in Table 3 regarding the network and its significance, the technical significance of faster R-CNN lies in its pioneering innovation in the realm of object detection. While traditional methods such R-CNN and fast R-CNN rely on external algorithms (and selective-search algorithms in particular) to generate proposal regions, this approach is computationally intensive and not well suited for real-time processing. To address this limitation, faster R-CNN introduced the regional proposal network (RPN), a neural network that directly predicts regions with a high likelihood of containing objects. This innovation allows an entire framework to be trained in an end-to-end manner, significantly enhancing object-detection speed and enabling real-time processing. By applying the same CNN feature map to both proposal-region generation and object recognition, a faster R-CNN made substantial computational efficiencies possible. A faster R-CNN is now acknowledged as a cornerstone technology in object-detection research and applications, delivering both superior performance and operational efficiency.
Table 3.
AI technical significance of networks.
| Network | AI Technical Significance |
|---|---|
| CNN | - Spatial Feature Learning: Introduced the ability to automatically learn spatial hierarchies of features. |
| - Parameter Sharing: Reduced the number of parameters and computational cost by using the same filter across the entire image. | |
| R-CNN | - Object Detection Paradigm: Introduced a novel methodology to detect objects within images using CNNs. |
| - : Utilized the Selective Search algorithm for proposing candidate object regions. | |
| Faster R-CNN | - Efficient Region Proposing: Optimized region proposing process with the introduction of RPN (Region Proposal Network) [27]. |
| - End-to-End Training: Allowed for training as a unified network. | |
| R-FCN | - Localization with Less Computation: Processed the entire image and utilized location info at the end. |
| - Position-Sensitive Score Maps: Introduced scoring based on different parts of an object. | |
| SSD | - Real-time Detection: Enabled fast object detection with a single inference for multiple object sizes. |
| - Multi-scale Feature Maps: Utilized feature maps of varying sizes to detect objects of different scales. | |
| AlexNet[28] | - Deep Learning Renaissance: Marked the beginning of the deep learning boom with its success in 2012 ILSVRC. |
| - ReLU (Rectified Linear Unit) & Dropout: Efficient usage of ReLU activation function and dropout technique in large-scale networks. | |
| VGG (Visual Geometry Group)[29] | - Depth Importance: Emphasized the significance of deeper networks with a consistent and simple architecture. |
| - 3x3 Convolutional Layers: Optimized parameters and improved performance with stacked 3x3 convolutions. | |
| ResNET (Residual Network)[30] | - Solving Vanishing Gradient: Addressed the vanishing gradient problem with residual blocks and skip connections. |
| - Ultra-deep Networks: Facilitated the stable training of networks with over 100 layers. | |
Region-based fully convolutional networks (R-FCNs) represents a pivotal advance in the object-detection domain. Unlike traditional detection paradigms that generate candidate regions followed by classification of these regions, an R-FCN employs a score map incorporating positional information, allowing for more efficient and precise localization of objects. This mechanism provides a distinct advantage, particularly in accurately pinpointing object positions within large image datasets. Additionally, an R-FCN eliminates the need for explicit training regarding positional information, simplifying the learning process.
A single-shot detector (SSD) epitomizes the concept of detecting multiple objects through a “single shot.” A hallmark feature of an SSD is its utilization of feature maps of varying sizes for object recognition. This strategy enables the effective detection of objects spanning different scales. Consequently, SSDs strike a balance between speed and accuracy. While R-CNN models traditionally employed an RPN for proposing areas, SSDs eschew this step, augmenting detection speed instead. Such attributes render SSD particularly advantageous in applications requiring real-time object detection. The technical significance of AlexNet is widely acknowledged among experts in deep learning and computer vision. Offering a substantially deeper and larger architecture than its predecessors, AlexNet incontrovertibly demonstrated the potentialities of deep neural networks by its groundbreaking performance in the 2012 ImageNet Large Scale Visual Recognition Challenge, introducing deep learning methodologies. Leveraging parallel computation across dual graphics processing units (GPUs), AlexNet surmounted computational complexities, establishing a new paradigm for future deep architectures. By transitioning from conventional activation functions to a rectified linear unit (ReLU), AlexNet made notable improvements in training velocity, mitigating the gradient-vanishing quandary prevalent in profound networks. Additionally, ReLU incorporated several antecedent strategies to combat overfitting [31]. Through data augmentation, it diversified input representations and enhanced model resilience against overfitting. The concurrent introduction of the dropout technique bolstered network generalization capabilities.
A visual geometry group (VGG) explores the relationship between the depth of a neural network and its performance. VGG networks were meticulously designed to incrementally increase depth, utilizing consistent and small (3 × 3) convolutional filters, which enhance performance as depth increases. Furthermore, a VGG's architectural simplicity and uniformity set a precedent for model reusability and transfer learning. Numerous studies have co-opted a VGG as a pre-trained model, attesting to its efficacy across a plethora of vision tasks. Residual Network (ResNet)'s seminal contribution to the field is its innovative approach to training ultra-deep networks. By introducing the concept of residual learning, ResNet circumvented the vanishing gradient and saturation problems endemic to deep architectures. This ingenious mechanism enabled the effective training of networks composed of hundreds, or even thousands, of layers. The architectural innovations underpinning ResNet have not only pushed the performance boundaries of deep learning models but have also spawned a multitude of subsequent research endeavors, leveraging and extending the ResNet architecture.
2.4. YOLOv5
As illustrated in Fig. 4, YOLOv5 is a pivotal algorithm in contemporary object detection, striking a balance between high accuracy and swift execution. This network is architecturally segmented into three principal components: the backbone [32], neck [33], and head [34]. The backbone forms the convolutional pyramid of the network, dedicated to extracting features from the image across various scales. Popular architectures, such as ResNet or CSPNet, are commonly employed within the backbone to ensure depth and complexity and effectively capture intricate image patterns. The neck serves as an intermediary, refining and fusing features across different scales. Integral to this component are techniques such as cross-stage partial (CSP) [35], spatial pyramid pooling (SPP) [36], and upsampling. With its multiple pooling-window sizes, SPP amplifies the spatial diversity of features, while upsampling elevates the resolution of feature maps, ensuring finer granularity. As the terminal component of the network, the head is responsible for producing the final outputs. It predicts the location of objects (via bounding boxes), classifies them, and determines the probability of their presence. The quintessential technical significance of YOLOv5 lies in its ability to detect objects in real time via a single network pass. While the backbone delves deeply into an image, extracting its multifaceted features, the neck amalgamates and optimizes these features. The HEAD ultimately pinpoints and categorizes the objects. Image-data processing in YOLOv5 is executed through a multi-resolution pyramid structure, which facilitates the effective detection of objects, regardless of size or shape. This architectural and technical approach gives YOLOv5 both speed and precision.
Figure 4.

YOLOv5 model.
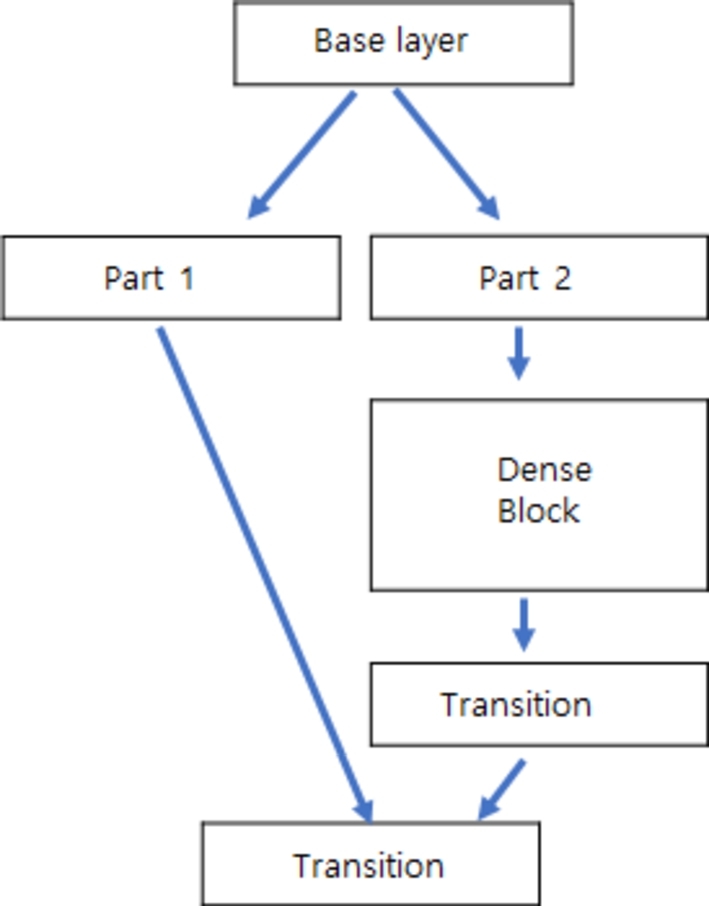
As depicted in Fig. 5, the CSP approach is a significant innovation in deep learning, enhancing gradient propagation and network representational capacity. In the context of traditional convolutional networks, particularly those with deeper architectures, an inherent challenge is posed by gradient vanishing, which can impede the training process. The CSP method addresses this challenge by bifurcating the network's feature maps into two discrete partitions. Each segment is processed autonomously and subsequently integrated. This methodology not only fortifies the gradient flow but mitigates potential information bottlenecks, enriching the overall learning efficacy of the network. Within the architectural landscape of YOLOv5, the pursuit of optimal detection accuracy paired with operational swiftness necessitates the integration of diverse architectural strategies. To optimize gradient propagation traversing intermediate feature maps, the CSP approach ensures enhanced stability during the training phase. Moreover, CSP techniques minimize a network's parameter count in exchange for a nominal decrease in performance. By embedding the CSP structure, YOLOv5 paves the way for more streamlined and efficient model training, ultimately yielding superior object-detection metrics. The CSP approach is a linchpin for amplifying gradient propagation and the representational capabilities of networks. Within the YOLOv5 framework, its strategic integration plays a pivotal role in harmonizing execution speed with detection accuracy.
Figure 5.
CSP DenseNet.
As illustrated in Fig. 6, an SPP layer is a notable advancement in computer vision, addressing the limitation of conventional pooling layers, which typically require a fixed-size input. Traditionally, a CNN requires a fixed-size input to produce a fixed-size feature map, particularly before fully connected layers. This limitation restricts the network's ability to handle images of varied dimensions. SPP addresses this by introducing pooling layers that can generate fixed-size outputs from feature maps of any size by performing pooling operations at multiple scales and then concatenating the results. This allows the network to recognize objects at various scales and enhances the model's robustness and flexibility. Within YOLOv5, the integration of SPP further enhances the network's capability for object detection. Given the nature of object detection, with objects appearing in various sizes and ratios, an SPP module becomes vital. By pooling feature maps at multiple scales, SPP allows YOLOv5 to effectively recognize and localize objects of different sizes within an image. This multi-level feature extraction helps accurately detect both large and small objects. With SPP, YOLOv5 can efficiently process images of different dimensions without transforming them to a fixed size, preserving the original spatial information and reducing potential distortions. SPP captures spatial hierarchies within an image, providing a richer representation. This is beneficial for objects that might be more easily recognized at a particular scale. Within the YOLO framework, the SPP is a critical component that enhances network flexibility and the ability to recognize objects across scales. In YOLOv5, the incorporation of SPP ensures a more robust and accurate object-detection mechanism, making it adept at handling real-world scenarios in which object scales can vary dramatically.
Figure 6.

YOLOv5 SPP architecture.
As depicted in Fig. 6, for an input feature map with dimensions of pixels, the application of SPP using , , and maximum pooling operations yields the following: The entire feature map is pooled to extract the maximum value, resulting in a feature map measuring . The feature map is divided into regions, and the maximum value is extracted from each region. This operation produces a feature map measuring pixels. Similarly, when the feature map is divided into regions and the maximum value is extracted from each region, the resulting feature map measures pixels. Combining these three pooled outputs produces the final concatenated feature map. Employing max pooling operations of varying sizes facilitates the extraction of images features across multiple scales. This ensures robust object detection irrespective of object size or position. By concatenating feature maps of different resolutions, both high- and low-resolution features are effectively captured, preserving a rich spatial context. Each pooling operation is conducted without additional parameters, allowing for efficient feature extraction across different image scales without incurring extra computational costs. Extracting features at multiple scales improves the accuracy and robustness of object detection. The strategic use of max pooling operations of varying sizes is pivotal in effectively extracting image features across different scales, ultimately enhancing the performance of object detection.
The convolutional architecture of YOLOv5 plays a pivotal role in detecting and classifying objects within images. This architecture is meticulously crafted with a series of layers and components, each contributing significantly to the holistic performance and accuracy of the network. The YOLOv5 model incorporates multiple convolutional layers, each characterized by varying filter sizes and counts. These layers are adept at extracting features from images across different scales and orientations. While the initial layers focus on low-level features, such as edges and color gradients, the deeper layers can extract high-level features, encapsulating parts of or entire objects. The BottleNeck structure within YOLOv5 comprises a succession of convolutions interspersed with activation functions and normalization mechanisms. This segment is designed to streamline network complexity, augment depth, and curb overfitting while preserving essential information. YOLOv5 employs the sigmoid linear unit (SiLU) [37] as its activation function. Demonstrating superior performance over ReLU [38], SiLU enhances the overall efficacy of the network. In essence, the convolutional architecture endows YOLOv5 with a potent feature-extraction capability. These extracted features capture critical information about objects, including their position, size, shape, and class. In Fig. 7, the term “frames per second” (FPS) refers to the frequency at which consecutive images, or frames, appear on a display. It is a critical metric for evaluating the performance of real-time systems in real-time object detection. A higher FPS value results in smoother motion and can improve accuracy in object detection and tracking. The fact that YOLOv5 has the highest FPS rate among the YOLO series implies that it can deliver the best performance in real-time systems. The YOLOv5 model, specifically v5n6, demonstrated a significantly higher FPS of 31.361, compared with 15.536 and 20.006 FPS exhibited by the v6 and v7 models, respectively.
Figure 7.

Performance of YOLOv5.
In YOLOv5 architecture, the head component is responsible for producing the final output. It consolidates information pertaining to bounding boxes predicted in each grid cell, the associated class probabilities, and the confidence scores that indicate the likelihood of the presence of an object. Structurally, the head is composed of multiple convolutional layers, activation functions, and, where necessary, normalization mechanisms. These layers predict the coordinates and dimensions of bounding boxes based on multiple anchor boxes for each grid cell. The design accounts for the possibility of objects of varying shapes and sizes residing within the same grid cell. Functionally, the primary role of the head is to determine the precise location and dimensions of bounding boxes based on extracted feature maps and to classify the object within each bounding box. For each bounding box, the head also provides a confidence score, representing the probability that the box contains a valid object. This score helps filter out predictions with low confidence, enhancing the accuracy of object detection. The head in the YOLOv5 architecture plays a pivotal role in precise object detection, facilitating accurate predictions of object locations, dimensions, and classifications within an image.
Table 4 summarizes the comparison of the mean average precision (mAP) [39], speed, parameter, and FLOP [40] by model in YOLOv5. In particular, the YOLOv5 parameter is significantly reduced, which is a quantitative result of the CSPNet [41] backbone. The existing YOLOV5 model operated with three bounding boxes, but in the improved model, another bounding box was added for small-device detection, and four bounding boxes were used to recognize small objects. The addition of one bounding box to the improved model improved its accuracy, allowing it to recognize smaller objects, creating an effective method of recognizing semiconductors in a reel package.
Table 4.
The performance comparison of different models of YOLOv5.
| Model | pixels | mAP(0.5) | mAP(0.5:0.95) | Params(M) | FLOPs(G) |
|---|---|---|---|---|---|
| YOLOv5s | 640x640 | 55.4 | 36.7 | 7.3 | 17.0 |
| YOLOv5m | 640x640 | 63.3 | 44.5 | 21.4 | 51.3 |
| YOLOv5l | 640x640 | 66.9 | 48.2 | 47.0 | 115.4 |
| YOLOv5x | 640x640 | 66.8 | 50.4 | 87.7 | 218.8 |
3. YOLOv5 based object detection in reel package X-ray images
In this study, we adapted and refined YOLO architecture, building specifically on the YOLOv5 framework, to enhance object-detection capabilities in X-ray images. An additional head and supplementary layers were integrated into the existing structure to address the limitations of conventional CNN-based object detection, particularly in detecting minuscule objects within X-ray imagery. By optimizing and adjusting the parameters and structure of anchor boxes, we strove to improve detection performance of objects of various sizes and shapes, achieving a pronounced enhancement in the detection of smaller entities within X-ray images.
3.1. Improved YOLOv5 network
The YOLOv5s architecture Fig. 8, is segmented into backbone, neck, and head modules. The backbone, which is pivotal for feature extraction, integrates convolutional layers, CSP layers, and an SPP layer. The neck module refines and augments these extracted features. To surpass the baseline model, enhancements have been introduced to improve small-object detection. A salient feature of YOLOv5 is its incorporation of CSP DenseNet, ensuring robust accuracy while optimizing computational efficiency and memory utilization. The neck module in this study has six bottleneck CSP layers, six convolution layers with 1 × 1 and 3 × 3 kernel sizes, and double the size of the input values.
Figure 8.

Improved YOLOv5 model.
The new architecture consists of three upsampling layers and six layers for residual concatenation. In the output module, the bounding box for the X-ray semiconductor image is displayed using the data obtained from the last four bottleneck CSP layers of the neck module. X-ray reel image detection of large and small objects differs depending on the size and shape of the semiconductor package. While the detection performance of a semiconductor chip with a large image is suitable to a certain extent, the detection rate for a small image such as a small-signal chip resistor or capacitor has relatively low accuracy. The proposed model increases the accuracy probability of object detection by adding layers.
In the enhanced model Table 5, the backbone network is tasked with extracting spatial details and pinpointing object locations, while the neck segment primarily identifies semantic content. In line with the inherent attributes of YOLOv5, the backbone has been augmented with Network No. 9 CBL and Network No.1 0 SPP. The neck incorporated Network No. 11 CBL, followed by an upsampled sequence of Network No. 12 CBL, No. 13 upsample, No.14 concat, No. 30 CBL, No. 31 concat, and No. 32 CSP. The rationale for the introduction of an additional anchor to increase the count from 3 to 4 stems from the convolution-induced creation of a feature map. This inclusion ensures maximal semantic data capture from the final upsampling phase. The augmented anchor data in the backbone, when connected to a congruent scale neck, improves the network's capability to discern finer traits and spatial nuances of diminutive objects, thereby justifying the transition from three to four anchors for more meaningful information extraction. Within the backbone, the model's depth multiplier dictates that as the value of the depth escalates, the bottleneck CSP modules are used iteratively. The width multiplier pertains to the layer's channel multiplier. An increment in the width multiple value augments the number of Conv filters within the layer. To leverage the entire network, both depth and width were strategically set to 1. During the training phase, the epoch was predefined to 3,000 iterations. If the mAP stagnated and retained an identical value across more than 100 iterations, the training process was automatically terminated. The weight coefficients, which are crucial for model refinement, were derived by training with X-ray images within the enhanced model. The image resolution was 640, with a batch size parameterized to 2.
Table 5.
Improved model structure.
| Layer | Input | Output |
|---|---|---|
| Focus | 640x640x3 | 320x320x64 |
| CBL | 320x320x64 | 160x160x128 |
| CSP | 160x160x128 | 160x160x128 |
| CBL | 160x160x128 | 80x80x256 |
| CSP | 80x80x256 | 80x80x256 |
| CBL | 80x80x256 | 40x40x512 |
| CSP | 40x40x512 | 40x40x512 |
| CBL | 40x40x512 | 20x20x1024 |
| CSP | 20x20x1024 | 20x20x1024 |
| CBL | 20x20x1024 | 10x10x2048 |
| SPP | 10x10x2048 | 10x10x2048 |
| CSP | 10x10x2048 | 10x10x2048 |
| CBL | 10x10x2048 | 10x10x1024 |
| Upsample | 10x10x1024 | 20x20x1024 |
| Concat | 20x20x1024, 20x20x1024 | 20x20x2048 |
| CSP | 20x20x2048 | 20x20x1024 |
| CBL | 20x20x1024 | 20x20x512 |
| Upsample | 20x20x512 | 40x40x512 |
| Concat | 40x40x512, 40x40x512 | 40x40x1024 |
| CSP | 40x40x1024 | 40x40x512 |
| CBL | 40x40x512 | 40x40x256 |
| Upsample | 40x40x256 | 80x80x256 |
| Concat | 80x80x256, 80x80x256 | 80x80x512 |
| CSP | 80x80x512 | 80x80x256 |
| CBL | 80x80x256 | 40x40x256 |
| Concat | 40x40x256, 40x40x256 | 40x40x512 |
| CSP | 40x40x512 | 40x40x512 |
| CBL | 40x40x512 | 20x20x512 |
| Concat | 20x20x512, 20x20x512 | 20x20x1024 |
| CSP | 20x20x1024 | 20x20x1024 |
| CBL | 20x20x1024 | 10x10x1024 |
| Concat | 10x10x1024, 10x10x1024 | 10x10x2048 |
| CSP | 10x10x2048 | 10x10x2048 |
| Detect | 80x80x256, 40x40x512, 20x20x1024, 10x10x2048 | |
The Leaky ReLU activation [42] function was adopted to introduce stability by selectively accommodating negative values. In the detect.py module, the inherent default constraint, which is typically limited to 1,000 inferences per image, was recalibrated to 3,000 to ensure comprehensive object recognition within the image.
The anchor configurations for each network were as follows: Network No. 23 adopted the configuration , Network No. 26 was set to , Network No. 29 aligned with , and Network No. 32 was characterized by . In alignment with these configurations, the image dimensions for the networks were tabulated as: Network No. 23 , Network No. 26 , and Network No. 29 , culminating in Network No. 32, which peaked at as seen in Table 5.
From an architectural refinement perspective, traditional elements such as CBL and SPP retain their originality. In contrast, the backbone witnesses the integration of CSP, and the neck is augmented with upsampled and concat functionalities. Additionally, an auxiliary anchor was infused into the head. The incorporation of these enhancements, complemented by the activation of an ancillary network layer, culminated in a significant uptick in the accuracy of small-device detection. This progression was mirrored in an enhancement in mAP metrics. Within the head module, regression learning was optimized through the use of tailored, diminutive anchor boxes optimized for discerning minuscule entities such as semiconductors, resistors, and capacitors. This strategic move bolstered the proficiency of detecting minuscule objects. The architectural reconfiguration of YOLOv5 is depicted in Fig. 8. The improved model possesses several key advantages and is capable of enhanced feature extraction. Each layer of the neural network is responsible for extracting features from the input, deepening the network results in the extraction of increasingly abstract and intricate features. Incorporating additional layers allows the network to capture more sophisticated features of objects, potentially leading to superior object detection performance, particularly for smaller objects. The model is specialized for object detection. Each head in the network is designated to detect objects of varying sizes: one for small objects, another for medium-sized objects, and another for large objects. Incorporating additional heads helps a network specialize in the detection of objects of specific sizes, potentially leading to enhanced performance, particularly in the detection of smaller objects that are more challenging to detect. The model has augmented capacity. Incorporating additional layers and heads amplifies the model's capacity further, enabling it to learn more parameters from the training data, potentially culminating in a more accurate model. This model offers an optimized precision-recall trade-off. Incorporating additional layers and heads can optimize the trade-off between precision and recall, resulting in a higher mAP (0.5) score, a comprehensive indicator of model performance.
4. Experiment and results
4.1. Experimental environments
We employed an enhanced YOLO architecture for object-feature detection. The computational environment for our experiments encompassed an i9 11900k, central processing unit (CPU), GPU models K80, T4, and P100, and a memory capacity of 52GB. For the training phase, we utilized curated datasets comprising 3,400 preprocessed images. The training iterations were conducted up to 30,000 epochs, and the model's weights corresponded to the minimal loss value were selected for subsequent analyses.
4.2. Datasets
When using YOLOv5 for object detection, data completeness and balance are generally ensured during the labeling phase, eliminating the issue of incomplete or imbalanced data. However, when dealing with other types of datasets, imbalances may occur, necessitating intervention during the preprocessing phase. To tackle these challenges, various methods can be employed. To address fuzziness in the data, fuzzy clustering techniques can better manage ambiguous or imprecise labels. For incomplete data, the k-nearest neighbors (k-NN) approach can serve as an effective method for imputation, filling in missing values or correcting erroneous labels. As for imbalanced data, the synthetic minority over-sampling technique (SMOTE) can balance class distribution prior to model training. Proactively addressing these issues in the preprocessing stage lays a stronger foundation for subsequent object-detection tasks using YOLOv5 or any other machine learning algorithm. In our study, the issue of incomplete or imbalanced data did not arise, as the preprocessing stage involved meticulous labeling of semiconductor X-ray images for object recognition. However, handling fuzzy, incomplete, and imbalanced data can be pivotal when dealing with structured data in other domains. Below are the strategies adopted in our methodology to mitigate these challenges. Data preprocessing plays a crucial role in the methodology of our research. First, fuzzy data act as confounders that impede clear classification or prediction. To resolve this, we employed fuzzy clustering techniques and membership functions. This approach facilitated interpretation of the results and enhanced their reliability. Second, incomplete data can increase model bias and undermine predictive performance. To counteract this, we substituted missing values with means or medians. For more intricate scenarios, we leveraged k-NN algorithm-based, multiple-imputation techniques to estimate missing values with higher accuracy. We managed to reduce model bias and improve predictive performance. Last, imbalanced data create problems by marginalizing the minority class. To address this issue, we used the SMOTE technique. This refinement enabled our model to classify the minority class more accurately, boosting the overall precision and recall of the model. By judiciously addressing these key issues in the data-preprocessing stage, we improved performance and reliability. The emphasis on the preprocessing phase was instrumental in optimizing the efficacy of our model. In this study, the dimensions of various semiconductor components were systematically categorized Table 6. Chips were classified into 10 categories based on size and type. For example, chips 1, 3, and 4 encompass small-sized components such as capacitors, diodes, and resistors, with dimensions ranging from 0603 to 2012. chips 2, 5, 6, and 7 include medium-sized components such as capacitors, resistors, and transistors, with dimensions ranging from 1816 to 6430. Last, chips 8, 9, and 10 represent large components, classified as medium and large sizes, including integrated circuits (ICs) and harnesses. Each type of components, including capacitors, diodes, resistors, transistors, ICs, and harnesses, possesses unique characteristics. These diverse characteristics can influence the performance of object recognition models. A diode may have a different shape and texture compared with those of a capacitor. The performance of the model can vary based on the size and type of the component. The model may have higher accuracy for larger components, such as ICs and harnesses, compared with smaller components, such as capacitors and resistors. Small components require a model to learn more features during the training process, potentially reducing the learning efficiency. Large components require a model to learn fewer features, potentially resulting in higher learning efficiency. Large components may require more computational resources, potentially leading to a decrease in performance in real-time systems. Small components may require fewer computational resources, potentially leading to enhanced performance. These reasons motivated the classification for object recognition.
Table 6.
Chip classification.
| Class | Packaging Size | Semiconductor |
|---|---|---|
| Chip1 | 0603,1005,1608,2010 | Capacitor |
| Chip2 | 3216,3225,4532,6430 | Capacitor |
| Chip3 | 1065,1511,2514,3430 | Diode |
| Chip4 | 0603,1005,1608,2012 | Resistor |
| Chip5 | 3216,3225 | Resistor |
| Chip6 | 1816,2012 | Transistor |
| Chip7 | 2812,2614 | Transistor |
| Chip8 | Medium Size | IC |
| Chip9 | Large Size | IC |
| Chip10 | Large Size | Harness |
An image of the semiconductor reel taken with an X-ray machine is shown in Fig. 9. The components were divided into three main classes based on the classification:, small-sized components (chips 1, 3, 4), including capacitors, diodes, and resistors, with dimensions ranging from 0603 to 2012; medium-sized components (chips 2, 5, 6, 7), which include capacitors, resistors, and transistors and large-sized components with dimensions ranging from 1816 to 6430; and large components (chips 8, 9, and 10), which represent such as ICs and harnesses Fig. 10. The components were then labeled. For example, a component in an image that is a capacitor with dimensions of 0603 would be labeled as a small-sized component. The labeled data, a collection of images with annotated components, were then used to train and validate the object-detection model. This dataset typically consists of thousands of images with labeled components, which helps the model learn the features of each component and accurately classify them into one of the three classes during the training process. The labeled data are typically visualized using a graphical user interface that displays the images and labels assigned to each component. This interface can be used to manually correct or adjust the labels if necessary. This is an important step in the data-preparation process, as accurate labeling is crucial for the success of the model.
Figure 9.

X-ray images of semiconductor reel.
Figure 10.

X-ray images and labelled data.
As depicted in Fig. 11, contiguous pixel values in the binarized image were aggregated and numerically labeled to distinguish individual objects. The dark regions within the image were discerned and uniquely annotated. Rigorous labeling, in accordance with the specific segment, yielded commendable outcomes across the entirety of the component. To optimize the efficacy of the X-ray counter, meticulous verification and rectification were undertaken to allow for precise labeling. Recognition and subsequent processing of the image region are contingent on accurate annotation, and meaningful insights cannot be derived from image input without them. As shown in Table 6, the dimensions of various semiconductor components have been systematically categorized and subsequently segmented into discrete classes, ranging from chip 1 to chip 10. These classes were further stratified into three overarching categories to facilitate detection predicated on chip dimensions. Capacitors and resistors, attributable to their diminutive scale, fell under the “small” classification. Transistors and diodes, with their intermediate dimensions, were categorized under the “middle” classification, while the more substantial components like ICs and harnesses were allocated to the “large” classification.
Figure 11.

Labelled datasets for trainning.
Fig. 11 depicts images that have been labeled and divided into training data, validation data, and test data. X-ray images were captured at a resolution of pixels, and datasets were curated corresponding to each dimension. An in-depth analysis was undertaken to determine the nature or distinct attributes of each dataset, facilitating the construction of a component library. The components explored within this research encompassed capacitors [43], diodes [44], resistors [45], transistors [46], among others. These components were also granulated based on their respective dimensions within each type. The X-ray representations of each component type in Fig. 11 emphasize the variability in form or dimension contingent upon component type. Attributes such as morphology, scale, and hue serve as pivotal discriminators when deploying deep learning algorithms. Consequently, characteristics such the count of leads for each type or the geometric dimensions — width × length × height — are manifested in a unidimensional framework, with component hues delineated in a grayscale. The region of interest (ROI) is delineated based on a rigorous image attribute analysis [47]. Given the inherent nature of X-ray imagery, it is monochromatic, devoid of any specific character or color representation of the component. Recognition is achieved by characterizing the component's geometrical dimensions.
4.3. Performance metrics
For the empirical assessment of the proposed model, results were validated employing the confusion matrix, a quintessential evaluation metric in binary classification [48].
The confusion matrix is characterized by the following four fundamental metrics in Table 7.
-
•
True Positive (TP): Represents instances where the actual class was positive, and the model correctly predicted it as positive.
-
•
True Negative (TN): Denotes instances where the actual class was negative, and the model accurately predicted it as negative.
-
•
False Positive (FP): Refers to instances where the actual class was negative, but the model mistakenly predicted it as positive. Also known as “Type I Error”.
-
•
False Negative (FN): Represents cases where the actual class was positive, but the model erroneously predicted it as negative. Also known as “Type II Error”.
| (1) |
| (2) |
Table 7.
Confusion matrix.
| Predicted Positive | Predicted Negative | |
|---|---|---|
| Actual Positive | TP (True Positive) | FN (False Negative) |
| Actual Negative | FP (False Positive) | TN (True Negative) |
Eq. (1) defines precision, while Eq. (2) defines recall.
| (3) |
| (4) |
Eq. (3) defines average precision (AP), and Eq. (4) defines mean average precision (mAP).
4.4. Results
The training set was configured listed in Table 8. A proportion of 83% was allocated for the training data, and experiments were conducted subsequent to comprehensive preprocessing. After extensive experimentation assessing the performance of the enhanced model, the mAP showed an overall performance boost to 0.622, with mAP (0.5:0.95) reaching 0.39, and the accuracy rate improving to 0.865. This signifies a substantial enhancement of over 0.3 when juxtaposed with the predecessor model, YOLOv5s. For diminutive objects, there was a noticeable improvement in performance as the dimensions of the input image escalated. In essence, when the input resolution was adjusted to 640 pixels, the image's resolution effectively acted as a potent determinant in the model's interpretation [49]. Based on the optimal performance results derived from the mAP metric, training parameters were established. These conditions were fine-tuned to adjust for the optimal parameter values. Parameters such as depth multiple and width multiple are provided within the “YOLOv5.yaml” file, which allows for adjusting the overall training model via a specific formula. Through this yaml configuration, a customized network structure was designed, and the optimal mAP was achieved post-training. A salient advantage of YOLOv5 is its ability to reduce computational overhead through convolution, subsequently enhancing the execution speed. In the backbone structure, Bottleneck CSP inherently initiated four convolutional layers [50]. As convolution progressed, a combination of convolution and batch normalization was performed [51].
Table 8.
Trainning DataSets.
| Item | Description |
|---|---|
| Image Total | 4,256 |
| Training Set | 3.5K Images (83%) |
| Validation Set | 468 Images (11%) |
| Testing Set | 272 Images (8%) |
| Preprocessing | Auto-Orinet: Applied |
| Resize: Stretch to 640x640 | |
| Tile: 2 rows x 2 columns | |
| Augmentations | Outputs per training example: 3 |
| 90°Rotate: Clockwise, Counter-Clockwise | |
As a neural network deepens and widens, its efficacy is amplified. However, expanding such an architecture increases the computational demands on the network. During the training phase, tasks such as object detection can become challenging due to the volume of the data involved. The primary objective of CSPNet is to mitigate computational demands while generating an increasing number of gradient combinations. This can be achieved by bifurcating the foundational layer into two sections and then merging them in the final cross-stage layer. Utilizing CSPNet to bolster learning capabilities results in weight reduction while preserving accuracy. Architectures such as ResNet, ResNeXt, and DenseNet have reported a reduction in operations by 10∼20% using this methodology. By circumventing computational bottlenecks, the computational workload of each layer can be evenly distributed. This facilitates a more efficient computational utilization of each layer without invoking computational bottlenecks. With the deployment of CSPNet, memory consumption is efficaciously curtailed, and cross-channel pooling serves to compress feature pyramid operations.
The proposed model is a tailored for superior performance within the YOLOv5 framework. The YOLOv5 architecture encompasses four distinct models: YOLOv5s, YOLOv5m, YOLOv5l, and YOLOv5x. In this study, a dataset containing more than 3600 images, each with dimensions of 640 × 640 pixels, was employed. With a batch size of 2, each model underwent training and subsequent testing for 3000 iterations. The enhanced YOLOv5 model achieved a precision of 0.865 and a recall of 0.475. For comparison, the YOLOv5s model exhibited a precision of 0.552 and a recall of 0.323. The results highlighted in Table 9 emphasize the augmented accuracy of the refined model over the YOLOv5s model. This research focused on semiconductor chip detection, utilizing X-ray imagery of a semiconductor reel in conjunction with the enhanced model, an advanced version of YOLOv5s. Additionally, a novel head was integrated into the CSP and CBL structures. The trained refined model was adept at displaying bounding boxes for components identified as semiconductors or chips within the X-ray imagery. Performance metrics, including accuracy, recall rate, and mAP 0.5, were assessed, and for a comprehensive performance comparison, mAP 0.5:0.9 was also evaluated. The pinnacle performance metrics of the refined model were an mAP of 0.5 and a precision of 0.865, figures that can be considered exceptional when juxtaposed with those of other models. During the modeling process, the backbone was augmented with CBL and SPP modules, and 2048 channels were concatenated in network No. 32 to bolster data contextuality. Moreover, image concatenation in network No. 32 facilitated the detection of smaller images. Consequentially, the model exhibited a mAP that surpassed the baseline YOLOv5s by 0.273, demonstrating its proficiency in achieving remarkable performance.
Table 9.
Accuracy of improved model.
| Model | Precision | Recall | mAP(0.5) | mAP(0.5:0.95) |
|---|---|---|---|---|
| YOLOv5s | 0.552 | 0.323 | 0.349 | 0.112 |
| YOLOv5m | 0.685 | 0.342 | 0.367 | 0.125 |
| YOLOv5l | 0.669 | 0.489 | 0.387 | 0.164 |
| YOLOv5x | 0.673 | 0.504 | 0.395 | 0.167 |
| Improved Model | 0.865 | 0.475 | 0.622 | 0.309 |
The improvement in the ability of the enhanced model to detect small objects can be attributed to the addition of one layer and one head in the network, making it more robust Table 10. Specifically, the additional layer helped capture more complex features of the object, while the additional head helped focus the network's attention on the most relevant parts of the image. This was especially useful in detecting small objects that can easily be overlooked. From a theoretical standpoint, adding layers to a neural network helps capture higher levels of abstract features from the input image. Each layer of the neural network is responsible for extracting features from the input, and as the network deepens, the extracted features become more abstract and complex. Adding additional layers helps a network capture more intricate features of objects, which can lead to enhanced object-detection performance, particularly for smaller objects. In YOLOv5, adding additional heads means that the network has more parameters to learn from the training data, potentially resulting in a more accurate model. Specifically, each head in the network is responsible for detecting objects of different sizes. For example, one head is responsible for detecting small objects, another for medium-sized objects, and another for large objects. Adding additional heads allows the network to specialize in detecting objects of specific sizes, which can lead to improved performance, particularly in detecting smaller objects that are harder to detect. The ability to detect local features of objects down to the smallest parts is characteristic of the network. The addition of heads and network layers is a deep learning approach that can enhance overall detection capability.
-
•
Precision: The improved model achieved differences in precision of 0.313, 0.3, and 0.304 compared with the YOLOv5s model for chips 1, 3, and 4; chips 2, 5, 6, and 7; and chips 9 and 10, respectively. This indicates a significantly higher ratio of relevant object detections in all chip categories. The high precision indicates that the model has a low rate of false-positive detections, which is important in applications in which the cost of false positives is high.
-
•
Recall: The differences in recall between the improved model and the YOLOv5s model were 0.181 for chips 1, 3, and 4; 0.155 for chips 2, 5, 6, 7; and 0.157 for chips 9 and 10. This indicates that the improved model more effectively identified most of the relevant objects in the images across all categories. The high recall means that the model had a low rate of false negatives, which is important in applications in which the cost of missing actual positives is high.
-
•
mAP (0.5): The differences in mAP (0.5) between the improved model and the YOLOv5s model were 0.066 for chips 1, 3, and 4; 0.139 for chips 2, 5, 6, and 7; and 0.262 for chips 9 and 10. This means that the overall object detection performance at a 0.5 IoU threshold was superior for the improved model across all chip categories. A higher mAP (0.5) indicates that the model was better able to make trade-offs between precision and recall, which is a comprehensive measure of model performance.
Table 10.
Performance comparison of YOLOv5s vs. improved model.
| Model | Precision | Recall | mAP (0.5) | mAP (0.5:0.95) |
|---|---|---|---|---|
| YOLOv5s | 0.552 | 0.323 | 0.349 | 0.112 |
| Chip1,3,4 | 0.541 | 0.315 | 0.342 | 0.121 |
| Chip2,5,6,7 | 0.569 | 0.358 | 0.348 | 0.134 |
| Chip 9,10 | 0.572 | 0.368 | 0.375 | 0.147 |
| Improved Model | 0.865 | 0.475 | 0.622 | 0.309 |
| Chip1,3,4 | 0.847 | 0.504 | 0.415 | 0.167 |
| Chip2,5,6,7 | 0.869 | 0.513 | 0.487 | 0.174 |
| Chip9,10 | 0.876 | 0.525 | 0.637 | 0.315 |
The differences in precision, recall, and mAP (0.5) between the improved model and the YOLOv5s model indicate that the improved model achieved superior ability in detecting relevant objects with fewer false positives and negatives across all chip categories. The most significant improvement was observed in chips 9 and 10, suggesting that the improved model is particularly adept at detecting larger, more-distinct features. Upon dissecting individual groups, both precision and mAP metrics were meticulously examined. Precision and mAP were elevated in chips 9 and 10, which are ostensibly larger that chips 1, 3, and 4 in Table 10. This highlights a characteristic in which larger semiconductor chip classes exhibit better object recognition compared with smaller classes. In the realm of minuscule-device detection, pronounced image degradation for components spanning three pixels or fewer was evident. From an accuracy perspective, the model achieved an accuracy rate of 87%, underscoring the improved model's aptitude for detecting diminutive objects.
In Fig. 12, class 1, 3, and 4 correspond to capacitors, diodes, and resistors, respectively, which possess images of exceedingly small sizes, specifically those with dimensions of 0603 and 1005 pixels. Consequently, they exhibit limitations in image recognition. It is believed that label data with dimensions of three pixels or fewer induce degradation in image quality. Therefore, when comparing the mAP (0.5), it is evident that the performance decreased by 0.22, from 0.637 for the largest models (chips 9 and 10), to 0.415 for the smaller components, indicating a significant reduction in performance.
Figure 12.

Chip counting (class 1, 3, 4).
Fig. 13 includes classes 2, 4, 6, 7, and 8, corresponding to capacitors, resistors, transistors, and ICs, which have intermediate-sized images with dimensions of 3216 and 2814 pixels. Consequently, they achieved better performance compared with smaller images. Generally, they possess a sufficient number of effective pixels per label, enabling the maintenance of a certain degree of image quality. When comparing the mAPs (0.5), although there was a performance decrease of 0.15, from 0.637 for the largest models (chips 9 and 10), to 0.487 for the intermediate-sized components, it was still 0.07 higher than the mAP values (0.5) for the smaller classes (chips 1, 3, and 4).
Figure 13.

Chip counting (class 2, 5, 6, 7, 8).
Fig. 14 includes classes 9 and 10, corresponding to ICs and semiconductor harnesses, which possess the largest images among semiconductors, with dimensions exceeding 2812 pixels. As a result, they exhibit the highest performance among all classifications. Generally, they possess a sufficient number of feature maps per label necessary for object recognition, suggesting that the network improvement effects were reflected, and the addition of the head enabled the identification of targets with more accessible bounding boxes. Having a sufficient number of effective pixels enabled the maintenance of object recognition capabilities. Therefore, when comparing the mAP (0.5), the value of 0.637 for the largest models (chips 9 and 10), indicates a superior accuracy of 0.262 compared with the performance of the pre-improved YOLOv5s model (0.375).
Figure 14.

Chip counting (class 9, 10).
In this study, the enhanced model of the YOLOv5s framework demonstrated that, with an increment in image size from 512 to 640 and subsequently to 3072 pixels, there was a notable enhancement in the precision of chip detection. Outstanding chip-counting results, as illustrated in Fig. 12, Fig. 13, and Fig. 14, were achieved. However, due to the inherent characteristics of YOLO, if the increment in training iterations reached its optimum and no changes were observed over 100 epochs, the training process was halted. The dimension of the input image during the training phase for accuracy detection is pivotal and should be regarded as a crucial determinant before commencing the training. Through this investigation, we determined that, by employing optimal hyperparameters during the training of the improved model, both accuracy and training efficiency can be augmented. An in-depth analysis of learning variables, such as the quantity of training data, learning rate, and the architecture and quantity of layers in each module, in conjunction with the hyperparameters used in this study, may reveal avenues for further refinement of models designed for feature identification within semiconductor reel images. Moreover, a comparative analysis of object-detection time with existing deep learning–based CNN algorithms may provide empirical evidence for the efficacy of the enhanced model within the YOLOv5s framework. The YOLO model, as delineated in this research, underwent rigorous training and exploration on Google's Colab Pro+ platform. Deployment of this model was realized on a web-based interface. When images are uploaded onto this web platform, the system can enumerate the number of images. To operationalize this model within the Google Colab Pro+ environment requires the installation of YOLOv5, the loading of labeled data processing, modifications to the network via a yaml file, data training, optimization through hyperparameter tuning, and subsequent detection processes. Although feasible on a personal computer, the requirement for uninterrupted training sessions mandates the utilization of high-performance servers such as Google Colab Pro+.
5. Discussion
YOLOvX and similar architectures are improving rapidly, leading to a surge of interest from academia and industry for innovative research trajectories and algorithmic improvements. The research challenges of object detection, characterized by originality and adaptability, will continue in the future. The relentless drive of technological and academic pursuits continues in industrial deployment and academic discourse. Here, we successfully leveraged the rapid object-detection capabilities of the YOLO algorithm to meet our research objectives. This capability is particularly useful in time-sensitive applications and scenarios that require real-time processing. However, the swiftness of YOLO's processing comes at the cost of ignoring finer semantic details of the objects and their surrounding context. This is a limitation when it comes to meticulously analyzing complex scenarios or interactions among various objects. Furthermore, we encountered significant challenges in labeling the training data. The time and labor required to label all semiconductor reel images proved prohibitive due to both temporal and human resource constraints. Consequently, while we took full advantage of YOLO's rapid object-detection capabilities, we are also acutely aware of its limitations and constraints. In future research, we will explore methodologies that allow for more precise analysis of semantic data. These limitations not only serve as an acknowledgment of the areas in which the current study could be improved but also provide direction for future research endeavors.
6. Conclusion
We aimed to refine the YOLOv5 model for the categorization of reel components, enabling the classification of parts of varying dimensions into distinct types. To this end, we augmented the existing model by introducing an additional backbone, neck, and head layer. This enhancement allowed for a greater than 25% extension of the detection-processing value for small-device images across the backbone, neck, and head. Additionally, we proposed a network capable of recognizing even smaller components by incorporating nine bounding boxes, facilitating the processing of smaller data images on each reel. Our experiments employed a dataset comprising 3,524 training images and 468 validation images. While conventional models comprise 27 anchor boxes, we expanded this number to 36, taking into consideration the diversity in component sizes and the unique characteristics of diodes and transistors. The dimensions of the anchor boxes were also redefined based on the actual sizes of the components. Through our experiments, we observed enhanced accuracy for larger components and more precise ROI identification when modifying the anchor boxes. Although the modification of the anchor boxes led to a relatively higher number of false detections for smaller sizes, adjustments and enhancements to the network rectified this, with performance corroborated through experimental results. The improved YOLOv5 model, as presented in this research, proved to be an efficacious approach for detecting diminutive objects. Howeever, we encountered several constraints, including time limitations, challenges in labeling training data, a desire for more granular classifications, training durations, and the limited capacity of the system, particularly considering the diverse imagery associated with various semiconductor components. There is an increasing demand in the industrial sector for effective object-detection modeling, underscoring the ongoing need for research in this area. As models such as YOLOvX are continually updated, there is a burgeoning interest in determining future research trajectories and enhancing modeling techniques. In the realm of object recognition, several key trends are shaping the future of the field, including a focus on enhancing efficiency. As the importance of edge computing grows, object-recognition algorithms must also become faster and lighter and operate effectively even on devices with limited computational capabilities. It has particular significance for time-sensitive applications and real-time processing scenarios. Semantic understanding is gaining traction. While current object-recognition algorithms excel at rapid processing, this often comes at the expense of nuanced understandings, such as intricate object features or contextual background information. The field is gradually moving toward multi-modal approaches that combine visual data with other types of information, such as text or auditory signals, to overcome these limitations. The prominence of real-time applications is rising. In sectors such as autonomous vehicles, drones, and augmented reality, real-time object recognition and tracking functionalities are becoming increasingly crucial. Algorithms must meet the dual requirements of rapid processing speeds and high accuracy while maintaining real-time operability. The area is witnessing a growth in the application of transfer learning and adaptability. Traditional algorithms are often highly specialized. However, these can be adapted for diverse contexts and applications through transfer learning. This is expected to reduce the need for labeled data and increase the versatility of object-recognition algorithms. By recognizing and addressing these trends, future research can aim to develop methodologies that not only meet the need for speed and accuracy but also have a deeper level of semantic understanding and adaptability, elevating the capabilities and applications of object-recognition technologies.
Ethics approval
The need for informed consent was waived by the ethics committee of Sungkyunkwan University, because of the AI of the study.
CRediT authorship contribution statement
Jinwoo Park: Writing – review & editing, Writing – original draft, Visualization, Supervision, Software, Project administration, Methodology, Formal analysis, Data curation, Conceptualization. Jaehyeong Lee: Data curation, Formal analysis. Jongpil Jeong: Visualization, Validation, Supervision, Conceptualization.
Declaration of Competing Interest
The authors declare that they have no known competing financial interests or personal relationships that could have appeared to influence the work reported in this paper.
Acknowledgements
This research was supported by the Sungkyunkwan University and the BK21 FOUR (Graduate School Innovation) and funded by the Ministry of Education (MOE, Korea) and National Research Foundation of Korea (NRF). Moreover, this research was supported by the MSIT (Ministry of Science and ICT), Korea, under the ICT Creative Consilience Program (IITP-2024-2020-0-01821) and supervised by the IITP (Institute for Information & Communications Technology Planning & Evaluation).
Contributor Information
Jinwoo Park, Email: lifee55@g.skku.edu.
Jaehyeong Lee, Email: objective@skku.edu.
Jongpil Jeong, Email: jpjeong@skku.edu.
Data availability
The data can be found at: https://github.com/jamesparkskku/pjw.git.
References
- 1.Jiang P., Ergu D., Liu F., Cai Y., Ma B. A review of yolo algorithm developments. Proc. Comput. Sci. 2022;199:1066–1073. [Google Scholar]
- 2.Li J., Liang X., Wei Y., Xu T., Feng J., Yan S. Proceedings of the IEEE Conference on Computer Vision and Pattern Recognition. 2017. Perceptual generative adversarial networks for small object detection; pp. 1222–1230. [Google Scholar]
- 3.Rublee E., Rabaud V., Konolige K., Bradski G. 2011 International Conference on Computer Vision. Ieee; 2011. Orb: an efficient alternative to sift or surf; pp. 2564–2571. [Google Scholar]
- 4.Bay H., Ess A., Tuytelaars T., Van Gool L. Speeded-up robust features (surf) Comput. Vis. Image Underst. 2008;110(3):346–359. [Google Scholar]
- 5.Ren S., He K., Girshick R., Sun J. Faster r-cnn: towards real-time object detection with region proposal networks. Adv. Neural Inf. Process. Syst. 2015;28 doi: 10.1109/TPAMI.2016.2577031. [DOI] [PubMed] [Google Scholar]
- 6.Girshick R. Proceedings of the IEEE International Conference on Computer Vision. 2015. Fast r-cnn; pp. 1440–1448. [Google Scholar]
- 7.He K., Gkioxari G., Dollár P., Girshick R. Proceedings of the IEEE International Conference on Computer Vision. 2017. Mask r-cnn; pp. 2961–2969. [Google Scholar]
- 8.Liu W., Anguelov D., Erhan D., Szegedy C., Reed S., Fu C.-Y., Berg A.C. Ssd: single shot multibox detector. Computer Vision–ECCV 2016: 14th European Conference; Amsterdam, the Netherlands, October 11–14, 2016, Proceedings, Part I 14; Springer; 2016. pp. 21–37. [Google Scholar]
- 9.Lin T.-Y., Goyal P., Girshick R., He K., Dollár P. Proceedings of the IEEE International Conference on Computer Vision. 2017. Focal loss for dense object detection; pp. 2980–2988. [Google Scholar]
- 10.Duan K., Bai S., Xie L., Qi H., Huang Q., Tian Q. Proceedings of the IEEE/CVF International Conference on Computer Vision. 2019. Centernet: keypoint triplets for object detection; pp. 6569–6578. [Google Scholar]
- 11.Tan M., Pang R., Le Q.V. Proceedings of the IEEE/CVF Conference on Computer Vision and Pattern Recognition. 2020. Efficientdet: scalable and efficient object detection; pp. 10781–10790. [Google Scholar]
- 12.Cai Z., Vasconcelos N. Proceedings of the IEEE Conference on Computer Vision and Pattern Recognition. 2018. Cascade r-cnn: delving into high quality object detection; pp. 6154–6162. [Google Scholar]
- 13.Ullo S.L., Mohan A., Sebastianelli A., Ahamed S.E., Kumar B., Dwivedi R., Sinha G.R. A new mask r-cnn-based method for improved landslide detection. IEEE J. Sel. Top. Appl. Earth Obs. Remote Sens. 2021;14:3799–3810. [Google Scholar]
- 14.Law H., Deng J. Proceedings of the European Conference on Computer Vision (ECCV) 2018. Cornernet: detecting objects as paired keypoints; pp. 734–750. [Google Scholar]
- 15.Tian Z., Shen C., Chen H., He T. Proceedings of the IEEE/CVF International Conference on Computer Vision. 2019. Fcos: fully convolutional one-stage object detection; pp. 9627–9636. [Google Scholar]
- 16.Fu C.-Y., Shvets M., Berg A.C. Retinamask: learning to predict masks improves state-of-the-art single-shot detection for free. arXiv:1901.03353 arXiv preprint.
- 17.Zhu C., He Y., Savvides M. Proceedings of the IEEE/CVF Conference on Computer Vision and Pattern Recognition. 2019. Feature selective anchor-free module for single-shot object detection; pp. 840–849. [Google Scholar]
- 18.Yang Z., Liu S., Hu H., Wang L., Lin S. Proceedings of the IEEE/CVF International Conference on Computer Vision. 2019. Reppoints: point set representation for object detection; pp. 9657–9666. [Google Scholar]
- 19.Li Y., Chen Y., Wang N., Zhang Z. Proceedings of the IEEE/CVF International Conference on Computer Vision. 2019. Scale-aware trident networks for object detection; pp. 6054–6063. [Google Scholar]
- 20.Liu S., Qi L., Qin H., Shi J., Jia J. Proceedings of the IEEE Conference on Computer Vision and Pattern Recognition. 2018. Path aggregation network for instance segmentation; pp. 8759–8768. [Google Scholar]
- 21.Pang J., Chen K., Shi J., Feng H., Ouyang W., Lin D. Proceedings of the IEEE/CVF Conference on Computer Vision and Pattern Recognition. 2019. Libra r-cnn: towards balanced learning for object detection; pp. 821–830. [Google Scholar]
- 22.Lu X., Li B., Yue Y., Li Q., Yan J. Proceedings of the IEEE/CVF Conference on Computer Vision and Pattern Recognition. 2019. Grid r-cnn; pp. 7363–7372. [Google Scholar]
- 23.Wang X., Kong T., Shen C., Jiang Y., Li Solo L. Segmenting objects by locations. Computer Vision–ECCV 2020: 16th European Conference; Glasgow, UK, August 23–28, 2020, Proceedings, Part XVIII 16; Springer; 2020. pp. 649–665. [Google Scholar]
- 24.Tian Z., Shen C., Chen H. Conditional convolutions for instance segmentation. Computer Vision–ECCV 2020: 16th European Conference; Glasgow, UK, August 23–28, 2020, Proceedings, Part I 16; Springer; 2020. pp. 282–298. [Google Scholar]
- 25.Sticker D., Rothbauer M., Lechner S., Hehenberger M.-T., Ertl P. Multi-layered, membrane-integrated microfluidics based on replica molding of a thiol–ene epoxy thermoset for organ-on-a-chip applications. Lab Chip. 2015;15(24):4542–4554. doi: 10.1039/c5lc01028d. [DOI] [PubMed] [Google Scholar]
- 26.Adams S.J., Henderson R.D., Yi X., Babyn P. Artificial intelligence solutions for analysis of x-ray images. Can. Assoc. Radiol. J. 2021;72(1):60–72. doi: 10.1177/0846537120941671. [DOI] [PubMed] [Google Scholar]
- 27.Fan Q., Zhuo W., Tang C.-K., Tai Y.-W. Proceedings of the IEEE/CVF Conference on Computer Vision and Pattern Recognition. 2020. Few-shot object detection with attention-rpn and multi-relation detector; pp. 4013–4022. [Google Scholar]
- 28.Iandola F.N., Han S., Moskewicz M.W., Ashraf K., Dally W.J., Keutzer K. Squeezenet: alexnet-level accuracy with 50x fewer parameters and <0.5 mb model size. arXiv:1602.07360 arXiv preprint.
- 29.Sengupta A., Ye Y., Wang R., Liu C., Roy K. Going deeper in spiking neural networks: Vgg and residual architectures. Front. Neurosci. 2019;13:95. doi: 10.3389/fnins.2019.00095. [DOI] [PMC free article] [PubMed] [Google Scholar]
- 30.Targ S., Almeida D., Lyman K. Resnet in resnet: generalizing residual architectures. arXiv:1603.08029 arXiv preprint.
- 31.Dietterich T. Overfitting and undercomputing in machine learning. ACM Comput. Surv. 1995;27(3):326–327. [Google Scholar]
- 32.Ge Z., Liu S., Wang F., Li Z., Sun J. Yolox: exceeding yolo series in 2021, arXiv preprint. arXiv:2107.08430
- 33.Xu S., Wang X., Lv W., Chang Q., Cui C., Deng K., Wang G., Dang Q., Wei S., Du Y., et al. Pp-yoloe: an evolved version of yolo. arXiv:2203.16250 arXiv preprint.
- 34.Long X., Deng K., Wang G., Zhang Y., Dang Q., Gao Y., Shen H., Ren J., Han S., Ding E., et al. Pp-yolo: an effective and efficient implementation of object detector. arXiv:2007.12099 arXiv preprint.
- 35.Xu X., Jiang Y., Chen W., Huang Y., Zhang Y., Sun X. Damo-yolo: a report on real-time object detection design. arXiv:2211.15444 arXiv preprint.
- 36.Kumar A., Kalia A., Sharma A., Kaushal M. A hybrid tiny yolo v4-spp module based improved face mask detection vision system. J. Ambient Intell. Humaniz. Comput. 2021:1–14. doi: 10.1007/s12652-021-03541-x. [DOI] [PMC free article] [PubMed] [Google Scholar]
- 37.Jocher G., Stoken A., Borovec J., Changyu L., Hogan A., Chaurasia A., Diaconu L., Ingham F., Colmagro A., Ye H., et al. Zenodo; 2021. ultralytics/yolov5: v4.0 - nn.silu( ) Activations, Weights & Biases Logging, Pytorch Hub Integration. [Google Scholar]
- 38.He J., Li L., Xu J., Zheng C. Relu deep neural networks and linear finite elements. arXiv:1807.03973 arXiv preprint.
- 39.Du J. Understanding of object detection based on cnn family and yolo. J. Phys. Conf. Ser. 2018;1004:012029. IOP Publishing. [Google Scholar]
- 40.Han Z., Huang H., Fan Q., Li Y., Li Y., Chen X. Smd-yolo: an efficient and lightweight detection method for mask wearing status during the covid-19 pandemic. Comput. Methods Programs Biomed. 2022;221 doi: 10.1016/j.cmpb.2022.106888. [DOI] [PMC free article] [PubMed] [Google Scholar]
- 41.Wang C.-Y., Liao H.-Y.M., Wu Y.-H., Chen P.-Y., Hsieh J.-W., Yeh I.-H. Proceedings of the IEEE/CVF Conference on Computer Vision and Pattern Recognition Workshops. 2020. Cspnet: a new backbone that can enhance learning capability of cnn; pp. 390–391. [Google Scholar]
- 42.Dubey A.K., Jain V. Applications of Computing, Automation and Wireless Systems in Electrical Engineering: Proceedings of MARC 2018. Springer; 2019. Comparative study of convolution neural network's relu and leaky-relu activation functions; pp. 873–880. [Google Scholar]
- 43.Ho J., Jow T.R., Boggs S. Historical introduction to capacitor technology. IEEE Electr. Insul. Mag. 2010;26(1):20–25. [Google Scholar]
- 44.Coldren L.A., Corzine S.W., Mashanovitch M.L. John Wiley & Sons; 2012. Diode Lasers and Photonic Integrated Circuits. [Google Scholar]
- 45.Frank S., Poncharal P., Wang Z., Heer W.A.d. Carbon nanotube quantum resistors. Science. 1998;280(5370):1744–1746. doi: 10.1126/science.280.5370.1744. [DOI] [PubMed] [Google Scholar]
- 46.Kastner M.A. The single-electron transistor. Rev. Mod. Phys. 1992;64(3):849. [Google Scholar]
- 47.Poldrack R.A. Region of interest analysis for fmri. Soc. Cogn. Affect. Neurosci. 2007;2(1):67–70. doi: 10.1093/scan/nsm006. [DOI] [PMC free article] [PubMed] [Google Scholar]
- 48.Deng X., Liu Q., Deng Y., Mahadevan S. An improved method to construct basic probability assignment based on the confusion matrix for classification problem. Inf. Sci. 2016;340:250–261. [Google Scholar]
- 49.Revaud J., Almazán J., Rezende R.S., Souza C.R.d. Proceedings of the IEEE/CVF International Conference on Computer Vision. 2019. Learning with average precision: training image retrieval with a listwise loss; pp. 5107–5116. [Google Scholar]
- 50.Zhu T., Li Y., Long J. Departure time choice equilibrium and tolling strategies for a bottleneck with continuous scheduling preference. Transp. Res., Part E, Logist. Transp. Rev. 2022;159 [Google Scholar]
- 51.Ioffe S., Szegedy C. Batch normalization: accelerating deep network training by reducing internal covariate shift. International Conference on Machine Learning; pmlr; 2015. pp. 448–456. [Google Scholar]
Associated Data
This section collects any data citations, data availability statements, or supplementary materials included in this article.
Data Availability Statement
The data can be found at: https://github.com/jamesparkskku/pjw.git.