

Summary
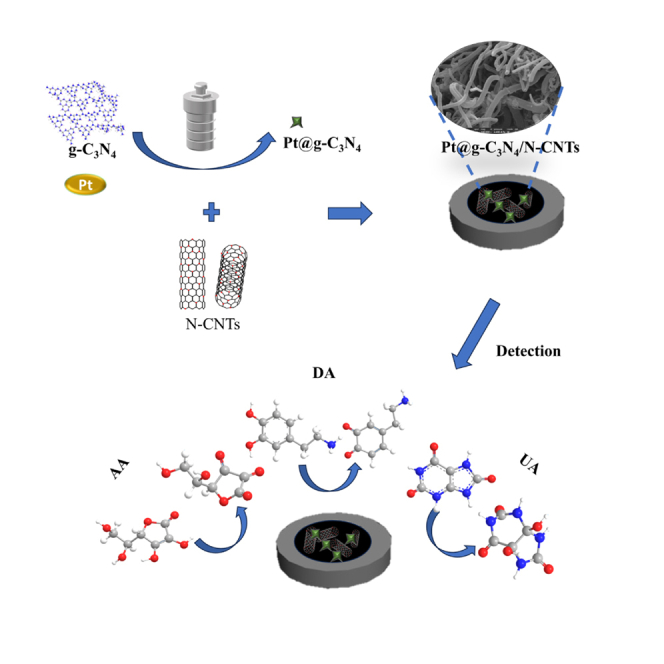
The detection of ascorbic acid (AA), dopamine (DA), and uric acid (UA) is crucial for understanding and managing various illnesses. In this research, Pt@g-C3N4 nanoparticles were synthesized via hydrothermal method and combined with N-doped carbon nanotubes (N-CNTs). The Pt@g-C3N4/N-CNTs-modified glassy carbon (GC) electrode was fabricated as an electrochemical sensor for the determination of AA, DA, and UA. The linear response range of AA, DA, and UA in the optimal condition was 100–3,000 μM, 1–100 μM, and 2–215 μM boasting a low detection limit (S/N = 3) of 29.44 μM (AA), 0.21 μM (UA), and 2.99 μM (DA), respectively. Additionally, the recoveries of AA, DA, and UA in serum sample were 100.4%–106.7%. These results corroborate the feasibility of the proposed method for the simultaneous, sensitive, and reliable detection of AA, DA, and UA. Our Pt@g-C3N4/N-CNTs/GC electrode can provide a potential strategy for disease diagnosis and health monitoring in clinical settings.
Subject areas: Sensor, Electrochemistry, Applied sciences, Nanomaterials
Graphical abstract
Highlights
-
•
Pt@g-C3N4 were synthesized and combined with N-doped carbon nanotubes
-
•
A simple, quick, and cheap electrochemical sensor was established
-
•
Simultaneous detection of AA, DA, and UA was achieved
-
•
The proposed sensor was well applied in practical measurement in human serum
Sensor; Electrochemistry; Applied sciences; Nanomaterials
Introduction
The detection of ascorbic acid (AA), dopamine (DA), and uric acid (UA) has garnered significant attention in recent years. These three active components play crucial roles in human metabolic physiology and have a profound impact on human health.1,2,3 AA is essential for organism growth and promoting antibody synthesis. It is a vital nutrient that supports immune system and helps fight off infections.4 DA is a small-molecule substance found in human central nervous system that directly influences mental activities.5 It is responsible for regulating mood, motivation, and cognition. When purine metabolism is disrupted, excess UA may be produced, leading to a condition called hyperuricemia. This accumulation of UA in the body can alter the pH of body fluids, creating an acidic internal environment. This acidic environment can have detrimental effect on cellular function and contribute to the development of various illnesses.6 Mental illness,7 Parkinson’s disease,2 hyperuricemia, and leukemia8,9 can arise from abnormal levels of AA, DA, and UA. Detecting and monitoring these substances in the body are crucial for early diagnosis and effective treatment of these diseases.
AA, DA, and UA coexist in biological fluids, such as in human plasma and urine. While the basal concentration of DA is very low (0.01–1 μM), AA and UA are present at much higher concentrations (0.1–0.5 mM and 0.12–0.45 mM).10 This large concentration difference makes it difficult to accurately detect and quantify these three substances simultaneously. Additionally, the presence of interfering substances further complicates the simultaneous detection of AA, DA, and UA. Traditional methods for detecting these substances are relatively time-consuming and expensive and require skilled labor, such as enzyme-linked immunosorbent assay,11,12 high-performance liquid chromatography,13,14,15 spectrophotometry,16 capillary electrophoresis,17 and electrochemiluminescence analysis.18,19,20 However, there is a growing interest in electrochemical techniques due to their rapid response, low cost, in situ monitoring capability, high sensitivity, good stability, and selectivity.21,22,23 Electrochemical analysis offers a promising solution for the simultaneous detection of AA, DA, and UA.
One of the main challenges in electrochemical analysis is the overlapping oxidation waves of interfering AA and DA analytes, which often disrupts the accurate determination of UA levels. To address this issue, researchers have been exploring innovative approaches to enhance the selectivity and sensitivity of electrochemical detection methods. For example, various modifications have been utilized on conventional electrodes, including carbon-based modifiers,22,24,25,26 metals/metal oxides-based electrode materials,21,27,28,29 conducting polymers,30,31 and so on. However, the current modifications still cannot meet clinical requirements.
One promising avenue for the development of electrochemical sensors is the utilization of carbon nanotubes (CNTs). These nanotubes are allotropes of carbon composed of a rolled sheet of graphene, with each end capped by half a fullerene-like molecule. They have attracted considerable attention due to their potential in sensor development. Multi-walled CNTs are concentric and enclosed tubules, with two or multiple layers of graphene separated by approximately 0.34 nm. Nitrogen can be easily incorporated into the structure of CNTs and forming N-doped carbon nanotube (N-CNT).32,33,34 It has been reported that pyridine and the tetravalent N atoms of N-CNTs can provide high localized electron densities and surface energy differences, which are favorable for electrocatalysis.
By utilizing N-CNTs, the electrochemical sensors achieve high sensitivity in the detection of AA, DA, and UA. Moreover, it exhibits excellent stability, ensuring reliable and consistent measurements. Tsierkezos et al.28 fabricated a powerful analytical tool consisting of N-CNTs decorated with rhodium, palladium, iridium, platinum, and gold nanoparticles and investigated N-CNTs/AuNPs enabling simultaneous analysis of AA, DA, and UA. Wang and co-workers22 found a three-dimensional g-C3N4/MWCNTs/GO hybrid modified electrode, which was constructed for AA, DA, and UA simultaneous detection. Fernandes et al.35 reported an Fe3O4@N-CNT modified glass carbon electrode and demonstrate Fe3O4@N-CNT composite materials are an efficient electrocatalyst. In this work, Pt@g-C3N4 was applied for modification of N-CNTs-based electrodes to facilitate the electron transfer rate and the catalytic reaction. The local electronic structure of g-C3N4 is expected to be modified by adding metallic elements, resulting in enhanced catalytic performance.36 Firstly, due to the presence of active sites and high surface area of g-C3N4, Pt nanoparticles absorption on carbon nitride surface is enhanced. Secondly, porous structure of g-C3N4 makes it easy for reactants to reach active sites or edges and form products quickly. Therefore, decoration of Pt@g-C3N4 on N-CNTs is quite evident to exhibit better electrocatalytic activity.
In this work, we have developed Pt@g-C3N4/N-CNTs nanomaterials to fabricate an electrochemical sensor for simultaneous determination of AA, DA, and UA. A large specific surface area and plenty of electrochemically active sites are attributed to the superior features of the prepared nanohybrids. This sensor exhibited high sensitivity and good stability, making it a promising platform for practical applications. Notably, the sensor has been successfully employed to analyze these three substances in human serum samples.
Results and discussion
Characterizations
To characterize the structure, morphology, and assembly mode of the hybrid nanomaterials, scanning electron microscope (SEM) images was obtained. Figures 1A–1C shows the SEM images of N-CNTs, Pt@g-C3N4, and Pt@g-C3N4/N-CNTs. The N-CNTs display distinct tubular _structures (Figure 1A), while the g-C3N4 nanosheets exhibit a unique two-dimensional block structure with folds (Figure 1B). In Figure 1C, the Pt@g-C3N4 nanoparticles are uniformly distributed and remarkably small in size, effectively attached to the surface of N-CNTs. The elemental mapping analysis (Figure 1D) and energy dispersive spectroscopy (EDS) (Figure 1E) reveal the presence of C, N, O, and Pt elements of Pt@g-C3N4/N-CNTs, confirming the successful attachment of Pt@g-C3N4 nanoparticles. And it is beneficial to enhance the effective surface area and boost the electrocatalytic performance of the sensor.
Figure 1.

Microstructural characterizations of N-CNTs, Pt@g-C3N4, and Pt@g-C3N4/N-CNTs samples
(A) SEM image of N-CNTs.
(B) SEM image of Pt@g-C3N4.
(C) SEM image of Pt@g-C3N4/N-CNTs.
(D) EDS mapping images of C, N, O, and Pt element.
(E) EDS line image of the synthesized Pt@g-C3N4/N-CNTs nanomaterials.
(F) XRD patterns of N-CNTs, Pt@g-C3N4, and Pt@g-C3N4/N-CNTs.
The structures of Pt@g-C3N4, N-CNTs, and Pt@g-C3N4/N-CNTs were analyzed by X-ray diffraction (XRD) (Figure 1F). The diffraction peak at 2ϑ = 27.8° corresponds to (002) peak of g-C3N4, and the XRD of Pt@g-C3N4 reveals the presence of metallic Pt, which conforms to JCPDS card no. 04-0802. The average crystallite particle size of Pt@g-C3N4/N-CNTs is about 7.1 nm according to Scherrer equation.
X-ray photoelectron spectroscopy (XPS) was used to further characterize the elemental composition and valence states of N-CNTs, Pt@g-C3N4, and Pt@g-C3N4/N-CNTs. From the full XPS survey spectrum in Figure 2, the characteristic peaks of C, N, O, and Pt are located at 284, 399, 531, and 73/76 eV, respectively.22,37,38,39 As can be seen from the C 1s high-resolution XPS spectra, the hydrothermally treated Pt@g-C3N4 composites exhibited smaller C-C (284.3 eV) and C-O (285.9 eV) peaks, and higher C=O (288.1 eV) peak, compared to g-C3N4.40 In the C 1s high-resolution XPS spectra of Pt@g-C3N4/N-CNTs, there is an increase in the ratio of C-C and C-N bonds, corresponding to the carbon skeleton of N-CNTs. Another peak observed at 291.2 eV can be attributed to the binding energy of CH2-CF2 of Nafion. The N 1s spectra of the N-CNTs indicate the presence of three types of nitrogen-doped sites, including pyridinic N (398.6 eV), graphitic N (400.5 eV), and quaternary N (402 eV).41,42 Compared with N-CNTs, the pyridinic N of sample Pt@g-C3N4 shifted negatively. N-C=N and N(-C)3 in Pt@g-C3N4/N-CNTs are the main components of g-C3N4 and N-CNTs. Pyridine and the tetravalent N atoms of N-doped carbon materials can provide high localized electron densities and are responsible for the electrocatalytic activity in the oxidation of UA.43 The spectrum of O 1s shows -COOH (532.1 eV) and C-OH (535.3 eV) peaks of sample Pt@g-C3N4/N-CNTs, indicating the presence of defects in the composite nanomaterials and their enhanced electrocatalytic activity.44 Because of Pt 4f high-resolution spectrum, two peaks at 75.7 and 73.1 eV were identified as Pt 4f5/2 and Pt 4f3/2, which indicate the existence of zero-valence Pt in Pt@g-C3N4 and Pt@g-C3N4/N-CNTs. The result showed that Pt nanoparticles were homogeneously distributed on the surface of N-CNTs sample.43
Figure 2.

Chemical analysis and electrical properties of N-CNTs, Pt@g-C3N4, and Pt@g-C3N4/N-CNTs samples
(A) XPS survey spectra of N-CNTs, Pt@g-C3N4, and Pt@g-C3N4/N-CNTs.
(B) High-resolution XPS spectra of C1s for Pt@g-C3N4 (top) and Pt@g-C3N4/N-CNTs (bottom) samples.
(C) High-resolution XPS spectra of N1s for Pt@g-C3N4 (top) and Pt@g-C3N4/N-CNTs (bottom) samples.
(D) High-resolution XPS spectra of O1s for Pt@g-C3N4 (top) and Pt@g-C3N4/N-CNTs (bottom) samples.
(E) High-resolution XPS spectra of Pt4f for Pt@g-C3N4 (top) and Pt@g-C3N4/N-CNTs (bottom) samples.
Electrochemical characterizations of the modified electrodes
Before AA, DA, and UA detection, the electrochemical features of modified electrodes were characterized by the [Fe(CN)6]3-/4- redox probe. Cyclic voltammetry (CV) and electrochemical impedance spectroscopy (EIS) tests were performed. As can be seen in Figure 3A, a pair of reversible redox peaks could be observed at the bare GC electrode. After the modification of N-CNTs nanoparticles on the electrode surface, the gap between redox peak potential became smaller and the peak current density decreased slightly. When Pt@g-C3N4 nanoparticles are attached and dispersed on the surface of N-CNTs, the redox peak current density increased significantly. It indicates that Pt@g-C3N4/N-CNTs hybrid nanomaterials facilitate electron transport and the electroactive surface area of Pt@g-C3N4/N-CNTs was 0.27 cm2 (calculated on the basis of the Randles-Ševčík equation), which is about 2.2 times higher than that of bare GC electrode.
Figure 3.

Electrochemical characterizations of bare GC, N-CNTs/GC, and Pt@g-C3N4/N-CNTs/GC electrodes in 5 mM [Fe(CN)6]3-/4- solution containing 0.5 M KCl
(A) CV curves of bare GC, N-CNTs/GC, and Pt@g-C3N4/N-CNTs/GC electrodes.
(B) EIS spectra of bare GC, N-CNTs/GC, and Pt@g-C3N4/N-CNTs/GC electrodes.
Nyquist plots were in Figure 3B. The Randles circuit was used to interpret the electron transfer characteristics. Mass transport is characterized at low frequencies, and Warburg impedance relates diffusion of electroactive species. In this work, ZView software was used to fit the semicircle diameter in the EIS Nyquist plot. The electron transfer resistance (Rct) value of Pt@g-C3N4/N-CNTs/GC electrode is 6.8 Ω, which is much lower than that of GC electrode (53 Ω), meaning electron transfer ability of Pt@g-C3N4/N-CNTs/GC electrode is faster.
Electrochemical behaviors of AA, DA, and UA
The electrochemical response of the three different electrodes to AA, DA, and UA in 0.1 M PBS (pH 7.0) was performed. Figure 4 shows the CV and differential pulse voltammetry (DPV) performances of 0.5 mM AA, 0.1 mM DA, and 0.1 mM UA simultaneously at bare GC, N-CNTs/GC, and Pt@g-C3N4/N-CNTs/GC electrodes. CV signals (Figure 4A) show that, compared to the bare GC and N-CNTs/GC electrode, at Pt@g-C3N4/N-CNTs/GC electrode three distinct oxidation peaks of AA, DA, and UA occur at a lower overpotential, accompanied by a slightly higher peak current. The presence of N-CNTs enhances the electrochemical analysis of AA, DA, and UA.28 The oxidation overpotential of AA is reduced compared to that required on GC electrode, resulting in the separation of the overlapping oxidation waves of AA and DA. The electrooxidation of DA shows a tendency toward reversibility on both N-CNTs/GC and Pt@g-C3N4/N-CNTs/GC electrodes. The peak potential (ΔEp) value for oxidation of DA obtained onto Pt@g-C3N4/N-CNTs/GC electrode is about 0.023 V, which is much smaller compared to that measured under the same conditions onto N-CNTs/GC electrode (0.072 V). The difference in ΔEp is related to the rate of heterogeneous electron transfer. These findings indicate that the oxidation kinetic of DA is accelerated on Pt@g-C3N4/N-CNTs/GC electrode compared to N-CNTs/GC electrode. Furthermore, the oxidation current of UA is higher on Pt@g-C3N4/N-CNTs/GC electrode than on either GC or N-CNTs/GC electrode.
Figure 4.

Electrochemical detection of 0.5 mM AA, 0.1 mM DA, and 0.1 mM UA in 0.1 M PBS
(A) CV curves of bare GC, N-CNTs/GC, and Pt@g-C3N4/N-CNTs/GC electrodes.
(B) DPV curves of bare GC, N-CNTs/GC, and Pt@g-C3N4/N-CNTs/GC electrodes.
These results have been validated by DPV, a powerful electrochemical technique in analytical measurements. The electrochemical behaviors of AA, DA, and UA exhibit distinct differences, with three oxidation peaks observed at −0.028, 0.172, and 0.292 V, respectively (Figure 4B). Notably, the oxidation of AA on GC electrode lies at about 0.400 V vs. saturated calomel electrode (SCE),45 whereas the oxidation overpotential of AA decreases on N-CNTs and Pt@g-C3N4/N-CNTs-modified electrodes. Furthermore, the anodic peak potentials for AA, DA, and UA show a shift toward a less positive potential at Pt@g-C3N4/N-CNTs/GC electrode, as compared to the GC or N-CNTs/GC electrode. The response signals of Pt@g-C3N4/N-CNTs/GC electrode to the mixture of the three substances are notably higher than those of N-CNTs/GCE. This enhancement in electrocatalytic activity is attributed to the increased electrode surface area and active sites, as well as the high electron transfer performance of Pt@g-C3N4/N-CNTs composite. The profound results demonstrate the good electrocatalytic activity of Pt@g-C3N4/N-CNTs/GC electrode in individual and simultaneous AA, DA, and UA sensing. Detailed results about different modified electrodes are provided in the supplemental material.
Optimization of the experimental conditions
To achieve the best performance, the pH of detection solution and materials proportion were optimized.
The electrolyte solution’s pH has an impact on the peak current of AA, DA, and UA; 0.1 M PBS buffer solutions with varying pH levels ranging from 6 to 8 were measured. The results, illustrated in Figure 5A, revealed a notable trend: as the pH of the medium increased from 6 to 8, the anodic peak potentials for AA, DA, and UA shifted toward less positive potential. This shift can be attributed to the involvement of protons in the electrooxidation reactions of AA, DA, and UA.22,46
Figure 5.

Optimization of experimental conditions
(A) DPV curves of Pt@g-C3N4/N-CNTs/GC electrode in different pH solutions.
(B) Histograms showing the peak currents of AA, DA, and UA in different pH solutions. Error bars represent the standard errors (n = 3).
(C) DPV curves of modified electrodes with different proportions of hybrid nanomaterials.
(D) Histograms showing the peak currents of AA, DA, and UA at modified electrodes with different proportions of hybrid nanomaterials. Error bars represent the standard errors (n = 3).
Plotting Ep against pH within the working pH range (Figure S3) further elucidated the relationship between the compounds and the buffer pH. The plotted data exhibited a linear correlation, with the Ep of all compounds demonstrating a consistent linear relationship with the buffer pH. Notably, the observed slopes of 0.046, 0.048, and 0.064 V/pH for AA, DA, and UA, respectively, closely approximated the expected Nernstian value of 0.0585 V/pH for a two-electron, two-proton transfer in the electrochemical reaction. The possible redox reaction mechanism can be expressed as Scheme 1.21,22
Scheme 1.

Oxidation process of AA, DA, and UA
The peak currents of AA, DA, and UA with the increase of solution pH are shown in Figure 5B. The response signal of AA was observed to remain nearly stable, while the maximum current signals of DA and UA were obtained at pH 7. This finding is indicative of the fact that PBS at pH 7 gave the best response.
The optimized proportional of hybrid Pt@g-C3N4/N-CNTs nanomaterials was crucial in determining the electrochemical performance. Figure 5C shows the electrochemical performance of Pt@g-C3N4/N-CNTs (1:1, 2:1, 10:1, 20:1) in a 0.1 M PBS at pH 7 solution containing 0.5 mM AA + 0.1 mM DA + 0.1 mM UA. DPV signals varied with the three substances on different modifier GC electrode. As shown in Figure 5D, anodic peak currents of AA, DA, and UA on Pt@g-C3N4/N-CNTs (2:1) modified GC electrode are higher than those of GC electrode modified by other substances. The resulting data indicate that the hybrid nanomaterials exhibit strong synergy and high electron transfer properties, particularly at the 2:1 proportion of Pt@g-C3N4/N-CNTs.
Feasibility study
The Pt@g-C3N4/N-CNTs GC electrode detection of AA, DA, and UA was evaluated using DPV. Through an analysis of the relationship between the peak current and the concentration of the three substances, the electrocatalytic oxidation of AA, DA, and UA was explored. In Figure 6A, it is found that the DPV profiles of the Pt@g-C3N4/N-CNTs GC electrode exhibited a linear relationship with the concentration of AA, with a regression equation of I(AA)(μA) = 0.0259 C(AA)(μM) + 30.667 (R2 = 0.998) within the concentration range of 2–2,000 μM. For DA, the linear regression equation between peak current and concentration is I(DA)(μA) = 0.709 C(DA)(μM) + 30.282 (R2 = 0.996) within the concentration range of 5–100 μM. As the concentration of DA continues to increase, the linear regression equation will be different. This is because the diffusion rate of oxidation products may differ. The linear regression equation between peak current and UA concentration is I(UA)(μA) = 0.417 C(UA)(μM) + 11.074 (R2 = 0.996) within the concentrations range of 1–110 μM. The detection limits of Pt@g-C3N4/N-CNTs GC electrode for determination of AA, DA, and UA are 29.44, 0.21, and 2.99 μM (S/N = 3), respectively.
Figure 6.

Individual detection of AA, DA, and UA
(A) DPV curves of Pt@g-C3N4/N-CNTs GC electrode in different concentrations of AA (2–2,000 μM).
(B) Linear fitting between the concentrations of AA and peak currents. Error bars represent the standard errors (n = 3).
(C) DPV curves of Pt@g-C3N4/N-CNTs GC electrode in different concentrations of DA (5–100 μM).
(D) Linear fitting between the concentrations of DA and peak currents. Error bars represent the standard errors (n = 3).
(E) DPV curves of Pt@g-C3N4/N-CNTs GC electrode in different concentrations of UA (1–110 μM).
(F) Linear fitting between the concentrations of UA and peak currents. Error bars represent the standard errors (n = 3).
The concentrations of AA, DA, and UA in the ternary mixture were simultaneously determined on the Pt@g-C3N4/N-CNTs GC electrode. The analytical performance was examined by the relationship between peak current and AA, DA, and UA in the ternary mixtures. The DPV curves of the concentrations changes of three analytes are shown in Figure 7A. The concentration of AA increased from 100 to 3,000 μM, and the concentrations ranges of DA and UA are 1–100 μM and 2–215 μM, respectively. The results show that peak currents of all three analytes increased linearly with increasing concentrations of AA, DA, and UA. The fitted linear regression equations are as follow: I(AA)(μA) = 0.0372 C(AA)(μM) + 641.4 (R2 = 0.990) for AA, I(DA)(μA) = 38.174C(DA)(μM) + 566.821 (R2 = 0.990) and I(DA)(μA) = 7.408C(DA)(μM) + 715.135 (R2 = 0.993) for DA, and I(UA)(μA) = 6.009C(UA)(μM) + 450.914 (R2 = 0.988) and I(UA)(μA) = 0.518C(UA)(μM) + 486.106 (R2 = 0.990) for UA.
Figure 7.

Simultaneous detection of AA, DA, and UA
(A) DPV curves of Pt@g-C3N4/N-CNTs GC electrode in the ternary mixture with different concentrations of AA (2–2,000 μM), DA (5–100 μM), and UA (1–110 μM).
(B) Linear fitting between the concentrations of AA and peak currents. Error bars represent the standard errors (n = 3).
(C) Linear fitting between the concentrations of DA and peak currents. Error bars represent the standard errors (n = 3).
(D) Linear fitting between the concentrations of UA and peak currents. Error bars represent the standard errors (n = 3).
Table 1 provides a comparison of the performance of the Pt@g-C3N4/N-CNTs GC electrode with several other electrodes that have been previously studied. The results clearly demonstrate that the Pt@g-C3N4/N-CNTs GC electrode is capable of detecting AA, DA, and UA simultaneously, with a high level of sensitivity, low detection limits, and wide linear ranges. This good biosensing performance is likely due to the advantageous properties of the N-CNTs-based composite for electrochemical analysis of AA, DA, and UA. The presence of nitrogen atoms in g-C3N4, along with the unique sp2 hybridization of C and N structures, provides a large number of active surface sites. Additionally, the incorporation of metal elements can adjust the electronic and catalytic properties of g-C3N4. Pt nanoparticles appear to improve better the electrocatalytic activity and sensitivity.
Table 1.
Comparison of Pt@g-C3N4/N-CNTs GC electrode sensor with those of reported electrode materials
| Electrode | Sensitivity/(μA μM−1 cm−2) |
Linear range/(μM) |
LOD/(μM) |
Reference | ||||||
|---|---|---|---|---|---|---|---|---|---|---|
| AA | DA | UA | AA | DA | UA | AA | DA | UA | ||
| g-C3N4/MWNTs/GO/GCE | 0.0236 | 5.666 | 2.682 | 200–7500 | 2–100 | 4–200 | 96 | 0.22 | 1.36 | Wang et al. 22 |
| PdNPsa/rGO/GCE | 0.079 | 10.893 | 0.481 | 500–3500 | 3–42 | 300–1400 | 100 | 1 | 16.67 | Wei et al. 47 |
| Fe3O4/rGO | 0.0335 | 38.8 | 4.5 | 160–7200 | 0.4–3.5 | 4–20 | 20 | 0.08 | 0.5 | Teymourian et al. 48 |
| Pt@NP-AuSnb/CFPc | 0.0004 | 0.0017 | 0.0003 | 200–1200 | 0.5–10 | 25–500 | 13.4 | 0.31 | 0.76 | Yang et al. 49 |
| CBd/GCE | 0.214 | 1.570 | 0.680 | 1.91–37.8 | 0.599–11.8 | 1.01–14 | 0.03 | 0.0524 | 0.0407 | Vicentini et al. 50 |
| Pd3Pt1e/PDDAf-rGO/GCE | 0.359 | 0.639 | 0.498 | 40–1200 | 4–200 | 4–400 | 0.61 | 0.04 | 0.10 | Yan et al. 51 |
| SnO2/chitosan/GCE | 0.127 | 2.773 | 2.391 | 20–220 | 0.1–18 | 1–100 | 6.45 | 0.77 | 0.89 | Selvarajan et al. 52 |
| Pt@g-C3N4/N-CNTs/GCE | 0.258 | 0.709 | 0.417 | 2–2000 | 5–100 | 1–110 | 29.44 | 0.21 | 2.99 | This work |
palladium nanoparticles;
Pt nanoparticle-modified nanoporous AuSn;
Ni-buffered flexible carbon fiber paper;
nanostructured carbon black;
Pd-Pt bimetallic nanoparticles;
poly(diallyldimethylammonium chloride).
Repeatability, stability, and interferences effect
Repeatability, stability, and selectivity are important factors for electrochemical sensors in practical analysis. Pt@g-C3N4/N-CNTs GC electrode sensor was employed to detect the peak current of the ternary mixture containing 0.5 mM AA, 0.1 mM DA, and 0.1 mM UA. 10 times repeated determination of the peak current of AA, DA, and UA via DPV experiments was carried out. The relative standard deviations of peak currents are 0.73% for AA, 0.22% for DA, and 0.75% for UA. The results indicate that Pt@g-C3N4/N-CNTs GC electrode has good reproducibility for simultaneous determination of AA, DA, and UA.
Figure 8A shows the stability test. Pt@g-C3N4/N-CNTs GC electrode was stored at room temperature. Three paralleled tests were performed to detect the peak current of the ternary mixture containing 0.5 mM AA, 0.1 mM DA, and 0.1 mM UA. The relative standard deviation of peak current are 1.65% for AA, 0.67% for DA, and 0.65% for UA, suggesting that Pt@g-C3N4/N-CNTs GC electrode has good stability for simultaneous determination of AA, DA, and UA.
Figure 8.

Stability and selectivity test
Interfering substance: 5 mM Na+, 5 mM K+, 5 mM Mg2+, 1 mM glucose, 1 mM glycine, and 1 mM citric acid.
(A) Histograms of Pt@g-C3N4/N-CNTs GC electrode for stability test. Error bars represent the standard errors (n = 3).
(B) Amperometric response to continuous addition of 0.5 mM AA and interfering substances.
(C) Amperometric response to continuous addition of 0.1 mM DA and interfering substances.
(D) Amperometric response to continuous addition of 0.1 mM UA and interfering substances.
Figures 8B, 8C, and 8D show several potential interferences evaluated by amperometric method. The applying potentials are 0.1 V for AA, 0.35 V for DA, and 0.5 V for UA, respectively. The physiological interfering molecules such as glucose, glycine, and citric acid (1 mM) and common ions such as Na+, K+, and Mg2+ (5 mM) were added into 0.1 M PBS solution containing 0.5 mM AA, 0.1 mM DA, and 0.1 mM UA, respectively. It was found that the response current remained unchanged when interfering substances were added, despite the fact that the concentrations of interfering substances were almost 10 or 50 times higher than the concentrations of AA, DA, and UA. The results show Pt@g-C3N4/N-CNTs GC electrode has good stability for simultaneous determination of AA, DA, and UA in the presence of the aforementioned interfering substances.
Real sample analysis
In order to verify the reliability of the practical application of the proposed Pt@g-C3N4/N-CNTs GC electrode sensor, the feasibility was performed by determining the recovery rates of AA, DA, and UA in the human serum samples provided by local hospital. The serum sample was injected into the electrolyte and diluted 40 times. Without any pretreatment process, DPV records Pt@g-C3N4/N-CNTs GC electrode. As shown in Figure 9 and Table 2, UA has been detected in real serum sample with the value about 73.14 μM. Standard addition method was applied for the quantitation of AA, DA, and UA. Based on the obtained recovery values 106.7%, 100.4%, and 113.2%, respectively, the presence of the possibly interfering species in human serum sample has minor impact on the detection of AA, DA, and UA. The Pt@g-C3N4/N-CNTs GC electrode is a suitable electrochemical sensor in simultaneous determination of AA, DA, and UA.
Figure 9.

Real sample analysis by standard addition method
DPV responses of human blood serum sample and 150 μM AA, 25 μM DA, and 15 μM UA at Pt@g-C3N4/N-CNTs GC electrode.
Table 2.
Recovery data for the determination of AA, DA, and UA in human blood serum using the calibration curve method
| Sample | Species | Detected (μM) | Added (μM) | Found (μM) | Recovery (%) |
|---|---|---|---|---|---|
| Human blood serum | AA | – | 150 | 160.05 | 106.7 |
| DA | – | 25 | 26.14 | 100.4 | |
| UA | 73.14 | 15 | 89.12 | 106.5 |
Limitations of the study
A new electrochemical sensor has been developed using Pt@g-C3N4/N-CNTs composite. Incorporating heteroatoms such as N into the carbon supports as anchors to disperse and stabilize the supported metal nanoparticles, which shows striking effects to the improved catalytic performance. However, the synthesis of Pt nanoparticles with controllable shape and size and customized catalytic properties still faces challenges.
Moreover, the advanced sensor demonstrates high sensitivity and selectivity, allowing for the simultaneous detection of AA, DA, and UA. The whole process is still at laboratory scale. A detailed analysis of electrocatalytic process in modified electrodes is required for an in-depth explanation. Further endeavors are imperative in achieving the desired electrochemical catalysis.
STAR★Methods
Key resources table
| REAGENT or RESOURCE | SOURCE | IDENTIFIER |
|---|---|---|
| Chemicals, peptides, and recombinant proteins | ||
| Uric acid | Sinopharm | CAS: 69-93-2 |
| Ascorbic acid | Sinopharm | CAS: 50-81-7 |
| Dopamine | Macklin | CAS: 51-61-6 |
| Chloroplatinic acid hexahydrate | Sinopharm | CAS: 18497-13-7 |
| Nitrogen-doped multi-walled carbon nanotubes | XFNANO | CAS: 1333-86-4 |
| graphitic carbon nitride | XFNANO | CAS: 7440-44-0 |
| Critical commercial assays | ||
| electrochemical workstation | CHI 660E | http://www.chinstr.com/ |
| Software and algorithms | ||
| Origin 8.5 | OriginLab Corporation | https://www.originlab.com/ |
Resource availability
Lead contact
Further information and requests for materials should be directed to and will be fulfilled by the lead contact, Lin Zhang (3162@hbtcm.edu.cn).
Materials availability
This study did not generate new unique reagents.
Data and code availability
-
•
Data reported in this paper will be shared by the lead contact upon request.
-
•
This paper does not report original code.
-
•
Any additional information required to reanalyze the data reported in this paper is available from the lead contact upon request.
Method details
Materials
All chemical reagents were of analytical grade and used without further purification. All solutions were freshly prepared with ultrapure water.
Synthesis of Pt@g-C3N4
The noble platinum metal was loaded onto the surface of g-C3N4 via hydrothermal methods. Briefly, 10 mg g-C3N4 and 5 mg NaOH were dispersed in 10 mL deionized water by magnetic stirring, and 226 μL H2PtCl6 solution (1%) was slowly dropped into the suspension solution. Then, the mixture was sealed in an autoclave for hydrothermally treated at 180°C for 10 h. The target product was collected by centrifugation, followed by drying.
Synthesis of Pt@g-C3N4/N-CNTs/GC electrode
Different mass of Pt@g-C3N4 and N-CNTs were dispersed and ultrasonicated for 20 min 1 mg mL−1 Pt@g-C3N4/N-CNTs solution was obtained by redispersing Pt@g-C3N4/N-CNTs (1:2) in a mixture of water and 5% Nafion (v/v = 1:0.008) for 20 min under ultrasonic treatment. 10 μL of the suspension solution was dropped onto the surface of GC electrode and after drying Pt@g-C3N4/N-CNTs/GC electrode was obtained.
Materials characterization
X-ray diffraction (XRD) was performed using an X-ray diffractometer (D/Max 2500 PC, Rigaku Corporation, Japan). Scanning electron microscope (SEM) images were obtained by scanning electron microscope (Sigma 500, Zeiss, Germany), while X-ray photoelectron spectroscopy (XPS) were collected by X-ray photoelectron spectrometer (Escalab 250 XI, Thermo Scientific, USA).
Electrochemical measurements and calculations
The electrochemical test was carried out using CHI 660E electrochemical workstation (Shanghai CH Instrument Co.,China). A three-electrode system was used with a bare or modified glassy carbon electrode (GC electrode, 3 mm in diameter) as the working electrode, a platinum plate (5 × 5 mm) as the auxiliary electrode, and KCl saturated Ag/AgCl as the reference electrode.
The Randles–Ševčík equation was used to calculate the electroactive surface area:
where relates to the peak current (A), A is the effective surface area (cm2), D is the diffusion coefficient of [Fe(CN)6]4−/3− (6.7 × 10⁻⁶ cm2 s−1), n denotes the electron transfer number (n = 1), and is the scanning rate (V s−1).
Quantification and statistical analysis
Origin software was used to compile and analyze data.
Acknowledgments
This work was financially supported by the National Natural Science Foundation of China (82204416), the Department of Education of Hubei Province (no. B2022119), and the Young Elite Scientists Sponsorship Program by CAST (2021-QNRC2-B16).
Author contributions
L.Z.: conceptualization, methodology, investigation, writing – original draft, writing – review & editing; L.Y.: validation, investigation; J.P.: validation; X.H.: writing – review & editing; H.D.: supervision, funding acquisition, writing – review & editing. All authors reviewed, revised, and approved of this manuscript.
Declaration of interests
The authors declare no competing interests.
Published: February 15, 2024
Footnotes
Supplemental information can be found online at https://doi.org/10.1016/j.isci.2024.109241.
Contributor Information
Lin Zhang, Email: 3162@hbtcm.edu.cn.
Xiaoying Hou, Email: jhhxy2021@jhun.edu.cn.
Hongzhi Du, Email: 3163dhz@hbtcm.edu.cn.
Supplemental information
References
- 1.Ballaz S.J., Rebec G.V. Neurobiology of vitamin C: Expanding the focus from antioxidant to endogenous neuromodulator. Pharmacol. Res. 2019;146 doi: 10.1016/j.phrs.2019.104321. [DOI] [PubMed] [Google Scholar]
- 2.Ciobanu C.A., Ionita I., Mihailescu A.I., Ciobanu A.M. Cyclic voltammetry as a measuring tool in Parkinson’s disease and associated psychiatric commorbidities. Eur. Psychiatr. 2023;66:S757–S758. doi: 10.1192/j.eurpsy.2023.1597. [DOI] [Google Scholar]
- 3.Aoki T., Nakai S., Uchino J., Shibata K., Shinzato T., Masakane I., Toma S., Fukui H., Matsuoka T., Kato S., et al. Comparison of Body Fluid Volumes Determined by Kinetic Modeling and by Bioimpedance Spectroscopy. Blood Purif. 2022;51:866–874. doi: 10.1159/000521563. [DOI] [PubMed] [Google Scholar]
- 4.Tzounakas V.L., Anastasiadi A.T., Arvaniti V.-Z., Lelli V., Fanelli G., Paronis E.C., Apostolidou A.C., Balafas E.G., Kostomitsopoulos N.G., Papageorgiou E.G., et al. Supplementation with uric and ascorbic acid protects stored red blood cells through enhancement of non-enzymatic antioxidant activity and metabolic rewiring. Redox Biol. 2022;57 doi: 10.1016/j.redox.2022.102477. [DOI] [PMC free article] [PubMed] [Google Scholar]
- 5.Costa K.M., Schoenbaum G. Dopamine. Curr. Biol. 2022;32:R817–R824. doi: 10.1016/j.cub.2022.06.060. [DOI] [PubMed] [Google Scholar]
- 6.Lin Z., Jayachandran M., Haskic Z., Kumar S., Lieske J.C. Differences of Uric Acid Transporters Carrying Extracellular Vesicles in the Urine from Uric Acid and Calcium Stone Formers and Non-Stone Formers. Int. J. Mol. Sci. 2022;23 doi: 10.3390/ijms231710010. [DOI] [PMC free article] [PubMed] [Google Scholar]
- 7.Trossbach S.V., Bader V., Hecher L., Pum M.E., Masoud S.T., Prikulis I., Schäble S., de Souza Silva M.A., Su P., Boulat B., et al. Misassembly of full-length Disrupted-in-Schizophrenia 1 protein is linked to altered dopamine homeostasis and behavioral deficits. Mol. Psychiatry. 2016;21:1561–1572. doi: 10.1038/mp.2015.194. [DOI] [PMC free article] [PubMed] [Google Scholar]
- 8.Ahmed A.S., Mona M.M., Elsisy R.A., Hantash E.M. Potential of Ascorbic Acid Supplements to Ameliorate the Deleterious Effects of Hyperuricemia on Albino Wistar Rats’ Hippocampus (Structural and Functional Study) Neuroendocrinology. 2023;113:615–624. doi: 10.1159/000529061. [DOI] [PubMed] [Google Scholar]
- 9.Feng Y., Fu M., Guan X., Wang C., Meng H., Zhou Y., He M., Guo H. Associations of exposure to perfluoroalkyl substances with serum uric acid change and hyperuricemia among Chinese women: Results from a longitudinal study. Chemosphere. 2022;308 doi: 10.1016/j.chemosphere.2022.136438. [DOI] [PubMed] [Google Scholar]
- 10.Alba A.F., Totoricaguena-Gorriño J., Sánchez-Ilárduya M.B., Ruiz-Rubio L., Vilas-Vilela J.L., Lanceros-Méndez S., del Campo F.J. Laser-activated screen-printed carbon electrodes for enhanced dopamine determination in the presence of ascorbic and uric acid. Electrochim. Acta. 2021;399 doi: 10.1016/j.electacta.2021.139374. [DOI] [Google Scholar]
- 11.Zhao D., Li J., Peng C., Zhu S., Sun J., Yang X. Fluorescence Immunoassay Based on the Alkaline Phosphatase Triggered in Situ Fluorogenic Reaction of o-Phenylenediamine and Ascorbic Acid. Anal. Chem. 2019;91:2978–2984. doi: 10.1021/acs.analchem.8b05203. [DOI] [PubMed] [Google Scholar]
- 12.Kim J., Jeon M., Paeng K.-J., Paeng I.R. Competitive enzyme-linked immunosorbent assay for the determination of catecholamine, dopamine in serum. Anal. Chim. Acta. 2008;619:87–93. doi: 10.1016/j.aca.2008.02.042. [DOI] [PubMed] [Google Scholar]
- 13.Darczuk D., Krzyściak W., Bystrowska B., Kęsek B., Kościelniak D., Chomyszyn-Gajewska M., Kaczmarzyk T. The Relationship between the Concentration of Salivary Tyrosine and Antioxidants in Patients with Oral Lichen Planus. Oxid. Med. Cell. Longev. 2019;2019 doi: 10.1155/2019/5801570. [DOI] [PMC free article] [PubMed] [Google Scholar]
- 14.van Gorkom G., Gijsbers B., Ververs E.-J., El Molla A., Sarodnik C., Riess C., Wodzig W., Bos G., Van Elssen C. Easy-to-Use HPLC Method to Measure Intracellular Ascorbic Acid Levels in Human Peripheral Blood Mononuclear Cells and in Plasma. Antioxidants. 2022;11 doi: 10.3390/antiox11010134. [DOI] [PMC free article] [PubMed] [Google Scholar]
- 15.Qiao F., Wang X., Han Y., Kang Y., Yan H. Preparation of poly (methacrylic acid)/graphene oxide aerogel as solid-phase extraction adsorbent for extraction and determination of dopamine and tyrosine in urine of patients with depression. Anal. Chim. Acta. 2023;1269 doi: 10.1016/j.aca.2023.341404. [DOI] [PubMed] [Google Scholar]
- 16.Chaiendoo K., Ittisanronnachai S., Promarak V., Ngeontae W. Polydopamine-coated carbon nanodots are a highly selective turn-on fluorescent probe for dopamine. Carbon. 2019;146:728–735. doi: 10.1016/j.carbon.2019.02.030. [DOI] [Google Scholar]
- 17.Zinellu A., Sotgia S., Deiana L., Carru C. Field-amplified sample injection combined with pressure-assisted capillary electrophoresis UV detection for the simultaneous analysis of allantoin, uric acid, and malondialdehyde in human plasma. Anal. Bioanal. Chem. 2011;399:2855–2861. doi: 10.1007/s00216-010-4648-x. [DOI] [PubMed] [Google Scholar]
- 18.Liang Y., Lai W., Su Y., Zhang C. A novel cloth-based multiway closed bipolar electrochemiluminescence biosensor for accurate detection of uric acid. Microchem. J. 2022;179 doi: 10.1016/j.microc.2022.107657. [DOI] [Google Scholar]
- 19.Tao X.-L., Pan M.-C., Yang X., Yuan R., Zhuo Y. CDs assembled metal-organic framework: Exogenous coreactant-free biosensing platform with pore confinement-enhanced electrochemiluminescence. Chin. Chem. Lett. 2022;33:4803–4807. doi: 10.1016/j.cclet.2022.01.010. [DOI] [Google Scholar]
- 20.Wang Z., Wang X., Zhu X., Lv J., Zhang J., Zhu Q., Dai Z. Fabrication of non-destructive and enhanced electrochemiluminescence interface for reusable detection of cell-released dopamine. Sensor. Actuator. B Chem. 2019;285:438–444. doi: 10.1016/j.snb.2019.01.087. [DOI] [Google Scholar]
- 21.Pan Y., Zuo J., Hou Z., Huang Y., Huang C. Preparation of Electrochemical Sensor Based on Zinc Oxide Nanoparticles for Simultaneous Determination of AA, DA, and UA. Front. Chem. 2020;8 doi: 10.3389/fchem.2020.592538. [DOI] [PMC free article] [PubMed] [Google Scholar]
- 22.Wang H., Xie A., Li S., Wang J., Chen K., Su Z., Song N., Luo S. Three-dimensional g-C(3)N(4)/MWNTs/GO hybrid electrode as electrochemical sensor for simultaneous determination of ascorbic acid, dopamine and uric acid. Anal. Chim. Acta. 2022;1211 doi: 10.1016/j.aca.2022.339907. [DOI] [PubMed] [Google Scholar]
- 23.Hatefi-Mehrjardi A., Karimi M.A., Soleymanzadeh M., Barani A. Highly sensitive detection of dopamine, ascorbic and uric acid with a nanostructure of dianix yellow/multi-walled carbon nanotubes modified electrode. Measurement. 2020;163 doi: 10.1016/j.measurement.2020.107893. [DOI] [Google Scholar]
- 24.Lin K.-C., Tsai T.-H., Chen S.-M. Performing enzyme-free H2O2 biosensor and simultaneous determination for AA, DA, and UA by MWCNT–PEDOT film. Biosens. Bioelectron. 2010;26:608–614. doi: 10.1016/j.bios.2010.07.019. [DOI] [PubMed] [Google Scholar]
- 25.Noroozifar M., Khorasani-Motlagh M., Akbari R., Bemanadi Parizi M. Simultaneous and sensitive determination of a quaternary mixture of AA, DA, UA and Trp using a modified GCE by iron ion-doped natrolite zeolite-multiwall carbon nanotube. Biosens. Bioelectron. 2011;28:56–63. doi: 10.1016/j.bios.2011.06.042. [DOI] [PubMed] [Google Scholar]
- 26.Savk A., Özdil B., Demirkan B., Nas M.S., Calimli M.H., Alma M.H., Inamuddin Asiri A.M., Asiri A.M., Şen F. Multiwalled carbon nanotube-based nanosensor for ultrasensitive detection of uric acid, dopamine, and ascorbic acid. Mater. Sci. Eng. C Mater. Biol. Appl. 2019;99:248–254. doi: 10.1016/j.msec.2019.01.113. [DOI] [PubMed] [Google Scholar]
- 27.Xue Y., Zheng Y., Wang E., Yang T., Wang H., Hou X. Ti3C2Tx (MXene)/Pt nanoparticle electrode for the accurate detection of DA coexisting with AA and UA. Dalton Trans. 2022;51:4549–4559. doi: 10.1039/D2DT00110A. [DOI] [PubMed] [Google Scholar]
- 28.Tsierkezos N.G., Othman S.H., Ritter U., Hafermann L., Knauer A., Köhler J.M., Downing C., McCarthy E.K. Electrochemical analysis of ascorbic acid, dopamine, and uric acid on nobel metal modified nitrogen-doped carbon nanotubes. Sensor. Actuator. B Chem. 2016;231:218–229. doi: 10.1016/j.snb.2016.03.032. [DOI] [Google Scholar]
- 29.Xu Y., Meng Z., Meng Y., Li X., Xiao D. Lithium cobalt phosphate electrode for the simultaneous determination of ascorbic acid, dopamine, and serum uric acid by differential pulse voltammetry. Mikrochim. Acta. 2021;188:190. doi: 10.1007/s00604-021-04839-5. [DOI] [PubMed] [Google Scholar]
- 30.Văduva M., Baibarac M., Cramariuc O. Functionalization of Graphene Derivatives with Conducting Polymers and Their Applications in Uric Acid Detection. Molecules. 2022;28 doi: 10.3390/molecules28010135. [DOI] [PMC free article] [PubMed] [Google Scholar]
- 31.Wu Y., Deng P., Tian Y., Feng J., Xiao J., Li J., Liu J., Li G., He Q. Simultaneous and sensitive determination of ascorbic acid, dopamine and uric acid via an electrochemical sensor based on PVP-graphene composite. J. Nanobiotechnol. 2020;18:112. doi: 10.1186/s12951-020-00672-9. [DOI] [PMC free article] [PubMed] [Google Scholar]
- 32.Lee W.J., Hwang T.H., Hwang J.O., Kim H.W., Lim J., Jeong H.Y., Shim J., Han T.H., Kim J.Y., Choi J.W., Kim S.O. N-doped graphitic self-encapsulation for high performance silicon anodes in lithium-ion batteries. Energy Environ. Sci. 2014;7:621–626. doi: 10.1039/C3EE43322F. [DOI] [Google Scholar]
- 33.Zhao Z., Kang B., Xu J., Zhu C., Zhang X., Zhang X., Chen Y. N-doped carbon hollow spheres supported N-doped carbon nanotubes for efficient electromagnetic wave absorption. Carbon. 2023;209 doi: 10.1016/j.carbon.2023.04.001. [DOI] [Google Scholar]
- 34.Li S., Liu Y., Gong H., Wu K.-H., Ba H., Duong-Viet C., Jiang C., Pham-Huu C., Su D. N-Doped 3D Mesoporous Carbon/Carbon Nanotubes Monolithic Catalyst for H2S Selective Oxidation. ACS Appl. Nano Mater. 2019;2:3780–3792. doi: 10.1021/acsanm.9b00654. [DOI] [Google Scholar]
- 35.Fernandes D.M., Costa M., Pereira C., Bachiller-Baeza B., Rodríguez-Ramos I., Guerrero-Ruiz A., Freire C. Novel electrochemical sensor based on N-doped carbon nanotubes and Fe3O4 nanoparticles: simultaneous voltammetric determination of ascorbic acid, dopamine and uric acid. J. Colloid Interface Sci. 2014;432:207–213. doi: 10.1016/j.jcis.2014.06.050. [DOI] [PubMed] [Google Scholar]
- 36.Mao S., Wang C., Wang Y. The chemical nature of N doping on N doped carbon supported noble metal catalysts. J. Catal. 2019;375:456–465. doi: 10.1016/j.jcat.2019.06.039. [DOI] [Google Scholar]
- 37.Xie L., Ni J., Tang B., He G., Chen H. A self-assembled 2D/2D-type protonated carbon nitride-modified graphene oxide nanocomposite with improved photocatalytic activity. Appl. Surf. Sci. 2018;434:456–463. doi: 10.1016/j.apsusc.2017.10.193. [DOI] [Google Scholar]
- 38.Zhou Y., Zhang Y., Xue J., Wang R., Yin Z., Ding L., Wang H. Graphene oxide-modified g-C3N4 nanosheet membranes for efficient hydrogen purification. Chem. Eng. J. 2021;420 doi: 10.1016/j.cej.2021.129574. [DOI] [Google Scholar]
- 39.Nazir R., Fageria P., Basu M., Gangopadhyay S., Pande S. Decoration of Pd and Pt nanoparticles on a carbon nitride (C3N4) surface for nitro-compounds reduction and hydrogen evolution reaction. New J. Chem. 2017;41:9658–9667. doi: 10.1039/c7nj01221g. [DOI] [Google Scholar]
- 40.Choi Y.J., Kim H.-K., Lee S.-W., Kim Y.H., Youn H.-C., Roh K.C., Kim K.-B. Surfactant-free synthesis of a nanoperforated graphene/nitrogen-doped carbon nanotube composite for supercapacitors. J. Mater. Chem. A Mater. 2017;5:22607–22617. doi: 10.1039/c7ta06742a. [DOI] [Google Scholar]
- 41.Duan C., Tian Y., Wang X., Wu J., Liu B., Fu D., Zhang Y., Lv W., Hu L., Wang F., et al. Anchoring Mo single atoms on N-CNTs synchronizes hydrogenation/dehydrogenation property of Mg/MgH2. Nano Energy. 2023;113 doi: 10.1016/j.nanoen.2023.108536. [DOI] [Google Scholar]
- 42.Skudin V., Andreeva T., Myachina M., Gavrilova N. CVD-Synthesis of N-CNT Using Propane and Ammonia. Materials. 2022;15 doi: 10.3390/ma15062241. [DOI] [PMC free article] [PubMed] [Google Scholar]
- 43.Kočí K., Dang Van H., Edelmannová M., Reli M., Wu J.C. Photocatalytic reduction of CO2 using Pt/C3N4 photocatalyts. Appl. Surf. Sci. 2020;503 doi: 10.1016/j.apsusc.2019.144426. [DOI] [Google Scholar]
- 44.Liu J., Li W., Duan L., Li X., Ji L., Geng Z., Huang K., Lu L., Zhou L., Liu Z., et al. A Graphene-like Oxygenated Carbon Nitride Material for Improved Cycle-Life Lithium/Sulfur Batteries. Nano Lett. 2015;15:5137–5142. doi: 10.1021/acs.nanolett.5b01919. [DOI] [PubMed] [Google Scholar]
- 45.Karim-Nezhad G., Hasanzadeh M., Saghatforoush L., Shadjou N., Khalilzadeh B., Ershad S. Electro-oxidation of ascorbic acid catalyzed on cobalthydroxide-modified glassy carbon electrode. J. Serb. Chem. Soc. 2009;74:581–593. [Google Scholar]
- 46.Shastan Z.O., Ganesh H.V.S., Noroozifar M., Kerman K. Carbon ceramic microelectrodes modified with buckyballs for simultaneous determination of redox-active biomolecules. RSC Adv. 2018;8:5960–5966. doi: 10.1039/C7RA09603H. [DOI] [PMC free article] [PubMed] [Google Scholar]
- 47.Wei Y., Liu Y., Xu Z., Wang S., Chen B., Zhang D., Fang Y. Simultaneous Detection of Ascorbic Acid, Dopamine, and Uric Acid Using a Novel Electrochemical Sensor Based on Palladium Nanoparticles/Reduced Graphene Oxide Nanocomposite. Int. J. Anal. Chem. 2020;2020 doi: 10.1155/2020/8812443. [DOI] [PMC free article] [PubMed] [Google Scholar]
- 48.Teymourian H., Salimi A., Khezrian S. Fe3O4 magnetic nanoparticles/reduced graphene oxide nanosheets as a novel electrochemical and bioeletrochemical sensing platform. Biosens. Bioelectron. 2013;49:1–8. doi: 10.1016/j.bios.2013.04.034. [DOI] [PubMed] [Google Scholar]
- 49.Yang H., Zhao J., Qiu M., Sun P., Han D., Niu L., Cui G. Hierarchical bi-continuous Pt decorated nanoporous Au-Sn alloy on carbon fiber paper for ascorbic acid, dopamine and uric acid simultaneous sensing. Biosens. Bioelectron. 2019;124–125:191–198. doi: 10.1016/j.bios.2018.10.012. [DOI] [PubMed] [Google Scholar]
- 50.Vicentini F.C., Raymundo-Pereira P.A., Janegitz B.C., Machado S.A., Fatibello-Filho O. Nanostructured carbon black for simultaneous sensing in biological fluids. Sensor. Actuator. B Chem. 2016;227:610–618. doi: 10.1016/j.snb.2015.12.094. [DOI] [Google Scholar]
- 51.Yan J., Liu S., Zhang Z., He G., Zhou P., Liang H., Tian L., Zhou X., Jiang H. Simultaneous electrochemical detection of ascorbic acid, dopamine and uric acid based on graphene anchored with Pd–Pt nanoparticles. Colloids Surf. B Biointerfaces. 2013;111:392–397. doi: 10.1016/j.colsurfb.2013.06.030. [DOI] [PubMed] [Google Scholar]
- 52.Selvarajan S., Suganthi A., Rajarajan M. A facile approach to synthesis of mesoporous SnO2/chitosan nanocomposite modified electrode for simultaneous determination of ascorbic acid, dopamine and uric acid. Surface. Interfac. 2017;7:146–156. doi: 10.1016/j.surfin.2017.03.008. [DOI] [Google Scholar]
Associated Data
This section collects any data citations, data availability statements, or supplementary materials included in this article.
Supplementary Materials
Data Availability Statement
-
•
Data reported in this paper will be shared by the lead contact upon request.
-
•
This paper does not report original code.
-
•
Any additional information required to reanalyze the data reported in this paper is available from the lead contact upon request.