

Abstract
Rhodopsin is a G protein-coupled receptor (GPCR) present in the rod outer segment (ROS) of photoreceptor cells that initiates the phototransduction cascade required for scotopic vision. Due to the remarkable advancements in technological tools, the chemistry of rhodopsin has begun to unravel especially over the past few decades, but mostly at the ensemble scale. Atomic force microscopy (AFM) is a tool capable of providing critical information from a single-molecule point of view. In this regard, to bolster our understanding of rhodopsin at the nanoscale level, AFM-based imaging, force spectroscopy, and nano-indentation techniques were employed on ROS disc membranes containing rhodopsin, isolated from vertebrate species both in normal and diseased states. These AFM studies on samples from native retinal tissue have provided fundamental insights into the structure and function of rhodopsin under normal and dysfunctional states. We review here the findings from these AFM studies that provide important insights on the supramolecular organization of rhodopsin within the membrane and factors that contribute to this organization, the molecular interactions stabilizing the structure of the receptor and factors that can modify those interactions, and the mechanism underlying constitutive activity in the receptor that can cause disease.
Keywords: Rhodopsin, G protein-coupled receptor (GPCR), Atomic force microscopy (AFM), Constitutive activity, Phototransduction
Graphical Abstract:

1. Introduction
G proteins are heterotrimeric guanine nucleotide-binding regulatory proteins that function as molecular switches and transmit signals within cells.[1,2] G protein-coupled receptors (GPCR), also termed seven-transmembrane domain receptors or 7TM receptors, are the largest group of membrane receptor proteins and are responsible for a wide range of physiological processes through specific signaling pathways.[3–6] The overall structures of the membrane-spanning portions of GPCRs are similar and consist of 7-transmembrane α-helical segments. Usually, a ligand molecule upon binding or a photon absorbed by the receptor causes conformational changes in the GPCR structure, which results in the binding and activation of the G-protein.[7] Due to their abundance, accessibility, expression, and interactions leading to several pathways, GPCRs have emerged as attractive options for drug targets.[8–10] However, even today updates are required on our understanding of the structure, binding and signaling mechanism, physiological roles, and pharmacological properties of GPCRs to better target this family of proteins for therapeutic drugs.[11,12] The GPCR family can be divided into six classes (A to F), out of which only four classes are found in humans, accounting for ~800 GPCRs represented in the human genome.[3,13] The most abundant of these are Class A GPCRs (719 members, representing almost 90 % of all GPCRs), also known as ‘rhodopsin-like’ GPCRs.[10,13,14]
Under dark or low-light conditions, the eye uses rod cells and perceives objects as black and white or grey, known as scotopic vision.[15] Rhodopsin is the rod photoreceptor cell protein present in the rod outer segment (ROS) that initiates scotopic vision.[16] Historically, rhodopsin has been one of the most studied GPCRs and a great amount of knowledge has been acquired about GPCRs just by studying rhodopsin alone.[17–20] Each ROS consists of about 1,000 to 2,000 bilayered membranous disc-like structures that are stacked together and encased by a plasma membrane.[19] Rhodopsin, synthesized in the endoplasmic reticulum in the rod inner segment (RIS), is transported to the ROS and gets incorporated into the disc membranes.[21] Rhodopsin is the predominant protein species present in the discs (relative abundance > 90 %) and occupies almost half the area of a disc membrane, embedded in a sea of phospholipids and cholesterol. Activation of rhodopsin by light triggers a series of biochemical events, leading to the initiation of the phototransduction cascade.[16] The high concentration and abundance of rhodopsin in the discs have enabled the structural, biophysical, biochemical, and biomechanical characterization of the protein, making it the most methodically probed GPCR in its native form.[22] Almost 150 years since the discovery of rhodopsin, we now have a much better understanding of its structure and functions, and new advancements continue to be made. Significant progress was made in the latter half of the twentieth century, but the journey towards elucidating rhodopsin structure gathered a fast pace in the past two decades. The X-ray crystal structure of rhodopsin was first reported in 2000 and for a long time, it remained the only GPCR with a high-resolution crystal structure.[23] Hence, the structures and ligand interactions of several other GPCRs were predicted using the homology model based on rhodopsin.[24–26] The next landmark event was the discovery of the oligomeric structural organization of rhodopsin molecules in native disc membranes using atomic force microscopy (AFM), which revealed paracrystalline arrays of rhodopsin dimers.[27,28] This dimeric organization of rhodopsin refuted the longstanding notion of GPCRs functioning as monomers and has been used as a working model for other GPCRs as well.[29]
AFM is a sophisticated instrument that offers a multitude of applications such as imaging, folding-unfolding of proteins, probing ligand-receptor interactions, recognition imaging, stiffness measurements, monitoring adhesion and electrical properties, and more.[30–36] AFM is particularly useful for biological samples as the experiments can be performed in their native forms, in a relevant buffer or culture medium, without any chemical modification or tagging.[37] In light of the significant breakthroughs discussed earlier, the stage was set to explore the structural, mechanical, and functional aspects of rhodopsin to a greater depth by AFM, facilitated by an unparalleled range of applications. In this context, our lab has conducted a series of studies for over a decade to understand the chemistry of rhodopsin in greater details. The three main applications of AFM used for our studies were imaging,[38] force spectroscopy,[39] and nano-indentation.[40] AFM imaging has helped us to characterize the disc membranes, and quantify the rhodopsin content/density, giving us further insights into how rhodopsin achieves its supramolecular structure and factors that can modulate this organization.[38,41–46] We adopted single-molecule force spectroscopy (SMFS) and dynamic SMFS (DFS) techniques to quantify and localize molecular interactions that stabilize the structure of rhodopsin and direct its function as membrane proteins in normal (wild-type) and diseased states (constitutive activity).[39,47,48] Finally, we utilized the nanoindentation method to measure and map the changes in rhodopsin stiffness for normal and diseased states, and explored different models for constitutive activity based on the stiffness data.[40]
For all these studies, disc membranes were isolated from different animal models before being subjected to AFM in the dark to avoid photobleaching.[49] As mentioned before, rhodopsin has long been used as a prototype for other GPCRs and structural and functional information obtained from rhodopsin has revealed a great deal about other GPCRs even before the more recent advancements that have led to the discovery of crystal structure for those GPCRs. Hence, findings from our rhodopsin studies are beneficial not only to understanding vision-related processes but also to the broader family of GPCRs and relevant physiological processes they mediate.
2. Rhodopsin Chemistry: Structure, Organization, and Role in Phototransduction
Rhodopsin consists of the apoprotein opsin covalently bound to the chromophore 11-cis retinal via a protonated Schiff base linkage to a lysine residue (Lys296) in transmembrane helix 7 (TM7).[19,50] Under dark conditions, 11-cis retinal locks rhodopsin in the ‘inactive’ state. Upon photon capture, 11-cis retinal isomerizes to all-trans retinal and through a series of structural changes, rhodopsin achieves the activated state (metarhodopsin II or MII) (Figure 1).[19,50] The MII state then binds with transducin, a heterotrimeric G protein, and forms a light-activated rhodopsin-transducin complex, marking the initiation of the phototransduction cascade. Through a sequence of events, rhodopsin is eventually deactivated upon phosphorylation by rhodopsin kinase and binding to another protein, arrestin.[50] At this point, all-trans retinal gets released from rhodopsin, leaving the apo-protein opsin. Rhodopsin is regenerated when the apo-protein spontaneously binds with 11-cis retinal.
Figure 1.
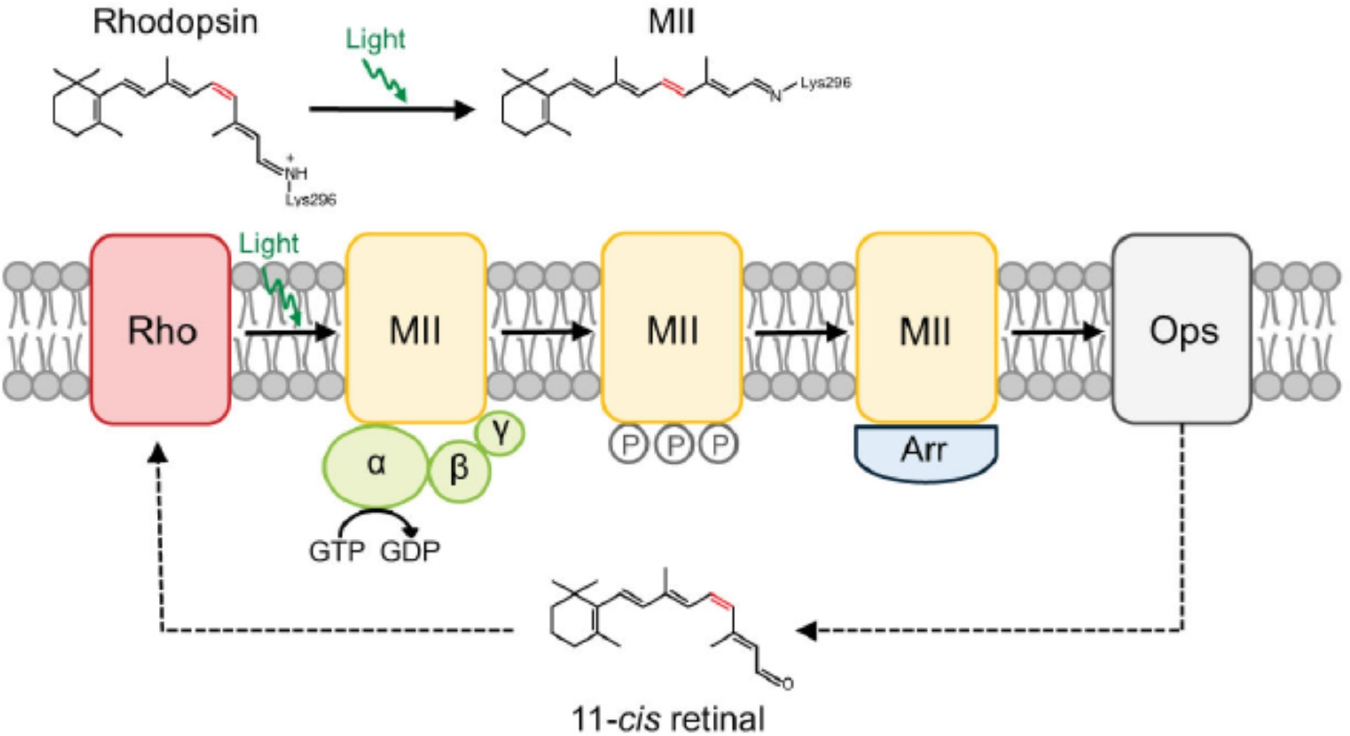
In the dark, rhodopsin is covalently bound to the chromophore 11-cis retinal and locked in the inactive state. Upon photon activation, 11-cis retinal isomerizes to all-trans retinal and forms the active MII state. MII binds with the heterotrimeric G protein transducin and activates it, resulting in the initiation of the phototransduction cascade. MII is inactivated via phosphorylation and decays to opsin by releasing all-trans-retinal from the chromophore-binding pocket. All-trans-retinal is converted back to 11-cis retinal through a series of enzymatic reactions referred to as the retinoid cycle. Opsin then binds with 11-cis retinal to regenerate rhodopsin and remains locked in the inactive state. Reproduced from ref. [50] Copyright (2014), with permission from Elsevier.
The structural organization of rhodopsin in the disc membrane and how it affects rhodopsin function have been debated for a long time.[51] The historical view supports that rhodopsin exists and functions as a monomer,[52–54] even though recent research findings, directly or indirectly, point more toward an oligomeric supramolecular organization.[38,55–57] The structural organization under non-native conditions was found to be ambiguous and inconclusive – some pointing toward a monomeric organization and others toward an oligomeric arrangement.[51] Extraction of rhodopsin from disc membranes or reconstituting rhodopsin back into a lipid bilayer involves chemical or biochemical processes (such as detergent extraction, chemical crosslinking, synthesis of artificial membranes, etc.) and always carries the risk of introducing artifacts or misinterpretation.[51] Hence, despite the complex nature of the studies and subsequent interpretation, it is preferable to assess the structure of rhodopsin organization in near-native conditions of the ROS disc membranes to obtain a credible picture representative of nature. With the advancements of several tools and new experimental techniques, we now have a better idea of the rhodopsin organization. Under near-native conditions, even though a few studies suggested the monomeric organization of rhodopsin in disc membranes, most of the studies point toward an oligomeric arrangement. How rhodopsin functions depends largely on its structural organizations, and hence, elucidating the structure of rhodopsin organization was critical to advancements in our understanding.[58,59]
3. Nanoscale Analysis of Rhodopsin Present in Native Disc Membranes
To ensure highly efficient signaling, highly concentrated rhodopsin in ROS disc membranes must assume an orderly organization instead of a randomly crowded environment.[57,60] In general, biological membranes are highly organized in nature and ROS disc membranes are no different. AFM revealed paracrystalline arrays of rhodopsin dimers in native mouse disc membranes.[27,28] Follow-up AFM studies have consistently shown small domain-like structures with nanoscale dimensions, which we later termed ‘nanodomains’.[38,40,41,43–46,55,56] These nanodomains were also shown to consist of rhodopsin dimers,[28] and were further characterized for the presence of rhodopsin by an AFM-immunolabeling study.[56] The functional aspects of the dimeric organization and nanodomains are still unclear and yet to be established.[57,61–63]
3.1. Quantitative Assessment of Rhodopsin Nanodomains
As we set out to understand the principles underlying the formation of rhodopsin nanodomains, we felt that a quantitative assessment of the disc membranes and rhodopsin content was critical. ROS disc membranes were prepared from the retina of a variety of vertebrates and imaged by AFM as illustrated in Figure 2. A detailed step-by-step protocol for preparing ROS disc membranes for AFM and AFM imaging and analysis procedures has been reported previously.[49] Briefly, ROS can be separated from the rest of the photoreceptor cell in isolated retina by mechanical agitation and purified biochemically on a gradient. Osmotic bursting of ROS releases discs, which can be resuspended in a physiological buffer like a Ringer’s buffer, adsorbed on a mica substrate and examined by AFM.
Figure 2.
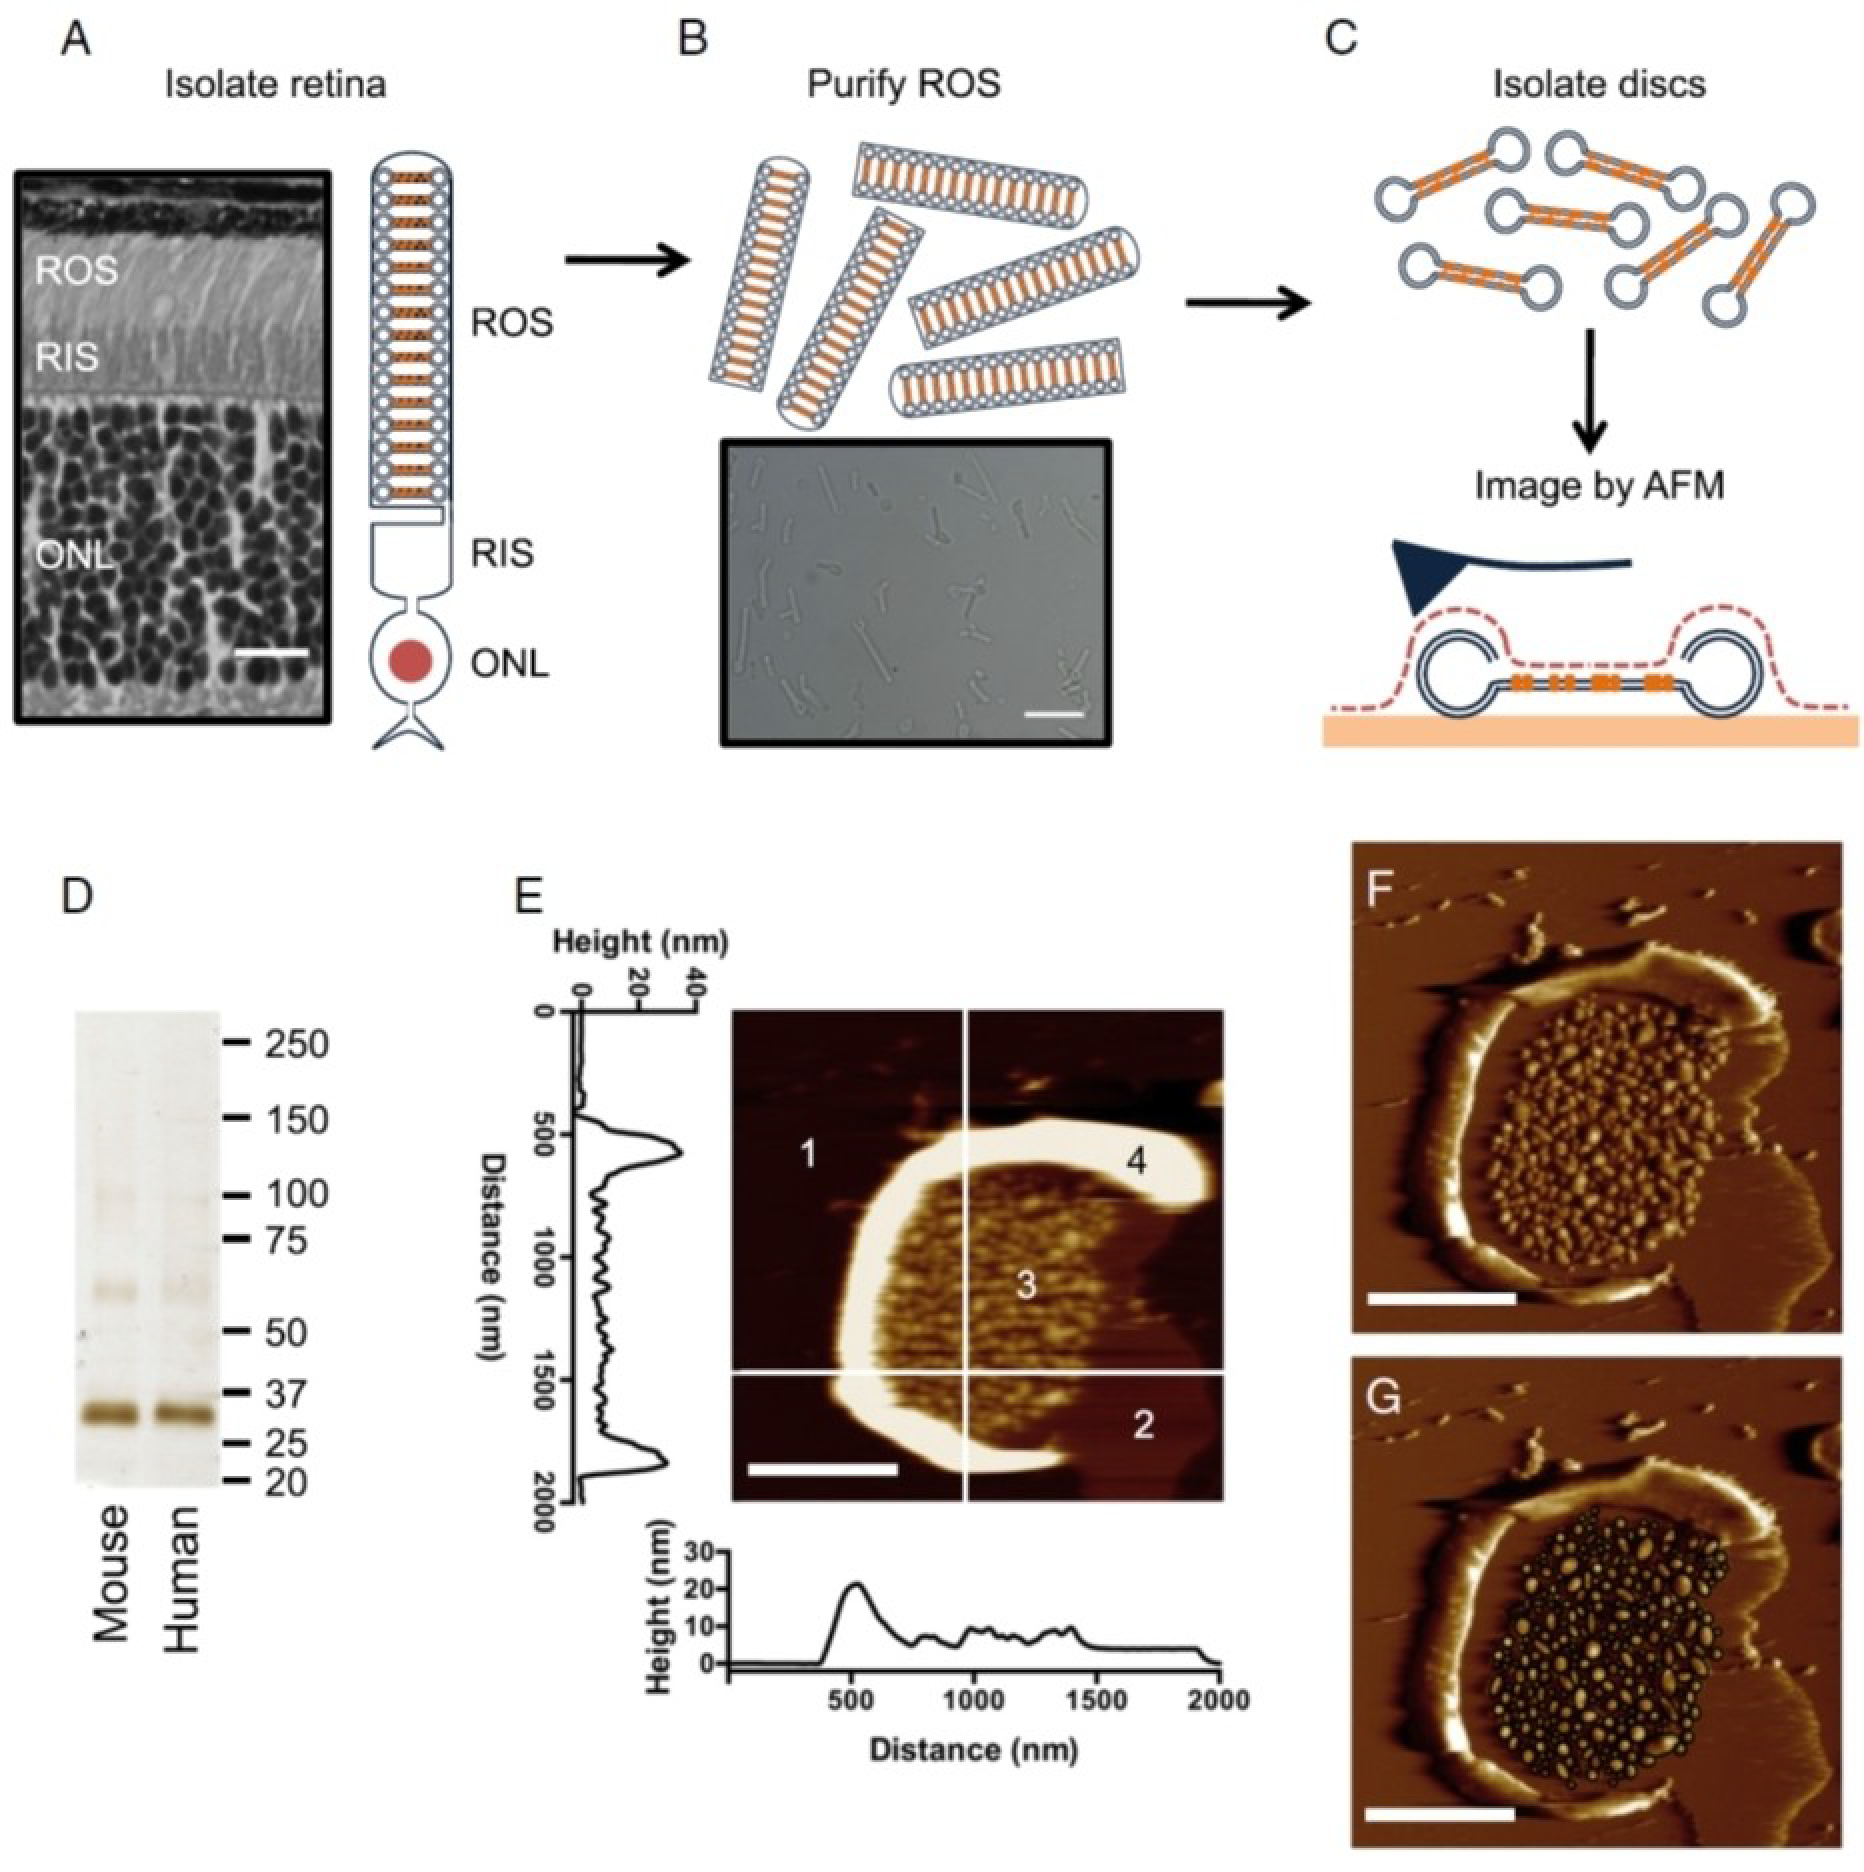
Isolation of ROS disc membranes and subsequent AFM imaging. (A) The rod outer segment (ROS), rod inner segment (RIS), and outer nuclear layer (ONL) are present in a histological section of a mouse retina and a cartoon of the rod photoreceptor cell. Scale bar, 15 μm. (B) Purified ROS as seen using a light micrograph. Scale bar, 15 μm. (C) ROS disc membranes are isolated and adsorbed onto mica for AFM imaging. In AFM imaging, a sharp probe is raster-scanned over the sample surface to generate topographical images. (D) SDS-PAGE on isolated disc membranes from mouse and human samples indicates that rhodopsin is the predominant protein present. The most prominent band corresponds to rhodopsin monomer and the faint bands above may represent rhodopsin dimer and higher-order oligomers. The sizes of protein standards are indicated in kDa. (E) AFM height image of a typical ROS disc membrane. Four different components are observed: 1, mica; 2, protein-free lipid bilayer; 3, rhodopsin nanodomains; and 4, rim region. The height profiles of the highlighted line scans can be seen. Scale bar, 500 nm. (F) AFM deflection image of the same ROS disc membrane. Scale bar, 500 nm. (G) The deflection image with nanodomains circled as black ellipses, whose diameters were measured to determine the surface area of the nanodomains. Reproduced from ref. [38] Copyright (2015), with permission from Elsevier.
In initial studies, we examined ROS disc membranes from human and murine retina. ROS disc membranes exhibited a flexible rim region and a lamellar region exhibiting nanoscale domains formed by oligomeric rhodopsin, which we termed rhodopsin nanodomains. Quantitative assessment of ROS disc membrane properties in these initial studies was conducted by making manual measurements using the atomic force microscope software. The size of the disc membrane measured corresponded to the width of intact ROS.[45] Each of the individual rhodopsin nanodomains was measured manually and the number of rhodopsin contained within each was estimated assuming each rhodopsin occupies 14 nm2 area within the membrane. The density of rhodopsin within the ROS disc membrane was estimated to be 17,486/μm2, which underestimated the density reported previously by other more indirect methods.[64]
Improvements were made in the analysis procedures by developing a semi-automated method to detect and measure rhodopsin nanodomains using SPIP software (Image Metrology A/S, Hørsholm, Denmark) (Figure 3).[46,49] Apart from being more convenient and time-saving, the semiautomated method also was better at detecting the shape of the nanodomains more accurately, resulting in more accurate estimates of the parameters tested. Even though the number of nanodomains remained effectively the same as the manual computation, their mean size and rhodopsin density were found to be higher, and the difference was statistically significant (Table 1).[46] The density of rhodopsin within the ROS disc membrane determined using the semi-automated method on the same data analyzed manually above now resulted in an estimate of 20,420/μm2, which was closer to the previously reported values.[64]
Figure 3.
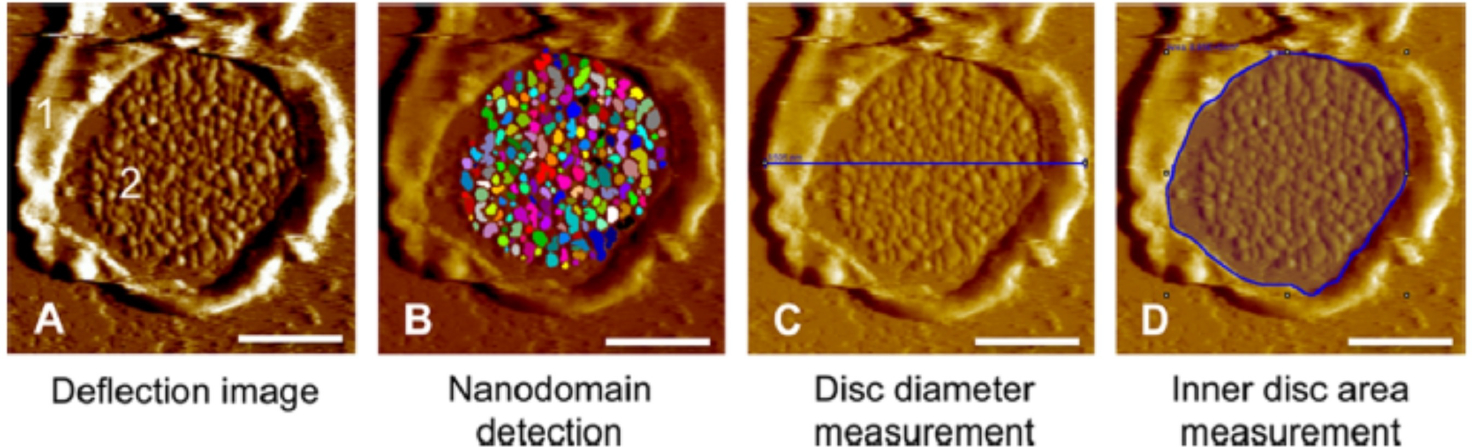
Outline of the quantitative assessment of ROS disc membrane images using the software SPIP. (A) AFM deflection image of a ROS disc membrane with the rim region (1) and lamellar region (2), attached to mica support. (B) The deflection image is quantitatively analyzed by the SPIP ‘Particle and Pore’ feature to detect rhodopsin nanodomains, (C) measurement of the disc diameter, and (D) measurement of the inner disc area. Scale bar, 500 nm. Reproduced from ref. [46] Copyright (2015), with permission from American Chemical Society (ACS).
Table 1.
Quantitative assessment of disc membrane properties based on the methods of analysis,[38,46] rhodopsin expression,[46] animal models,[38,44] and diseased states.[42]
| Source of disc membrane | Disc diameter (μm) | Mean nanodomain Size (μm2) | Number of nanodomain | Nanodomain density (μm2) | Number of rhodopsin | Rhodopsin density (μm2) | References |
|---|---|---|---|---|---|---|---|
|
| |||||||
| Wild-type, C57B1/6J (manual)a | 1.20±0.20 | 1,245±379 | 156±99 | 207±79 | 13,513±8,522 | 17,486±6,170 | Whited and Park (2015)[38] |
| Wild-type, C57B1/6J (semi-automated)a | 1.22±0.28 | l,412±403 | 148±93 | - | 14,688±10,006 | 20,420±7,792 | Rakshit and Park (2015)[46] |
| Wild-type, C57B1/6J (semi-auto-mated), tapping mode)a | 1.23±0.20 | 1,498±344 | 151±61 | - | 15,882±7,073 | 21,219±5,517 | Rakshit and Park (2015)[46] |
| Rho+/−a | 1.14±0.30 | 1,319±429 | 139±103 | 234±109 | 11,886±7,688 | 19,853±7,139 | Rakshit and Park (2015)[46] |
| Humana | 1.17±0.24 | 1,109±311 | 156±103 | - | 11,642±7,108 | 15,865±5,894 | Whited and Park (2015)[38] |
| Frogb | - | 1,042±295c | - | 203±78 | - | 21,008±6,381 | Rakshit et al (2015)[44] |
| P30 wild-type, 129/SV-E | - | - | 121±75 | 183±42 | 13,642±8,848 | 20,346±4,171 | Sechrest et al (2020)[42] |
| P120 wild-type, 129/SV-E | - | - | 118±83 | 191±64 | 13,857±11,177 | 20,828±4,171 | Sechrest et al (2020)[42] |
| P30 Prcd-KO regular | - | - | 106±82 | 182±44 | 12,089±10,465 | 20,494±4,658 | Sechrest et al (2020)[42] |
| P30 Prcd-KO irregular | - | - | 81±59 | 158±43 | 8,582±6,621 | 16,059±4,276 | Sechrest et al (2020)[42] |
| P120 Prcd-KO regular | - | - | 106±98 | 167±56 | 12,290±11,434 | 18,345±5,297 | Sechrest et al (2020)[42] |
| Pl20 Prcd-KO irregular | - | - | 67±38 | 113±47 | 8,454±5,417 | 13,497±3,991 | Sechrest et al (2020)[42] |
Unless mentioned specifically (i. e. P30 and P120), disc membranes were isolated from mouse models at 6 weeks of age for the data presented in Table 1.
Except for the human and frog samples, all the other disc membranes were isolated from mice models.
The nanodomain size for frog sample was expressed as median nanodomain size.
Different imaging modes were also tested to gauge the accuracy of our quantitative parameters derived from AFM images. Up until this point, contact mode, where the AFM probe is in constant contact with the sample, was used exclusively to image ROS disc membranes. Although forces are minimized to reduce damage to the sample, it was unclear whether or not derived parameters were affected by the lateral forces imparted by the AFM probe. Tapping mode, where the AFM probe only intermittently contacts the sample, is often used to image biological samples to minimize damage to the sample. While tapping mode is a more gentle imaging mode compared to contact mode, imaging speeds are much slower and that makes routine collection of large data sets for our analyses impractical. To ensure our quantitative parameters computed from images obtained by contact mode were not affected by lateral forces from the AFM probe, images obtained by both contact mode and tapping mode were obtained and analyzed. Tapping mode better preserved the flexible rim region compared to contact mode, but the lamellar region containing rhodopsin nanodomains was minimally perturbed by contact mode imaging. Quantitatively, images obtained by both methods provided equivalent values for all parameters tested.,[46] thereby supporting the use of contact mode moving forward and establishing it as the preferred mode of imaging due to its faster imaging speed compared to tapping mode.
3.2. Is a Nanodomain Organization the Native Organization of Rhodopsin in Disc Membranes?
An important question remaining to be answered was whether this nanodomain organization is indeed the native structure adopted by rhodopsin under physiological conditions. Several potential artifacts were considered to ensure we were observing the native organization of rhodopsin within the membrane. One potential source of artifacts was the adsorption of disc membranes on the mica substrate. ROS discs contain a double bilayer. Most of the ROS disc membranes imaged by AFM represent a somewhat disrupted disc displaying only a single bilayer. On occasions, intact double bilayered discs were observable by AFM imaging and these clearly showed the distinct presence of nanodomains even for the top layer that was not in contact with mica (Figure 4).[44] This ruled out the possibility of nanodomains being artifacts as a result of the attachment of disc membranes to the mica surface. Until this point in time, rhodopsin nanodomains were observed in disc membranes isolated from warm-blooded animals such as mouse, human or bovine models.[38,46,56] Preparation of the disc membrane samples from these mammalian species require temperatures below body temperature where lipid phase separation is possible.[65] To rule out the possibility of lipid phase separation as the cause of rhodopsin nanodomain formation, we isolated the disc membranes from Xenopus laevis, the cold-blooded frog where phase separation at low temperatures does not occur.[66,67] In this case, the phase separation of lipids could easily be ruled out even though samples were being prepared at low temperatures.[68] AFM imaging revealed that the disc membranes of Xenopus laevis also consisted of nanodomains formed of rhodopsins, which were similar to those observed for the mammalian species (Table 1).[44] The presence of rhodopsin nanodomains in both mammalian and amphibian ROS disc membranes suggested that nanodomains are native organizations under physiological conditions across all vertebrate species. Later cryo-electron tomographic studies of sectioned ROS also indicated the presence of nanodomain organizations under physiological conditions.[57,69]
Figure 4.
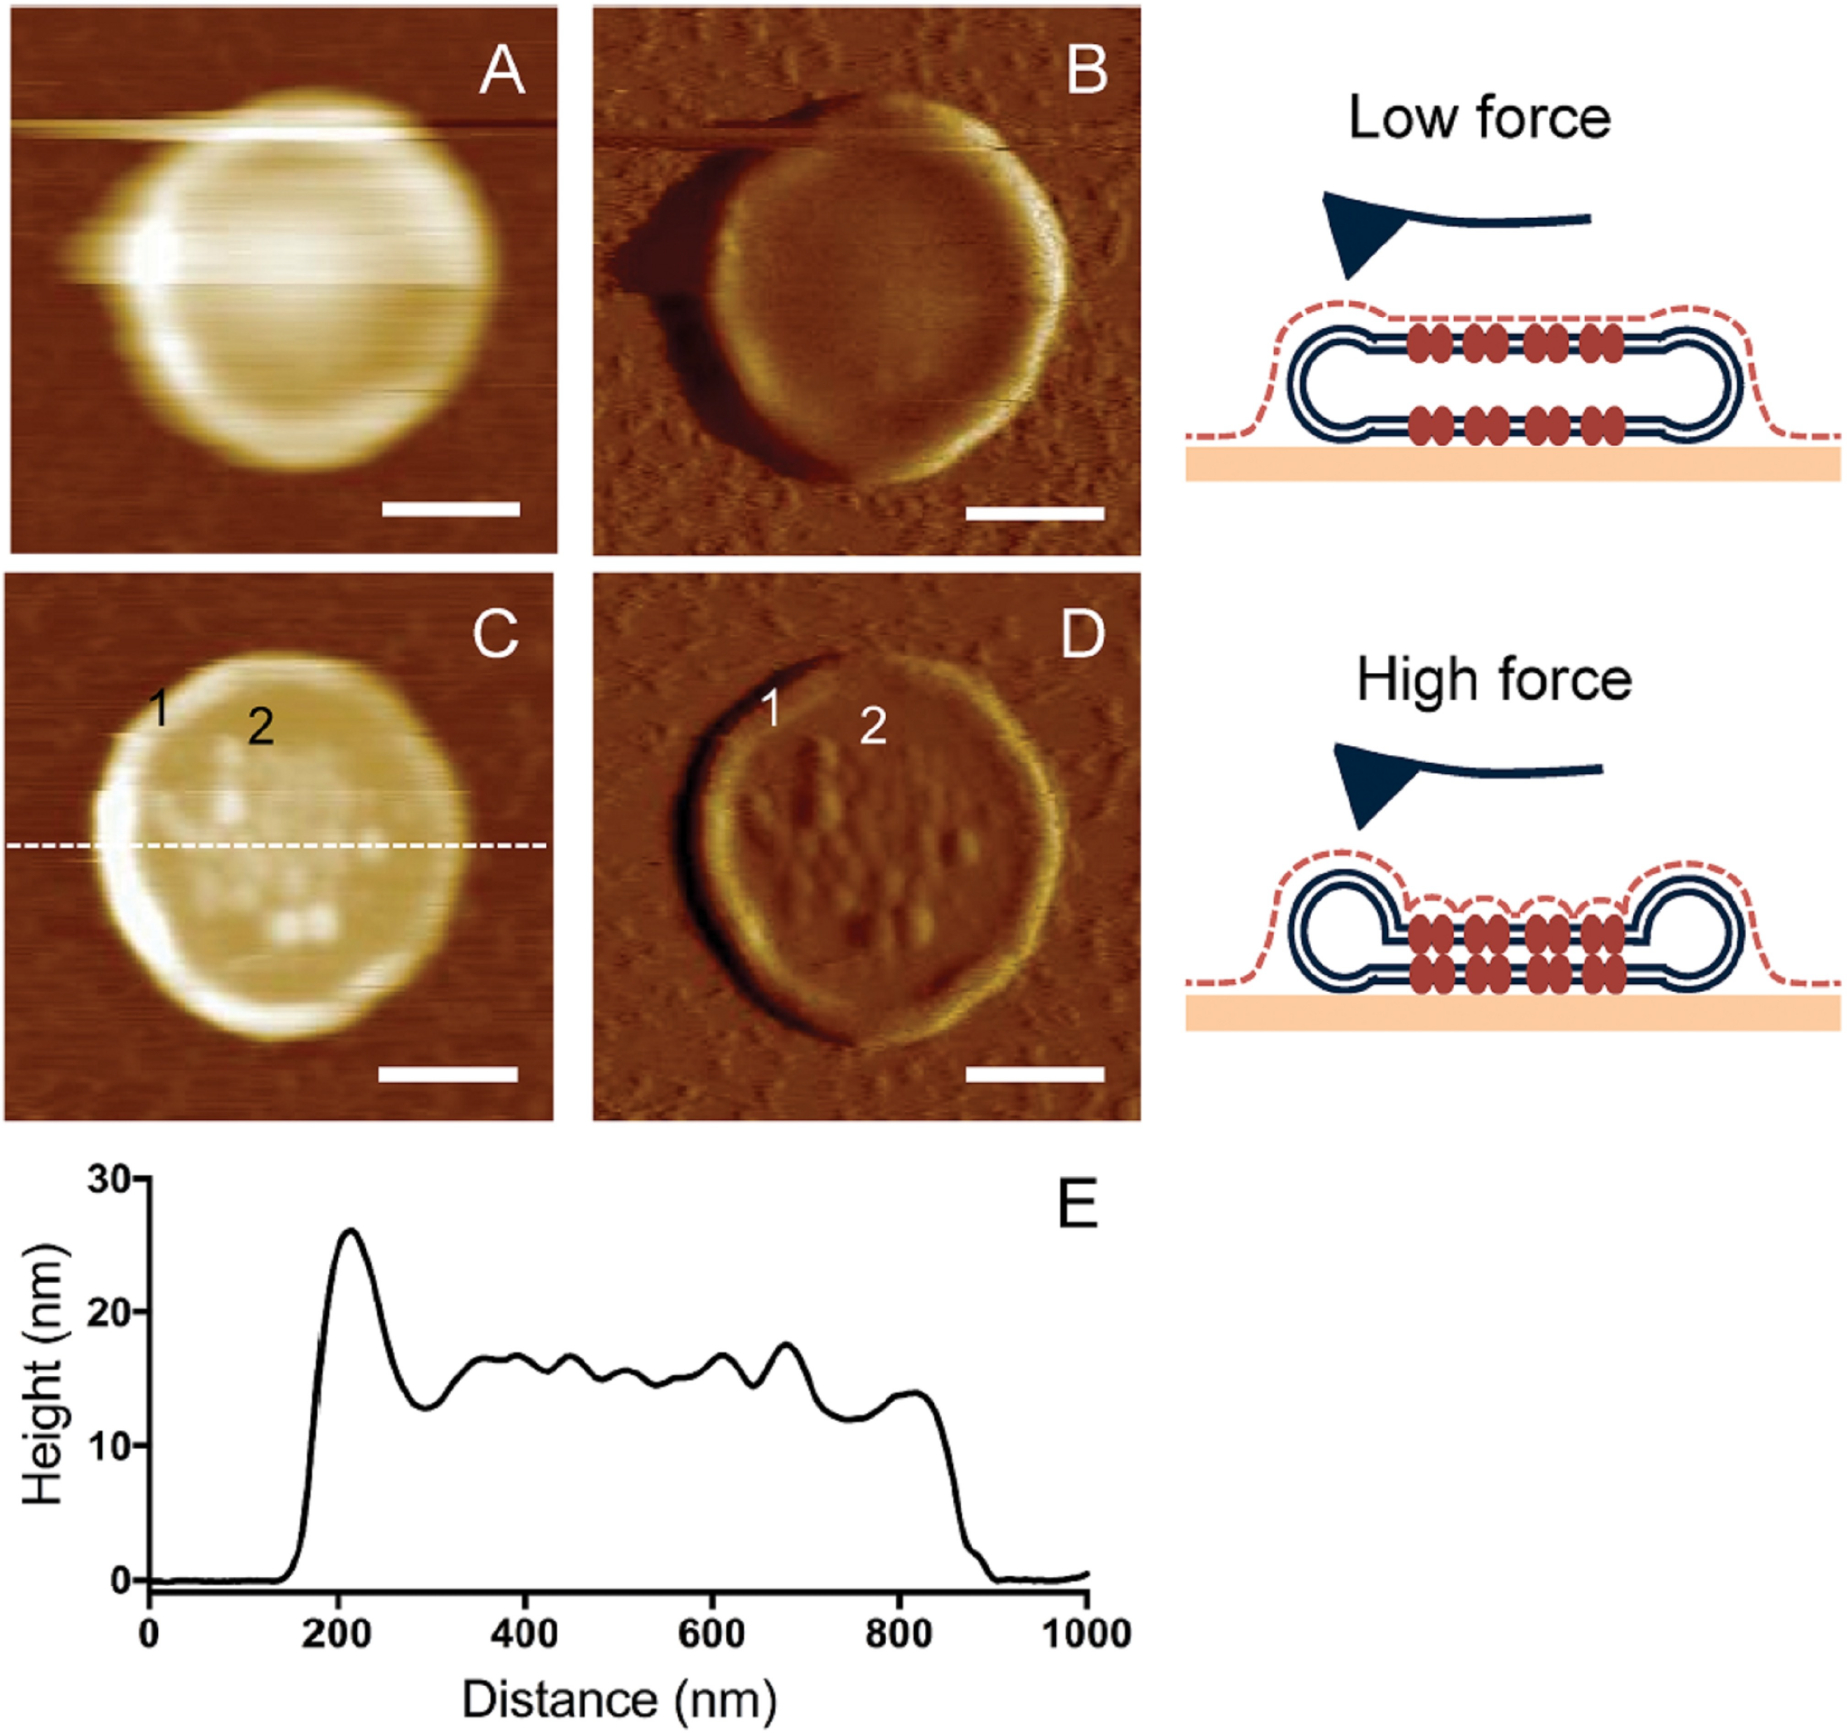
(A) Height image of an intact murine ROS disc obtained by contact mode AFM applying low force. (B) Deflection image corresponding to the image (A). (C) Height image of an intact murine ROS disc obtained by contact mode AFM applying higher force. (D) Deflection image corresponding to the image (C). The rim region (1) and nanodomains in the lamellar region (2) are distinctly visible. Scale bar, 250 nm. (E) A height profile matching that of an intact disc is shown for the cross-section highlighted by a dotted line in panel C. Reproduced from ref. [44] Copyright (2015), with permission from Public Library of Science (PLoS).
3.3. Optimal Rhodopsin Density and Phototransduction
An average rhodopsin density of ~20,000 rhodopsin/μm2 within ROS disc membranes has been observed in our AFM studies across species examined including two different strains of wild-type mice (C57Bl/6 J and 129/SV–E), Xenopus laevis, and human.[38,42,44,46] An optimal rhodopsin density within ROS disc membranes for optimal function has previously been proposed,[70] and evidence outlined below suggest that the ~20,000 rhodopsin/μm2 may represent this optimal density for photoreceptor cell function. Discs in a ROS can be heterogenous with variable numbers of rhodopsin packed into each, which may result from a difference in disc synthesis rate.[71] AFM has shown that the size of discs is correlated with the number of rhodopsin packed into it. But interestingly, no correlation exists between the size of discs and the density of rhodopsin within the membrane.[38,46] Together, these relationships point to a possible mechanism where the ROS modulates its size to maintain an optimal rhodopsin density to facilitate efficient signaling. This hypothesis was tested in heterozygous rhodopsin knockout (Rho+/−) mice,[46] where mice only express half the amount of rhodopsin normally expressed. In accord with our hypothesis, Rho+/− mice adapted to reduced rhodopsin expression by reducing the size of the ROS discs to maintain a rhodopsin density of ~20,000/μm2. Our AFM studies suggest that the maintenance of an average density range of ~20,000/μm2 might be critical for signaling by maintaining the rod’s high sensitivity to light. The density of rhodopsin in disc membranes is much higher than any other GPCR,[72,73] and has the potential to have adverse effects as well. As signaling occurs through a diffusion-mediated process, an extremely crowded environment can have an unfavourable effect on it, unless it has an ordered orientation.[74–76] This order is presumably achieved via the oligomeric organization of rhodopsin dimers arranged in systematic rows, as discussed earlier.[27,28]
4. Adaptations in ROS Disc Membranes
The development of the methodology for the quantification of rhodopsin content and disc membrane structure discussed in the previous section along with observations that there are mechanisms in place allowing for adaptations to maintain an optimal rhodopsin density under normal conditions, paved the way for more in-depth studies to better understand these adaptive mechanisms. We investigated possible inputs required for those adaptations, which included changes in internal conditions (such as phospholipid composition or point mutations in rhodopsin causing diseased states) or external lighting conditions. AFM provided a direct visual path to assess rhodopsin organization and its packing density in disc membranes under different circumstances, leading us to better understand different adaptations exhibited by rod photoreceptor cells.
4.1. Adaptations to the Lighting Environment
To function efficiently, photoreceptor cells adapt to short-term dark and light changes and several studies have been conducted to gain molecular insight.[77–79] Contrastingly, molecular insight into the adaptation of photoreceptor cells in response to long-term light and dark environmental changes was less explored and poorly understood. The long-term adaptation to maintain an optimally constant photon absorption in the retina by the photoreceptor cells is known as photostasis, and was typically thought to occur through changes in ROS length or rhodopsin expression.[80,81] The concept of photostasis has been refuted as changes in ROS length or rhodopsin expression were not evident in several cases.[82] We wanted to test whether photostasis also occurs at the level of ROS discs and to determine if the previously observed adaptations preserving an optimal rhodopsin density under normal lighting conditions were dependent on the environmental lighting conditions and if we could modulate the density by changing the lighting environment. C57Bl/6 J mice were housed under constant light conditions (normal room lighting in animal facility) or constant dark conditions for 10 days to test the effect of environmental lighting on the packing of rhodopsin in ROS disc membranes. AFM revealed that the number and density of rhodopsin, packaged into ROS discs, changed, decreasing under constant light condition or increasing under constant dark condition (Figure 5).[45] About 80 % more rhodopsin was incorporated into each ROS disc in dark reared mice compared to light reared mice, and was accompanied by changes in the size of the discs. This change in rhodopsin incorporation was not due to changes in the expression of the receptor but rather may be related to changes in the rate of ROS disc synthesis.[45,71] The change in rhodopsin density observed in ROS disc membranes had functional consequences as electroretinography (ERG) showed improvements in the scotopic response when rhodopsin density is increased.[45] These studies support the notion of photostasis, where rhodopsin density decreases when light is abundant to reduce the probability of photon capture and rhodopsin density increases when light is scarce to increase the probability of photon capture. In addition, the rhodopsin density of ~20,000/μm2 under normal lighting conditions can be increased further to improve visual function.
Figure 5.
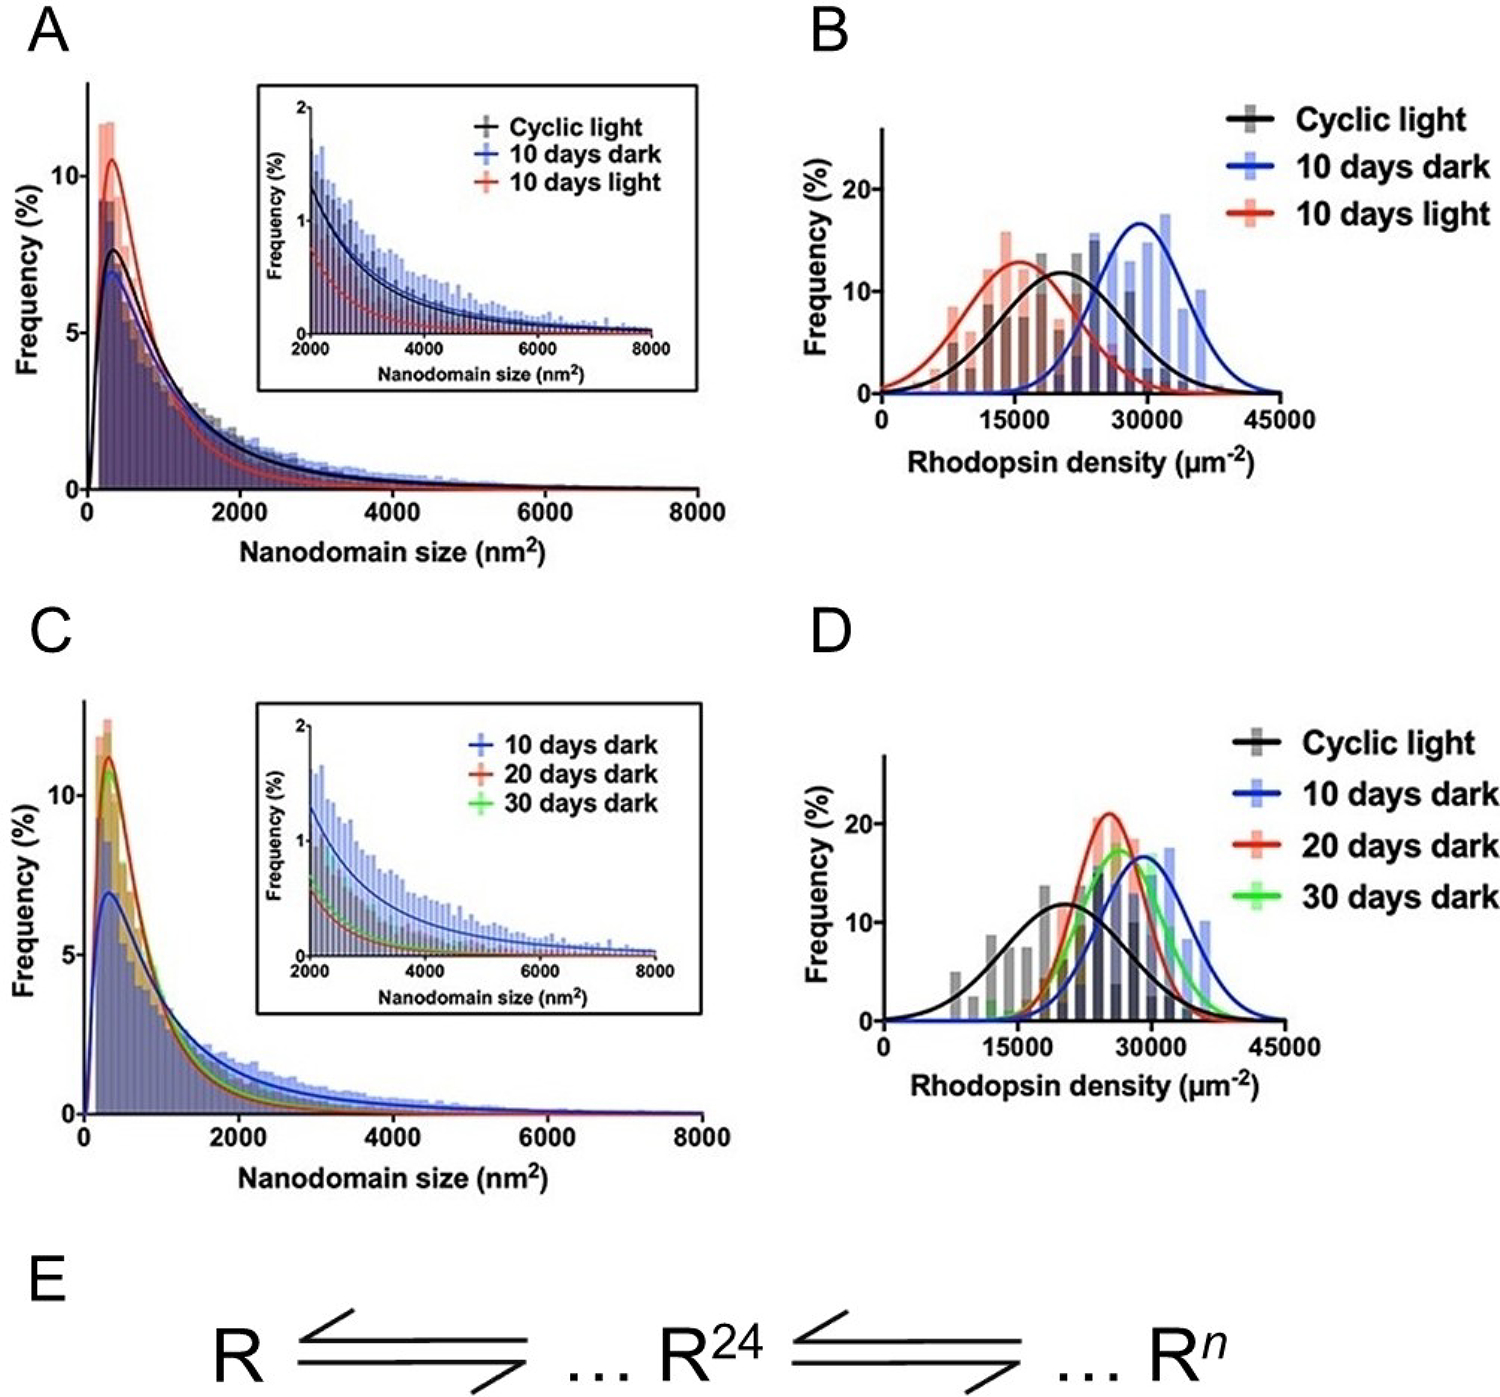
Adaptations in terms of rhodopsin density and nanodomain size in response to different lighting environments have been shown. A) Histograms generated for nanodomain size from all the disc membranes isolated from wild-type mice kept under cyclic, 10 days dark, and 10 days light conditions, B) Variation of rhodopsin density in disc membranes for wild-type mice kept under cyclic, 10 days dark, and 10 days light conditions, C) Histograms generated for nanodomain size from all the disc membranes isolated from wild-type mice kept under 10, 20, and 30 days dark conditions, D) Variation of rhodopsin density in disc membranes for wild-type mice kept under 10, 20, and 30 days dark conditions. E) The size distribution data points towards the presence of a 24-mer as the predominant oligomeric species of rhodopsin in disc membranes. The variances in the nanodomain sizes illustrated in panels A and C originated due to a shift in equilibrium between a 24-mer and larger sized oligomers. Adapted from ref. [45] Copyright (2017), with permission from Elsevier.
In addition to changes in rhodopsin density and number, changes in the size of nanodomains were also observed under different lighting conditions, which provided insight into possible mechanisms underlying the formation of rhodopsin nanodomains. The average sizes of nanodomains were found to be different depending on the light rearing condition. A closer look at the distribution plot of nanodomain sizes revealed that the predominant nanodomain size was the same regardless of changes in average size (Figure 5A). The predominant nanodomain size corresponded to an oligomeric size of 24 rhodopsin molecules (24-mer). The difference in average nanodomain size was a result of changes in relative populations of the smaller (200–2,000 nm2) and larger nanodomains (> 2,000 nm2). Under constant light conditions (10 days) where rhodopsin density is decreased, there were more nanodomains with smaller sizes, and under constant dark conditions (10 days) where rhodopsin density was increased, there were more nanodomains with larger sizes. Previous in vitro studies from our group using FRET suggested a mechanism of rhodopsin oligomerization that occurred via chemical equilibria scheme (Figure 5-E).[83] Our AFM studies are consistent with this scheme, where under conditions that increase rhodopsin density, the equilibrium is shifted in favor of larger rhodopsin oligomers or nanodomains and vice versa when rhodopsin density is decreased. Thus, rhodopsin oligomerization and nanodomain formation proceeds via a chemical equilibrium and the complement of different-sized nanodomains is dependent on the concentration of receptor in the membrane and the equilibrium constants that define each equilibrium.
Since full renewal of a ROS requires 10 days,[84] it was unclear whether adaptations occurring after 10 days in constant darkness represented a steady state. To check if further changes occurred beyond the 10 day period, mice were housed in the dark for 20 and 30 days, corresponding to 2 or 3 renewal cycles of ROS.[45] Disc membrane properties for mice kept under 20 and 30 days were largely the same, but they were different from those observed in 10 days dark adapted mice (Table 2). Thus, a steady state is only achieved after complete renewal of the ROS. Rhodopsin density in disc membranes for the prolonged dark condition (20 and 30 days) was higher than in wild-type mice under cyclic light but lower than that for 10 days dark condition (Figure 5-D). Interestingly, the average size of the nanodomains for the prolonged dark adapted mice was smaller than those from both cyclic light and 10 days dark conditions (Table 2). This decrease in average nanodomain size was due to the presence of a greater proportion of smaller nanodomains (200–2,000 nm2) compared to larger nanodomains (> 2,000 nm2) (Figure 5-C). Thus, despite higher rhodopsin density observed for prolonged dark conditions compared to that observed for cyclic light conditions, the equilibrium seems to be shifted towards smaller oligomers. In contrast to the situation between 10 days constant light and 10 days constant dark conditions, a change in equilibrium constant and not rhodopsin concentration appears to be the major factor determining the complement of oligomeric forms. It is unclear at the moment what is the underlying cause of the change to the equilibrium constant.
Table 2.
Quantitative assessment of disc membrane properties due to adaptations in response to lighting conditions,[45] DHA-modulation,[43] and diseased states.[41]
| Source of disc membrane | Disc diameter (μm) | Nanodomain Size (nm2) | Number of nanodomain | Nanodomain density (/μm2) | Number of rhodopsin | Rhodopsin density (/μm2) | References |
|---|---|---|---|---|---|---|---|
|
| |||||||
| Wild-type (cyclic) | 1.23±0.31 | 1,360±389 | 154±98 | 215±67 | 14,774±10,200 | 20,053±6,188 | Rakshit and Park (2015)[46] |
| Wild-type (10 days light) | 1.17±0.35 | 1,125±391 | 130±111 | 222±96 | 9,785±7,773 | 16,396±6,002 | Rakshit et al (2017)[45] |
| Wild-type (10 days dark) | 1.44±0.33 | 1,755±336 | 213±99 | 240±51 | 26,607±13,177 | 29,139±4,301 | Rakshit et al (2017)[45] |
| Wild-type (20 days dark)a | 1.28±0.32 | 1,079±232 | 242±129 | 336±76 | 18,611±11,088 | 24,920±3,608 | Rakshit et al (2017)[45] |
| Wild-type (30 days dark)a | 1.22±0.36 | l,059±206 | 215±155 | 351±85 | 16,194±12,101 | 25,743±4,690 | Rakshit et al (2017)[45] |
| Gnat−/− (cyclic) | 1.34±0.45 | 1,332±292 | 220±141 | 308±74 | 20,968±14,327 | 28,254±5,316 | Rakshit et al (2017)[45] |
| Gnat−/− (10 days dark) | 1.31±0.29 | 1,348±322 | 218±113 | 316±80 | 20,795±11,322 | 29,027±4,273 | Rakshit et al (2017)[45] |
| Gnat−/− (10 days light) | 1.30±0.31 | l,303±234 | 237±135 | 324±78 | 22,319±13,135 | 29,518±5,618 | Rakshit et al (2017)[45] |
| Wild-type (dark-reared)b | 1.38±0.48 | 1,377±369 | 209±155 | 305±91 | 21,384±18,019 | 28,238±5,007 | Rakshit et al (2017)[45] |
| DHA-deficient (cyclic) | 1.30±0.39 | 1,331±319 | 212±150 | 313±80 | 19,619±14,205 | 28,259±4,416 | Senapati et al (2018)[43] |
| DHA-adequate (cyclic) | 1.25±0.38 | 1,274±293 | 154±99 | 245±89 | 13,888±9,439 | 21,195±6,417 | Senapati et al (2018)[43] |
| DHA-replenished (cyclic) | 1.30±0.36 | l,306±386 | 163±110 | 226±73 | 14,892±10,201 | 19,661±4,558 | Senapati et al (2018)[43] |
| Rho-G90D +/+ (cyclic) | 1.31±0.38 | 1,372±367 | 163±152 | 229±94 | 15,503±14,483 | 21,067±6,656 | Senapati and Park (2020)[41] |
| Rho-G90D+/− (cyclic) | 1.35±0.35 | l,307±252 | 164±103 | 238±75 | 15,143±9,644 | 21,202±4,849 | Senapati and Park (2020)[41] |
| Rp65−/− (cyclic) | 1.33±0.40 | l,304±293 | 165±128 | 236±84 | 15,307±13,500 | 20,989±6,696 | Senapati and Park (2020)[41] |
| Rho-G90D+/+ (10 days dark) | 1.28±0.39 | 1,326±326 | 147±102 | 226±62 | 13,560±9,625 | 20,825±5,266 | Senapati and Park (2020)[41] |
| Fpe65−/− (10 days dark) | 1.27±0.37 | 1,241±196 | 159±124 | 241±84 | 14,006±11,105 | 20,784±6,172 | Senapati and Park (2020)[41] |
| Grm6−/− (cyclic) | 1.34±0.32 | 1,751±409 | 129±67 | 208±56 | 16,090±9,515 | 24,844±4,271 | Senapati and Park (2020)[41] |
| Grm6−/−/Gnat−/− (cyclic) | 1.35±0.39 | 1,286±242 | 214±137 | 305±80 | 19,336±13,586 | 27,001±4,819 | Senapati and Park (2020)[41] |
| Grm6−/− (10 days dark) | 1.37±0.38 | 1,338±341 | 197±156 | 299±73 | 20,140±20,338 | 27,561±5,649 | Senapati and Park (2020)[41] |
Except for wild-type mice under 20-days and 30-days dark conditions, all other mice were sacrificed at 6-weeks of age and disc membranes were isolated. Wild-type mice under 20-days and 30- days dark conditions were sacrificed at 7-weeks and 8-weeks of age, respectively.
Only dark-reared mice were born and raised under complete dark condition since birth. All other mice species were raised under cyclic light condition before being transferred to the respective experimental conditions.
4.2. Signal Required for Adaptations
Once the adaptation taking place in rod photoreceptor cells was evident, one question still remaining to be answered is what is the mechanism behind this modulation – rhodopsin activation or the subsequent phototransduction cascade or downstream signaling to bipolar cells? To differentiate between the first two, transducin knockout mice (Gnat−/−) were probed.[45] In absence of the α-subunit of transducin, phototransduction is eliminated in these mice after the rhodopsin activation step. Unlike wild-type mice, no adaptation was observed in Gnat−/− mice under different lighting conditions, implying that phototransduction is critical for these adaptations to take place (Table 2). Surprisingly, some parameters such as nanodomain density or rhodopsin numbers were different from 10 days dark adapted wild-type mice, where phototransduction was also absent. As no phototransduction took place for the Gnat−/− mice since birth, whereas, the prolonged dark-adapted wild-type mice were under cyclic light conditions for 4 weeks after birth before being moved to the dark condition, there could be a difference between the adaptations observed. AFM analysis of the disc membranes of dark-reared wild-type mice (born and reared under dark conditions) showed no difference with the Gnat−/− mice, indicating that the lighting environment early on can impact adaptations later on.[45]
The signal from the photoreceptor cell is passed on to the rod bipolar cell through the metabotropic glutamate receptor 6 (mGluR6) present in the postsynaptic terminal of the rod bipolar cell.[85,86] While it was clear that impaired phototransduction was invoking an adaptive mechanism by introducing a higher rhodopsin content and density in the disc membranes, whether or not these adaptations originated due to downstream events such as bipolar cell signaling still needed to be explored. To address this, Grm6−/− (mGluR6 knockout) mice were examined where signaling from photoreceptor cells to bipolar cells was eliminated (Figure 6).[41] Rod bipolar cell dysfunction resulted in adaptations that increased the mean nanodomain size, but the number and density of nanodomains remained unaffected - similar to the changes observed in young wild-type mice that are 4 weeks of age or younger.[46] Additionally, heterozygous rhodopsin knockout mice exhibit adaptations only after 4 weeks of age.[46] Thus, signaling to bipolar cells appears to influence the processes occurring before 4 weeks of age.
Figure 6.
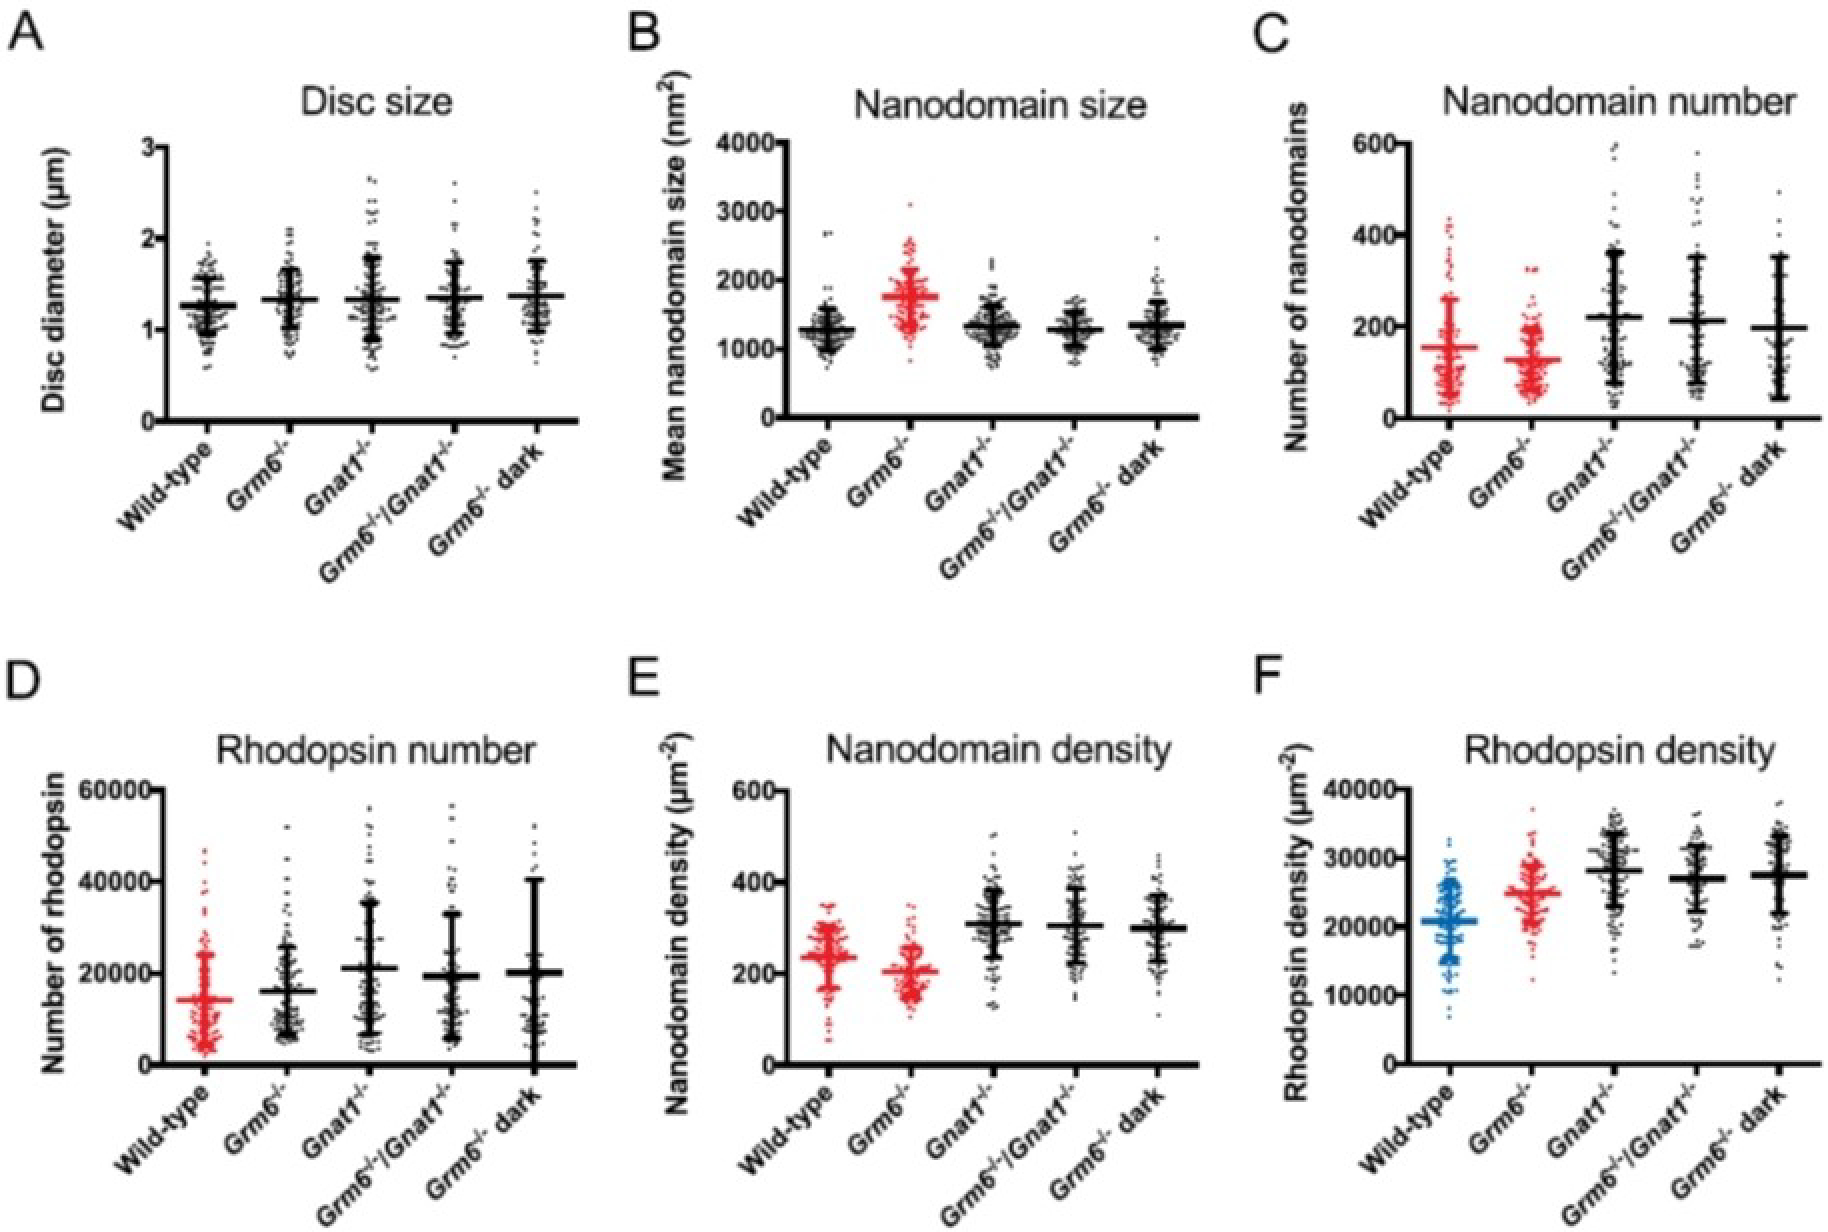
ROS disc properties for wild-type, Grm6−/−, Gnat−/−, and Grm6−/−/Gnat−/− mice housed under cyclic light conditions and for Grm6−/− mice housed under prolonged darkness (10 days dark). Mean values with individual data points and the standard deviation are presented. The same coloring of the plots indicates that the differences among those data are not statistically significant, whereas the different coloring indicates significant statistical differences among those data (as determined by one-way ANOVA and Tukey’s post-hoc test analysis). The p-values obtained from one-way ANOVA for data in each panel are as follows: A, 0.3448; B, < 0.0001; C, < 0.0001; D, 0.0022; E, < 0.0001; F, < 0.0001. Reproduced from ref. [41] Copyright (2020), with permission from Elsevier.
Adaptations in Grm6−/−/Gnat−/− double knockout mice, where both phototransduction and bipolar cell signaling were eliminated, were the same as those in Gnat−/− mice where only phototransduction was eliminated. This indicated that the adaptations in response to changes in lighting environment generally received input from the phototransduction signal. Adaptations in Grm6−/− mice born and reared in cyclic lighting and then housed for 10 days in the dark were similar to that in Gnat−/− mice rather than wild-type mice exposed to the same conditions.[41] So, it appeared that signaling to bipolar cells was involved in the adaptations occurring during early rearing of young mice and that phototransduction alone influenced the adaptations observed in more mature mice.
4.3. Adaptation to Change in Docosahexaenoic Acid (DHA) in Diet
We wanted to examine factors other than receptor concentration that may alter the equilibria underlying rhodopsin oligomerization and nanodomain formation. One of the factors examined was the change in lipid composition in ROS disc membranes. Docosahexaenoic acid (DHA), an essential ω-3 polyunsaturated fatty acid, is highly abundant in the ROS disc membranes of the photoreceptor cells in the retina, which contains more DHA than any other living cell in the body.[87,88] As DHA cannot be synthesized in the body, it must be sourced through diet. Dietary DHA deficiency has resulted in vision-related problems in several animal species including humans, mice, rats, guinea pigs, and monkeys, yet the mechanism leading to the defect was still not clear.[89–93] To directly probe whether the rhodopsin structural organization is altered due to DHA levels in the disc membranes, AFM imaging technique was deployed on samples from mice fed DHA-sufficient and DHA-deficient diets.[43]
The size of the disc membranes and nanodomains for control, DHA-adequate, and DHA-deficient mice showed little to no differences. Similarly sized nanodomains indicated that DHA played no role in the oligomerization process and therefore did not alter the chemical equilibria underlying nanodomain formation. However, the rhodopsin content and packing were significantly different for the DHA-deficient mice.[43] Both the number and density of nanodomains and rhodopsin were higher in the DHA-deficient mice compared to the control or the DHA-adequate mice (Figure 7, Table 2). Photoreceptor cell function was significantly inhibited in DHA-deficient mice as assessed by ERG. Since DHA did not seem to directly impact nanodomain formation by altering the equilibria, we considered whether inhibition of function caused the observed changes. A direct comparison with the previously discussed transducin knockout mice (Gnat−/−) was done.[45] Similar properties of nanodomains (size and number) and rhodopsin packing between the DHA-deficient and Gnat−/− mice indicated that there exists a similar reactive adaptive mechanism to nullify the impaired signaling process by enhancing the rhodopsin content and density in individual disc membranes in spite of no change in total rhodopsin content. The effects of dietary DHA-deficiency on photoreceptor cells were found to be reversible in nature as feeding the DHA-deficient mice with DHA-adequate diet for 4 weeks (DHA-replenished in Table 2) improved the DHA level, optimized the rhodopsin content and packing back to normalcy, and corrected the visual deficit (Figure 7).
Figure 7.
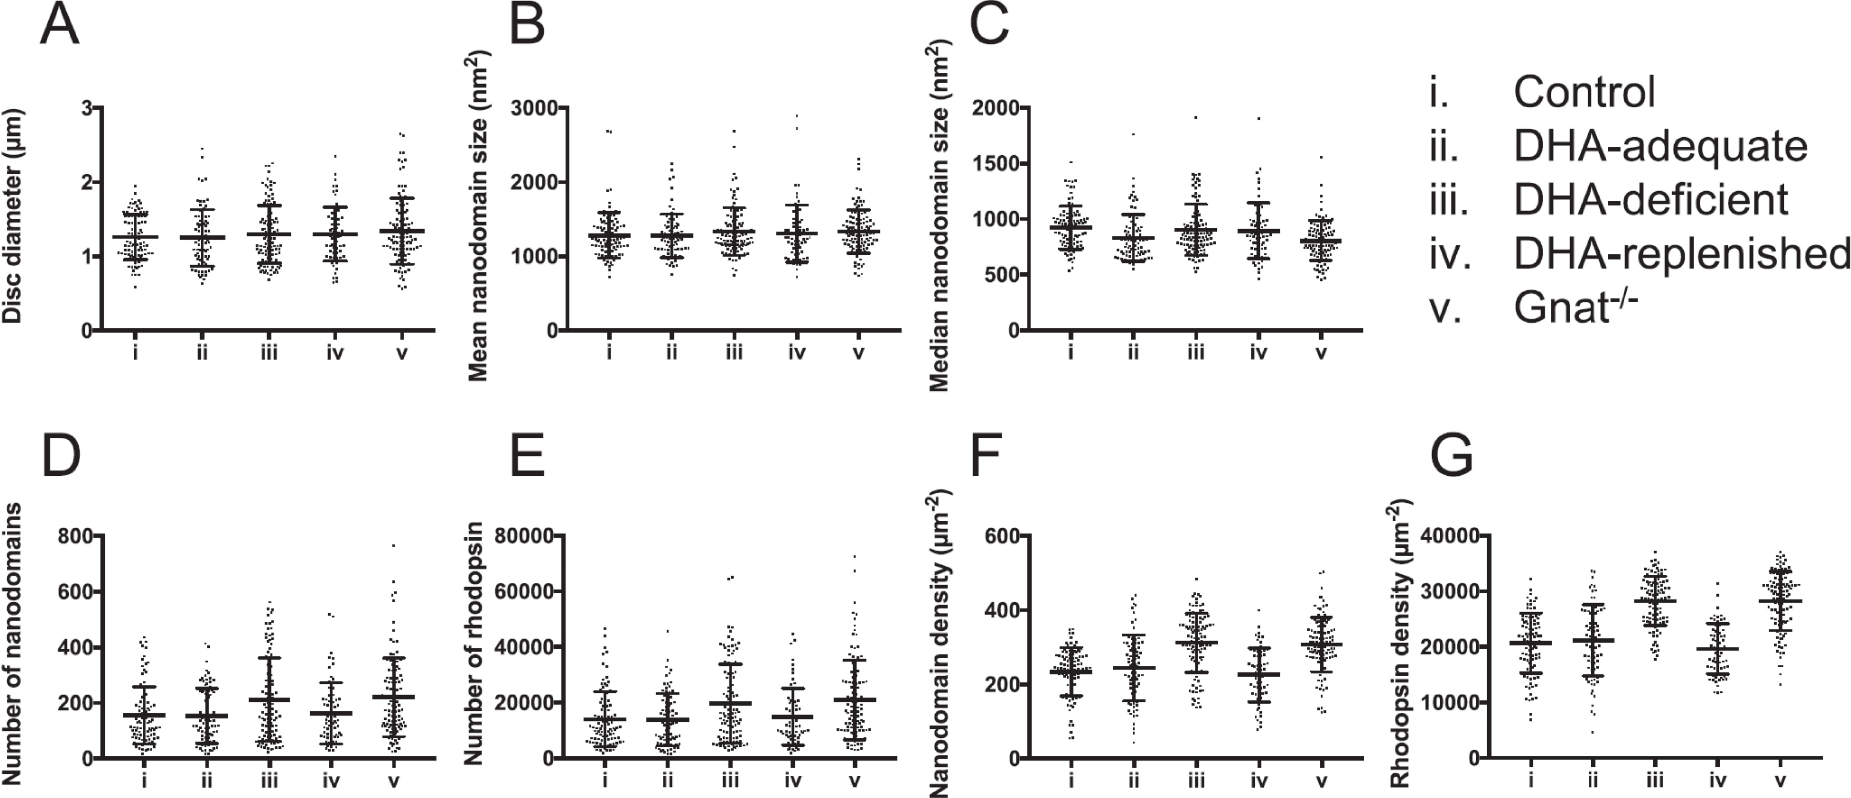
ROS disc membrane properties are shown for control or regular diet (i), DHA-adequate (ii), DHA-deficient (iii), DHA-replenished (iv), and Gnat−/− (v) mice. Mean values with individual data points and the standard deviation are presented. No significant differences were found by one-way ANOVA for the disc diameter (p = 0.7731), mean (p = 0.6048) and median (p = 0.0506) nanodomain size. Significant differences were detected by one-way ANOVA for the number (p = 0.002) and density (p = < 0.0001) of nanodomains and for the number (p = 0.009) and density (p = < 0.0001) of rhodopsin. Reproduced from ref. [43] Copyright (2018), with permission from Elsevier.
4.4. Characterization of Diseased States
Do nanodomains form in the same way in diseased states as well? We have examined the ROS disc membrane from mice exhibiting milder retinal phenotypes to those causing retinal degeneration. For mice exhibiting milder phenotype, we examined two mice models - RhoG90D/G90D was a model for autosomal dominant CSNB (adCSNB),[94,95] and Rpe65−/− mice, a model for Leber congenital amaurosis (LCA).[96,97] RhoG90D/G90D is a mouse model for congenital stationary night blindness that expresses a G90D rhodopsin mutant transgenically. The lack of the retinal pigment epithelium-specific 65 kDa protein (RPE65) in Rpe65−/− prevents the formation of 11-cis retinal, leaving rhodopsin in the apoprotein opsin form. In both cases, the mutant rhodopsin or opsin are constitutively active and cause desensitization of rod photoreceptor cells.[50]
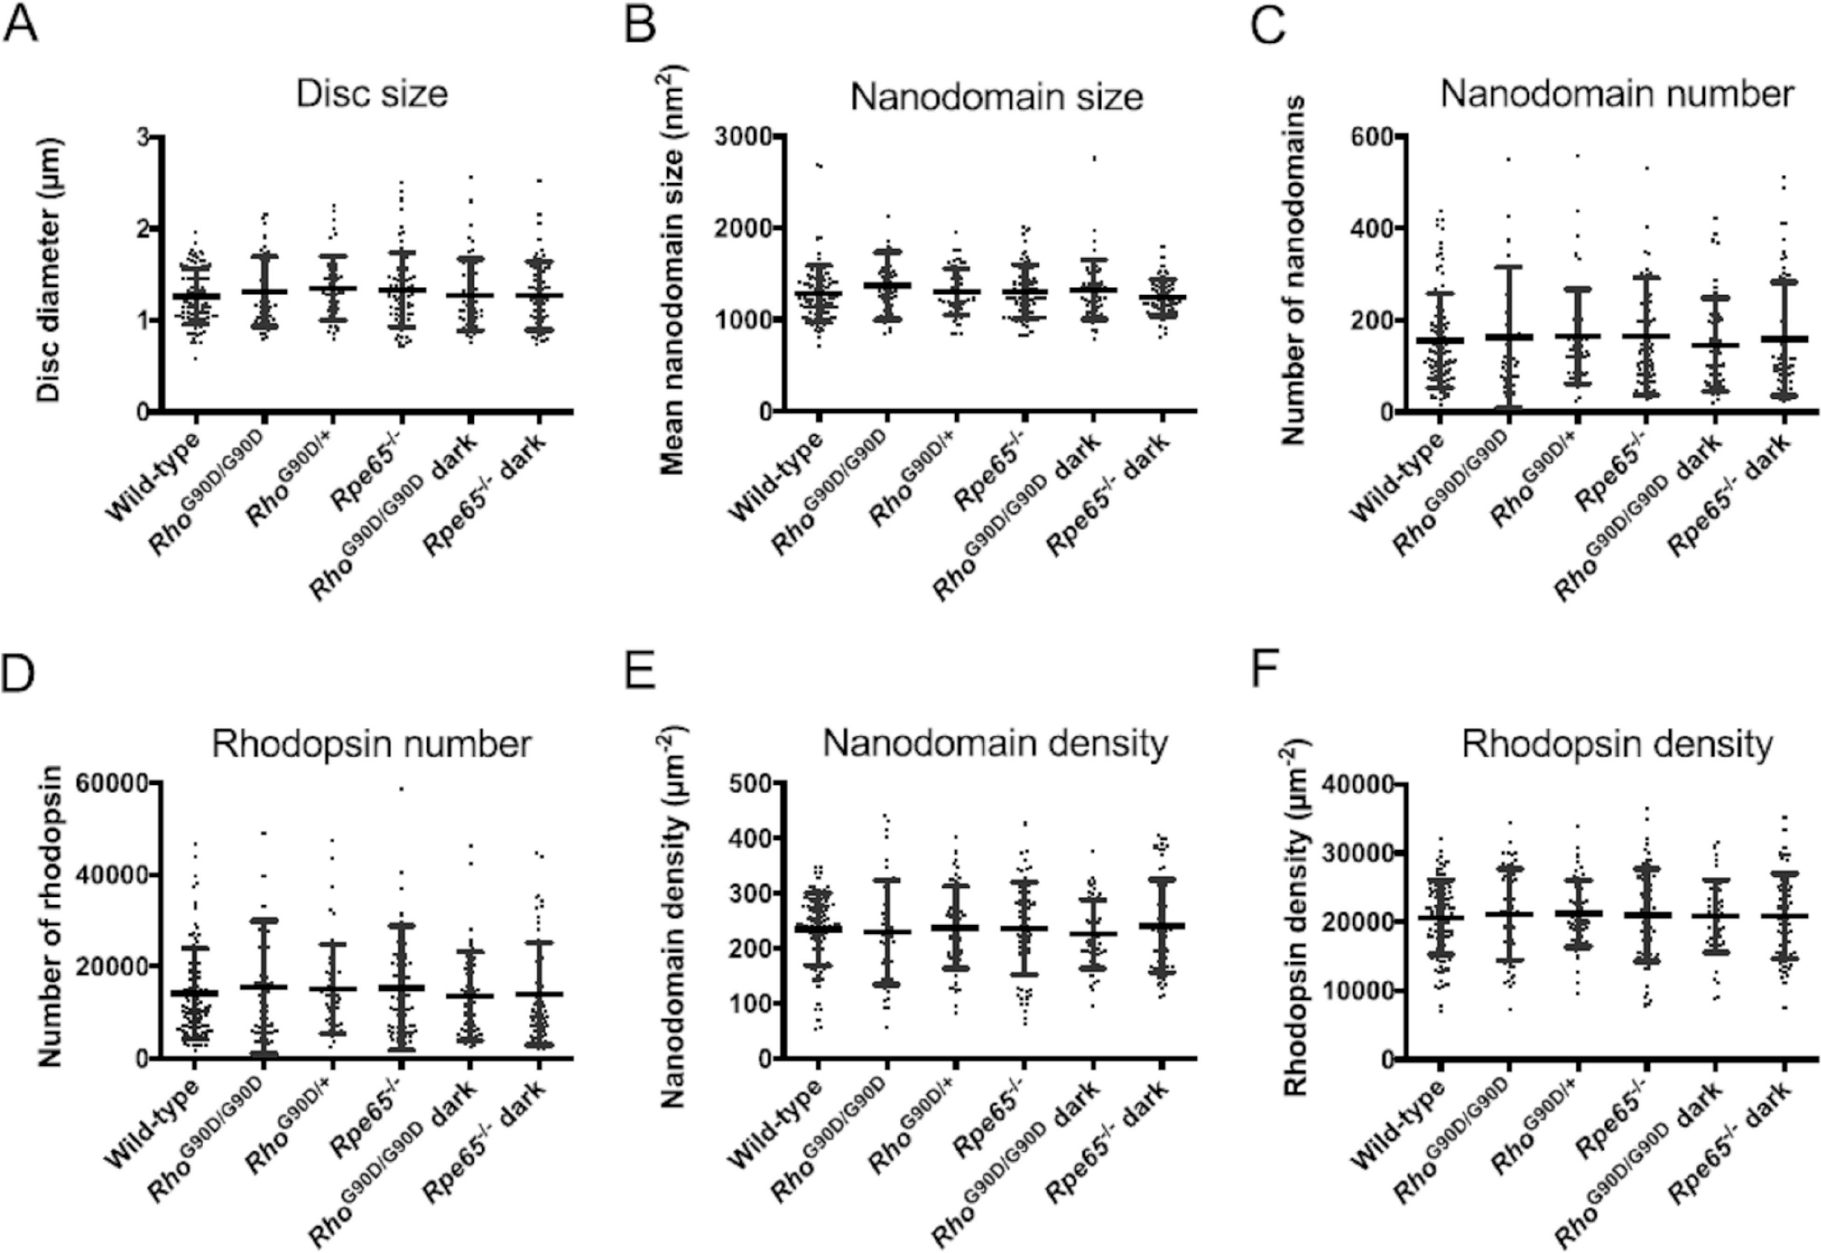
Both qualitative and quantitative analyses of the disc membranes isolated from constitutively active mouse lines did not show any differences (Figure 8, Table 2). All the disc membrane properties and rhodopsin content and packing in discs for RhoG90D/G90D, RhoG90D/+, and Rpe65−/− were found to be similar to the wild-type mice housed under cyclic conditions.[41] No statistical differences in the disc parameters and rhodopsin packing implied the evident lack of adaptation as observed in the case of impaired phototransduction. Housing the RhoG90D/G90D and Rpe65−/− under prolonged dark condition (10 days) also produced disc membranes with similar properties as wild-type mice under cyclic light conditions and showed no sign of adaptation. Interestingly, these constitutively active mice showed properties different from wild-type mice under constant light conditions, implying that constitutive activity was not equivalent to constant light stimulation.[41,45]
Figure 8.
ROS disc properties for wild-type, RhoG90D/G90D, RhoG90D/+, and Rpe65−/− mice housed under cyclic light conditions and for RhoG90D/G90D and Rpe65−/− mice housed under prolonged darkness (10 days dark). Mean values with individual data points and the standard deviation are presented. Statistical analyses indicated no significant differences (p-value >.05) for any of the ROS disc properties among the different mouse lines examined. Reproduced from ref. [41] Copyright (2020), with permission from Elsevier.
We also examined the effect on ROS disc membranes in mice exhibiting a more severe retinal phenotype involving retinal degeneration, PRCD knockout (Prcd-KO) mice.[42] The protein progressive rod-cone degeneration (PRCD) is present in the photoreceptor outer segment (OS) disc membranes[98] and its mutated forms have been shown to be linked with retinitis pigmentosa (RP), a progressive retinal degenerative disease, in humans and canines.[99,100] PRCD interacts with rhodopsin to maintain normal visual functions and also helps with disc morphogenesis and maintenance.[101] We used AFM imaging to directly assess the effects of PRCD on rhodopsin organization and disc structure by studying Prcd-KO mice that showed progressive loss of visual function and slow photoreceptor degeneration (Figure 9).[42] With the progression of retinal degeneration, Prcd-KO mice exhibited a decrease in total rhodopsin content and abnormalities in the ROS structure. A direct visualization using AFM also revealed a significant number of irregularly formed discs in the case of the mutated mice, a number that increased with the disease progression (Figure 9-J). These irregular discs also contained nanodomains scattered erratically, and often less in number, resulting in a low rhodopsin number and density (Figure 9-I, Table 1). These data demonstrate that Prcd-KO mice were incapable of forming regular ROS disc membranes with optimal rhodopsin number and density. In contrast to the disc membranes from some other diseased states, such as leber congenital amaurosis (LCA, in case of Rpe65−/− mice) and congenital stationary night blindness (CSNB, in case of RhoG90D/G90D mice),[41] these Prcd-KO mice exhibiting retinal degeneration showed a more severe phenotype. This implied that the PRCD protein plays an integral role in the formation of disc membranes, and the incorporation of rhodopsin into them.
Figure 9.
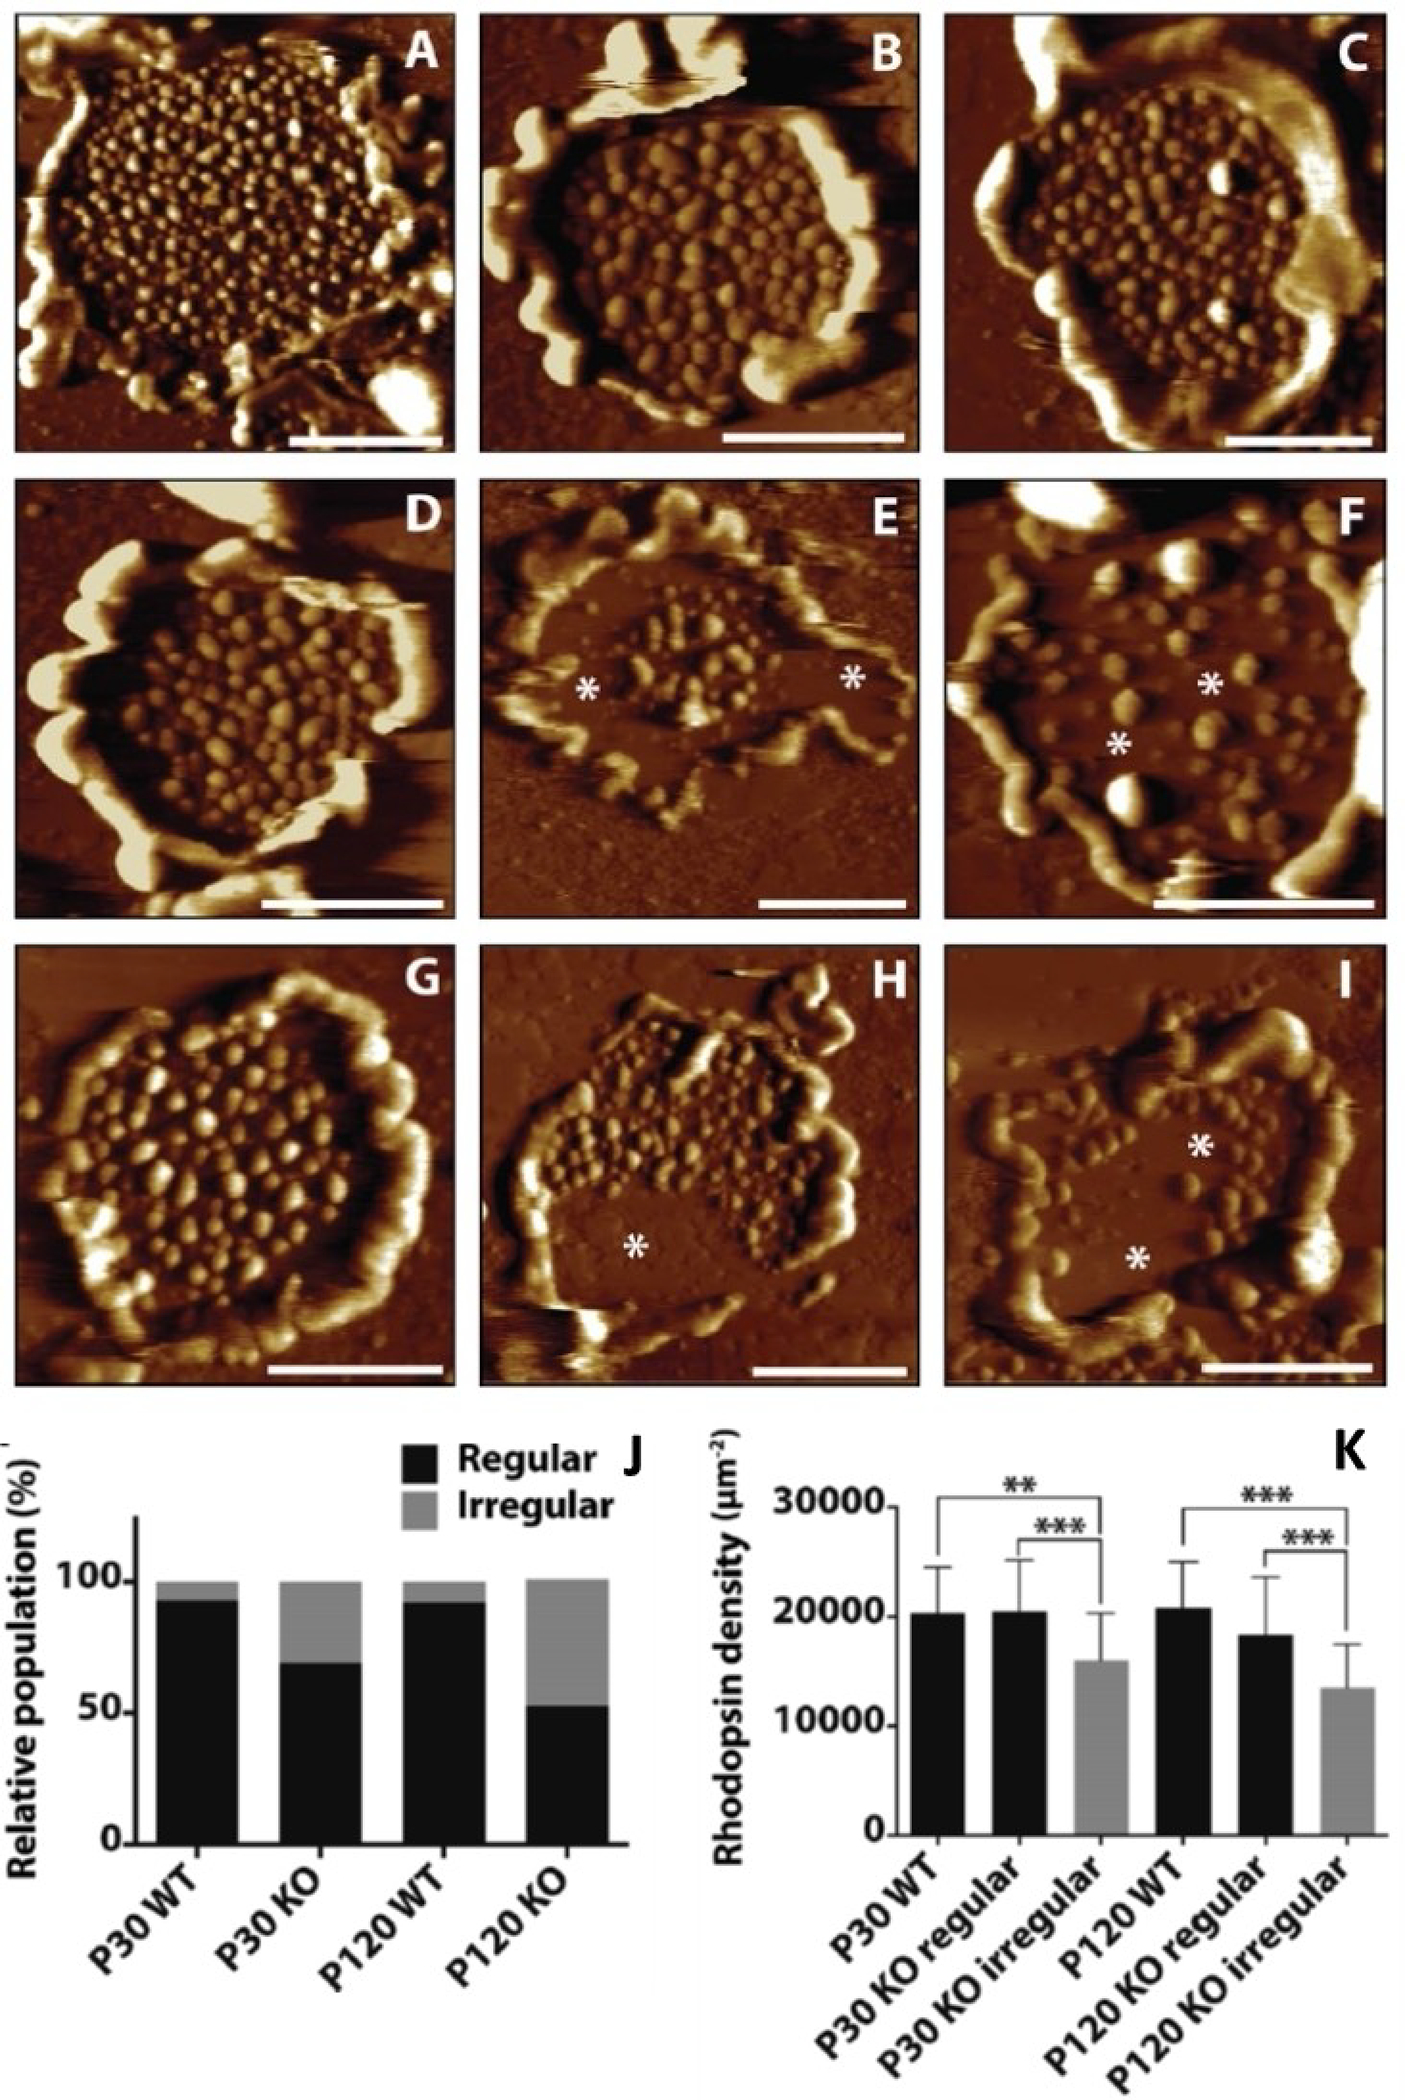
Representative AFM images of ROS disc membranes isolated from (A–C) mature wild-type mice (at postnatal days 120), (D–F) young Prcd-KO mice (at postnatal days 30), and (G–I) mature Prcd-KO mice (at postnatal days 120). Asterisks indicate large areas within the discs without rhodopsin nanodomains, giving the discs an irregular structure. Scale bar = 500 nm. (J) Increase in the population of irregular discs as the disease progresses with age for the Prcd-KO mice. (K) A considerable decrease in rhodopsin density in the discs for Prcd-KO mice in comparison to the wild-type mice or the regular discs present in the Prcd-KO mice. Adapted from ref. [42] Copyright (2020), with permission from Springer Nature.
5. Stability, Energy Landscape, and Mechanical Properties of Rhodopsin Structural Segments
In addition to imaging, AFM can also be used to unfold proteins and monitor the molecular interactions stabilizing the protein. The first demonstration that this could be applied to membrane proteins was made in bacteriorhodopsin in purple membrane.[102] Daniel Müller (ETH Zurich, Zurich, Switzerland) has pioneered this application in membrane proteins[103] and we have been fortunate to work together with him in applying this methodology to examine rhodopsin in ROS disc membranes. In SMFS (single-molecule force spectroscopy), the AFM probe is attached to the exposed terminal region of the membrane protein and as the probe is retracted from the sample, the polypeptide chain of the protein unfolds.[103] The segments of the protein unfold sequentially and the unfolding events are recorded in the form of force-distance curves, which record the forces required to unfold the different segments in the protein stabilized by chemical bonds (Figure 10). For rhodopsin in ROS disc membranes, we have shown by SMFS on enzymatically digested samples that most discs adsorb on mica exposing the extracellular surface of rhodopsin,[104] and this has also been confirmed by immunolabeling of ROS discs adsorbed on mica,[56] Thus, rhodopsin is unfolded from its amino terminal end in our SMFS experiments.
Figure 10.
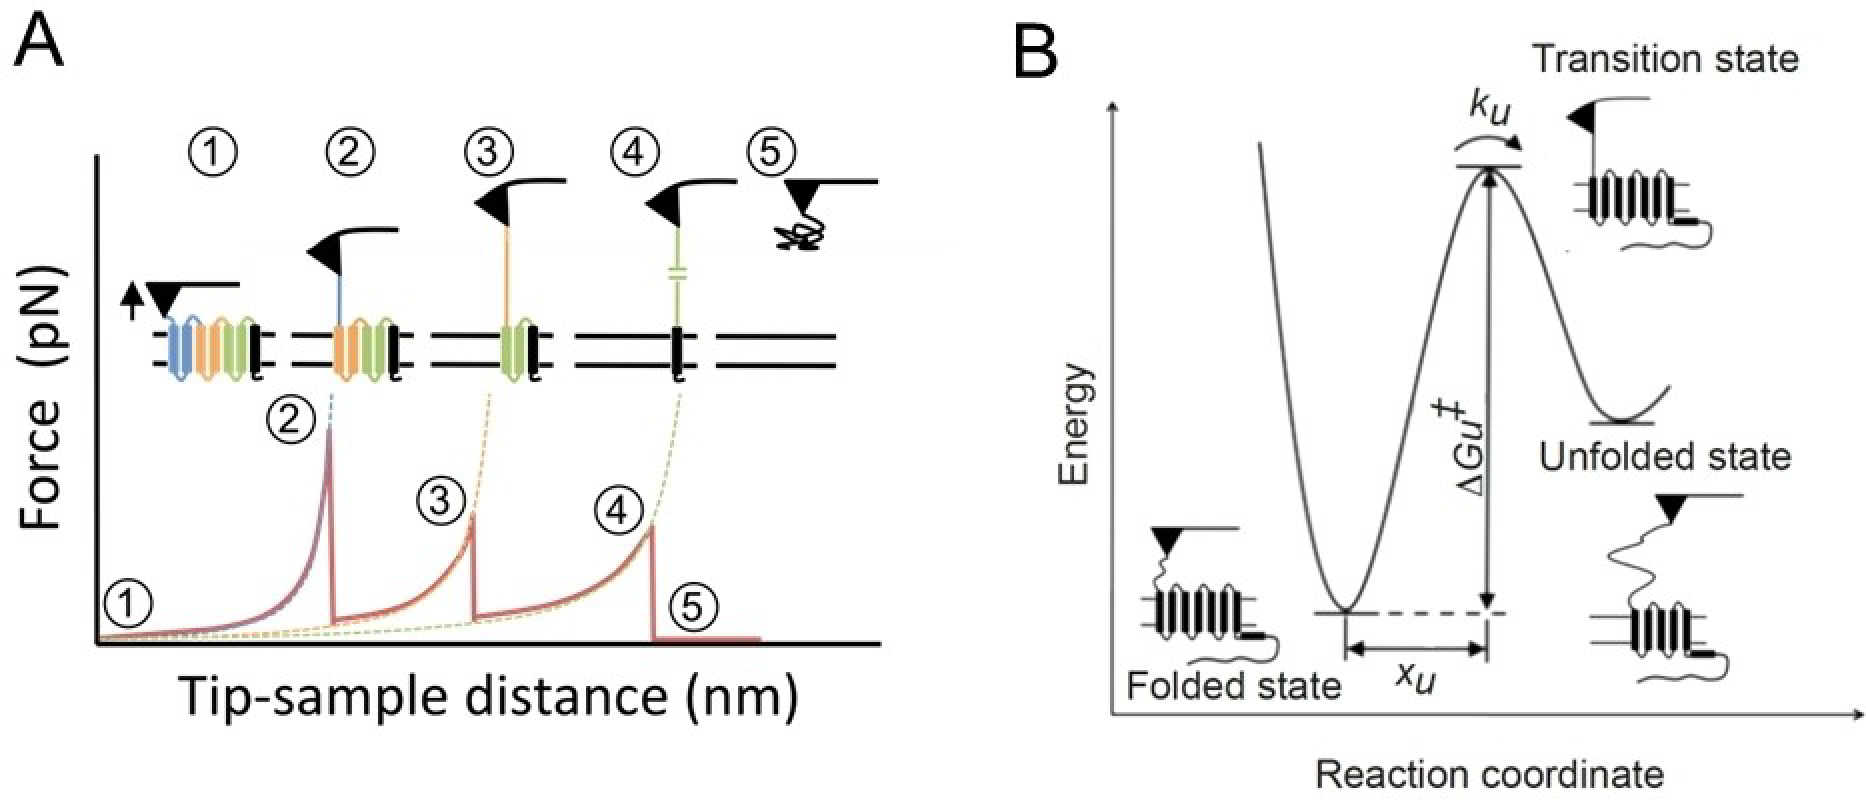
A) Example of a force-distance curve obtained from unfolding a membrane protein in SMFS. Each force peak corresponds to the force required to unfold the segment of the protein in the corresponding number. B) DFS provides information on properties shown in the unfolding energy barrier for a stable structural segment in rhodopsin. Mechanical properties of the segment can be assessed by xu, energetic properties of the segment can be assessed by ΔGu and kinetic properties can be assessed by ku. Adapted from ref. [37] Copyright (2014) and ref. [39] Copyright (2010), with permissions from Elsevier and American Chemical Society (ACS), respectively.
SMFS was first applied to rhodopsin from ROS disc membranes from bovine retina.[104] Later SMFS studies on rhodopsin from ROS disc membranes from murine retina demonstrated that the molecular interactions stabilizing rhodopsin structure are conserved among different species.[39] These studies revealed that the structure of rhodopsin is organized into at least 9 different stable structural segments requiring external force applied by the AFM probe to unfold (Figure 11). SMFS has been able to reveal the stabilizing effect of zinc ions and palmitylation on the structure of rhodopsin.[105,106]
Figure 11.
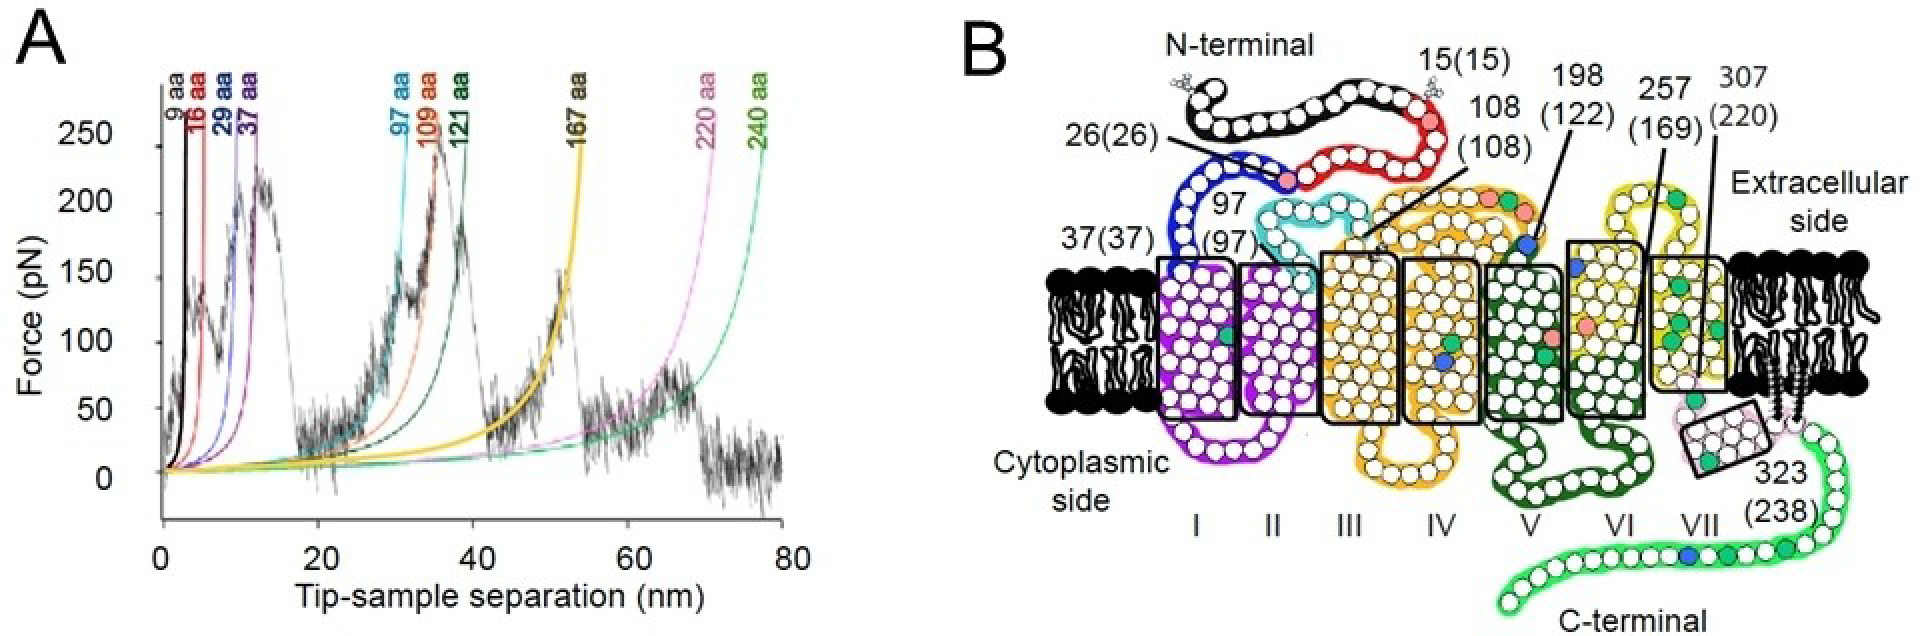
A) Example of force-distance curve obtained from unfolding rhodopsin from ROS disc membranes. Force peaks are fit with the worm-like-chain model to determine how many amino acid residues are stretched above the sample surface. Each force peak represents the force required to unfold a stable structural segment. B) Stable structural segments corresponding to peaks in A are colored on the secondary structure of rhodopsin. Adapted from ref. [39] Copyright (2010), with permissions from American Chemical Society (ACS).
More detailed information can be gained by conducting DFS (dynamic SMFS), where SMFS is conducted at different pulling speeds. DFS provides information on the energy landscape underlying the unfolding of stable structural segments, defining parameters related to mechanical, energetic, and kinetic properties of the stable structural segment.[103] DFS has shown that the molecular interactions stabilizing vertebrate rhodopsin are more complex compared to bacteriorhodopsin in the purple membrane of H. salinarum, a prokaryotic archaea.[107] Bacteriorhodopsin, like rhodopsin, exhibits 7 alpha-helical transmembrane domains but is functionally distinct acting as a proton pump. A core of rigid structural segments was present in rhodopsin but absent in bacteriorhodopsin.[107] This difference indicated that the transmembrane domains in rhodopsin appear to form a network of chemical bonds with each other to stabilize rhodopsin structure, whereas the transmembrane domains of bacteriorhodopsin do not form a similar network and derive stability independent of each other. DFS has also revealed structural changes in rhodopsin in animal models for LCA and CSNB. In these models described earlier, rhodopsin is constitutively active because it is in the apo-opsin form or because of a G90D mutation. In both cases, constitutively active opsin or rhodopsin resulted in a structure with decreased kinetic stability, decreased free-energy barriers, and increased mechanical rigidity.[47,48] These properties may be conserved among other GPCRs as well.[108,109] The increased mechanical rigidity in constitutively active rhodopsin would be an important insight and formed the basis of AFM-based nanoindentation studies described below to better understand the mechanism of this pathogenic activity.
6. Probing Rhodopsin Activity Using AFM-Based Nanoindentation
Investigating the structural and functional properties of native membrane proteins under physiological conditions has always proven to be difficult.[110,111] Traditionally, GPCR activity has been evaluated from an ensemble-averaged point of view.[7,112–115] In recent years, new technological advances have made it possible to assess GPCR conformational states and signaling mechanisms using a single-molecule approach.[116–119] Structural and biophysical studies on GPCRs are often done after extracting them using detergents or modifying them with suitable labels, and not in their native environment.[51] While these studies are critical to advance our understanding of GPCRs, assessing the conformational states within the native lipid environment was the need of the hour to have better insight into the normal and pathological states of GPCR.
The major obstacle that needed to be overcome was how to monitor the active state of a native receptor under physiological conditions. As described above, AFM-based DFS studies on constitutively active rhodopsin revealed increased rigidity in the structure along the vertical axis compared to that of inactive rhodopsin when probed from the extracellular surface.[47,48] Agonist-activated β2 adrenergic receptors, another GPCR, also exhibited a similar increase in rigidity.[108] These SMFS studies indicated that the inactive and active states of GPCRs could potentially be distinguished based on the relative rigidity induced by the activation of the GPCR.
Over the years, AFM-based stiffness measurement studies have become increasingly useful in furnishing nanomechanical properties of a wide range of biological samples – proteins, cells, tissues, etc.[34,120–123] Fitting the slope of the force-distance curve to a suitable mathematical model based on the tip geometry, such as a Hertzian model for pyramidal AFM tips[123,124] in our case, provides the stiffness information of the material. The Young’s modulus is computed from the fitted data and is used as a measure of stiffness. We envisaged that inactive and active states of rhodopsin could exhibit different Young’s modulus values when subjected to the nanoindentation studies.
6.1. Activity-Stiffness Correlation
Stiffness mapping of an intact disc membrane fixed on a mica surface showed a wide range of Young’s modulus values based on the structure and composition of different components of the disc membrane (Figure 12).[40] Mica and rim region exhibited the maximum and minimum stiffness, respectively. The Young’s modulus of the lipid region was around 5±1 MPa, similar to the lipid bilayer observed in the purple membrane embedding bacteriorhodopsin.[125] Finally, Young’s modulus of the rhodopsin nanodomain was found to be 12–19 MPa, comparable to that of bacteriorhodopsin.[125] These differential stiffness mapping values for different components of disc membranes further validated the robustness of the methodology.
Figure 12.
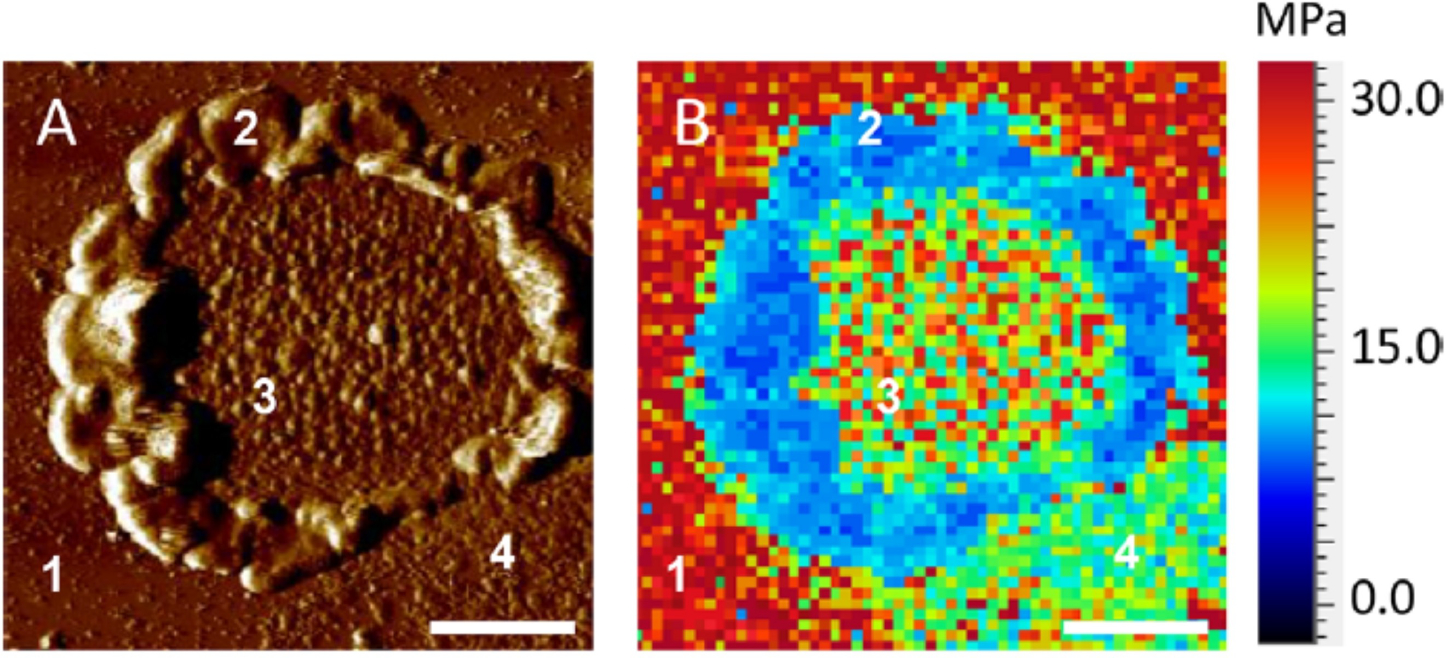
AFM-based stiffness mapping of a ROS disc membrane. (A) AFM Deflection image of a ROS disc membrane is shown. The mica surface (1), rim region (2), lamellar region with rhodopsin nanodomains (3), and lipid bilayer (4) are noted. Scale bar, 500 nm. (B) Stiffness mapping data in terms of Young’s moduli, experimentally determined for the ROS disc membrane shown in (A). Reproduced from ref. [40] Copyright (2019), with permissions from American Chemical Society (ACS).
The major question was whether or not the methodology was sensitive enough to differentiate between any potential difference in the stiffness of the rhodopsin molecule that accompanies receptor activation. In the dark, rhodopsin is locked in the inactive state through the covalently bound 11-cis-retinal and becomes active upon absorption of light, forming the MII state. AFM nanoindentation revealed that the inactive and active states of rhodopsin do indeed exhibit a difference in their stiffness. Light-activated rhodopsin exhibited a higher Young’s modulus (19 MPa) than the inactive dark state rhodopsin (12 MPa), an increase of 1.6-fold – an observation in accord with the DFS data obtained earlier (Figure 13-A).[48] Computational studies using coarse-grained (CG) model based on the crystal structures of inactive and active rhodopsin also predicted an increase in stiffness upon light activation,[40,126,127] supporting our AFM nanoindentation studies. These studies demonstrated that stiffness values could indeed be used to monitor the activity of rhodopsin.
Figure 13.
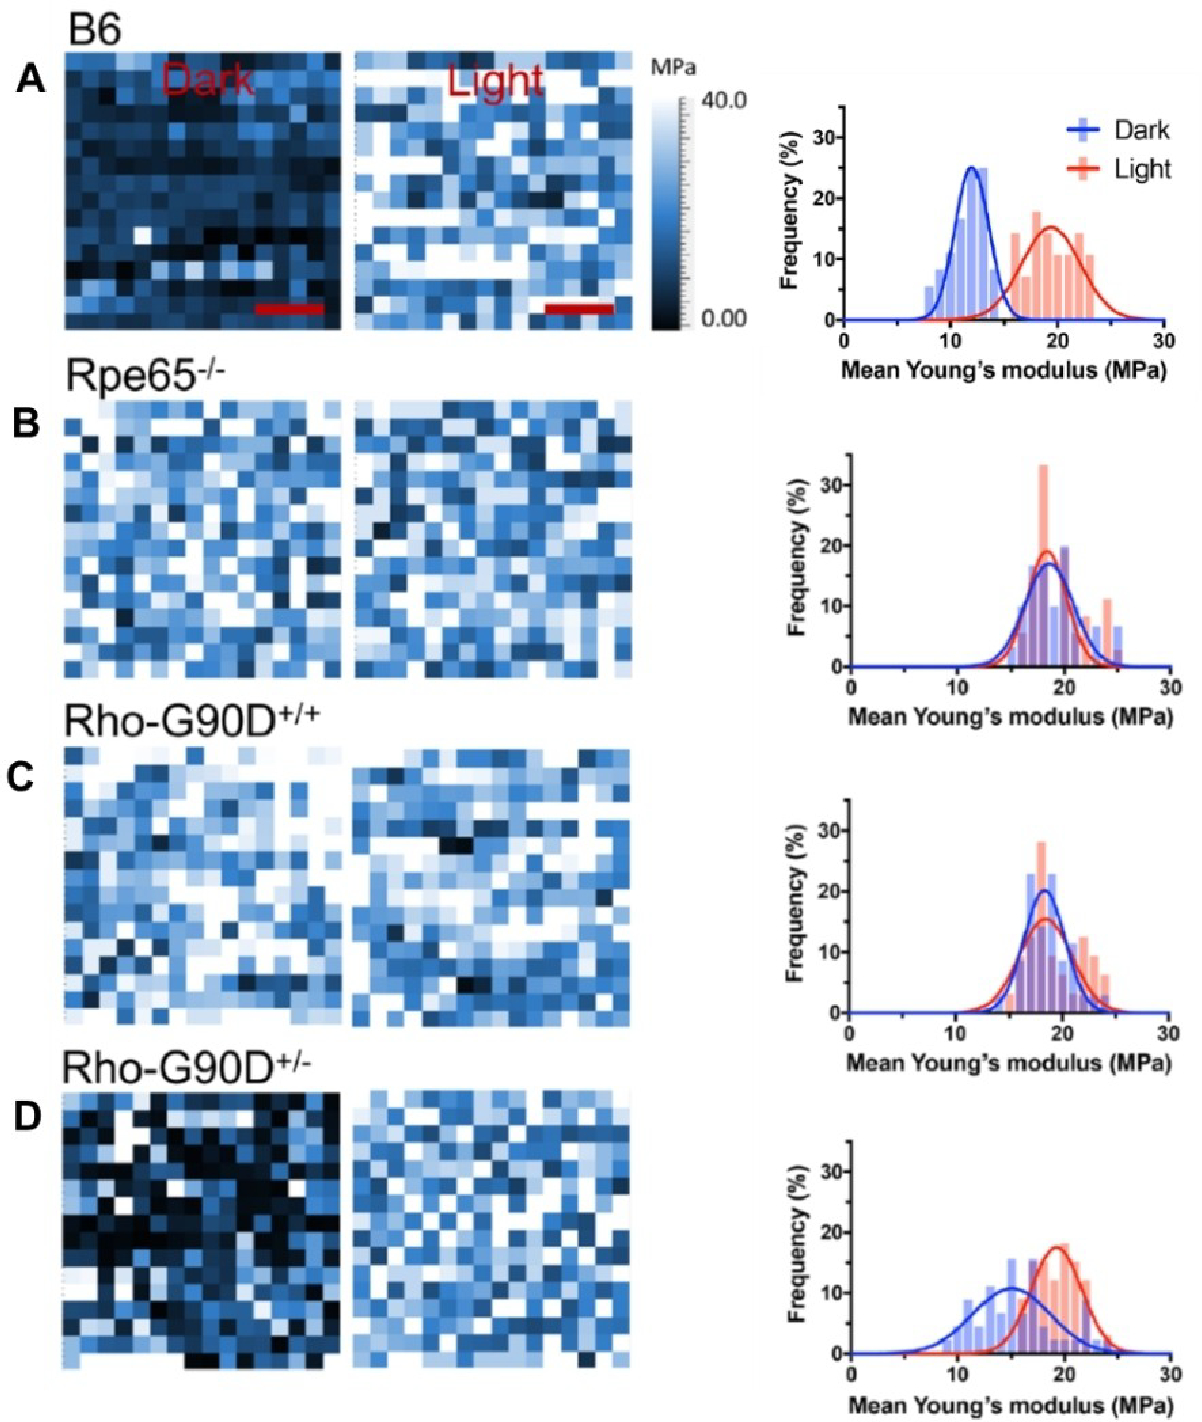
Young’s modulus maps of rhodopsin nanodomains in the dark state and after photobleaching, present in the ROS disc membranes isolated from B6 mice (A), Rpe65−/− mice (B), homozygous G90D rhodopsin (RhoG90D/G90D or Rho-G90D+/+) mice (C), or heterozygous G90D rhodopsin (RhoG90D/+ or Rho-G90D+/−) mice (D). The left and right map represents Young’s modulus of rhodopsin nanodomains investigated under dark conditions and after photobleaching, respectively. Scale bar, 5 nm. Histograms generated from mean Young’s modulus data obtained under dark conditions or after photobleaching are presented in blue and red, respectively and were fitted with a Gaussian function. Adapted from ref. [40] Copyright (2019), with permissions from American Chemical Society (ACS).
6.2. Constitutive Activity and Conformational States
As discussed earlier, several point mutations in rhodopsin lead to vision problems and retinal diseases.[50] Two constitutively active forms of rhodopsin (opsin and G90D rhodopsin mutant) have been investigated earlier using AFM imaging and DFS studies, providing insight into the rhodopsin packing and structural, energetic, and mechanical stability for these two diseased forms.[47,48] After establishing a positive correlation between the stiffness and activity for wild-type mice, we aimed to characterize constitutively active forms of the receptor to better understand the mechanism of this activity that leads to retinal disease.
Nanoindentation AFM studies revealed that Young’s modulus for both opsin (from Rpe65−/− mice) and the G90D rhodopsin mutant (from RhoG90D/G90D mice) were similar in both the dark and light states. Similarities between the stiffness values for both constitutively active forms and light-activated wild-type rhodopsin indicated that both the diseased forms adopted an active state independent of light and the increase in Young’s modulus is intrinsic in nature. We were also able to distinguish between inactive and active receptors when both receptor forms were present in the ROS disc membranes. In heterozygous RhoG90D/+ mice, which express both wild-type and G90D mutant rhodopsin, we observed a mixture of inactive and active receptors randomly distributed within the membrane under dark conditions. Upon light stimulation, all receptors were in the active state, exhibiting a higher Young’s modulus. So, it was clear that both light-activated wild-type and constitutionally active receptor molecules exhibited increased stiffness when probed with AFM. This increase was attributed to the structural changes in receptor molecules due to the presence of an extensive network of hydrogen bonds and the formation of a compact core structure upon the introduction of water in the light-activated state.[48]
The ability to detect and quantify the proportion of receptors in an inactive or active state allowed us to determine the underlying mechanism of constitutive activity. The activity of constitutively active opsin or mutant G90D rhodopsin in vivo is estimated to be less than 1 % of that of the light-activated MII state of wild-type rhodopsin.[95,128–130] These low levels of constitutive activity traditionally have been explained in terms of the classical two-state model for receptor activation (Figure 14-A).[131,132] In this model, the receptor exists in equilibrium between two states - an inactive state and an active state – where only a small population of receptors adopt the active state, effectively resulting in the low levels of constitutive activity observed. In more recent years, a multi-state model has emerged to describe GPCR activity, in which the receptor can adopt a number of active states in a sequential or nonsequential manner. Under this updated scheme, low levels of constitutive activity can result from the receptor adopting an active state with low activity and the equilibrium can be shifted completely in favor of this active state and still achieve low activity (Figure 14-B).[133–137]
Figure 14.
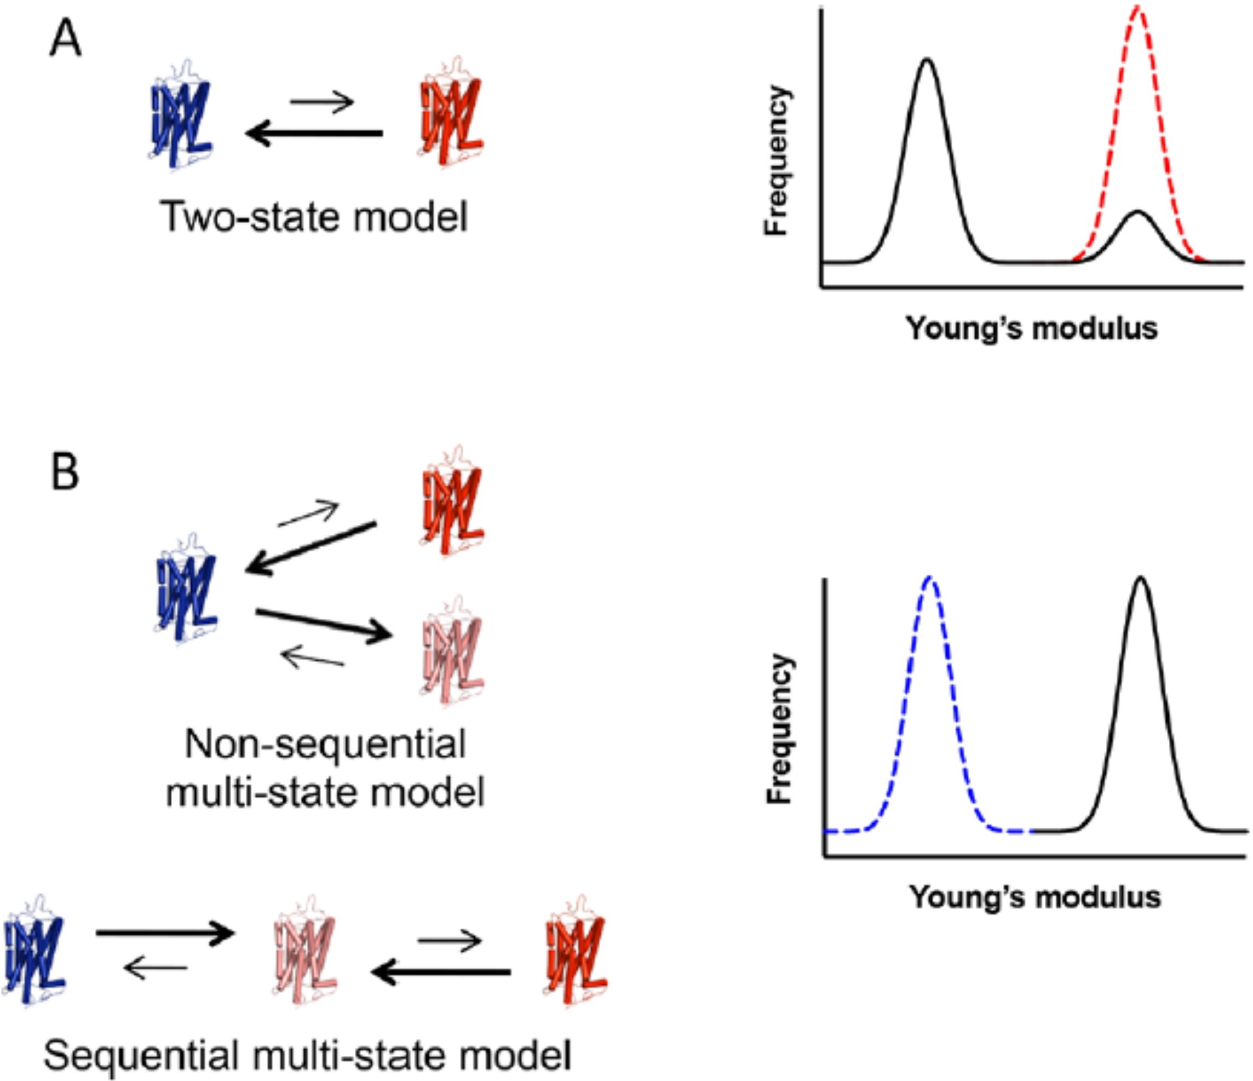
Proposed models of receptor activation to describe low levels of constitutive activity. (A) In the classical two-state model, the receptor exists in equilibrium between a single inactive state (blue) and a single active state (red). A small population of receptors adopting an active state results in low levels of constitutive activity. Based on the activity-stiffness correlation, Young’s modulus histograms are expected to exhibit a major population corresponding to an inactive state and a minor population corresponding to an active state (black line). The dashed red line represents the case of all receptors adopting an active conformation. (B) In multistate models, the receptor can adopt multiple active states (red and pink) in either a nonsequential or sequential manner. Low constitutive activity can result from a shift of the equilibrium to a low-activity active state (pink). In this case, Young’s modulus histograms are predicted to exhibit a single population of receptors in the active conformation (black line), as can be seen in the experimentally determined data. The dashed blue line represents the case of all receptors adopting an inactive conformation. Reproduced from ref. [40] Copyright (2019), with permissions from American Chemical Society (ACS).
We could determine which model underlies the mechanism by which constitutive activity occurs in opsin or the G90D rhodopsin mutant based on our activity-stiffness correlation data. If the constitutive activity occurred via the two-state model, we would expect to observe two populations of Young’s modulus – one major population of the inactive state and only a minor population of the active state, which would account for the low level of constitutive activity observed. However, the presence of a single population of receptors with a higher stiffness range was observed in our AFM nanoindentation indicating all receptors were in an active state and none in an inactive state.[40] In this case, all the receptors appeared to adopt an active state with low activity, resulting in a low level of total activity, consistent with the multi-state model. Previously the G90D rhodopsin mutant has been shown to adopt a different conformation than that of the active MII state, and despite having some similarities,[138] distinct structural differences were present as observed by electron paramagnetic resonance spectroscopy studies.[139] Despite the differences, both the MII state and constitutively active state were found to be stiffer as shown by AFM measurements. Multiple active states have been observed in the case of other GPCRs, and AFM could potentially detect the active states of those GPCRs as well. These additional insights into the active state conformations could be important from a pathological point of view.
7. Conclusion
We started this journey to understand the structural and functional properties of rhodopsin from a nanoscale point of view. AFM being a multifaceted instrument with a wide range of applications was ideally suited for this purpose. The unique structure of rod photoreceptor cells and the high expression of rhodopsin in ROS disc membranes provided an ideal biological sample for AFM interrogation. This complementary fit of the technique and the biological sample has provided a wealth of information that was previously inaccessible by more traditional approaches. Fundamental aspects of rhodopsin structure and function have been revealed to advance our understanding of the receptor under both normal and dysfunctional states. These studies provide a foundation to not only continue to advance AFM methodology to study the visual system but also to interrogate the worldview of other GPCRs as well.
Acknowledgements
This work was funded by a grant from the National Institutes of Health (R01EY021731).
Biographies

Subhadip Senapati received his doctoral degree in 2015 from Arizona State University under the guidance of Prof. Stuart Lindsay, studying the structures and functions of a wide range of biological samples using atomic force microscopy (AFM). Upon completion of his PhD, he moved to Case Western Reserve University to pursue postdoctoral research in Dr. Paul S.-H. Park group. Under Dr. Park’s supervision, he investigated the structural, functional, and mechanical features of the G protein-coupled receptor protein rhodopsin, utilizing different AFM applications. At present, he is working as a Senior Researcher at Prayoga Institute of Education Research in Bengaluru (India).

Paul Park is currently a tenured associate professor in the Department of Ophthalmology and Visual Sciences at Case Western Reserve University. He received his Ph.D. degree in the Department of Pharmaceutical Sciences at the University of Toronto under the supervision of James W. Wells. He obtained postdoctoral training in the Department of Ophthalmology at the University of Washington and the Department of Pharmacology at Case Western Reserve University under the supervision of Krzysztof Palczewski. Dr. Park utilizes a multidisciplinary approach to study the biology of the retina and retinal diseases and structure-function relationships in rhodopsin.
References
- [1].Latorraca NR, Venkatakrishnan AJ, Dror RO, Chem. Rev. 2017, 117, 139–155, 10.1021/acs.chemrev.6b00177. [DOI] [PubMed] [Google Scholar]
- [2].Syrovatkina V, Alegre KO, Dey R, Huang XY, J. Mol. Biol. 2016, 428, 3850–68, 10.1016/j.jmb.2016.08.002. [DOI] [PMC free article] [PubMed] [Google Scholar]
- [3].Fredriksson R, Lagerstrom MC, Lundin LG, Schioth HB, Mol. Pharmacol. 2003, 63, 1256–72, 10.1124/mol.63.6.1256. [DOI] [PubMed] [Google Scholar]
- [4].Pierce KL, Premont RT, Lefkowitz RJ, Nat. Rev. Mol. Cell Biol. 2002, 3, 639–50, 10.1038/nrm908. [DOI] [PubMed] [Google Scholar]
- [5].Rosenbaum DM, Rasmussen SG, Kobilka BK, Nature 2009, 459, 356–63, 10.1038/nature08144. [DOI] [PMC free article] [PubMed] [Google Scholar]
- [6].Tuteja N, Plant Signaling Behav. 2009, 4, 942–7, 10.4161/psb.4.10.9530. [DOI] [PMC free article] [PubMed] [Google Scholar]
- [7].Weis WI, Kobilka BK, Annu. Rev. Biochem. 2018, 87, 897–919, 10.1146/annurev-biochem-060614-033910. [DOI] [PMC free article] [PubMed] [Google Scholar]
- [8].Hauser AS, Attwood MM, Rask-Andersen M, Schioth HB, Gloriam DE, Nat. Rev. Drug Discovery 2017, 16, 829–842, 10.1038/nrd.2017.178. [DOI] [PMC free article] [PubMed] [Google Scholar]
- [9].Sriram K, Insel PA, Mol. Pharmacol. 2018, 93, 251–258, 10.1124/mol.117.111062. [DOI] [PMC free article] [PubMed] [Google Scholar]
- [10].Yang D, Zhou Q, Labroska V, Qin S, Darbalaei S, Wu Y, Yuliantie E, Xie L, Tao H, Cheng J, Liu Q, Zhao S, Shui W, Jiang Y, Wang MW, Signal Transduct Target Ther 2021, 6, 7, 10.1038/s41392-020-00435-w. [DOI] [PMC free article] [PubMed] [Google Scholar]
- [11].Insel PA, Tang CM, Hahntow I, Michel MC, Biochim. Biophys. Acta 2007, 1768, 994–1005, 10.1016/j.bbamem.2006.09.029. [DOI] [PMC free article] [PubMed] [Google Scholar]
- [12].Watkins LR, Orlandi C, Br. J. Pharmacol. 2021, 178, 2963–2975, 10.1111/bph.15468. [DOI] [PubMed] [Google Scholar]
- [13].Congreve M, de Graaf C, Swain NA, Tate CG, Cell 2020, 181, 81–91, 10.1016/j.cell.2020.03.003. [DOI] [PubMed] [Google Scholar]
- [14].Gether U, Endocr. Rev. 2000, 21, 90–113, 10.1210/edrv.21.1.0390. [DOI] [PubMed] [Google Scholar]
- [15].Lamb TD, Eye (Lond) 2016, 30, 179–85, 10.1038/eye.2015.236. [DOI] [PMC free article] [PubMed] [Google Scholar]
- [16].Lamb TD, Pugh EN Jr., Invest. Ophthalmol. Visual Sci. 2006, 47, 5137–52, 10.1167/iovs.06-0849. [DOI] [PubMed] [Google Scholar]
- [17].Deupi X, Biochim. Biophys. Acta 2014, 1837, 674–82, 10.1016/j.bbabio.2013.09.002. [DOI] [PubMed] [Google Scholar]
- [18].Grossfield A, Biochim. Biophys. Acta 2011, 1808, 1868–78, 10.1016/j.bbamem.2011.03.010. [DOI] [PubMed] [Google Scholar]
- [19].Palczewski K, Annu. Rev. Biochem. 2006, 75, 743–67, 10.1146/annurev.biochem.75.103004.142743. [DOI] [PMC free article] [PubMed] [Google Scholar]
- [20].Salon JA, Lodowski DT, Palczewski K, Pharmacol. Rev. 2011, 63, 901–37, 10.1124/pr.110.003350. [DOI] [PMC free article] [PubMed] [Google Scholar]
- [21].Chen YF, Wang IJ, Lin LL, Chen MS, J. Cell. Biochem. 2011, 112, 520–30, 10.1002/jcb.22942. [DOI] [PubMed] [Google Scholar]
- [22].Suda K, Filipek S, Palczewski K, Engel A, Fotiadis D, Mol. Membr. Biol. 2004, 21, 435–46 10.1080/09687860400020291. [DOI] [PMC free article] [PubMed] [Google Scholar]
- [23].Palczewski K, Kumasaka T, Hori T, Behnke CA, Motoshima H, Fox BA, Le Trong I, Teller DC, Okada T, Stenkamp RE, Yamamoto M, Miyano M, Science 2000, 289, 739–45, 10.1126/science.289.5480.739. [DOI] [PubMed] [Google Scholar]
- [24].Costanzi S, Methods Mol. Biol. 2012, 857, 259–79, 10.1007/978-1-61779-588-6(((AMP)))lowbar(((SEMI)))11. [DOI] [PMC free article] [PubMed] [Google Scholar]
- [25].Fanelli F, De Benedetti PG, Chem. Rev. 2005, 105, 3297–351, 10.1021/cr000095n. [DOI] [PubMed] [Google Scholar]
- [26].Fanelli F, De Benedetti PG, Chem. Rev. 2011, 111, PR438–535, 10.1021/cr100437t. [DOI] [PubMed] [Google Scholar]
- [27].Fotiadis D, Liang Y, Filipek S, Saperstein DA, Engel A, Palczewski K, Nature 2003, 421, 127–8, 10.1038/421127a. [DOI] [PubMed] [Google Scholar]
- [28].Liang Y, Fotiadis D, Filipek S, Saperstein DA, Palczewski K, Engel A, J. Biol. Chem. 2003, 278, 21655–21662, 10.1074/jbc.M302536200. [DOI] [PMC free article] [PubMed] [Google Scholar]
- [29].Gurevich VV, Gurevich EV, Trends Pharmacol. Sci. 2008, 29, 234–40, 10.1016/j.tips.2008.02.004. [DOI] [PMC free article] [PubMed] [Google Scholar]
- [30].Uchihashi T, Ganser C, Biophys Rev 2020, 12, 363–369, 10.1007/s12551-020-00670-z. [DOI] [PMC free article] [PubMed] [Google Scholar]
- [31].Senapati S, Lindsay S, Acc. Chem. Res. 2016, 49, 503–10, 10.1021/acs.accounts.5b00533. [DOI] [PubMed] [Google Scholar]
- [32].Sanyour H, Childs J, Meininger GA, Hong Z, Sci. Rep. 2018, 8, 2899 10.1038/s41598-018-21253-9. [DOI] [PMC free article] [PubMed] [Google Scholar]
- [33].Horton M, Charras G, Lehenkari P, Recept J. Signal Transduction Res. 2002, 22, 169–90, 10.1081/rrs-120014594. [DOI] [PubMed] [Google Scholar]
- [34].Haase K, Pelling AE, Soc JR. Interface 2015, 12, 20140970, 10.1098/rsif.2014.0970. [DOI] [PMC free article] [PubMed] [Google Scholar]
- [35].Cheong LZ, Zhao W, Song S, Shen C, Acta Biomater. 2019, 99, 33–52, 10.1016/j.actbio.2019.08.023. [DOI] [PubMed] [Google Scholar]
- [36].Bornschlogl T, Rief M, Methods Mol. Biol. 2011, 783, 233–50, 10.1007/978-1-61779-282-3(((AMP)))lowbar(((SEMI)))13. [DOI] [PubMed] [Google Scholar]
- [37].Whited AM, Park PS, Biochim. Biophys. Acta 2014, 1838, 56–68, 10.1016/j.bbamem.2013.04.011. [DOI] [PMC free article] [PubMed] [Google Scholar]
- [38].Whited AM, Park PS, Biochim. Biophys. Acta 2015, 1848, 26–34, 10.1016/j.bbamem.2014.10.007. [DOI] [PMC free article] [PubMed] [Google Scholar]
- [39].Kawamura S, Colozo AT, Muller DJ, Park PS, Biochemistry 2010, 49, 10412–20, 10.1021/bi101345x. [DOI] [PMC free article] [PubMed] [Google Scholar]
- [40].Senapati S, Poma AB, Cieplak M, Filipek S, Park PSH, Anal. Chem. 2019, 91, 7226–7235, 10.1021/acs.analchem.9b00546. [DOI] [PMC free article] [PubMed] [Google Scholar]
- [41].Senapati S, Park PS, Biochim. Biophys. Acta Biomembr. 2020, 1862, 183396, 10.1016/j.bbamem.2020.183396. [DOI] [PMC free article] [PubMed] [Google Scholar]
- [42].Sechrest ER, Murphy J, Senapati S, Goldberg AFX, Park PS, Kolandaivelu S, Sci. Rep. 2020, 10, 17885, 10.1038/s41598-020-74628-2. [DOI] [PMC free article] [PubMed] [Google Scholar]
- [43].Senapati S, Gragg M, Samuels IS, Parmar VM, Maeda A, Park PS, Biochim. Biophys. Acta Biomembr. 2018, 1860, 1403–1413, 10.1016/j.bbamem.2018.03.030. [DOI] [PMC free article] [PubMed] [Google Scholar]
- [44].Rakshit T, Senapati S, Sinha S, Whited AM, Park PS, PLoS One 2015, 10, e0141114, 10.1371/journal.pone.0141114. [DOI] [PMC free article] [PubMed] [Google Scholar]
- [45].Rakshit T, Senapati S, Parmar VM, Sahu B, Maeda A, Park PS, Biochim. Biophys. Acta Mol. Cell Res. 2017, 1864, 1691–1702, 10.1016/j.bbamcr.2017.06.013. [DOI] [PMC free article] [PubMed] [Google Scholar]
- [46].Rakshit T, Park PS, Biochemistry 2015, 54, 2885–94, 10.1021/acs.biochem.5b00003. [DOI] [PMC free article] [PubMed] [Google Scholar]
- [47].Kawamura S, Gerstung M, Colozo AT, Helenius J, Maeda A, Beerenwinkel N, Park PS, Muller DJ, Structure 2013, 21, 426–37, 10.1016/j.str.2013.01.011. [DOI] [PMC free article] [PubMed] [Google Scholar]
- [48].Kawamura S, Colozo AT, Ge L, Muller DJ, Park PS, J. Biol. Chem. 2012, 287, 21826–35, 10.1074/jbc.M112.340182. [DOI] [PMC free article] [PubMed] [Google Scholar]
- [49].Senapati S, Park PS, Methods Mol. Biol. 2019, 1886, 61–74, 10.1007/978-1-4939-8894-5(((AMP)))lowbar(((SEMI)))4. [DOI] [PMC free article] [PubMed] [Google Scholar]
- [50].Park PS, Adv. Pharmacol. 2014, 70, 1–36, 10.1016/B978-0-12-417197-8.00001-8. [DOI] [PMC free article] [PubMed] [Google Scholar]
- [51].Park PS, Pfluegers Arch. 2021, 473, 1361–1376, 10.1007/s00424-021-02522-5. [DOI] [PMC free article] [PubMed] [Google Scholar]
- [52].Roof DJ, Heuser JE, Cell Biol J. 1982, 95, 487–500, 10.1083/jcb.95.2.487. [DOI] [PMC free article] [PubMed] [Google Scholar]
- [53].Downer NW, Cone RA, Biophys. J. 1985, 47, 277–84, 10.1016/S0006-3495(85)83917-5. [DOI] [PMC free article] [PubMed] [Google Scholar]
- [54].Cone RA, Nat New Biol 1972, 236, 39–43, 10.1038/newbio236039a0. [DOI] [PubMed] [Google Scholar]
- [55].Fotiadis D, Liang Y, Filipek S, Saperstein DA, Engel A, Palczewski K, FEBS Lett. 2004, 564, 281–288, 10.1016/S0014-5793(04)00194-2. [DOI] [PMC free article] [PubMed] [Google Scholar]
- [56].Buzhynskyy N, Salesse C, Scheuring S, J. Mol. Recognit. 2011, 24, 483–9, 10.1002/jmr.1086. [DOI] [PubMed] [Google Scholar]
- [57].Gunkel M, Schoneberg J, Alkhaldi W, Irsen S, Noe F, Kaupp UB, Al-Amoudi A, Structure 2015, 23, 628–38, 10.1016/j.str.2015.01.015. [DOI] [PubMed] [Google Scholar]
- [58].Zhang T, Cao LH, Kumar S, Enemchukwu NO, Zhang N, Lambert A, Zhao X, Jones A, Wang S, Dennis EM, Fnu A, Ham S, Rainier J, Yau KW, Fu Y, Proc. Natl. Acad. Sci. USA 2016, 113, 9093–8, 10.1073/pnas.1609018113. [DOI] [PMC free article] [PubMed] [Google Scholar]
- [59].Hayashi F, Saito N, Tanimoto Y, Okada K, Morigaki K, Seno K, Maekawa S, Commun. Biol. 2019, 2, 209, 10.1038/s42003-019-0459-6. [DOI] [PMC free article] [PubMed] [Google Scholar]
- [60].Koch KW, Dell’Orco D, Front Mol Neurosci 2015, 8, 67, 10.3389/fnmol.2015.00067. [DOI] [PMC free article] [PubMed] [Google Scholar]
- [61].Getter T, Gulati S, Zimmerman R, Chen Y, Vinberg F, Palczewski K, FASEB J. 2019, 33, 9526–9539, 10.1096/fj.201900443RR. [DOI] [PMC free article] [PubMed] [Google Scholar]
- [62].Fotiadis D, Jastrzebska B, Philippsen A, Muller DJ, Palczewski K, Engel A, Curr. Opin. Struct. Biol. 2006, 16, 252–9, 10.1016/j.sbi.2006.03.013. [DOI] [PubMed] [Google Scholar]
- [63].Zhao DY, Poge M, Morizumi T, Gulati S, Van Eps N, Zhang J, Miszta P, Filipek S, Mahamid J, Plitzko JM, Baumeister W, Ernst OP, Palczewski K, J. Biol. Chem. 2019, 294, 14215–14230, 10.1074/jbc.RA119.010089. [DOI] [PMC free article] [PubMed] [Google Scholar]
- [64].Liebman PA, Parker KR, Dratz EA, Annu. Rev. Physiol. 1987, 49, 765–91, 10.1146/annurev.ph.49.030187.004001. [DOI] [PubMed] [Google Scholar]
- [65].Chabre M, Cone R, Saibil H, Nature 2003, 426, 30–1; discussion 31, 10.1038/426030b. [DOI] [PubMed] [Google Scholar]
- [66].Tam BM, Noorwez SM, Kaushal S, Kono M, Moritz OL, J. Neurosci. 2014, 34, 13336–48, 10.1523/JNEUROSCI.1655-14.2014. [DOI] [PMC free article] [PubMed] [Google Scholar]
- [67].Wen RH, Stanar P, Tam B, Moritz OL, Autophagy 2019, 15, 1970–1989, 10.1080/15548627.2019.1596487. [DOI] [PMC free article] [PubMed] [Google Scholar]
- [68].Chabre M, Biochim. Biophys. Acta 1975, 382, 322–35, 10.1016/0005-2736(75)90274-6. [DOI] [PubMed] [Google Scholar]
- [69].Nickell S, Park PS, Baumeister W, Palczewski K, Cell Biol J. 2007, 177, 917–25, 10.1083/jcb.200612010. [DOI] [PMC free article] [PubMed] [Google Scholar]
- [70].Saxton MJ, Owicki JC, Biochim. Biophys. Acta 1989, 979, 27–34 10.1016/0005-2736(89)90519-1. [DOI] [PubMed] [Google Scholar]
- [71].Hollyfield JG, Rayborn ME, Verner GE, Maude MB, Anderson RE, Invest. Ophthalmol. Visual Sci. 1982, 22, 417–27. [PubMed] [Google Scholar]
- [72].Hegener O, Prenner L, Runkel F, Baader SL, Kappler J, Haberlein H, Biochemistry 2004, 43, 6190–9, 10.1021/bi035928t. [DOI] [PubMed] [Google Scholar]
- [73].Herrick-Davis K, Grinde E, Lindsley T, Teitler M, Mancia F, Cowan A, Mazurkiewicz JE, Mol. Pharmacol. 2015, 87, 660–73, 10.1124/mol.114.096636. [DOI] [PMC free article] [PubMed] [Google Scholar]
- [74].Park PS, J. Membr. Biol. 2019, 252, 413–423, 10.1007/s00232-019-00078-1. [DOI] [PMC free article] [PubMed] [Google Scholar]
- [75].Cangiano L, Dell’Orco D, FEBS Lett. 2013, 587, 1–4, 10.1016/j.febslet.2012.11.015. [DOI] [PubMed] [Google Scholar]
- [76].Dell’Orco D, FEBS Lett. 2013, 587, 2060–6, 10.1016/j.febslet.2013.05.017. [DOI] [PubMed] [Google Scholar]
- [77].Reuter T, Vision Res. 2011, 51, 2243–62, 10.1016/j.visres.2011.08.021. [DOI] [PubMed] [Google Scholar]
- [78].Koch KW, Trends Biochem. Sci. 1992, 17, 307–11, 10.1016/0968-0004(92)90442-c. [DOI] [PubMed] [Google Scholar]
- [79].Fain GL, Matthews HR, Cornwall MC, Trends Neurosci. 1996, 19, 502–7, 10.1016/S0166-2236(96)10056-4. [DOI] [PubMed] [Google Scholar]
- [80].Penn JS, Williams TP, Exp. Eye Res. 1986, 43, 915–28, 10.1016/0014-4835(86)90070-9. [DOI] [PubMed] [Google Scholar]
- [81].Schremser JL, Williams TP, Exp. Eye Res. 1995, 61, 17–23, 10.1016/s0014-4835(95)80054-9. [DOI] [PubMed] [Google Scholar]
- [82].Cunea A, Begum R, Reinisch D, Jeffery G, Vis Neurosci 2013, 30, 169–74, 10.1017/S0952523813000321. [DOI] [PubMed] [Google Scholar]
- [83].Mishra AK, Gragg M, Stoneman MR, Biener G, Oliver JA, Miszta P, Filipek S, Raicu V, Park PS, Biochem. J. 2016, 473, 3819–3836, 10.1042/BCJ20160422. [DOI] [PMC free article] [PubMed] [Google Scholar]
- [84].Young RW, J. Cell Biol. 1967, 33, 61–72, 10.1083/jcb.33.1.61. [DOI] [PMC free article] [PubMed] [Google Scholar]
- [85].Zeitz C, van Genderen M, Neidhardt J, Luhmann UF, Hoeben F, Forster U, Wycisk K, Matyas G, Hoyng CB, Riemslag F, Meire F, Cremers FP, Berger W, Invest. Ophthalmol. Visual Sci. 2005, 46, 4328–35, 10.1167/iovs.05-0526. [DOI] [PubMed] [Google Scholar]
- [86].Maddox DM, Vessey KA, Yarbrough GL, Invergo BM, Cantrell DR, Inayat S, Balannik V, Hicks WL, Hawes NL, Byers S, Smith RS, Hurd R, Howell D, Gregg RG, Chang B, Naggert JK, Troy JB, Pinto LH, Nishina PM, McCall MA, Physiol J. 2008, 586, 4409–24, 10.1113/jphysiol.2008.157289. [DOI] [PMC free article] [PubMed] [Google Scholar]
- [87].SanGiovanni JP, Chew EY, Prog. Retinal Eye Res. 2005, 24, 87–138, 10.1016/j.preteyeres.2004.06.002. [DOI] [PubMed] [Google Scholar]
- [88].Bazan NG, Molina MF, Gordon WC, Annu. Rev. Nutr. 2011, 31, 321–51, 10.1146/annurev.nutr.012809.104635. [DOI] [PMC free article] [PubMed] [Google Scholar]
- [89].Weisinger HS, Vingrys AJ, Bui BV, Sinclair AJ, Invest. Ophthalmol. Visual Sci. 1999, 40, 327–38. [PubMed] [Google Scholar]
- [90].Tanito M, Brush RS, Elliott MH, Wicker LD, Henry KR, Anderson RE, Lipid Res J. 2009, 50, 807–19, 10.1194/jlr.M800170-JLR200. [DOI] [PMC free article] [PubMed] [Google Scholar]
- [91].Neuringer M, Connor WE, Van Petten C, Barstad L, J. Clin. Invest. 1984, 73, 272–6, 10.1172/JCI111202. [DOI] [PMC free article] [PubMed] [Google Scholar]
- [92].Birch DG, Birch EE, Hoffman DR, Uauy RD, Invest. Ophthalmol. Visual Sci. 1992, 33, 2365–76. [PubMed] [Google Scholar]
- [93].Benolken RM, Anderson RE, Wheeler TG, Science 1973, 182, 1253–4, 10.1126/science.182.4118.1253. [DOI] [PubMed] [Google Scholar]
- [94].Sieving PA, Richards JE, Naarendorp F, Bingham EL, Scott K, Alpern M, Proc. Natl. Acad. Sci. USA 1995, 92, 880–4, 10.1073/pnas.92.3.880. [DOI] [PMC free article] [PubMed] [Google Scholar]
- [95].Sieving PA, Fowler ML, Bush RA, Machida S, Calvert PD, Green DG, Makino CL, McHenry CL, Neurosci J. 2001, 21, 5449–60, 10.1523/JNEUROSCI.21-15-05449.2001. [DOI] [PMC free article] [PubMed] [Google Scholar]
- [96].Redmond TM, Yu S, Lee E, Bok D, Hamasaki D, Chen N, Goletz P, Ma JX, Crouch RK, Pfeifer K, Nat. Genet. 1998, 20, 344–51, 10.1038/3813. [DOI] [PubMed] [Google Scholar]
- [97].Cideciyan AV, Prog. Retinal Eye Res. 2010, 29, 398–427, 10.1016/j.preteyeres.2010.04.002. [DOI] [PMC free article] [PubMed] [Google Scholar]
- [98].Skiba NP, Spencer WJ, Salinas RY, Lieu EC, Thompson JW, Arshavsky VY, J. Proteome Res. 2013, 12, 3010–8, 10.1021/pr4003678. [DOI] [PMC free article] [PubMed] [Google Scholar]
- [99].Goldstein O, Zangerl B, Pearce-Kelling S, Sidjanin DJ, Kijas JW, Felix J, Acland GM, Aguirre GD, Genomics 2006, 88, 541–50, 10.1016/j.ygeno.2006.05.013. [DOI] [PMC free article] [PubMed] [Google Scholar]
- [100].Downs LM, Hitti R, Pregnolato S, Mellersh CS, Vet. Ophthalmol. 2014, 17, 126–30, 10.1111/vop.12122. [DOI] [PubMed] [Google Scholar]
- [101].Spencer WJ, Ding JD, Lewis TR, Yu C, Phan S, Pearring JN, Kim KY, Thor A, Mathew R, Kalnitsky J, Hao Y, Travis AM, Biswas SK, Lo WK, Besharse JC, Ellisman MH, Saban DR, Burns ME, Arshavsky VY, Proc. Natl. Acad. Sci. USA 2019, 116, 13087–13096, 10.1073/pnas.1906421116. [DOI] [PMC free article] [PubMed] [Google Scholar]
- [102].Oesterhelt F, Oesterhelt D, Pfeiffer M, Engel A, Gaub HE, Müller DJ, Science 2000, 288, 143–6. [DOI] [PubMed] [Google Scholar]
- [103].Zocher M, Bippes CA, Zhang C, Muller DJ, Chem. Soc. Rev. 2013, 42, 7801–15, 10.1039/c3cs60085h. [DOI] [PubMed] [Google Scholar]
- [104].Sapra KT, Park PS, Filipek S, Engel A, Muller DJ, Palczewski K, J. Mol. Biol. 2006, 358, 255–69. [DOI] [PubMed] [Google Scholar]
- [105].Park PS, Sapra KT, Jastrzebska B, Maeda T, Maeda A, Pulawski W, Kono M, Lem J, Crouch RK, Filipek S, Muller DJ, Palczewski K, Biochemistry 2009, 48, 4294–304, 10.1021/bi900417b. [DOI] [PMC free article] [PubMed] [Google Scholar]
- [106].Park PS, Sapra KT, Kolinski M, Filipek S, Palczewski K, Muller DJ, J. Biol. Chem. 2007, 282, 11377–85. [DOI] [PMC free article] [PubMed] [Google Scholar]
- [107].Sapra KT, Park PS, Palczewski K, Muller DJ, Langmuir 2008, 24, 1330–7, 10.1021/la702299z. [DOI] [PMC free article] [PubMed] [Google Scholar]
- [108].Zocher M, Fung JJ, Kobilka BK, Muller DJ, Structure 2012, 20, 1391–402, 10.1016/j.str.2012.05.010. [DOI] [PMC free article] [PubMed] [Google Scholar]
- [109].Spoerri PM, Kato HE, Pfreundschuh M, Mari SA, Serdiuk T, Thoma J, Sapra KT, Zhang C, Kobilka BK, Muller DJ, Structure 2018, 26, 829–838.e4, 10.1016/j.str.2018.03.020. [DOI] [PubMed] [Google Scholar]
- [110].Shen G, Li S, Cui W, Liu S, Yang Y, Gross M, Li W, Biochemistry 2018, 57, 286–294, 10.1021/acs.biochem.7b00874. [DOI] [PMC free article] [PubMed] [Google Scholar]
- [111].Carpenter EP, Beis K, Cameron AD, Iwata S, Curr. Opin. Struct. Biol. 2008, 18, 581–6, 10.1016/j.sbi.2008.07.001. [DOI] [PMC free article] [PubMed] [Google Scholar]
- [112].Zhou Y, Meng J, Xu C, Liu J, Front Cell Dev Biol 2021, 9, 611443, 10.3389/fcell.2021.611443. [DOI] [PMC free article] [PubMed] [Google Scholar]
- [113].Shimada I, Ueda T, Kofuku Y, Eddy MT, Wuthrich K, Nat. Rev. Drug Discovery 2019, 18, 59–82, 10.1038/nrd.2018.180. [DOI] [PMC free article] [PubMed] [Google Scholar]
- [114].Ritter SL, Hall RA, Nat. Rev. Mol. Cell Biol. 2009, 10, 819–30, 10.1038/nrm2803. [DOI] [PMC free article] [PubMed] [Google Scholar]
- [115].Beerkens BLH, Koc C, Liu R, Florea BI, Le Devedec SE, Heitman LH, AP IJ, van der Es D, ACS Chem. Biol. 2022, 17, 3131–3139, 10.1021/acschembio.2c00589. [DOI] [PMC free article] [PubMed] [Google Scholar]
- [116].Tian H, Furstenberg A, Huber T, Chem. Rev. 2017, 117, 186–245, 10.1021/acs.chemrev.6b00084. [DOI] [PubMed] [Google Scholar]
- [117].Joseph MD, Tomas Bort E, Grose RP, McCormick PJ, Simoncelli S, Biomol. Eng. 2021, 11, 1503, 10.3390/biom11101503. [DOI] [PMC free article] [PubMed] [Google Scholar]
- [118].Calebiro D, Sungkaworn T, Trends Pharmacol. Sci. 2018, 39, 109–122, 10.1016/j.tips.2017.10.010. [DOI] [PubMed] [Google Scholar]
- [119].Calebiro D, Rieken F, Wagner J, Sungkaworn T, Zabel U, Borzi A, Cocucci E, Zurn A, Lohse MJ, Proc. Natl. Acad. Sci. USA 2013, 110, 743–8, 10.1073/pnas.1205798110. [DOI] [PMC free article] [PubMed] [Google Scholar]
- [120].Wang X, Senapati S, Akinbote A, Gnanasambandam B, Park PS, Senyo SE, Acta Biomater. 2020, 113, 380–392, 10.1016/j.actbio.2020.06.032. [DOI] [PMC free article] [PubMed] [Google Scholar]
- [121].Wang X, Pierre V, Senapati S, Park PS, Senyo SE, Front Cardiovasc Med 2021, 8, 773978, 10.3389/fcvm.2021.773978. [DOI] [PMC free article] [PubMed] [Google Scholar]
- [122].Rico F, Rigato A, Picas L, Scheuring S, Nanobiotechnol J. 2013, 11 Suppl 1, S3, 10.1186/1477-3155-11-S1-S3. [DOI] [PMC free article] [PubMed] [Google Scholar]
- [123].Rico F, Roca-Cusachs P, Gavara N, Farre R, Rotger M, Navajas D, Phys. Rev. E 2005, 72, 021914, 10.1103/PhysRevE.72.021914. [DOI] [PubMed] [Google Scholar]
- [124].Fuhrmann A, Staunton JR, Nandakumar V, Banyai N, Davies PC, Ros R, Phys. Biol. 2011, 8, 015007, 10.1088/1478-3975/8/1/015007. [DOI] [PMC free article] [PubMed] [Google Scholar]
- [125].Dong M, Husale S, Sahin O, Nat. Nanotechnol. 2009, 4, 514–7, 10.1038/nnano.2009.156. [DOI] [PubMed] [Google Scholar]
- [126].Poma AB, Chwastyk M, Cieplak M, Phys. Chem. Chem. Phys. 2017, 19, 28195–28206, 10.1039/c7cp05269c. [DOI] [PubMed] [Google Scholar]
- [127].Choe HW, Kim YJ, Park JH, Morizumi T, Pai EF, Krauss N, Hofmann KP, Scheerer P, Ernst OP, Nature 2011, 471, 651–5, 10.1038/nature09789. [DOI] [PubMed] [Google Scholar]
- [128].Melia TJ Jr., Cowan CW, Angleson JK, Wensel TG, Biophys. J. 1997, 73, 3182–91 10.1016/S0006-3495(97)78344-9. [DOI] [PMC free article] [PubMed] [Google Scholar]
- [129].Fan J, Woodruff ML, Cilluffo MC, Crouch RK, Fain GL, Physiol J. 2005, 568, 83–95, 10.1113/jphysiol.2005.091942. [DOI] [PMC free article] [PubMed] [Google Scholar]
- [130].Colozo AT, Vasudevan S, Park PS, Hum. Mol. Genet. 2020, 29, 881–891, 10.1093/hmg/ddaa008. [DOI] [PMC free article] [PubMed] [Google Scholar]
- [131].Spalding TA, Burstein ES, Wells JW, Brann MR, Biochemistry 1997, 36, 10109–16 10.1021/bi970565g. [DOI] [PubMed] [Google Scholar]
- [132].Samama P, Cotecchia S, Costa T, Lefkowitz RJ, J. Biol. Chem. 1993, 268, 4625–36. [PubMed] [Google Scholar]
- [133].Seifert R, Wenzel-Seifert K, Naunyn-Schmiedeberg’s Arch. Pharmacol. 2002, 366, 381–416, 10.1007/s00210-002-0588-0. [DOI] [PubMed] [Google Scholar]
- [134].Rajagopal S, Rajagopal K, Lefkowitz RJ, Nat. Rev. Drug Discovery 2010, 9, 373–86, 10.1038/nrd3024. [DOI] [PMC free article] [PubMed] [Google Scholar]
- [135].Park PS, Curr. Med. Chem. 2012, 19, 1146–54, 10.2174/092986712799320619. [DOI] [PMC free article] [PubMed] [Google Scholar]
- [136].Kobilka BK, Deupi X, Trends Pharmacol. Sci. 2007, 28, 397–406, 10.1016/j.tips.2007.06.003. [DOI] [PubMed] [Google Scholar]
- [137].Costa-Neto CM, Parreiras ESLT, Bouvier M, Mol. Pharmacol. 2016, 90, 587–595, 10.1124/mol.116.105940. [DOI] [PubMed] [Google Scholar]
- [138].Zvyaga TA, Fahmy K, Siebert F, Sakmar TP, Biochemistry 1996, 35, 7536–45 10.1021/bi960391n. [DOI] [PubMed] [Google Scholar]
- [139].Kim JM, Altenbach C, Kono M, Oprian DD, Hubbell WL, Khorana HG, Proc. Natl. Acad. Sci. USA 2004, 101, 12508–13, 10.1073/pnas.0404519101. [DOI] [PMC free article] [PubMed] [Google Scholar]