

Abstract
BACKGROUND:
Veterinarians appear to be at risk for work-related musculoskeletal discomfort (MSD), based on surveys conducted outside the US.
OBJECTIVE:
This study provides new information about MSD prevalence in veterinarians and veterinary technicians in the US.
METHODS:
Cross-sectional survey and observation.
RESULTS:
A survey of 56 veterinarians and 38 veterinary technicians in Ohio found 12-month prevalence of MSD exceeded 60% in the neck, low back, and legs/feet. More than 85% of participants reported that work activities exacerbated discomfort in at least one region. Less than one-third of participants reported symptom-related lost work time. Personal and work-related burnout scores were higher for veterinary technicians, compared with veterinarians. Nine percent of observed work activities performed by veterinarians and 43% performed by veterinary technicians were rated high or very high risk.
CONCLUSIONS:
High prevalence of MSD and low lost work time suggest many individuals are working in pain. Increased adoption of existing ergonomics solutions (equipment and process changes), in addition to further investigation of unmet needs, could improve working conditions and reduce musculoskeletal stress in veterinary health professions.
Keywords: Musculoskeletal discomfort, veterinarian, veterinary technician, veterinary technologist, veterinary nurse, ergonomics
1. INTRODUCTION
Researchers have done a good job of drawing attention to the problem of work-related musculoskeletal symptoms and injuries in nurses [1, 2], occupational and physical therapists [3], imaging technologists [4], and other human healthcare professions, as well as associated risk factors [5–7]. Much research has also been published on interventions to address many of those risk factors [8–13]. Far less investigation has been conducted in the veterinary health professions, yet anyone who has taken an animal to a veterinarian has likely witnessed the awkward postures and forceful grips that veterinarians and veterinary technicians adopt when performing physical examinations, drawing blood, or performing other procedures that can be observed by a client.
Elevated prevalence of work-related musculoskeletal disorders and discomfort has been reported for veterinarians in New Zealand [14], Australia [15], and Germany [16]; in all three studies prevalence of symptoms exceeded 50% in the low back and neck. Symptoms in some body parts were reported to be severe enough to interfere with work activities in over a quarter of the respondents (neck, shoulder [16]; neck, shoulder, hand-wrist, low back [14]). Specific work activities, such as more time working in awkward and tiring positions [14], psychosocial work factors, such as quantitative workload [16], and personal factors, such as burnout [16] were found to be statistically associated with MSD symptoms. Much of the injury research on veterinarians working in the USA has not focused on musculoskeletal discomfort (MSD) but has included a large scope of hazards associated with acute injury, with some inclusion of risk factors for MSD [17]. MSD research in veterinary medicine in the USA has been limited to specific areas of practice such as dentistry, sonography, and spay-neuter surgery [18–21]. Additionally, there is a paucity of research that has conducted postural, biomechanical, or task analysis [22] to better understand MSD hazards and risk mitigation in veterinary work. No such studies have focused on MSD in veterinary technicians and few have reported on any work-related health matters concerning vet techs [23–25].
The present study sought to contribute to the base of knowledge about MSD in veterinary workers in the USA through conduct of a survey to determine prevalence of MSD symptoms among veterinarians and veterinary technicians in Ohio and to identify potential risk factors through the survey and onsite observation. The hypotheses of this study are that registered veterinarians in Ohio will demonstrate similar prevalence of MSD as found in previous international studies, risk factors will vary by practice type and veterinary procedures, and that veterinary technicians will demonstrate high prevalence of MSD similar to veterinarians.
2. MATERIALS AND METHODS
2.1. Study Design.
This study consisted of two phases: a survey of veterinarians and veterinary technicians (vet techs) and observations of work being performed by veterinarians and vet techs to assess work postures and other exposures. The study was approved by the university’s Institutional Review Board.
2.2. Participants.
Eligibility requirements to participate included being a registered veterinarian or veterinary technician in the state of Ohio and working in the veterinary medicine field for 12 months or more prior to the study. This period of time coincided with the time frame referenced in the questionnaire for work task exposures and musculoskeletal symptoms. Veterinary personnel were recruited to participate in the online survey through multiple methods, including electronic newsletters published and distributed by the Ohio Veterinary Medical Association (OVMA) and the Ohio Association of Veterinary Technicians (OAVT) to their members on a regular basis. Additionally, veterinarians and vet techs working at Ohio veterinary clinics and hospitals that provided email contact information on their public websites were invited, via email, to participate in the survey. “Snowball sampling” was also utilized; within the emails, the researchers invited potential participants to share the study information and survey link with colleagues who also met the criteria by including the following wording: “Please feel free to share the information about this study with your colleagues at other facilities.”
Individuals who completed the survey were asked, at the end of the questionnaire, if they would be willing to consider participating in an observational assessment of their daily work tasks (Phase 2 of the study). Those who were willing provided their contact information and a researcher followed up with them to explain the second part of the study. To move forward, the researcher requested permission from the clinic owner/manager to come onsite and scheduled time to observe. Prior to beginning the observation, all participants were asked to read and sign an IRB-approved written consent document.
2.3. Questionnaire – Data Collection.
For Phase One, participants completed an online questionnaire on either their personal computers or mobile devices. The questionnaire consisted of six sections: A. Work History (type of practice, number of veterinarians and veterinary technicians at the practice, length of employment, work schedule, frequency and number of procedures, and frequency of various activities; basis for questions included the report by Scuffham et al. [14]), B. Musculoskeletal Health (modified Nordic Questionnaire [26]), C. Hand Health (hand diagram, specific symptoms, frequency and intensity of symptoms [21, 27]), D. Eye and Other Health Issues (eye health, headaches, and other health conditions [27, 28]), E. Psychosocial Aspects of Work (included sections of the Copenhagen Psychosocial Questionnaire [29] that assessed quantitative demands, emotional demands, and demands for hiding emotions; the Copenhagen Burnout Inventory [30] which assessed personal burnout, work-related burnout, and client-related burnout; and scales assessing supervisor and coworker support [31], job control [32], and job satisfaction [33]), and F. Demographic Information (Table 1). To access the online questionnaire, participants were given a link (a URL) to a webpage that provided a brief introduction to the study and a consent form which they were asked to read and ‘Accept’; then the website took them to the questionnaire.
Table 1:
Demographics of survey participants
| Variables | Veterinarian n=56 |
Veterinary Technician n=38 |
|
|---|---|---|---|
| Gender | Female | 43 | 35 |
| Male | 13 | 2 | |
| Transgender Male | - | 1 | |
| Age, years | <35 | 9 | 19 |
| 35–44 | 21 | 11 | |
| 45–54 | 8 | 5 | |
| 55+ | 17 | 3 | |
| No response | 1 | - | |
| Race | White | 54 | 36 |
| Multi-racial | 2 | 2 | |
| Height, cm mean (sd) |
Female | 166.0 (7.0) | 167.3 (8.7) |
| Male | 178.6 (8.4) | 189.2 (16.2) | |
| Weight, kg mean (sd) |
Female | 74.3 (19.0) | 82.5 (18.8) |
| Male | 93.6 (23.7) | 110.2 (17.3) | |
| Job Experience, years mean (sd) |
14.7 (11.3) | 8.5 (6.1) | |
2.4. Questionnaire – Data Analysis.
Data from veterinarians and vet techs and from each section (A-F) of the questionnaire were initially analyzed separately (univariate or frequency analysis), followed by comparisons between veterinarians and veterinary technicians (t-test, (independent samples) or chi-sqr test) and assessments of associations between specific factors including job satisfaction, burnout, and support (Pearson correlation). Analysis of the questionnaire data was completed using SAS and Microsoft ExcelFN1.
2.5. Observation - Data Collection.
For Phase Two, researchers (authors KS and CS) observed the research participants. A participant was by followed and observed as they performed their work tasks (whatever they were scheduled or asked to do during the observation period), in order to gather data on work postures and other potential workplace hazards. Researchers asked clarification questions about the job and processes where necessary but did not interrupt or attempt to modify work tasks. Participants were observed for 2 – 4 hours to capture representative tasks for the main areas of work in clinic exam rooms, surgery (including dental and other procedures conducted outside of the exam rooms), and computer/administrative work. Researchers took field notes, photographs, and video-recordings throughout the observations. A worksheet was used to capture details about the work setting including type of office/work area, size of exam room/work stall, type of animal, compliance of the animal, where the animal was examined (on the floor or on an exam table), type of procedure/exam, number of additional workers present, type of equipment present, type of equipment utilized, and other hazards present.
2.6. Observation - Data Analysis.
Post-observation, the video-recorded and photographed work postures were assessed using Rapid Entire Body Assessment (REBA), an observation tool that assigns risk scores based on awkwardness/stressfulness of the observed working posture, and which has been used to study a range of healthcare occupations and tasks [34–39] and animal-related operations [40]. The tasks that were analyzed were representative of the tasks the participant performed during the time they were being observed. The analyzed postures that represented those tasks were the postures that were the most frequently repeated or maintained the longest, in other words, the posture that was representative of the task as that person performed that task. This is consistent with recommendations for choosing postures to analyze as provided by the developers of REBA [39]. Some studies focus on the most extreme postures [38] or most strenuous [36], but our objective was to describe postures that were representative of what we observed as typical, rather than worst case. A total of five REBA analyses were performed for each participant covering representative tasks observed throughout the observation period. In the REBA assessment system, the REBA score for a given combination of task and posture is calculated by combining a neck, trunk, and leg posture score (range from 1 to 9) with an arm and wrist posture score (range from 1 to 9). Posture scores are then combined with scoring for muscle force and hand/object coupling to create an intermediate score between 1 and 12, to which is then added a ‘nature of activity’ score (repetitive, static, large motions; range from 0 to 3) to calculate the final REBA score. The final REBA score is then binned into one of the five risk/action levels. Main categories of representative tasks that were analyzed using REBA included physical exams, computer work, writing notes/talking to clients, administering medication, surgery, handling/restraining animals and adjustments.
3. RESULTS
3.1. Questionnaire Results
3.1.1. Study participants.
110 respondents started the questionnaire, but due to incomplete data, 94 were deemed complete for data analysis. Fifty-six veterinarians participated, which included 43 female veterinarians (77%) and 13 male veterinarians; in comparison, 62% of the members of the American Veterinary Medical Association are female [41]. Thirty-eight veterinary technicians participated, which included 35 females (92%), 2 males, and 1 transgender male (Table 1); similarly, 95% of veterinary technicians responding to a national demographic survey were female [42]. Participants were asked to report one region of Ohio where they primarily worked, and the majority (51%) of participants, combining veterinarians and vet techs, reported working in the Central region of Ohio. In contrast, about 25% of “Veterinary Services Employment” was reported recently to be located in Central Ohio [43]. The remaining participants were spread throughout the state. Veterinarian and veterinary technician participants primarily reported working at small animal practices (75% and 89%, respectively). By contrast, 56% of veterinarians in Ohio are reported to work in companion animal practices [43], which is somewhat lower than the 67% for US veterinarians overall [41].
3.1.2. Work factors.
Both veterinarians and veterinary technicians were asked questions about the number of procedures they perform per year from a list referenced from a large survey of New Zealand veterinarians [14]. In the current study, to make estimating the number of procedures per year easier, participants were asked to select a frequency (daily, weekly, monthly, seasonally/annually, or never) and then to estimate the number of procedures performed at that selected frequency. Response rate for selecting the frequency was high, but not all participants reported the number of procedures. The numbers of procedures were grouped into the following categories based on the study by Scuffham et al. [14] : 0, 1–600, 601–2,400, and > 2,400 procedures per year and “no response”, if the participant chose a frequency response but did not provide an estimate of quantity (Figure 1).
Figure 1.
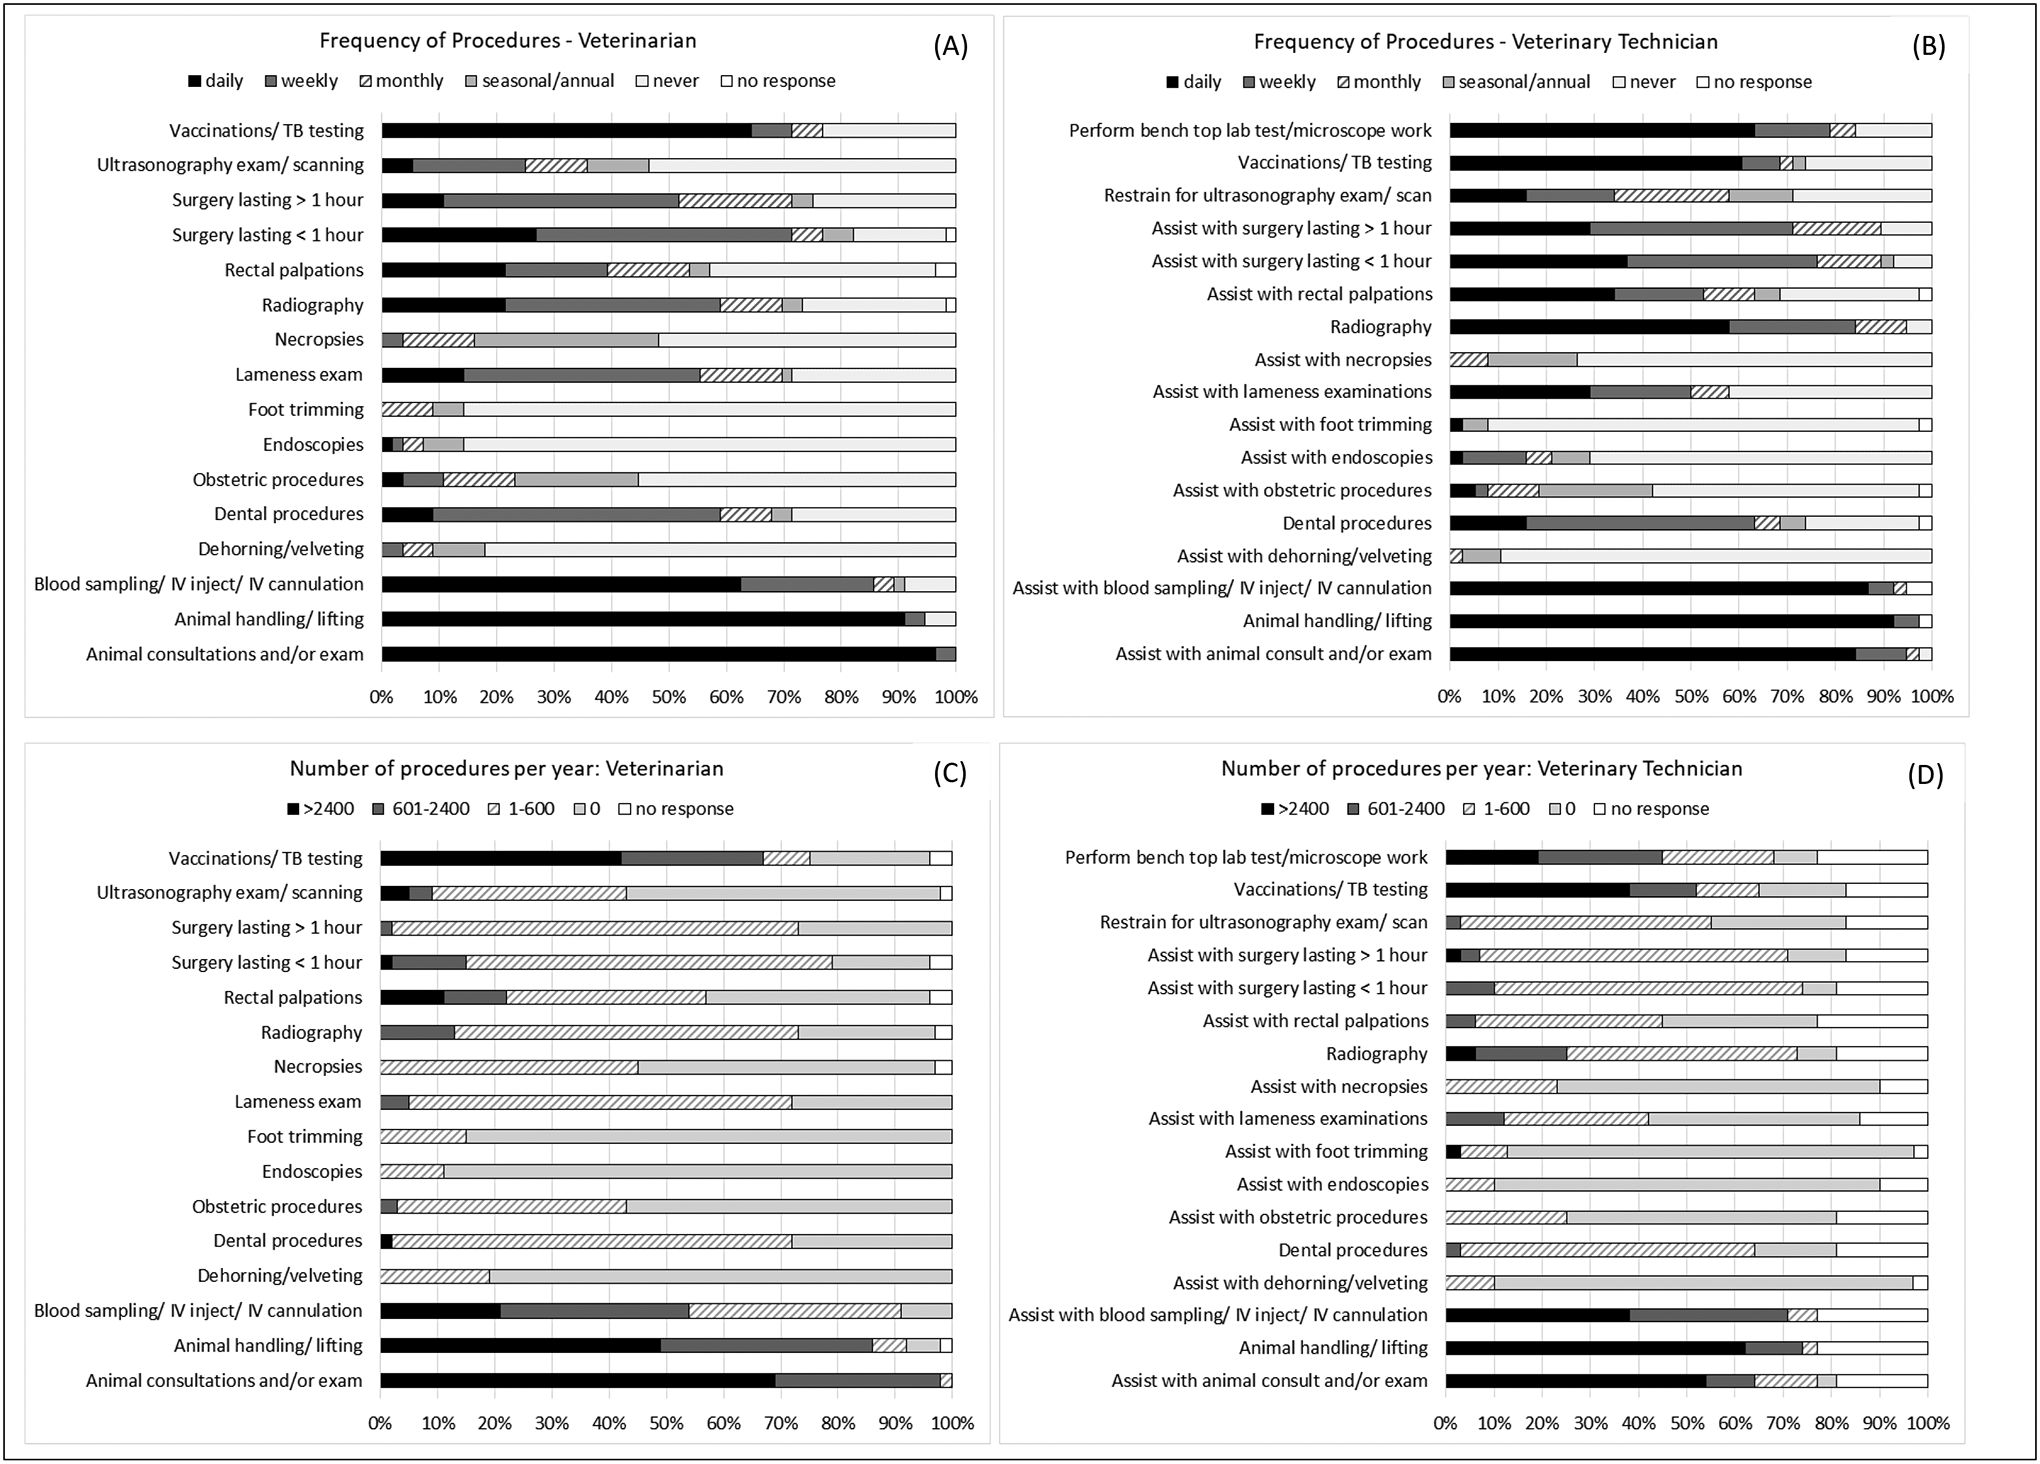
Frequency of performing procedures for veterinarians (A), veterinary technicians (B); Number of procedures per year for veterinarians (C), veterinary technicians (D).
Participants were asked about the portion of their days, on average, that they spent in or experienced various work conditions and activities that could be considered hazardous (Table 2). Due to small quantities in some response categories, some categories were combined (one-quarter with half and three-quarters with almost always), to yield three categories (never/rarely, half, and almost always) for statistical analysis. Statistically significant differences (chi-sqr frequency analysis, p<0.05) were found between veterinarians and veterinary technicians for time spent engaged in several activities: awkward grip or hand movements, exposure to loud noise, lifting, standing, and working at high speed. Larger proportions of vet tech participants reported more exposure to these activities in comparison to the veterinarians.
Table 2.
Frequency of work activities experienced during an average day, by occupation.
| Exposure Frequencya | ||||||||
|---|---|---|---|---|---|---|---|---|
| Total responses | Never/rarely | About Half | Almost always | |||||
| Work Activities | Vet, n | Vet tech, n | Vet n (%) |
Vet tech n (%) |
Vet n (%) |
Vet tech n (%) |
Vet n (%) |
Vet tech n (%) |
| Awkward or tiring positions | 55 | 38 | 10 (18) | 1 (3) | 33 (60) | 24 (63) | 12 (22) | 13 (34) |
| Awkward grip or hand movements* | 56 | 38 | 15 (27) | 3 (8) | 32 (57) | 23 (61) | 9 (16) | 12 (32) |
| Boring work | 56 | 38 | 38 (68) | 18 (47) | 17 (30) | 20 (53) | 1 (2) | 0 (0) |
| Carrying out repetitive tasks | 56 | 37 | 10 (18) | 2 (5) | 37 (66) | 24 (65) | 9 (16) | 11 (30) |
| Computer work | 56 | 38 | 6 (11) | 3 (8) | 39 (70) | 23 (61) | 11 (20) | 12 (32) |
| Exposure to loud noise*** | 56 | 38 | 28 (50) | 9 (24) | 24 (43) | 14 (37) | 4 (7) | 15 (39) |
| Lifting*** | 56 | 38 | 5 (9) | 0 (0) | 43 (77) | 11 (29) | 8 (14) | 27 (71) |
| Standing** | 56 | 38 | 2 (4) | 0 (0) | 24 (43) | 5 (13) | 30 (54) | 33 (87) |
| Sitting | 56 | 38 | 11 (20) | 11 (29) | 42 (75) | 21 (55) | 3 (5) | 6 (16) |
| Using tools that vibrate | 56 | 37 | 35 (63) | 18 (49) | 21 (38) | 17 (46) | 0 (0) | 2 (5) |
| Working in cold/damp environments | 56 | 38 | 44 (79) | 28 (74) | 10 (18) | 9 (24) | 2 (4) | 1 (3) |
| Working at high speed** | 56 | 38 | 18 (32) | 2 (5) | 24 (43) | 15 (39) | 14 (25) | 21 (55) |
| Working in hot/warm environments | 56 | 38 | 29 (52) | 19 (50) | 21 (38) | 13 (34) | 6 (11) | 6 (16) |
| Working outside | 56 | 38 | 45 (80) | 33 (87) | 7 (13) | 5 (13) | 4 (7) | 0 (0) |
| Working to tight deadlines | 54 | 36 | 13 (24) | 11 (31) | 24 (44) | 16 (44) | 17 (31) | 9 (25) |
Note:
p<0.05,
p<0.01,
p<0.001, indicate significant differences between veterinarians and veterinary technicians based on Chi-Square test
Self-reported on questionnaire in response to the question stem: During an average day, what fraction of your work involves the following activities?
3.1.3. MSD Symptoms.
12-month period prevalence of musculoskeletal discomfort was 100% for veterinarians and vet techs; every participant reported experiencing symptoms within the prior 12 months in at least one body region. For both professions, the median number of body regions for which they were reporting symptoms was 4 and the mode was 3. For both groups, 12 month prevalence exceeded 60% in the neck, low back, and legs/feet, and 7-day symptom prevalence exceeded 30% in those same regions for both groups (Figure 2).
Figure 2:
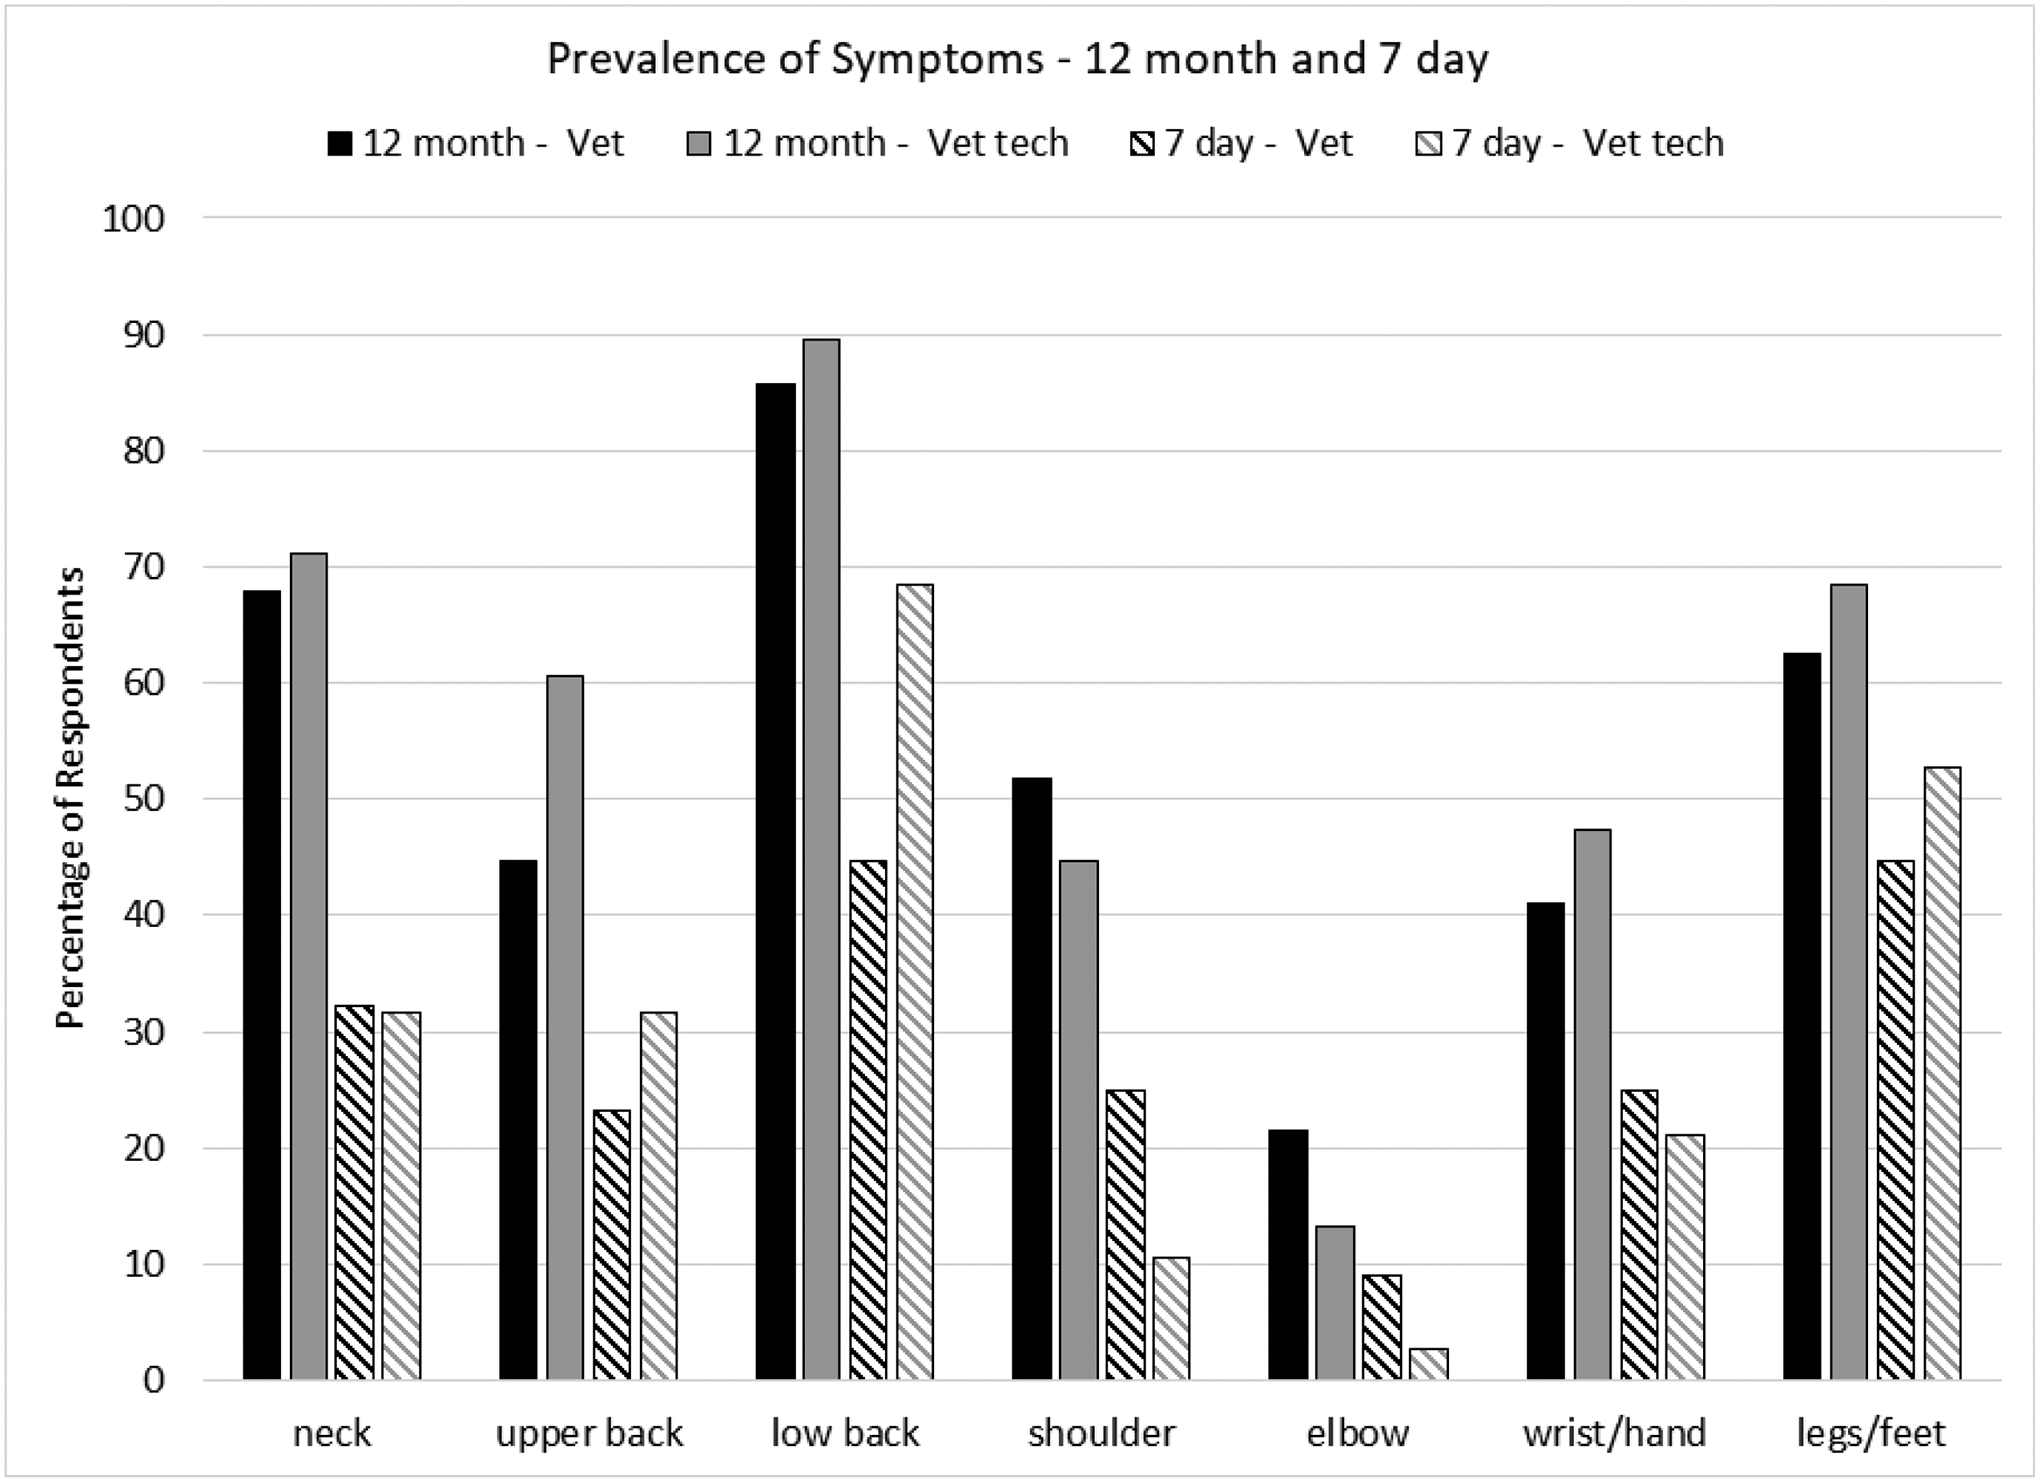
12-month and 7 day prevalence of discomfort by body region for veterinarians and veterinary technicians
More than half of the veterinarians (57%) and veterinary technicians (58%) reported that musculoskeletal symptoms had prevented them from doing normal daily activities, on or off the job. Large majorities of veterinarians (86%) and vet techs (97%) reported that work activities made their discomfort worse in at least one body region, yet only 18% of veterinarians and about one-third of veterinary technicians (32%) reported lost work time due to musculoskeletal discomfort. Work exacerbated MSD symptoms in the upper back, lower back, shoulders, wrist/hand, and legs/feet in more than 60% of the veterinarians and more than 70% of the vet techs who experienced symptoms in those areas (Figure 3).
Figure 3:
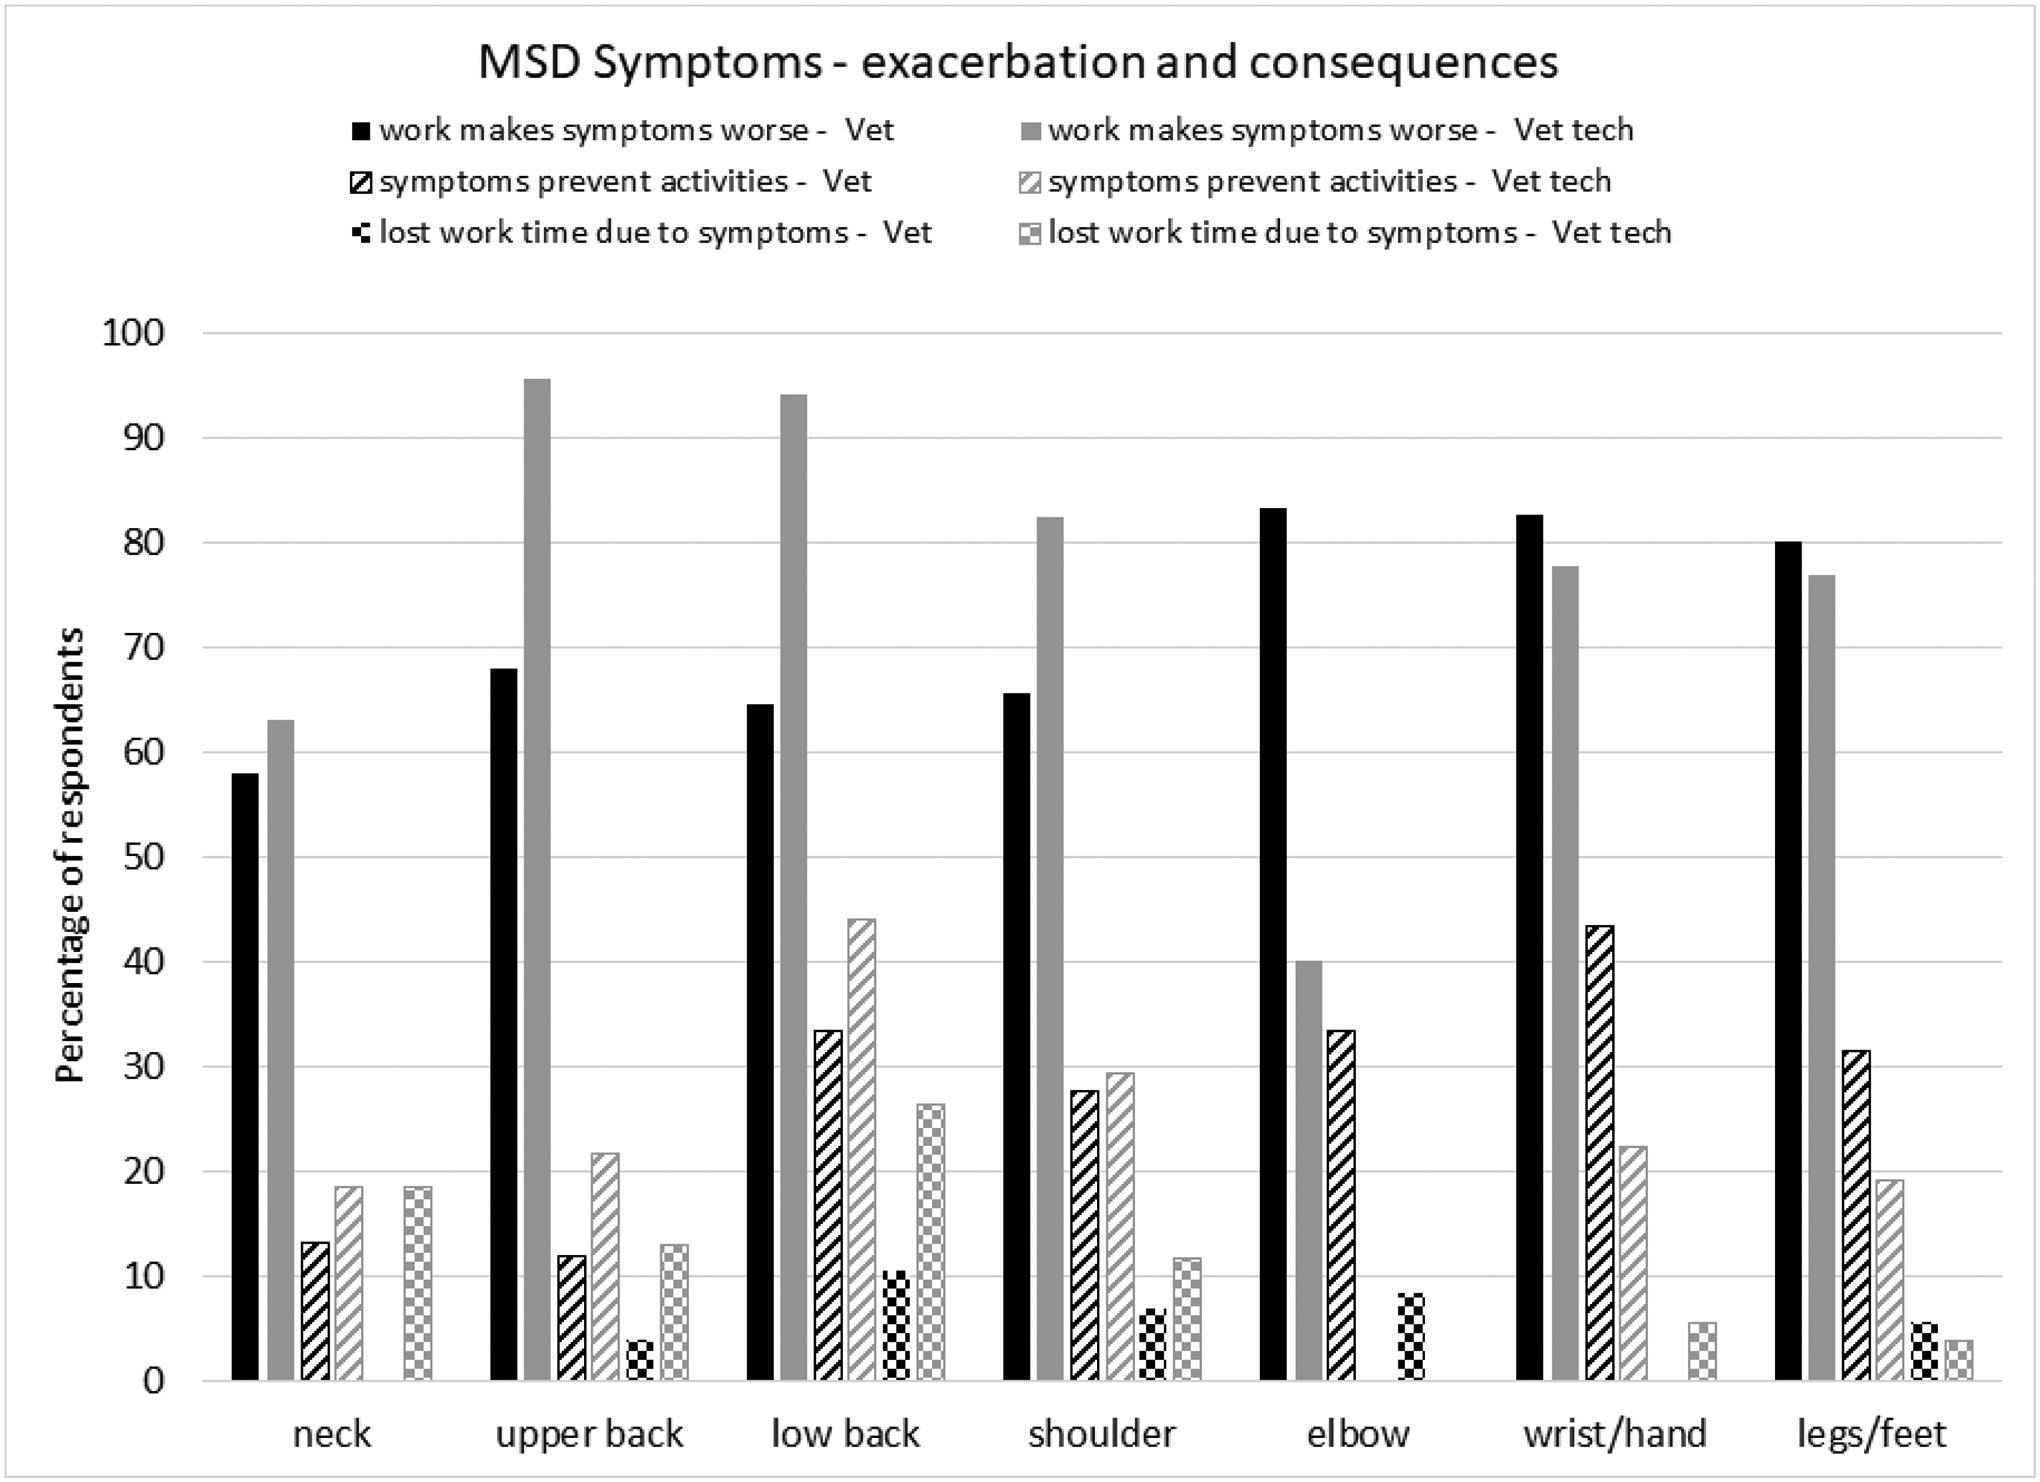
Discomfort made worse by work activities and consequences of MSD symptoms, for veterinarians and veterinary technicians (percentages based on subset reporting 12-month prevalence in the respective body part)
3.1.4. Psychosocial factors.
The mean scores for all of the psychosocial factors are presented in Table 3, for veterinarians and veterinary technicians. For the Copenhagen Burnout Inventory (CBI) scales [30] and the Copenhagen Psychosocial Questionnaire (CPQ) scales [29] higher scores indicate high burnout levels and higher demands, respectively. Higher scores on the other psychosocial scales, supervisor and coworker support [31], job control [32], and job satisfaction [33] indicate more positive perceptions of those work factors. Using the t-test to compare veterinarian and veterinary technician scores for the various psychosocial factors, only personal burnout (42.5 and 62.5, p=0.0009) and work-related burnout (43.9 and 55.3, p=0.048) were found to be higher for vet techs. Other differences in scores were not statistically significant. Psychosocial factor scores are summarized in Table 3.
Table 3.
Summary of psychosocial factor scores by occupation
| Scale | Veterinarian mean (sd) | Veterinary Technician mean (sd) | ||
|---|---|---|---|---|
| Personal Burnout***,† | CBI | 0–100 | 42.5 (23.3) | 62.5 (20.4) |
| Work-related Burnout*,† | 43.9 (26.3) | 55.3 (22.7) | ||
| Client-related Burnout† | 38.5 (26.1) | 32.1 (19) | ||
| Quantitative Demands† | CPQ | 0–100 | 54.1 (18.6) | 54.8 (17.1) |
| Emotional Demands† | 58.3 (22.2) | 55.9 (20.4) | ||
| Demands for Hiding Emotions† | 38.2 (22.9) | 35.8 (26.8) | ||
| Supervisor Support‡ | 1 – 4 | 2.3 (0.8) | 2.1 (0.7) | |
| Coworker Support‡ | 1 – 5 | 3.3 (0.7) | 3.0 (0.8) | |
| Job Control‡ | 1 – 4 | -a | 2.1 (0.7) | |
| Job Satisfaction‡ | 1 – 5 | 3.6 (1.3) | 3.3 (0.9) | |
Note:
p<0.05,
p<0.01,
p<0.001
Higher value indicates more burnout, demands
Higher value indicates higher levels of perceived support, control, and satisfaction
only veterinary technicians were asked about job control
With regards to job satisfaction and co-worker support, veterinarians and veterinary technicians had mean scores that were at or above the midpoint of those scales. Mean scores for job control and supervisor support were slightly below the midpoint of those scales. Job satisfaction in veterinarians was found to be negatively correlated with personal burnout, work-related burnout, and client-related burnout (r = −0.672, p<0.0001; r= −0.783, p<0.0001; and r = −0.712, p<0.0001, respectively), and also with quantitative demands, emotional demands, and demands for hiding emotions (r = −0.377, p=0.0042; r = −0.566, p<0.0001; and r = −0.444, p = 0.0007, respectively); co-worker and supervisor support were not correlated with job satisfaction for veterinarians. Conversely, co-worker and supervisor support were positvely correlated with job satisfaction for vet techs (r=0.361, p=0.0304; r=0.389, p=0.0173, respectively), while only work-related burnout was negatively correlated with job satisfaction for them (r= −0.462, p=0.0035). While 49% of responding veterinarians and 42% of responding veterinary technicians would strongly recommend their profession to a friend considering it, the breakdown by age group appears to show some differences (Figure 4).
Figure 4:
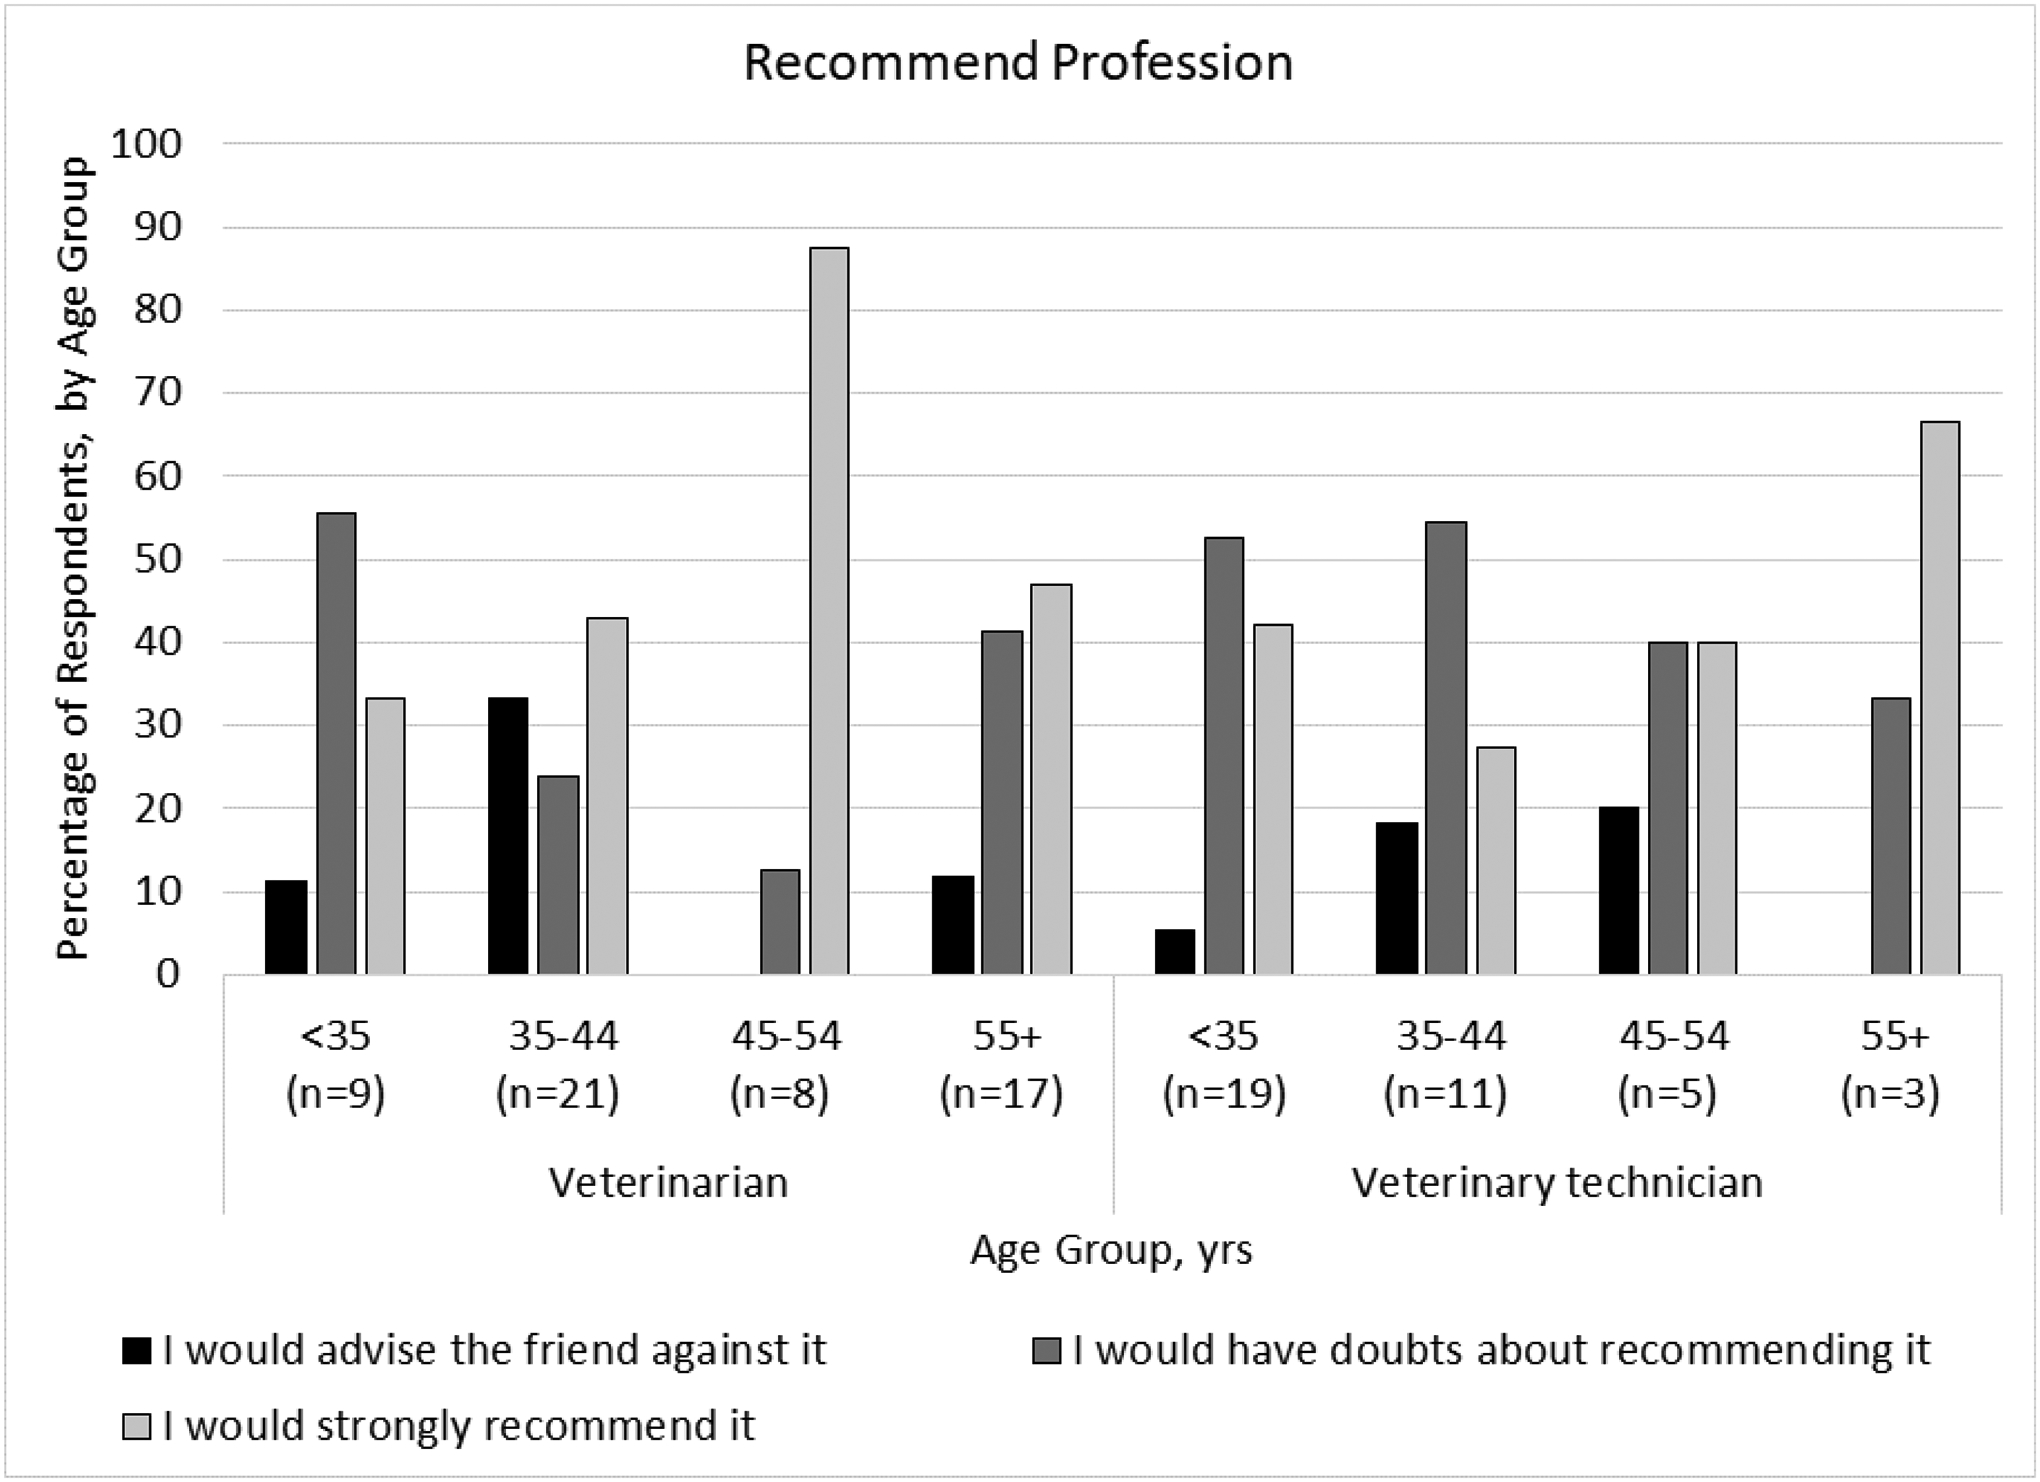
Recommendation of profession by age group for veterinarians and veterinary technicians (missing age data for one veterinarian).
3.2. Observation Results
3.2.1. Study participants.
Twenty-eight survey respondents (21 veterinarians and 7 veterinary technicians) indicated on the survey that they were willing to be contacted about the observational part of the study. When contacted, five decided they were not interested in participating. We were able to schedule observation times for 12 individuals. Three others were interested, but were not able to find a time for observation that worked for them. Eight of the 28 did not respond when we attempted to contact them. Three additional participants were recruited on site, for a total of 15. Of the 15 participants observed for Phase Two, seven were female veterinarians, two were male veterinarians, and six were female veterinary technicians. Of the veterinarians, two worked at mixed animal practices while the remaining seven worked at small animal practices. Of the veterinary technicians, two worked in large animal (equine) practices and four worked in small animal practices. See Table 4 for basic demographic information about the Phase Two participants.
Table 4.
Demographics of observation study participants
| Variables | Veterinarian n=9 |
Veterinary Technician n=6* |
|
|---|---|---|---|
| Gender | Female | 7 | 6 |
| Male | 2 | 0 | |
| Age (years) | <30 | 0 | 2 |
| 30–39 | 2 | 1 | |
| 40–49 | 3 | 2 | |
| >50 | 4 | - | |
| Race | White | 9 | 4 |
| Multi-Racial | 2 | 1 | |
| Height (cm) (mean (sd)) |
Female | 169.8 (4.7) | 169.2 (10.3) |
| Male | 186.7 (12.6) | - | |
| Weight (kg) (mean (sd)) |
Female | 87.9 (29.2) | 69.9 (14.0) |
| Male | 107.7 (30.5) | - | |
Excludes majority of data for n=1 veterinary technician who was recruited during another observation session
3.2.2. Observed Tasks.
Total observation time for this phase was 60 hours, which included over 150 tasks observed. Tasks observed included computer work, writing notes, physical examinations of animals of various sizes, administering medications, and surgery. Specific tasks observed varied between participants, because participants only performed the tasks they were called to perform during the observation period. Participants were not asked to perform tasks simply so that we could observe them. Animal care tasks were observed being performed on fixed or adjustable-height exam tables and the floor. Participants were observed working mainly with dogs (small, medium, large) and cats; horses and foals were also observed receiving care. Tasks not involving animals were observed being performed using desks, counter tops, exam tables, and an adjustable computer workstation. Work was observed being performed in a variety of postures: standing, seated, kneeling, and squatting. Using the Rapid Entire Body Assessment [44], 75 tasks that were representative of the 150 observed, and which corresponded to the activities in Table 2, were analyzed. For each participant a variety of tasks were observed being performed, yet there were also tasks that were performed multiple times by the same individual. The tasks that were analyzed represent the variety of tasks observed for each participant and the way that person performed them. Each of the redundant tasks were not analyzed for an individual participant, if they were performed in a similar way, because this yielded no new information. In this way, 75 tasks that represented the 150 observed were analyzed. The analyzed tasks also represent the key tasks from the survey including surgery, physical examinations of various sized animals, computer work, taking notes, communicating with the client, cleaning, lab work, administering medication, and dental cleaning.
The analysis produced REBA scores ranging from 1 (risk level 0: negligible risk, no action needed) to 13 (risk level 4: very high risk, action/further assessment necessary NOW) (Figure 5). Overall, the difference in the distribution of risk level of the observed tasks between veterinarians and veterinary technicians, based on the analyzed postures, was found to be statistically significant (p=0.021) (Figure 5). Neck, trunk and leg combined posture scores for observed tasks were higher, on average, than the arm and wrist posture scores for both veterinarians and vet techs observed in this study.
Figure 5:
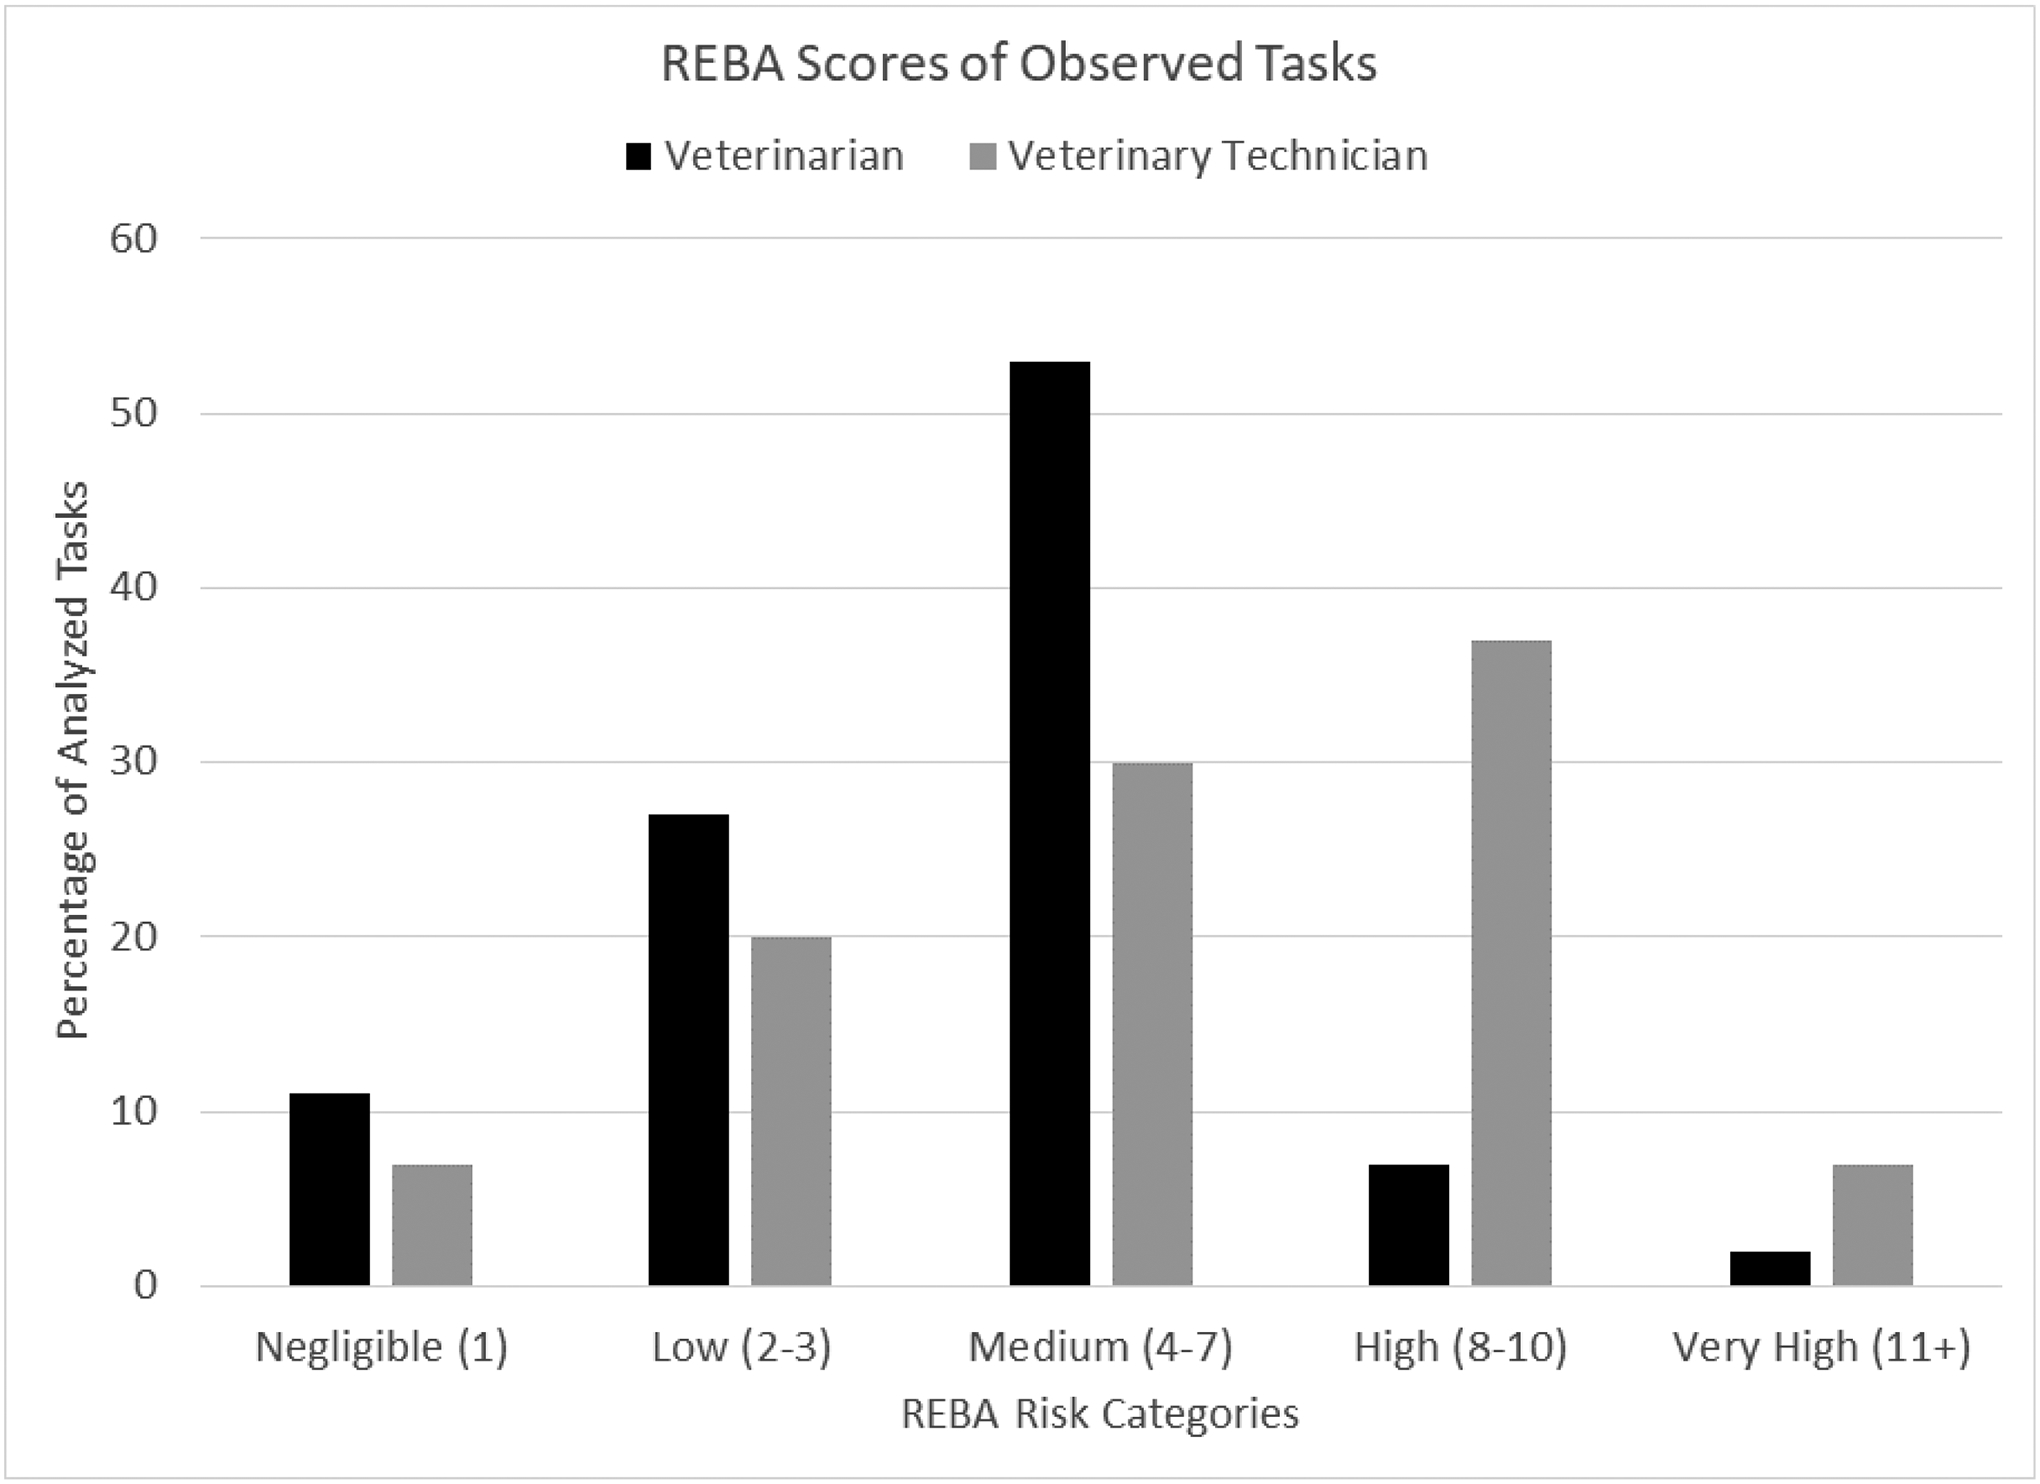
REBA Risk Category scores of observed tasks
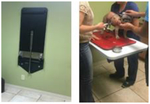
Basic postures of the observation participants were classified as either standing, sitting, kneeling, squatting, or bending while standing (trunk flexion >20°). The majority of the analyzed tasks performed by the veterinarians were performed while sitting (36%), standing (31%), or bending while standing (22%). The majority of the analyzed tasks performed by the veterinary technicians were performed while standing (33%), bending while standing (27%), or kneeling (27%). REBA risk level scores varied by basic posture observed. Some observed postures had consistently higher risk scores such as kneeling, at 73% risk level ‘high’ and 9% risk level ‘very high’, and squatting, at 33% risk level ‘medium’ and 67% risk level ‘very high’. Standing mainly had risk level scores of ‘low’ (54%) and ‘medium’ (42%), while standing + bending increased to 72% risk level ‘medium’ and 28% risk level ‘high’. Sitting was the most diverse posture, ranging from risk level ‘negligible’ (32%) to risk level medium (37%) and even a small percentage (5%) in risk level ‘high’, the latter was driven by a higher score for working with arms outstretched in front of the body (Figure 6). Photos providing examples of the various postures observed, with the resulting REBA score, are shown in Figures 7 – 12.
Figure 6:
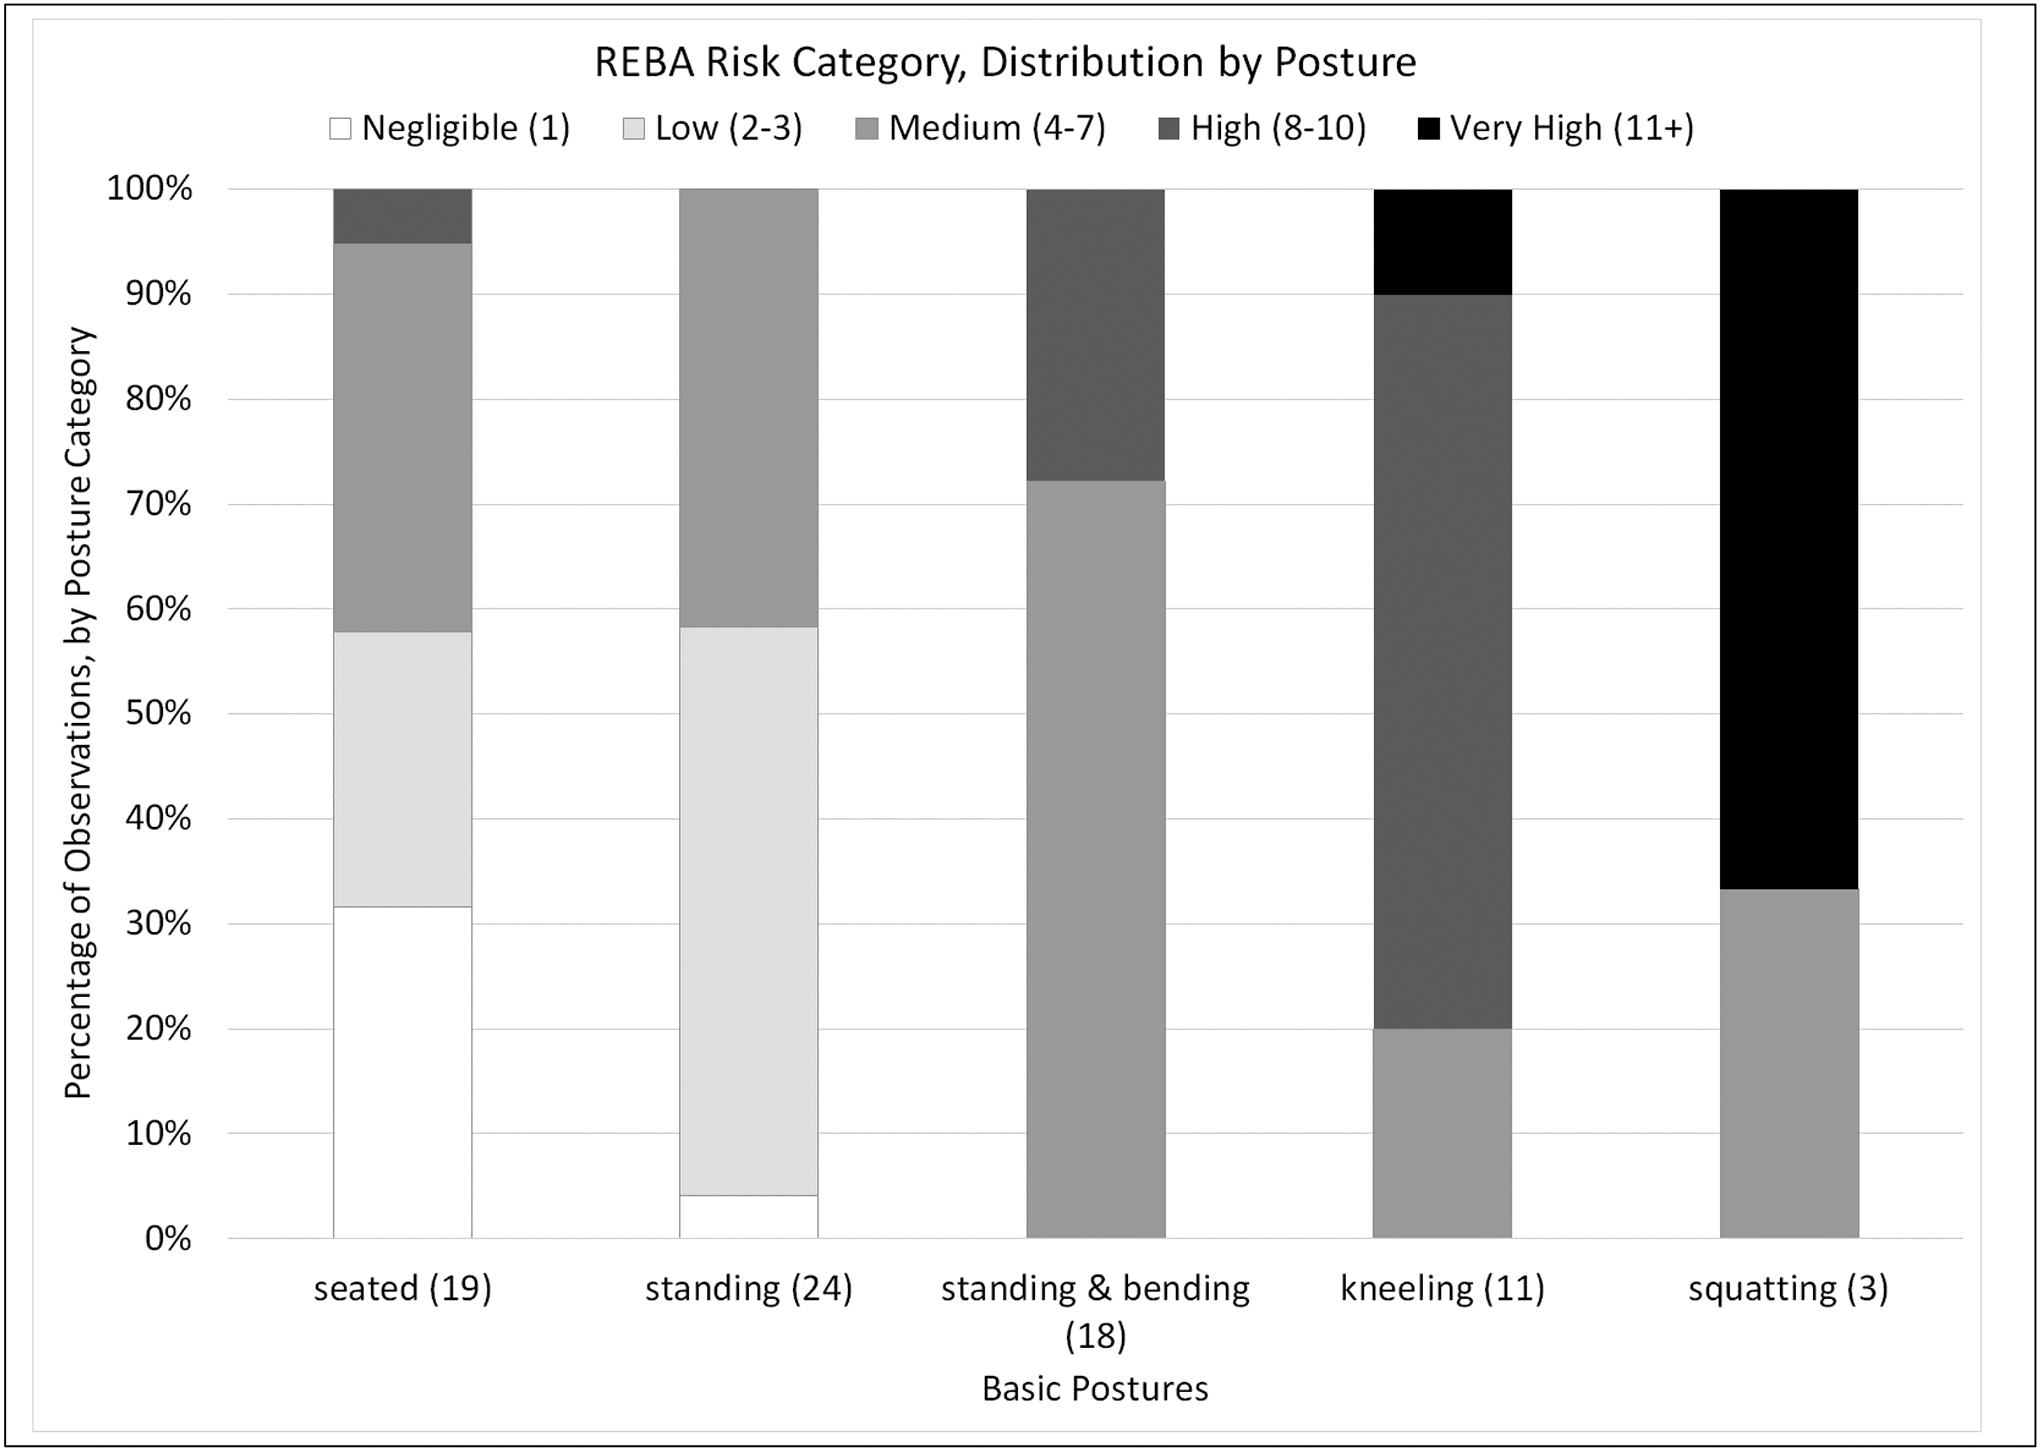
Distribution of REBA risk level by observed basic posture
Figure 7:
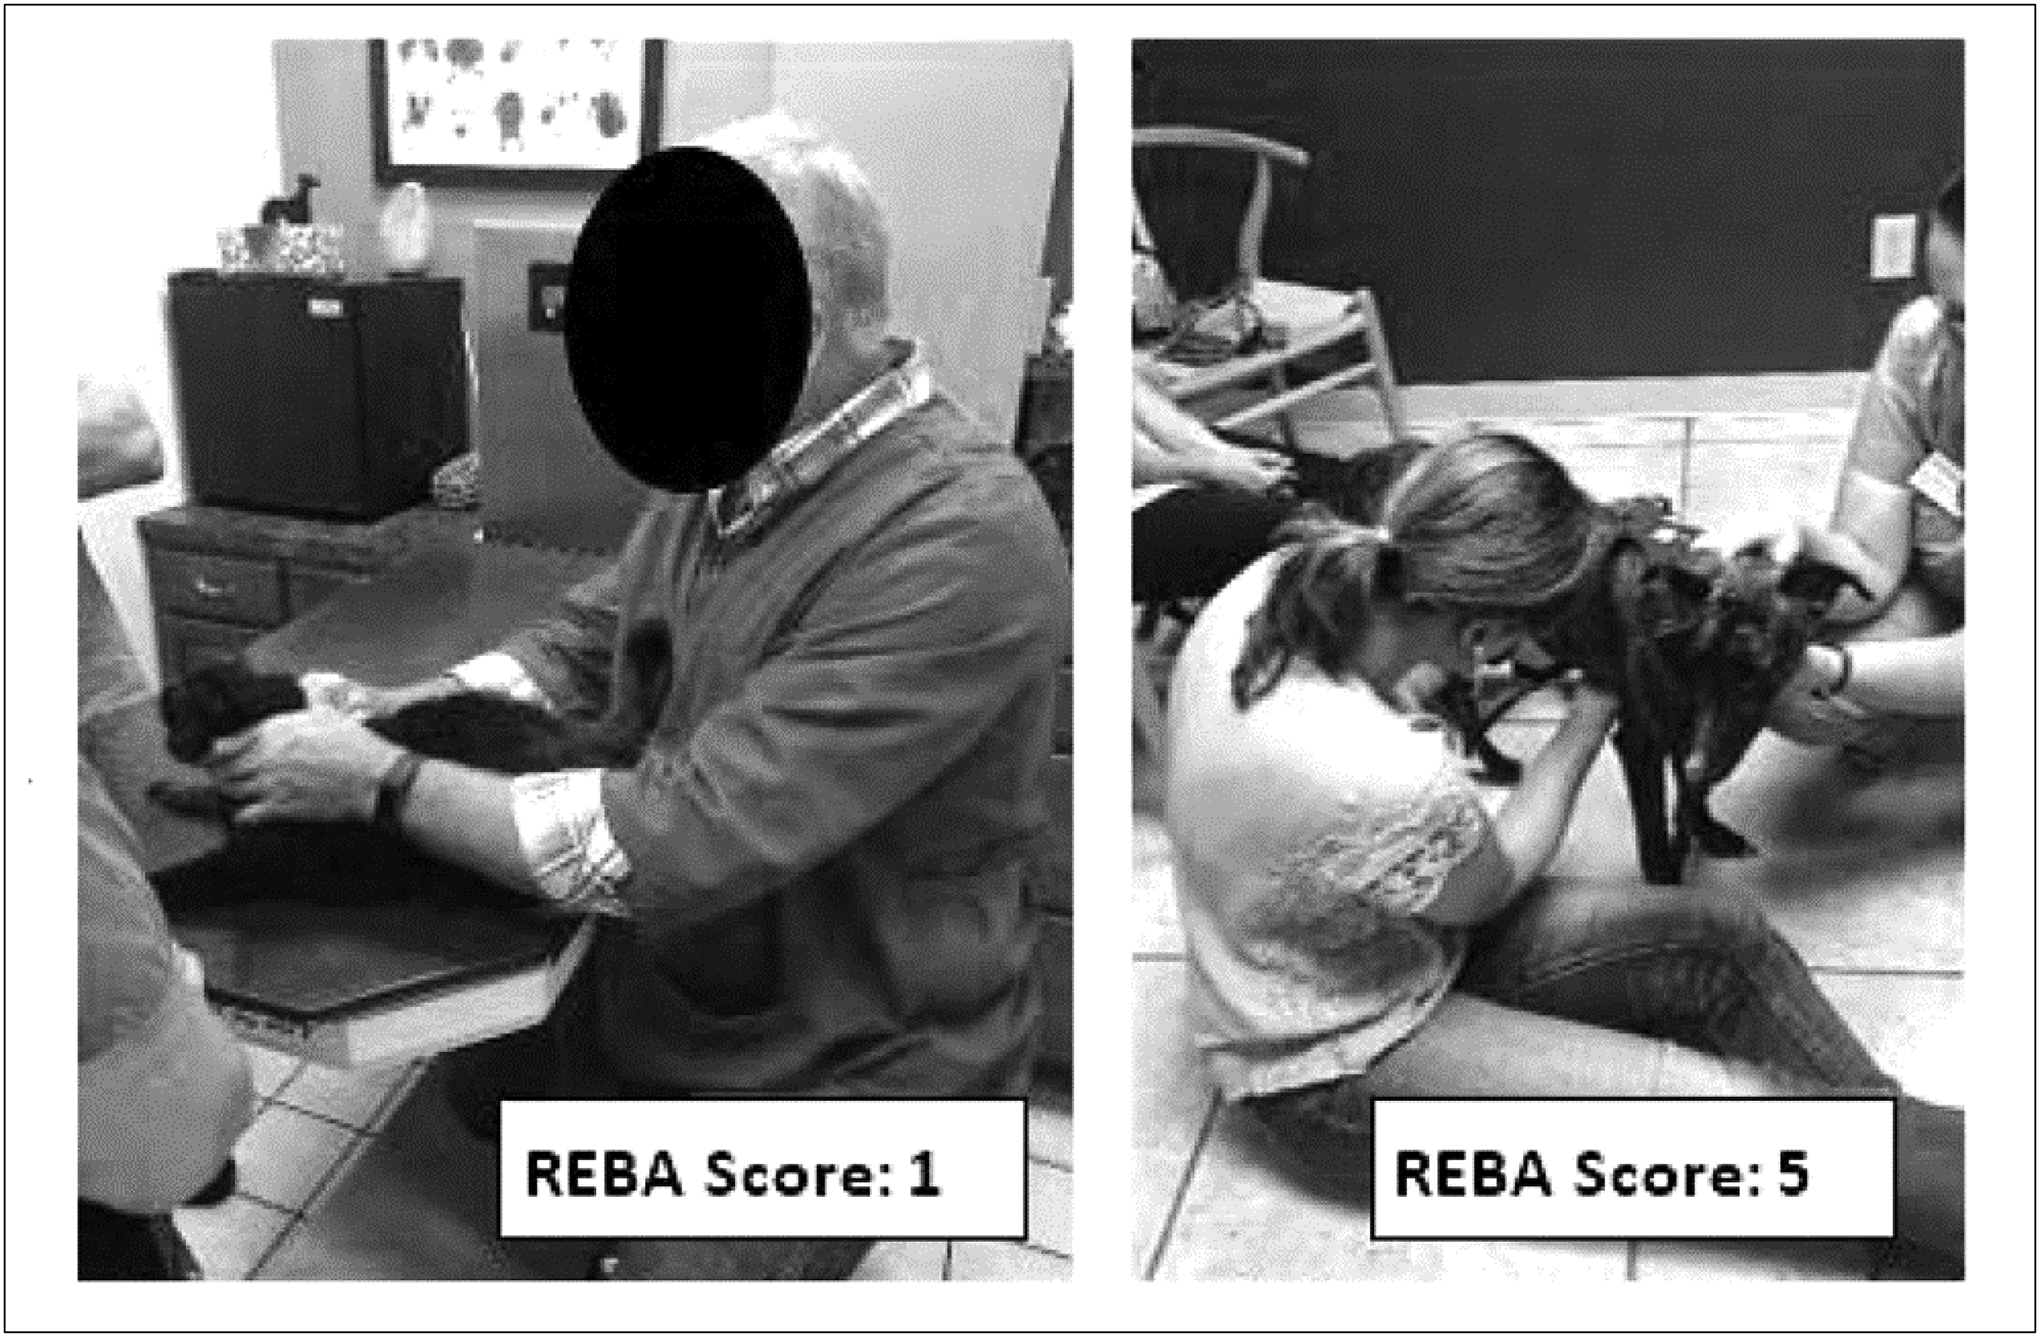
Examples of observed participants sitting and performing tasks: (left) utilizing an adjustable-height table and chair; (right) seated on the floor
Figure 12:
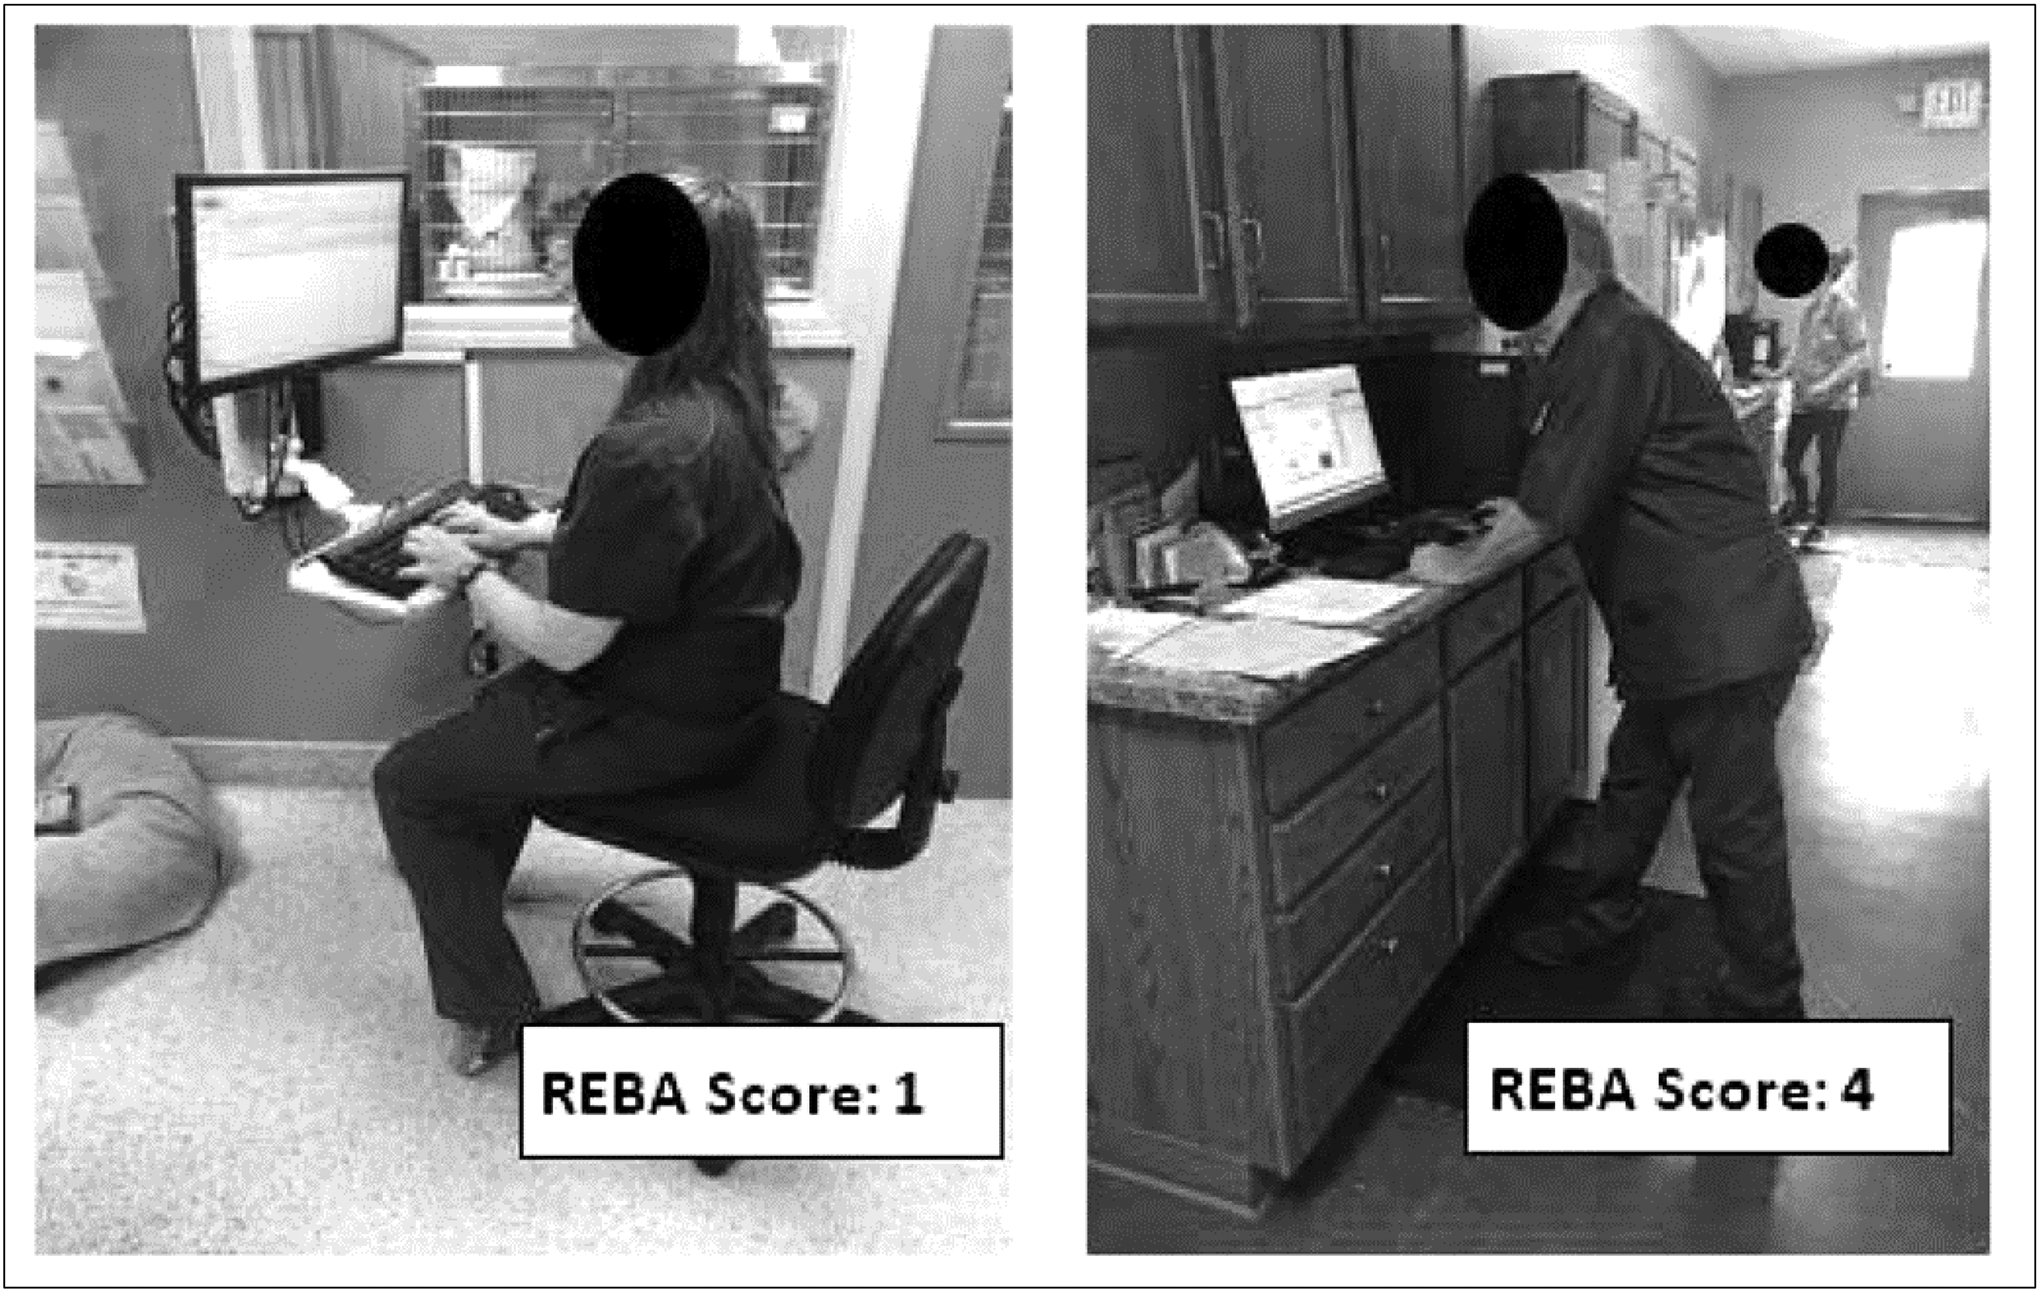
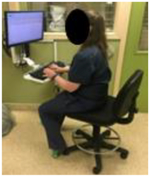
Examples of observed participants utilizing computer work stations: (left) utilizing an adjustable computer station and chair; (right) utilizing a fixed height counter and computer while standing
4. DISCUSSION
This new study of veterinarians and veterinary technicians found musculoskeletal discomfort to be pervasive. Self-reported 12-month prevalence of MSD was 100% for veterinarians and veterinary technicians participating in the study. These results are similar to Scuffham et al.’s New Zealand veterinarian study which reported 96% across all participants [14] as well as White’s study of spay-neuter veterinarians, at 99% [21]. The current study utilized very similar methods to the New Zealand study, including similar self-administered questionnaire and a population that included various veterinary practice groups (small animal, mixed animal, large animal, etc.). A comparison of prevalence reported in recent investigations of MSDs in veterinary care providers and the current study is provided in Table 5. These data show that while some studies reported findings similar to the current study, there is variation across some body regions. For example this study reported higher upper back and legs/feet symptoms than the international studies. The differences could be due to a combination of factors including the type of work/category of practice and the demographic make-up of the study participants.
Table 5:
12 month prevalence of musculoskeletal discomfort as reported in the recent literature and in the current study; numerical values in the table are percentages. All but the last study listed in this table used the Nordic questionnaire or a modified version of it.
| Study | Location | Focus | Population | Overall | Neck | Shoulder | Elbow/Forearm | Wrist/ Hand | Lower Back | Upper Back | Legs/Feet |
|---|---|---|---|---|---|---|---|---|---|---|---|
| Current study | Ohio, USA | 12 mo prev. MSD, any trouble | Veterinarians | 100 | 68 | 52 | 21 | 41 | 86 | 45 | 63 |
| Vet Techs | 100 | 71 | 45 | 13 | 47 | 89 | 61 | 68 | |||
| Scuffham et al. 2010 [14] | New Zealand | 12 mo prev. MSD, any trouble | Veterinarians | 96 | 58 | 59 | 28–29 | 52 | 73 | 30 | 21–38 |
| Smith et al. 2009 [15] | Queensland, Australia | 12 mo prev. MSD, any trouble | Veterinarians | - | 56.9 | 52.3 | 17.3 | 31.9 | 62.6 | 33.6 | 17.3–31.2 |
| White, 2013 [21] | USA | 12 mo prev. MSD, any trouble | Spay-neuter veterinarians | 99 | 71.7 | 73 | 18 | 76.7 | 77 | 58 | 20–57 |
| Kozak et al. 2014 [16] | Germany | 12 mo prev. MSD, any trouble | Veterinarians | - | 66.6 | 60.5 | 24.5 | 34.5 | - | - | - |
| Ergan et al. 2017 [51] | Southwest Turkey | 12 mo prev. MSD, any trouble | Veterinarians | - | 39.1 | 37.2 | 11.6–29 | 28 | 49.8 | 41.1 | 13–30 |
| Fowler et al. 2016 [23] * | Minnesota, USA | Career prevalence, work-related MSD | Veterinarians | 46 | - | 20 | - | - | 30 | - | - |
| Minnesota, USA | Vet Techs | 29 | - | 8 | - | - | 21 | - | - |
Study encompassed the full scope of veterinary medicine occupational hazards/injuries/illnesses
As mentioned, some of the major differences in 12-month MSD prevalence could be due to the differences in demographics of the study population. One such difference is gender distribution. The current study had a larger percentage of female veterinarian respondents (77%) compared with other studies, 49% [14], 46% [15], and 54.3% [16]. As previously reported through an extensive literature review, women generally experience higher incidence of upper extremity MSDs [45]. Yet, in the current study all participants reported experiencing MSD symptoms within the prior 12 months.
The large percentage of small animal veterinarians (75%) participating in the current study differs greatly from other recent studies. In New Zealand, 28.8% were in small animal practices [14], 47% in Australia [15], and 48.6% in Germany [16]. As the New Zealand and Germany studies used the same questionnaire ‘veterinary procedures list’ used in this study, it is clear that the responding veterinarians had different responsibilities and cared for different types of animals. Scuffham et al. reported significant differences in prevalence of MSD severity measures in relation to frequency of performance of certain procedures, including dental procedures, foot trimming, necropsies, obstetric procedures, rectal palpations, and surgical procedures that were less than one hour in duration [14]. Interestingly, of those procedures, a majority of Ohio veterinarians that participated in this study reported performing dental procedures (59%) or surgeries lasting less than one hour (71%) at least weekly, while less than half performed obstetric procedures (11%), necropsies (4%), or rectal palpations (39%) that often, and very few reported performing foot trimmings at all (15%). Notable proportions of participating veterinarians reported high numbers (>2400 per year) of animal consultations (69%), animal handling/lifting (49%), and vaccinations and TB testing (42%).
For five of the seven parts of the body examined in this study, MSD prevalence in the veterinary technician group was similar or higher than in the veterinarian group. Importantly, in both groups, 60% or more of those who reported experiencing musculoskeletal discomfort also reported that work activities exacerbated their discomfort. For vet techs who experienced back discomfort, over 90% reported work activities exacerbated that discomfort. In an early survey of occupational health risks in veterinary nurses, 52% reported experiencing chronic back pain [25], which may be comparable to the vet techs’ 7 day low back pain prevalence of 68% in the current study. Although work exposures differ in some degrees between the veterinarians and vet techs (Figure 1, Table 2), interventions that are aimed at reducing lifting, working in awkward postures, and prolonged standing would likely benefit both veterinarians and veterinary technicians.
In the current study, the percentage of participants reporting lost time from work due to musculoskeletal discomfort was relatively low, indicating that both veterinarians and veterinary technicians are working through the pain and discomfort, even when reporting that work activities exacerbate MSD symptoms. Ten percent of veterinarians that experienced lower back MSD symptoms reported lost work time, which is in line with the 9% reported by Scuffham et al. [14] and slightly higher than 6.1% reported by Smith et al. [15]. Vet techs reported higher percentages of lost time due to MSD than veterinarians for multiple body regions, with the highest being 26% for lower back symptoms. A 2015 US Bureau of Labor Statistics (BLS) report [46] shows a total incidence rate of 47.8 (per 10,000 full-time workers) for nonfatal occupational injuries and illness involving days away from work for veterinarians, and an incidence rate of 5.3 for sprains, strains and tears injuries. In contrast, the overall and sprain/strain lost time rates for veterinary technicians and technologists were much higher (230.3 and 59.8, respectively). This study and the BLS data are consistent in finding that losing time from work due to musculoskeletal discomfort and injury is more common in veterinary technicians than veterinarians.
When looking at results concerning burnout, based on the Copenhagen Burnout Inventory, averages for personal burnout, work-related burnout, and client-related burnout were 42.5, 43.9, and 38.5, respectively, for veterinarians and 62.5, 55.3, and 32.1, respectively, for veterinary technicians (Table 3). Personal and work-related burnout were much higher than values reported from a five-year study of workers in the human services sector [30]. When looking closely at the individual personal, work-related, and client-related scores from that study, veterinarians in the current study were a bit higher, but still similar to health care related jobs: home help (43.1, 41.8, 35.9), district nurse (38.4, 31.4, 25.3), associate nurses (37.9, 36.1, 31.4), nurses (36.9, 35.0, 29.7) and hospital doctors (36.6, 39.8, 26.7). Differences of five points or more are significant for the individual person [30], highlighting the significantly higher scores for veterinary technicians in personal and work-related burnout in the current study, when compared with the veternarians and the groups in the referenced study [30]. The mean CBI work-related burnout score for the vet techs in the curent study is similar to the 49.5 mean value reported in a study of psychological well-being of Australian veterinary nurses [47]. In a study of workplace stress and burnout in Australian veterinarians, Hatch et al. [48] reported the percentage of participants that had CBI personal, work-related, or client-related burnout scores that exceeded 50 (on the 0 to 100 scale) as 37%, 35.8%, and 24.8%, respectively. Respective percentages in the current study for veterinarians were 39%, 39%, and 27%, very similar to the results reported by Hatch et al. [48]. Percentages for the vet techs in our study were much higher for personal and work-related burnout >50, 68% and 61%, respectively, and were similar for client-related burnout >50 (16%).
When looking into the CPQ scales of quantitative, emotional, and hiding emotion demands, veterinarians and vet techs scored relatively similarly: for veterinarians, 54.1, 58.3, and 38.2, respectively, and for veterinary technicians 54.8, 55.9, and 35.8, respectively (Table 3). Yet, Kristensen et al. [29] report the average results for quantitative demands as 44.3 (sd=17.9), emotional demands as 37.8 (sd=25.5) and demands for hiding emotions as 30.3 (sd=22.6). From the same study, jobs that involved working with clients scored high on emotional demand and demands for hiding emotions, indicating that while the veterinarian and veterinary technician scores are somewhat higher than average, they fall in line with other jobs with similar roles such as nurses and nurses’ aides. Kozak et al. [16] reported that high quantitative demands as well as higher levels of personal burnout were associated with perceived MSD severity, specifically in the upper extremities and neck. In the current study, quantitative demands were positively correlated with personal burnout, work-related burnout, and emotional demands (r = 0.548, p<0.0001; r = 0.554, p<0.0001; and r = 0.484, p<0.0001, respectively).
With regards to job statisfaction and whether a veterinarian or vet tech would recommend their profession, this study’s findings are inline with a recent study by Merck Animal Health which, when looking into mental health and well-being of veterinarians, reported that 41% of veterinarians would recommend their profession to a friend or family member [49]. The study also reported that only 24% of younger veterinarians (under age 35) would recommend their profession, in comparison to 62% of older veterinarians (over age 64). When looking at the general population, 70% of employed adults would recommend their profession, while 51% of human health physicians would do the same [49]. The Merck study reports that student debt and low income contribute to emotional stress and poor well-being in veterinarians.
The addition of the observational phase of the current study allowed for a deeper examination into the details of how veterinary tasks can be related to MSD risks. REBA, a tool specifically developed to assess ‘unpredictable working postures found in health care…and other service industries’ [44], provided a semi-quantitative means of evaluating task-practitioner-animal-equipment interactions as they may relate to MSD risk and risk reduction. This tool aids in highlighting regions of the body most affected by various awkward postures, thereby aiding in identifying and demonstrating the impact of current methods and possible solutions to reduce risk.
From observation, it is clear there is not “one best way” to do a task, but indications of best or better practices exist. For example, three different methods/conditions for examining a cooperative cat are illustrated in Figure 13, each of which had a low risk REBA score (3). However, unlike those examples, participants were frequently observed standing while the trunk was flexed more than 20° to perform some tasks, mainly during physical exams of dogs. Pronounced and sometimes extreme trunk flexion led to higher REBA risk level scores (72% risk level ‘medium’ and 28% risk level ‘high’) due to high trunk posture scores, while observations where the participant was sitting and/or using an adjustable-height lift exam table tended to have lower REBA risk scores (32% risk level ‘negligible’, 26% risk level ‘low’, and 37% risk level ‘medium’) (Figure 6). Likewise, sitting on the floor while examining an animal on the floor, as opposed to squatting or kneeling, was associated with a lower risk score (Figure 7, right v. Figures 9 and 10). None of the 11 representative kneeling tasks were rated less than ‘medium’ risk and most (82%) were rated ‘high’ or ‘very high’ risk. Similarly, the three tasks performed while squatting were rated ‘medium’ or ‘very high’ risk.
Figure 13:
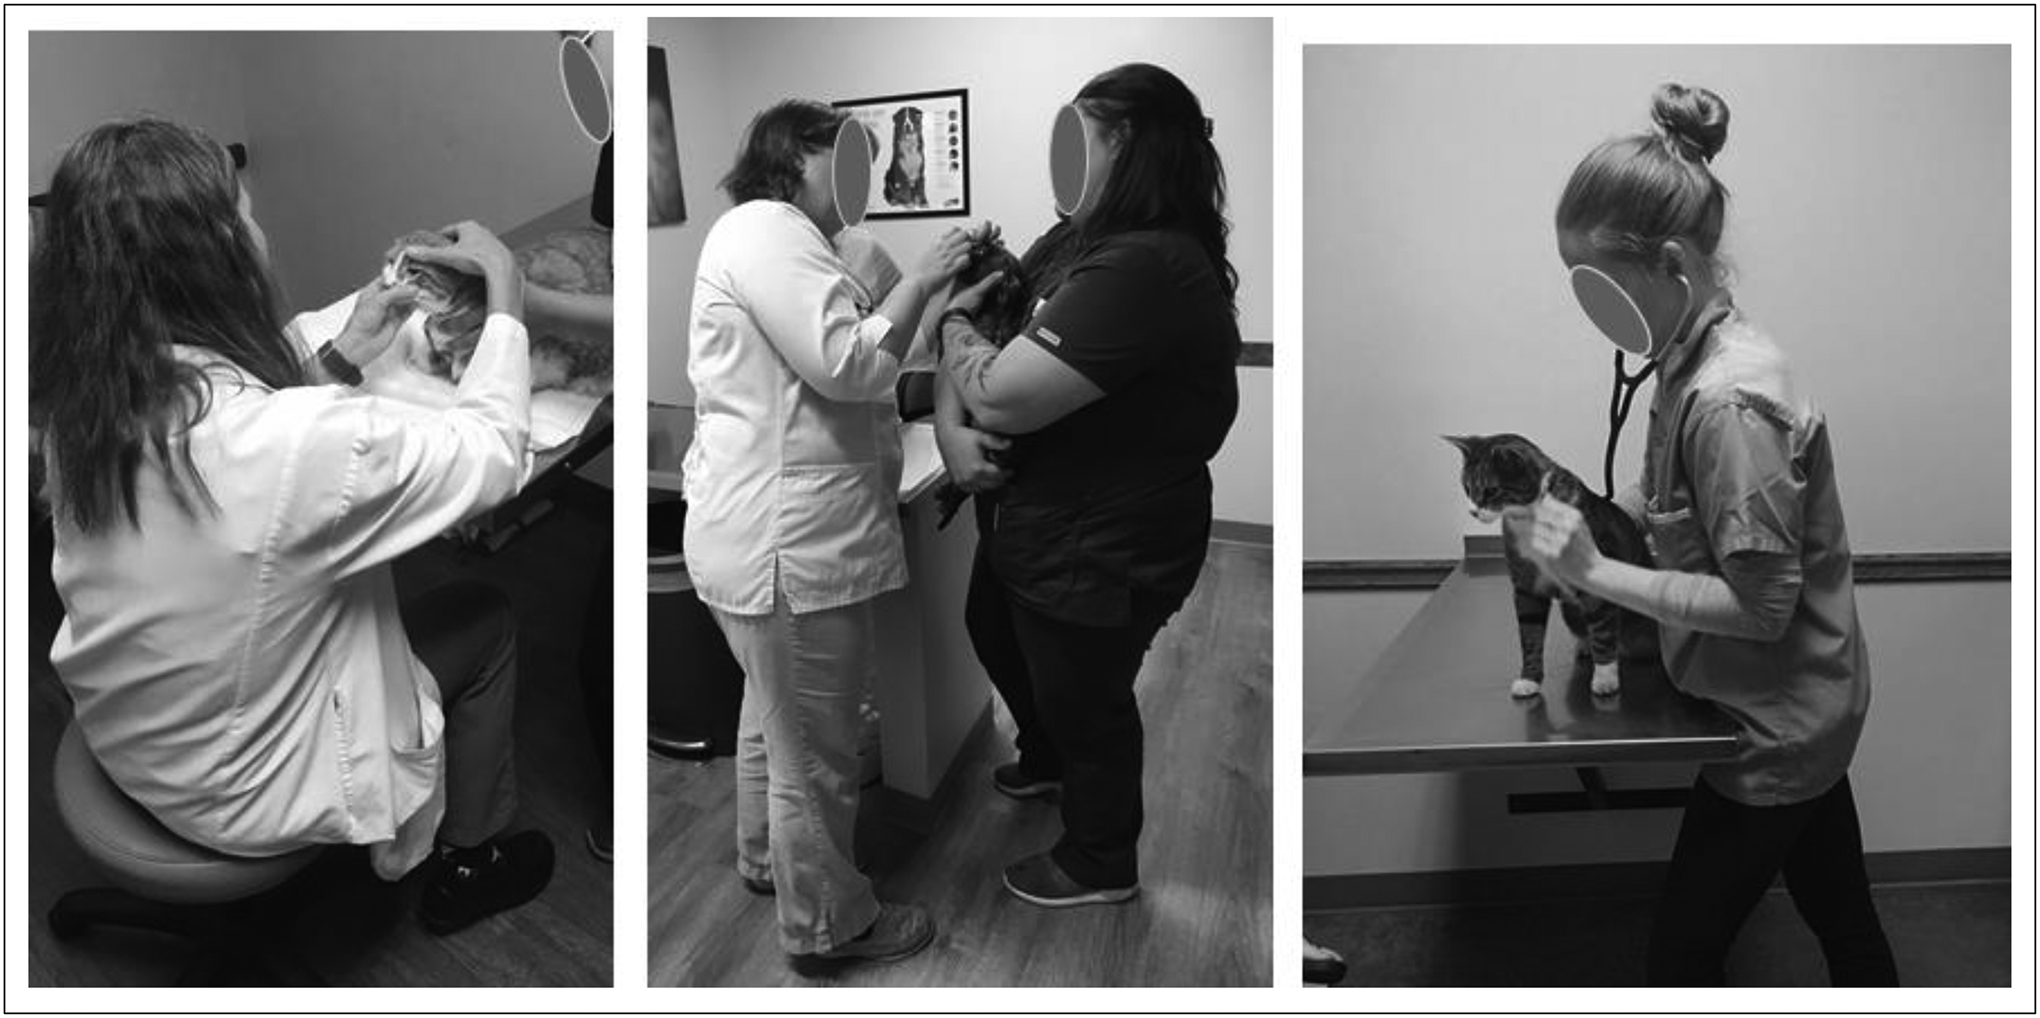
Examining a cat: (left) seated with cat on exam table restrained by a veterinary technician, (center) standing with cat held in the arms of a veterinary technician, (right) standing with cat on an exam table restrained by the examiner. REBA scores for the examiner in each of these is a 3; evidence that there is more than one better way to perform this task.
Figure 9:
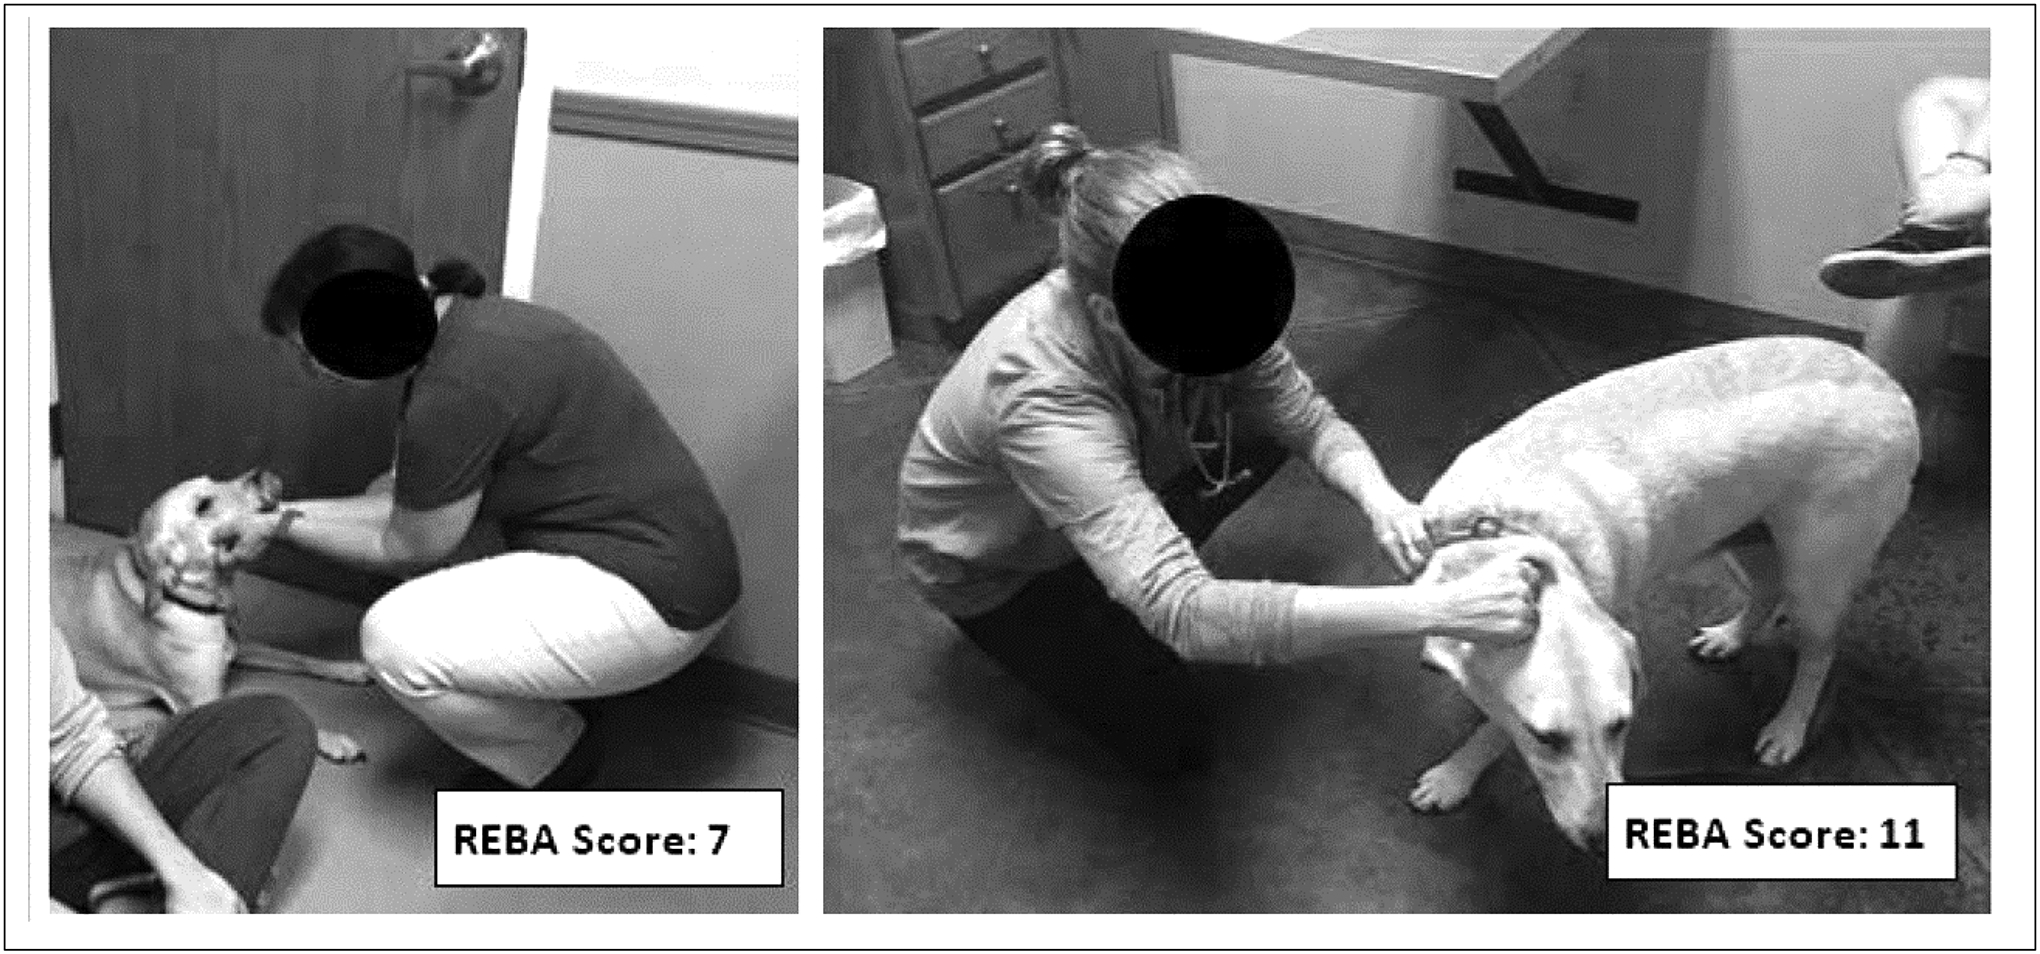
Examples of observed participants squatting to perform tasks: (left) working with arms close to body; (right) working with arms extended, increasing the REBA risk score
Figure 10:
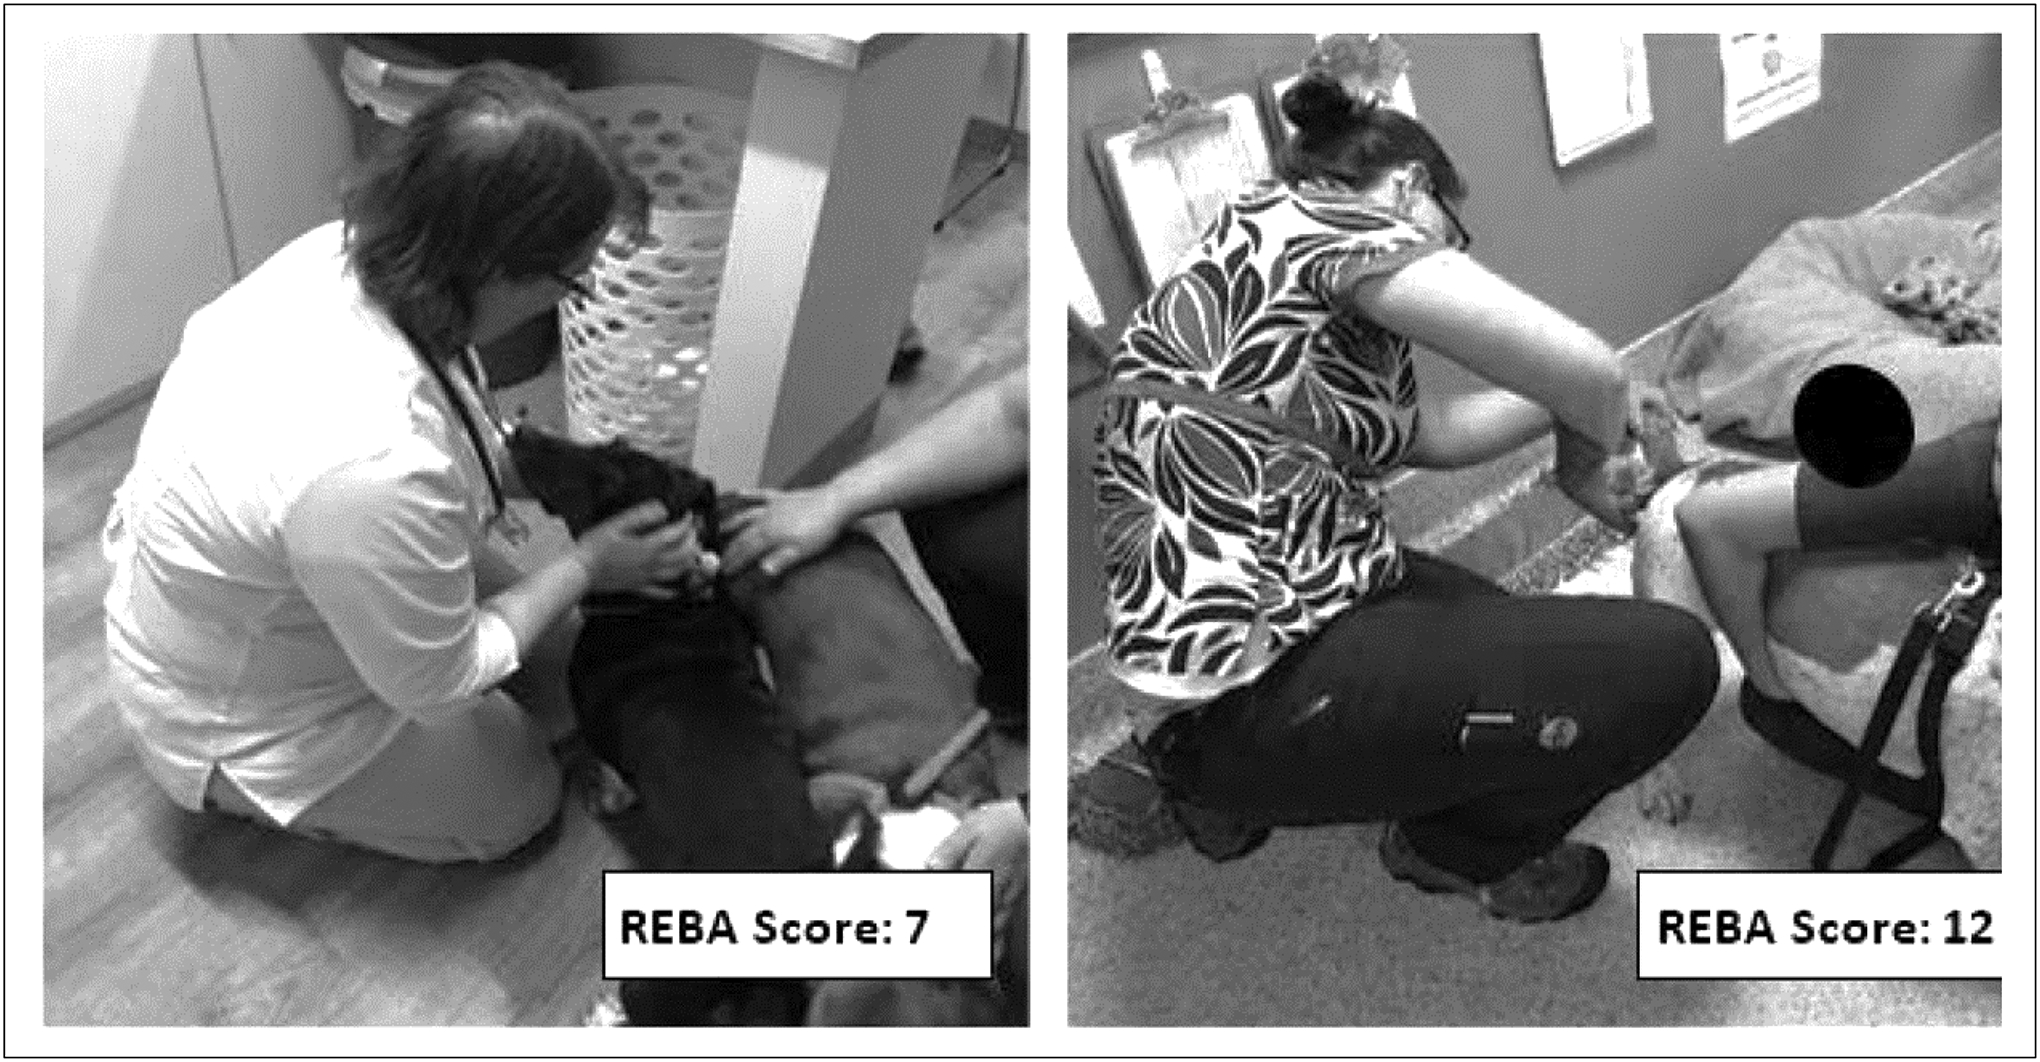
Examples of observed participants kneeling to perform tasks: (left) upright spine, arms close to body; (right) added impact on REBA score of back flexion/twist and working with arms extended
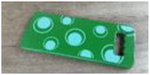
Equipment that was available and utilized differed among observed practices. Utilizing a stool or chair for exams reduced the REBA risk score, specifically the neck, trunk and legs posture score. Using the back support of a chair improves the trunk posture score; any sitting (with or without back support) reduces the leg posture score. Use of an adjustable lift/exam table was generally helpful in reducing back flexion and neck flexion for the person examining the animal, while also reducing back flexion and arm posture scores for the person restraining the animal. Adjustable-height lift/exam tables were also frequently observed being used to eliminate or reduce lifting by veterinarians and veterinary technicians, a task that was frequently performed by survey participants. By guiding the animal, typically larger dogs, to walk directly onto the lowered table prior to lifting the table to the desired height, awkward (and heavier) lifts in the exam room could be eliminated. This may be particularly relevant given the high percentage of women working in veterinary practices and recommendations for lifting limits during pregnancy [50]. Neck scores were improved during tasks that involved talking with clients and taking notes when the veterinarian sat at the same level as the client (who was typically seated) while utilizing a horizontal surface, either an exam table or counter. Writing surfaces that were at mid-trunk level (in contrast to hip- or waist-height horizontal surfaces), either while seated or standing, improved arm and neck scores (Figure 12). Computer work stations also varied among practices. Where adjustable work stations existed, which included adjustable keyboard/mouse surfaces, adjustable computer monitors and adjustable chairs, REBA scores were reduced for computer work, mainly for neck and trunk regions, as compared to fixed height counter stations with fixed height monitors (Figure 12). A list of equipment recommendations, including relevant ergonomic benefits is provided in Table 6.
Table 6.
Recommendations for ergonomic improvements
| EQUIPMENT | ERGONOMIC BENEFITS | |
|---|---|---|
| Adjustable-Height Lift Table |
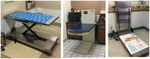
|
Options for working in standing or seated posture Ability to examine different size animals in the same comfortable work posture Reduction in lifting animals Ability for personnel of different statures to work at heights that are appropriate for them [50, 52] |
| Folding Exam Table |
|
Ability to examine some animals in a more neutral working position depending on the worker’s height Also provides option for providing more floor space when needed [52] |
| Adjustable Stool or Chair (with or without back support) |
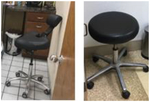
|
Ability for individuals to give their legs a break from standing during exams, surgery, administering medication Reduced need to flex the spine, reducing stress on trunk muscles and spine Support for floor exams of larger animals [52] |
| Anti-fatigue Mats |
|
Reduce burden on legs and feet; reduce lower back discomfort Appropriate for standing and kneeling tasks [52, 53] |
| Knee Pads/Kneeling Pad |
|
Reduce burden on legs/knees Appropriate when kneeling cannot be avoided [54] |
| Adjustable Computer Workstations/ Workstation on Wheels (WOW) |
|
Adjustable height/angle to fit different individuals Reduce burden on back, neck, arms, shoulders Adjustable chair with back support [52] |
| Surgical/ Dental Loupes |
|
Reduce awkward neck postures (extreme (>20°) flexion) [55, 56] |
As with any study, this one has some limitations. This study involved a smaller group of respondents than the studies performed in New Zealand [14] and Germany [16]. The nature of how potential respondents were recruited for this survey, using internet searches, membership data, and snowball data collection, makes it difficult to assess the true response rate. While every effort was made to encourage all eligible veternarians and veterinary technicians in the state to participate, those experiencing MSD symptoms may have had greater motivation to complete the survey. Further, those who were not employed in the prior 12-months were excluded from participation. This study asked participants to report based on their experiences over the prior 12-months, and therefore recall bias may impact results. Task quantification recall was also mentioned as a limitation by other studies that employed the same set of questions about MSD symptoms and about tasks performed [14, 16]. Within the questionnaire, veterinary technicians were questioned using a task list that was based on the veterinarian task list, and therefore did not cover all tasks performed by vet techs. As mentioned previously, the majority of the observational data were collected at small animal practices; only two observation site visits were performed at large animal facilities. Due to the varied nature of veterinary medicine work, tasks were chosen for REBA analysis that best represented what was observed while the researchers were on site. As such, the observations are representative of what was observed while we were on site, and may not generalize beyond this sample of observed individuals and observed tasks.
As seen from this research and the other veterinarian studies, there is a need for further investigation of the work that may be causing musculoskeletal discomfort in the veterinary medical profession. Future studies could expand on observation to include a larger quantity and wider variety of practices, expanded observation and assessment of job tasks, as well as more detailed investigation into the areas initially found to be higher risk for MSDs through questionnaire data. Although many of the recommendations (in Table 6) have been proven useful in other health care fields, future research should include working with veterinarians and veterinary technicians to assess the usefulness, usability, and effectiveness of reducing MSD of those interventions for veterinary medicine applications. Although similarities are seen between human health care professions and animal health care professions, the uniqueness of working with a diverse set of animals creates the need to also research specific recommendations for the field and for the type of practice. One additional step that is recommended is to begin ergonomics training and awareness while students are in veterinarian school or veterinary technician’s school. By expanding on this type of training, animal health care providers will learn tools and techniques they can use from the beginning of their career, leading them to be more proactive in influencing their work environments and their health.
5. CONCLUSIONS
This study found that musculoskeletal discomfort symptoms are prevalent in both veterinarians and vet technicians (veterinary nurses). This study is one of very few to report on work-related symptoms and risk factor exposure of veterinary technicians. In addition to MSD symptoms, both veterinarians and vet techs in this study reported higher levels of personal burnout and work-related burnout than the average worker, as well as other similar health care related occupations. Quantitative demands and emotional demands were also higher than average. Observation of representative tasks performed by veterinarians and veterinary technicians found that they often work in high risk postures, including standing with pronounced trunk bending (flexion > 20°), kneeling, and squatting, as evaluated by the Rapid Entire Body Assessment (REBA). Other commonly observed stressful postures included neck flexion > 20° and work with arms extended in front of the body. While it would be difficult to fully eliminate exposure to risk factors associated with strain/sprain/overuse types of musculoskeletal injuries when working with animals, implementing usable and useful interventions, where possible, could reduce some of the risk factor exposure, which could eventually lead to a reduction in the prevalence of MSDs in veterinarians and veterinary technicians.
Figure 8:
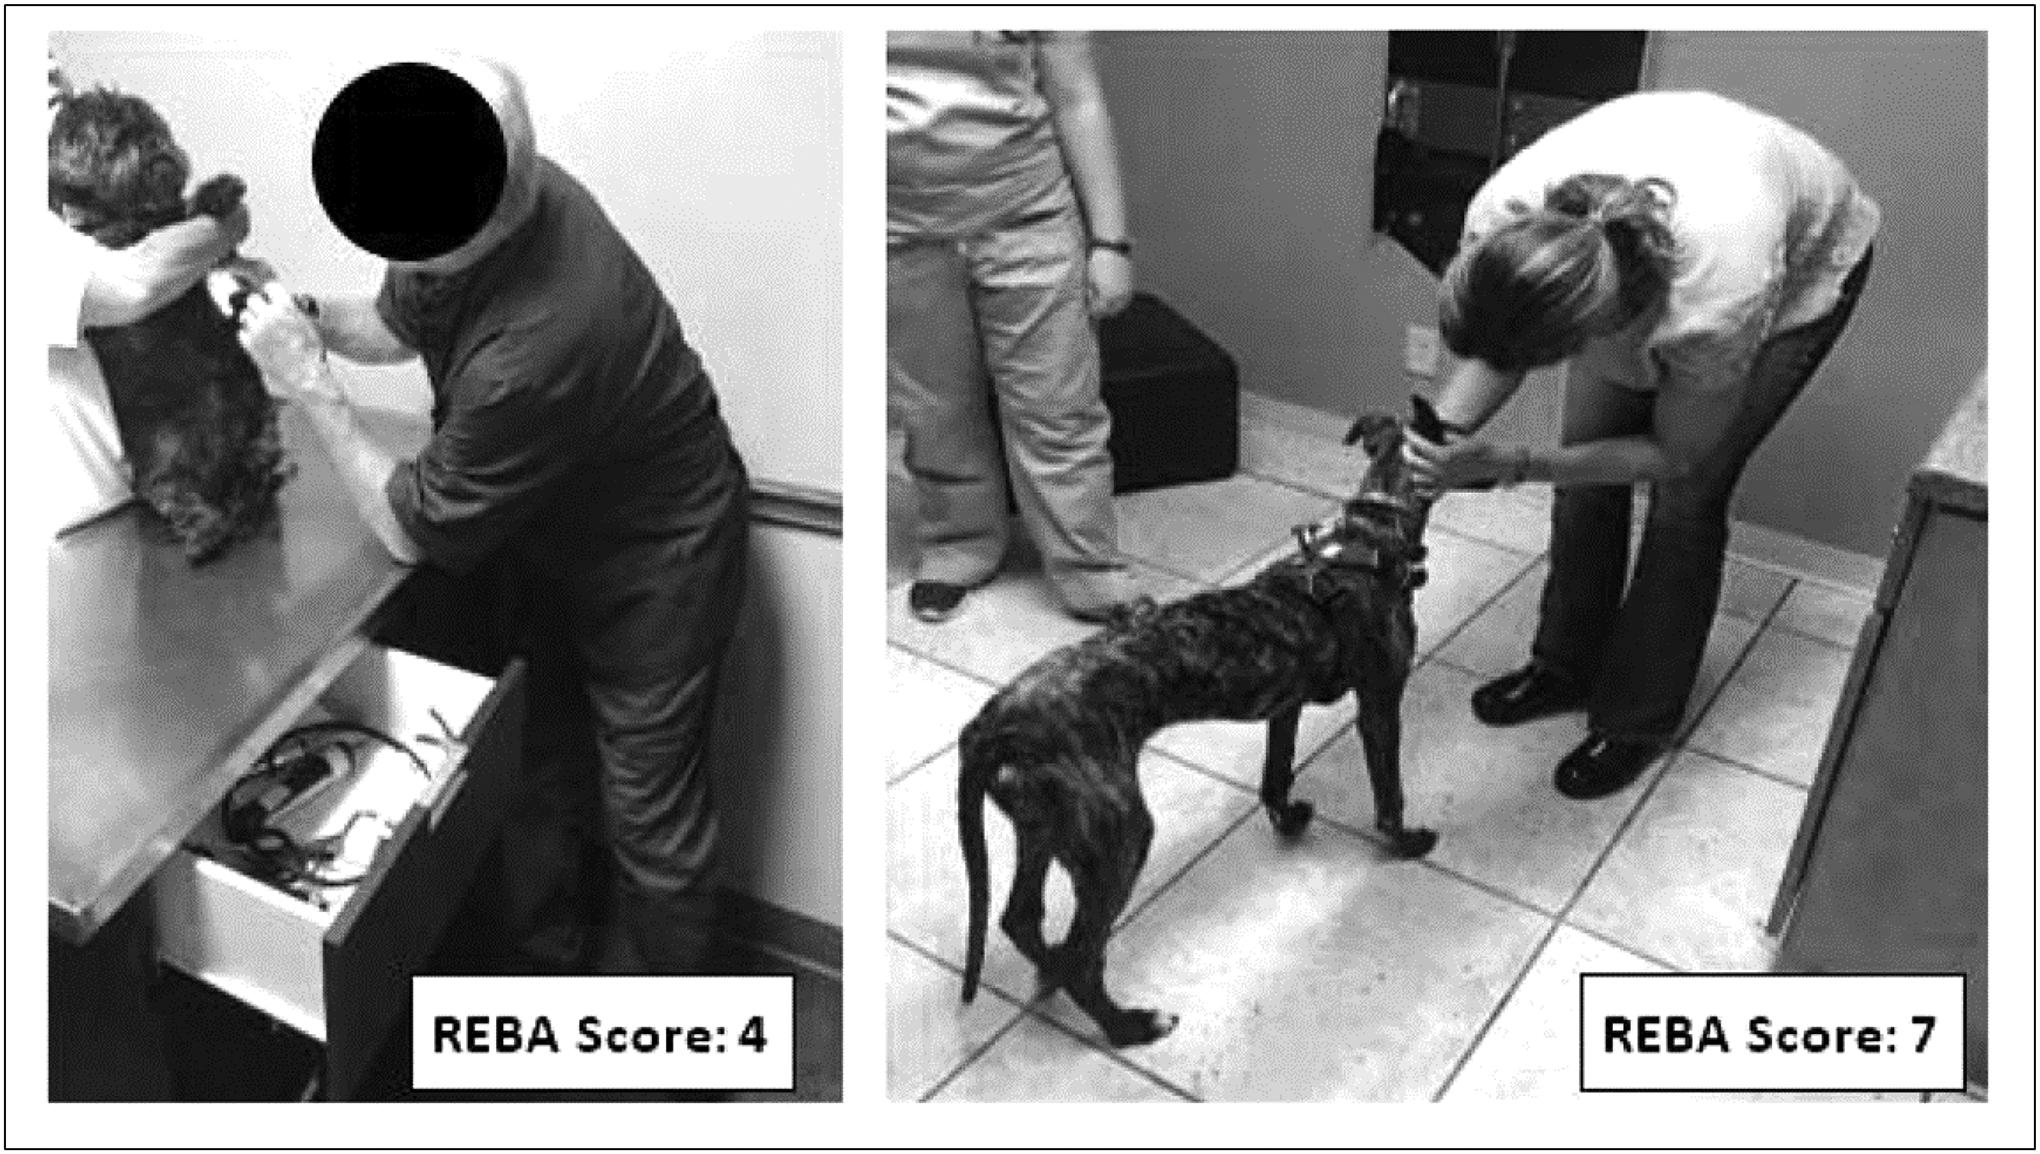
Examples of observed participants standing and bending to perform tasks: (left) utilizing an exam table and displaying minor back twist and flexion; (right) displaying extreme back flexion
Figure 11:
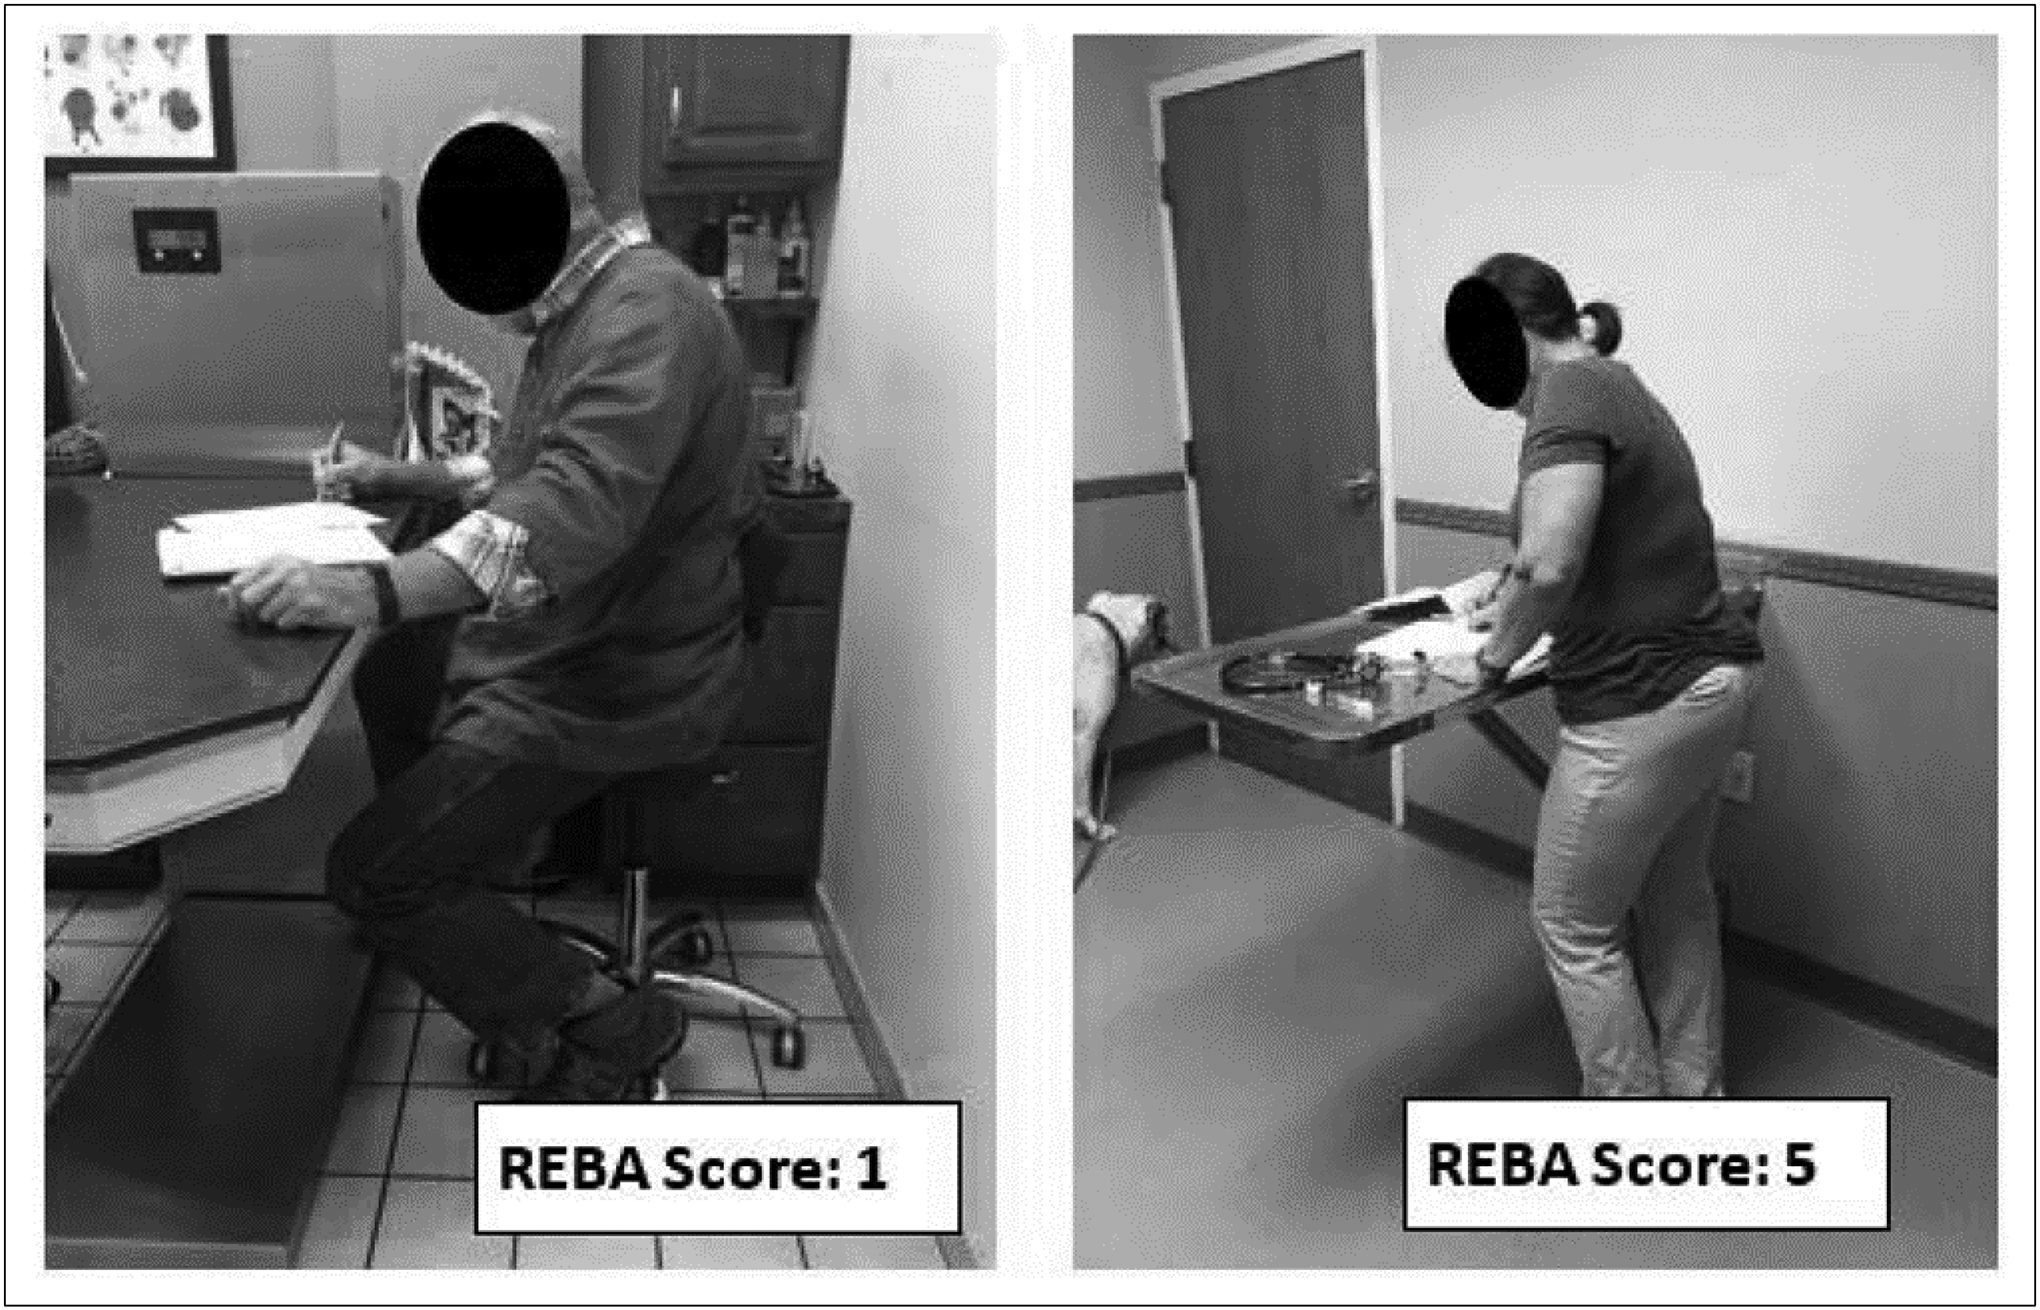
Examples of observed participants taking notes while talking to clients: (left) using an adjustable chair and table; (right) using a fixed height table and standing
Acknowledgements
We welcome the opportunity to acknowledge the educational assistance support for the first author which was provided by NIOSH Training Grant T03OH008847.
Footnotes
The authors declare that they have no conflicts of interest to disclose.
SAS, Version 9.4 (SAS Institute Inc, Cary, NC); Excel 2016 (Microsoft, Inc., Redmond WA)
References
- 1.Davis KG, Kotowski SE. Prevalence of Musculoskeletal Disorders for Nurses in Hospitals, Long-Term Care Facilities, and Home Health Care: A Comprehensive Review. Hum Factors. 2015;57(5):754–92. [DOI] [PubMed] [Google Scholar]
- 2.Li J, Sommerich CM, Chipps E, Lavender SA, Stasny EA. A framework for studying risk factors for lower extremity musculoskeletal discomfort in nurses. Ergonomics. 2020:1–39. [DOI] [PubMed] [Google Scholar]
- 3.Darragh AR, Campo M, King P. Work-related activities associated with injury in occupational and physical therapists. Work. 2012;42(3):373–84. [DOI] [PMC free article] [PubMed] [Google Scholar]
- 4.Evans KD, Roll SC, Baker J. Work-Related Musculoskeletal Disorders (WRMSD) Among Registered Diagnostic Medical Sonographers and Vascular Technologists A Representative Sample. Journal of Diagnostic Medical Sonography. 2009;25:287–99. [Google Scholar]
- 5.Bos E, Krol B, van der Star L, Groothoff J. Risk factors and musculoskeletal complaints in non-specialized nurses, IC nurses, operation room nurses, and X-ray technologists. Int Arch Occup Environ Health. 2007;80(3):198–206. [DOI] [PubMed] [Google Scholar]
- 6.Waters TR, Nelson A, Proctor C. Patient handling tasks with high risk for musculoskeletal disorders in critical care. Crit Care Nurs Clin North Am. 2007;19(2):131–43. [DOI] [PubMed] [Google Scholar]
- 7.Dhyani M, Roll SC, Gilbertson MW, Orlowski M, Anvari A, Li Q, et al. A pilot study to precisely quantify forces applied by sonographers while scanning: A step toward reducing ergonomic injury. Work. 2017;58(2):241–7. [DOI] [PubMed] [Google Scholar]
- 8.de Castro AB, Hagan P, Nelson A. Prioritizing safe patient handling: The American Nurses Association’s Handle With Care Campaign. J Nurs Adm. 2006;36(7–8):363–9. [DOI] [PubMed] [Google Scholar]
- 9.Nagavarapu S, Lavender SA, Marras WS. Spine loading during the application and removal of lifting slings: the effects of patient weight, bed height and work method. Ergonomics. 2017;60(5):636–48. [DOI] [PubMed] [Google Scholar]
- 10.Waters TR, Sedlak CA, Howe CM, Gonzalez CM, Doheny MO, Patterson M, et al. Recommended weight limits for lifting and holding limbs in the orthopaedic practice setting. Orthop Nurs. 2009;28(2 Suppl):S28–32. [DOI] [PubMed] [Google Scholar]
- 11.Sharan D, Ajeesh PS. Injury prevention in physiotherapists--a scientific review. Work. 2012;41 Suppl 1:1855–9. [DOI] [PubMed] [Google Scholar]
- 12.Sommerich CM, Lavender SA, Evans K, Sanders E, Joines S, Lamar S, et al. Collaborating with cardiac sonographers to develop work-related musculoskeletal disorder interventions. Ergonomics. 2016;59(9):1193–204. [DOI] [PMC free article] [PubMed] [Google Scholar]
- 13.Sommerich CM, Lavender SA, Evans K, Sanders E, Joines S, Lamar S, et al. Collaborating With Sonographers and Vascular Technologists to Develop Ergonomics Interventions to Address Work-Related Musculoskeletal Disorders. Journal of Diagnostic Medical Sonography. 2019;35(1):23–37. [Google Scholar]
- 14.Scuffham AM, Legg SJ, Firth EC, Stevenson MA. Prevalence and risk factors associated with musculoskeletal discomfort in New Zealand veterinarians. Appl Ergon. 2010;41(3):444–53. [DOI] [PubMed] [Google Scholar]
- 15.Smith DR, Leggat PA, Speare R. Musculoskeletal disorders and psychosocial risk factors among veterinarians in Queensland, Australia. Aust Vet J. 2009;87(7):260–5. [DOI] [PubMed] [Google Scholar]
- 16.Kozak A, Schedlbauer G, Peters C, Nienhaus A. Self-reported musculoskeletal disorders of the distal upper extremities and the neck in German veterinarians: a cross-sectional study. PLoS One. 2014;9(2):e89362. [DOI] [PMC free article] [PubMed] [Google Scholar]
- 17.Poole AG, Shane SM, Kearney MT, McConnell DA. Survey of occupational hazards in large animal practices. J Am Vet Med Assoc. 1999;215(10):1433–5. [PubMed] [Google Scholar]
- 18.DeForge DH. Physical ergonomics in veterinary dentistry. J Vet Dent. 2002;19(4):196–200. [DOI] [PubMed] [Google Scholar]
- 19.MacDonald K, King D. Work-related musculoskeletal disorders in veterinary echocardiographers: a cross-sectional study on prevalence and risk factors. J Vet Cardiol. 2014;16(1):27–37. [DOI] [PubMed] [Google Scholar]
- 20.Randall E, Hansen C, Gilkey D, Patil A, Bachand A, Rosecrance J, et al. Evaluation of ergonomic risk factors among veterinary ultrasonographers. Vet Radiol Ultrasound. 2012;53(4):459–64. [DOI] [PubMed] [Google Scholar]
- 21.White SC. Prevalence and Risk Factors Associated with Musculoskeletal Discomfort in Spay and Neuter Veterinarians. Animals (Basel). 2013;3(1):85–108. [DOI] [PMC free article] [PubMed] [Google Scholar]
- 22.Rogers M, Gangakhedkar S, Kaber D. Keeping Fido’s helpers healthy. Industrial Engineer. 2011;43(3):26–32. [Google Scholar]
- 23.Fowler HN, Holzbauer SM, Smith KE, Scheftel JM. Survey of occupational hazards in Minnesota veterinary practices in 2012. J Am Vet Med Assoc. 2016;248(2):207–18. [DOI] [PMC free article] [PubMed] [Google Scholar]
- 24.Nordgren LD, Gerberich SG, Alexander BH, Church TR, Bender JB, Ryan AD. Evaluation of factors associated with work-related injuries to veterinary technicians certified in Minnesota. J Am Vet Med Assoc. 2014;245(4):425–33. [DOI] [PubMed] [Google Scholar]
- 25.van Soest EM, Fritschi L. Occupational health risks in veterinary nursing: an exploratory study. Aust Vet J. 2004;82(6):346–50. [DOI] [PubMed] [Google Scholar]
- 26.Kuorinka I, Jonsson B, Kilbom A, Vinterberg H, Biering-Sørensen F, Andersson G, et al. Standardised Nordic questionnaires for the analysis of musculoskeletal symptoms. Appl Ergon. 1987;18(3):233–7. [DOI] [PubMed] [Google Scholar]
- 27.Keester DL, Sommerich CM. Investigation of musculoskeletal discomfort, work postures, and muscle activation among practicing tattoo artists. Appl Ergon. 2017;58:137–43. [DOI] [PubMed] [Google Scholar]
- 28.Sommerich CM. Ergonomics Assessment Methodology for Work-Worker Systems: Final Progress Report. Final Progress Report. Columbus, OH: The Ohio State University, 2004 National Institute for Occupational Safety and Health (NIOSH) Grant No.: K01 OH000169. [Google Scholar]
- 29.Kristensen TS, Hannerz H, Hogh A, Borg V. The Copenhagen Psychosocial Questionnaire--a tool for the assessment and improvement of the psychosocial work environment. Scand J Work Environ Health. 2005;31(6):438–49. [DOI] [PubMed] [Google Scholar]
- 30.Kristensen TS, Borritz M, Villadsen E, Christensen KB. The Copenhagen Burnout Inventory: a new tool for the assessment of burnout. Work & Stress. 2005;19(3):192–207. [Google Scholar]
- 31.Caplan RD, Cobb S, French JRP Jr., Van Harrison R, Pinneau SR Jr.. Job Demand and Worker Health: Main effects and occupational differences. US Department of Health, Education, and Welfare; Public Health Service; Center for Disease Control; National Institute for Occupational Safety and Health, 1975. April. Report No.: HEW Publication No. (NIOSH) 75–160. [Google Scholar]
- 32.Haims MC. A Longitudinal Study of the Process and Content of a Participatory Work Organization Intervention [Dissertation]: University of Wiscosin-Madison; 1999. [Google Scholar]
- 33.Quinn R, Seashore S, Kahn R, Mangione T, Campbell D, Staines G, et al. Survey of Working Conditions: Final Report on Univariate and Bivariate Tables. Washington, DC: US Government Printing Office, 1971. [Google Scholar]
- 34.Gentzler M, Stader S. Posture stress on firefighters and emergency medical technicians (EMTs) associated with repetitive reaching, bending, lifting, and pulling tasks. Work. 2010;37(3):227–39. [DOI] [PubMed] [Google Scholar]
- 35.Carneiro P, Martins J, Torres M. Musculoskeletal disorder risk assessment in home care nurses. Work. 2015;51(4):657–65. [DOI] [PubMed] [Google Scholar]
- 36.Ratzon NZ, Bar-Niv NA, Froom P. The effect of a structured personalized ergonomic intervention program for hospital nurses with reported musculoskeletal pain: An assigned randomized control trial. Work. 2016;54(2):367–77. [DOI] [PubMed] [Google Scholar]
- 37.Asgharia E, Dianatb I, Abdollahzadehc F, Mohammadid F, Asgharie P, Jafarabadif MA, et al. Musculoskeletal pain in operating room nurses: Associations with quality of work life, working posture, socio-demographic and job characteristics. International Journal of Industrial Ergonomics. 2019;72:330–7. [Google Scholar]
- 38.Nino L, Marchak F, Claudio D. Physical and mental workload interactions in a sterile processing department. International Journal of Industrial Ergonomics. 2020;76:102902. [Google Scholar]
- 39.McAtamney L, Hignett S. Rapid Entire Body Assessment. In: Stanton M, Hedge A, Brookhuis K, Salas E, Hendrick H, editors. Handbook of Human Factors and Ergonomics Methods. Boca Raton: CRC Press; 2005. p. 8: 1–11. [Google Scholar]
- 40.Mokarami H, Varmazyar S, Kazemi R, Taghavi SM, Stallones L, Marioryad H, et al. Low cost ergonomic interventions to reduce risk factors for work related musculoskeletal disorders during dairy farming. Work. 2019;64(2):195–201. [DOI] [PubMed] [Google Scholar]
- 41.American Veterinary Medical Association. Market research statistics: U.S. veterinarians 2018. https://www.avma.org/resources-tools/reports-statistics/market-research-statistics-us-veterinarians-2018 2018 [20 Aug. 2020].
- 42.National Association of Veterinary Technicians in America. NAVTA Demographic Survey Results. https://cdn.ymaws.com/www.navta.net/resource/resmgr/docs/2016_demographic_results.pdf: 2016.
- 43.LaFayette B, Buser SA. Economics and Social Impacts of Veterinary Medicine in Ohio. The Ohio State University College of Veterinary Medicine and the Ohio Veterinary Medical Association, 2017.
- 44.Hignett S, McAtamney L. Rapid entire body assessment (REBA). Appl Ergon. 2000;31(2):201–5. [DOI] [PubMed] [Google Scholar]
- 45.Treaster DE, Burr D. Gender differences in prevalence of upper extremity musculoskeletal disorders. Ergonomics. 2004;47(5):495–526. [DOI] [PubMed] [Google Scholar]
- 46.Table R98. Nonfatal Occupational Injuries and Illnesses Requiring Days Away From Work [Internet]. 2015. [cited 26 July 2018]. Available from: https://www.bls.gov/iif/.
- 47.Deacon RE, Brough P. Veterinary nurses’ psychological well-being: The impact of patient suffering and death. Australian Journal of Psychology. 2017;69:77–85. [Google Scholar]
- 48.Hatch PH, Winefield HR, Christie BA, Lievaart JJ. Workplace stress, mental health, and burnout of veterinarians in Australia. Aust Vet J. 2011;89(11):460–8. [DOI] [PubMed] [Google Scholar]
- 49.Fender KR. Merck study: Veterinarians have normal mental health but poor well-being. 2018 10 July 2018; 2018. Available from: https://www.dvm360.com/view/merck-study-veterinarians-have-normal-mental-health-poor-well-being.
- 50.MacDonald LA, Waters TR, Napolitano PG, Goddard DE, Ryan MA, Nielsen P, et al. Clinical guidelines for occupational lifting in pregnancy: evidence summary and provisional recommendations. Am J Obstet Gynecol. 2013;209(2):80–8. [DOI] [PMC free article] [PubMed] [Google Scholar]
- 51.Ergan M, Baskurt F, Baskurt Z. The examination of work-related musculoskeletal discomforts and risk factors in veterinarians. Arh Hig Rada Toksikol. 2017;68(3):198–205. [DOI] [PubMed] [Google Scholar]
- 52.Bridger RS. Introduction to Human Factors and Ergonomics. 4th ed: CRC Press; 2018. [Google Scholar]
- 53.Cham R, Redfern MS. Effect of flooring on standing comfort and fatigue. Hum Factors. 2001;43(3):381–91. [DOI] [PubMed] [Google Scholar]
- 54.Xu H, Jampala S, Bloswick D, Zhao J, Merryweather A. Evaluation of knee joint forces during kneeling work with different kneepads. Appl Ergon. 2017;58:308–13. [DOI] [PubMed] [Google Scholar]
- 55.Lindegard A, Gustafsson M, Hansson GA. Effects of prismatic glasses including optometric correction on head and neck kinematics, perceived exertion and comfort during dental work in the oral cavity--a randomised controlled intervention. Appl Ergon. 2012;43(1):246–53. [DOI] [PubMed] [Google Scholar]
- 56.Lindegard A, Nordander C, Jacobsson H, Arvidsson I. Opting to wear prismatic spectacles was associated with reduced neck pain in dental personnel: a longitudinal cohort study. BMC musculoskeletal disorders. 2016;17:347. [DOI] [PMC free article] [PubMed] [Google Scholar]